
Assessment and Spatial-Temporal Evolution Analysis of Land Use Conflict within Urban Spatial Zoning: Case of the Su-Xi-Chang Region


Abstract
1. Introduction
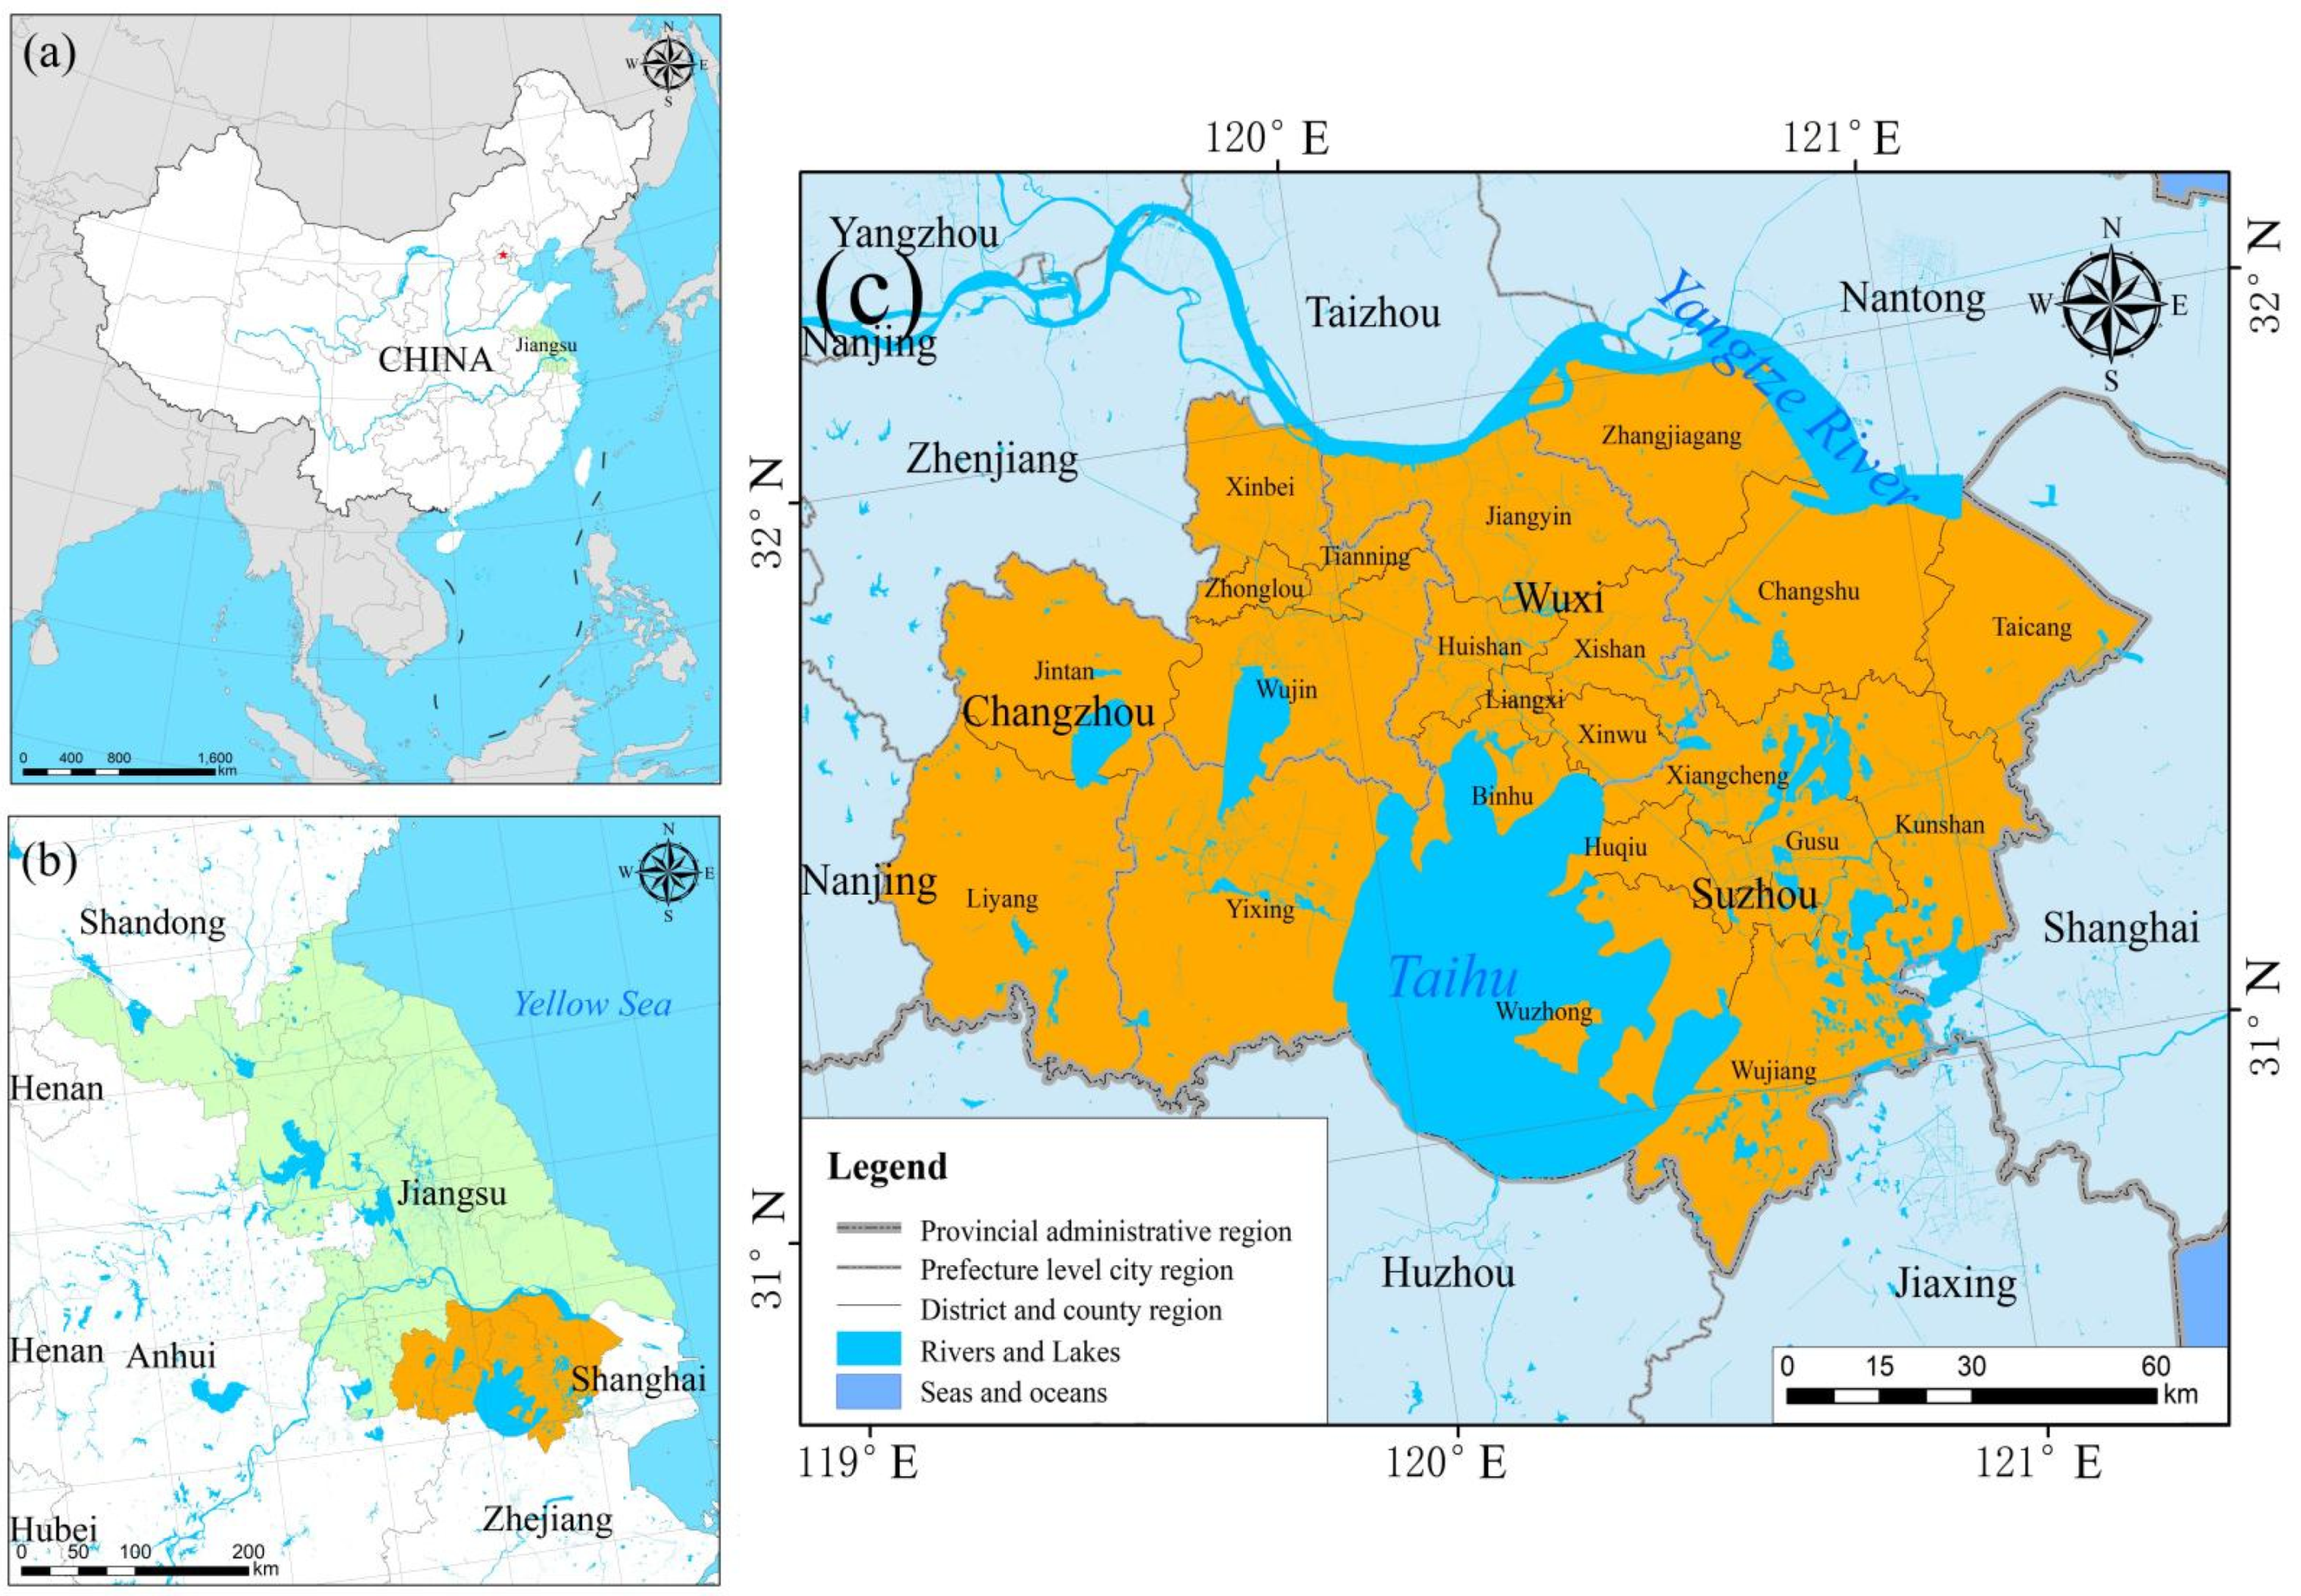
2. The Study Area
3. Materials and Methods
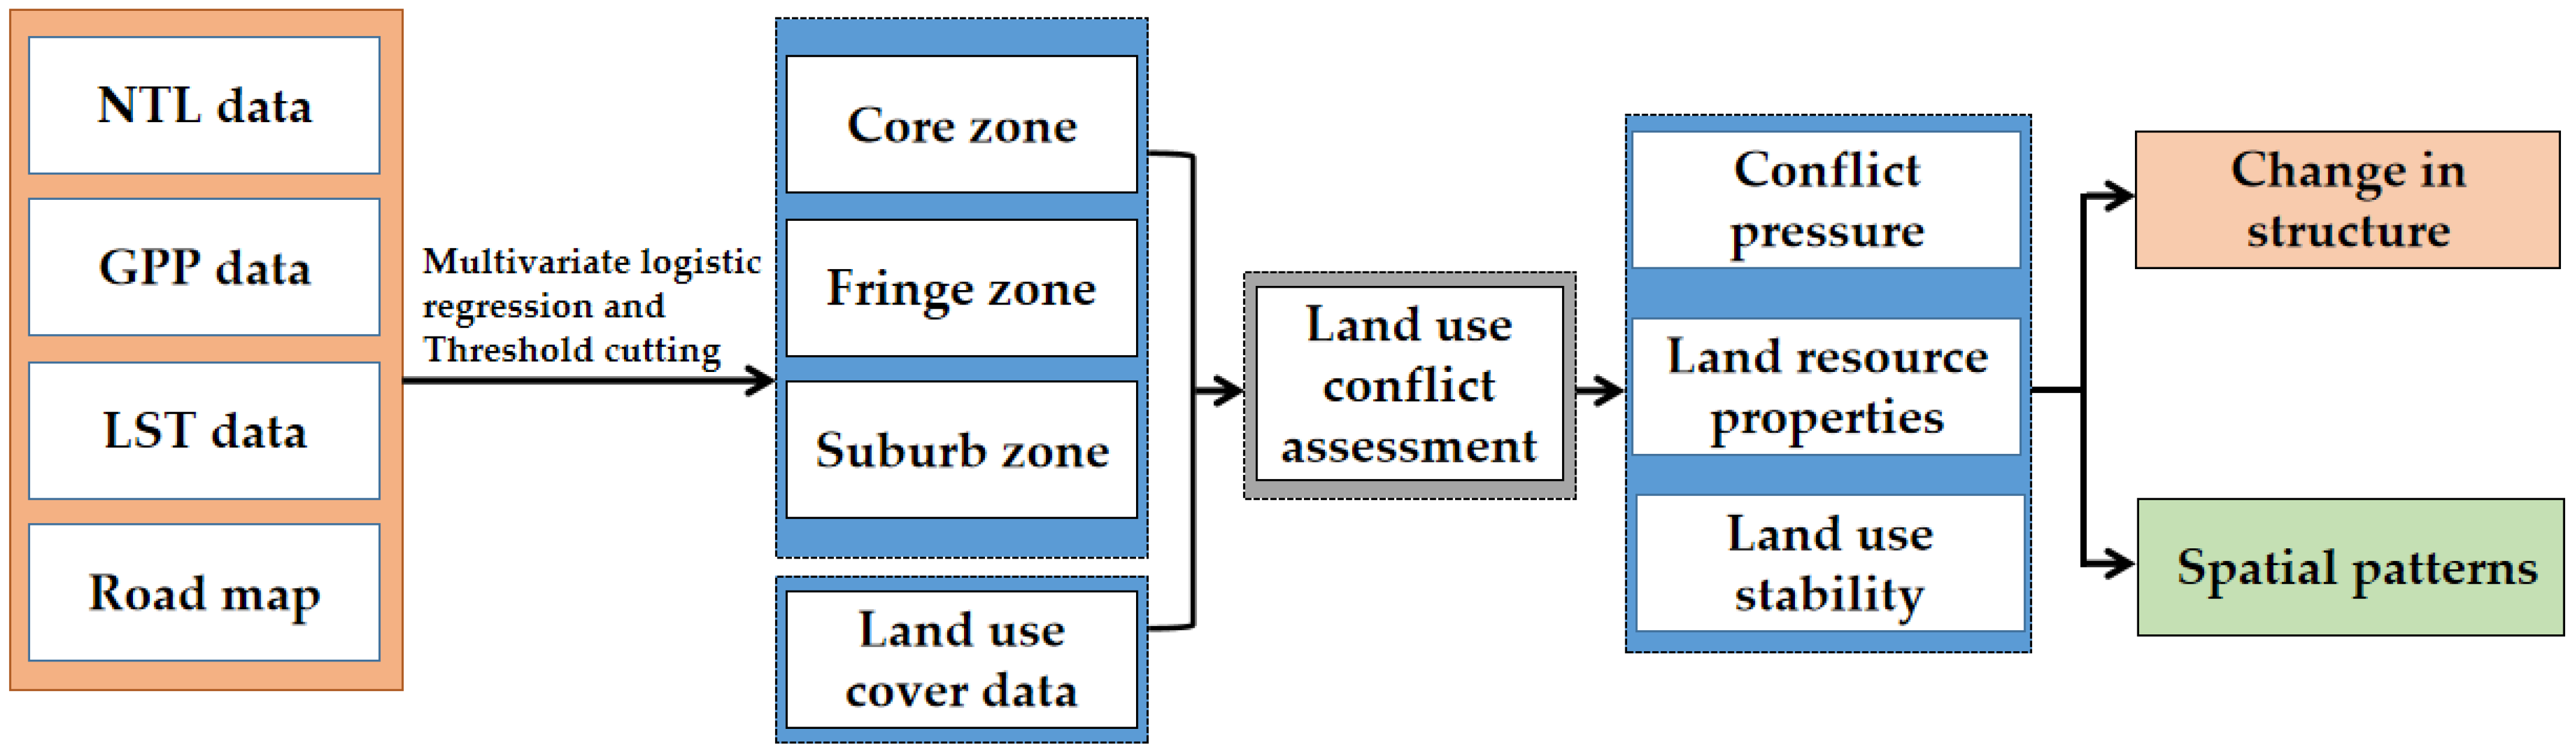
3.1. Research Framework
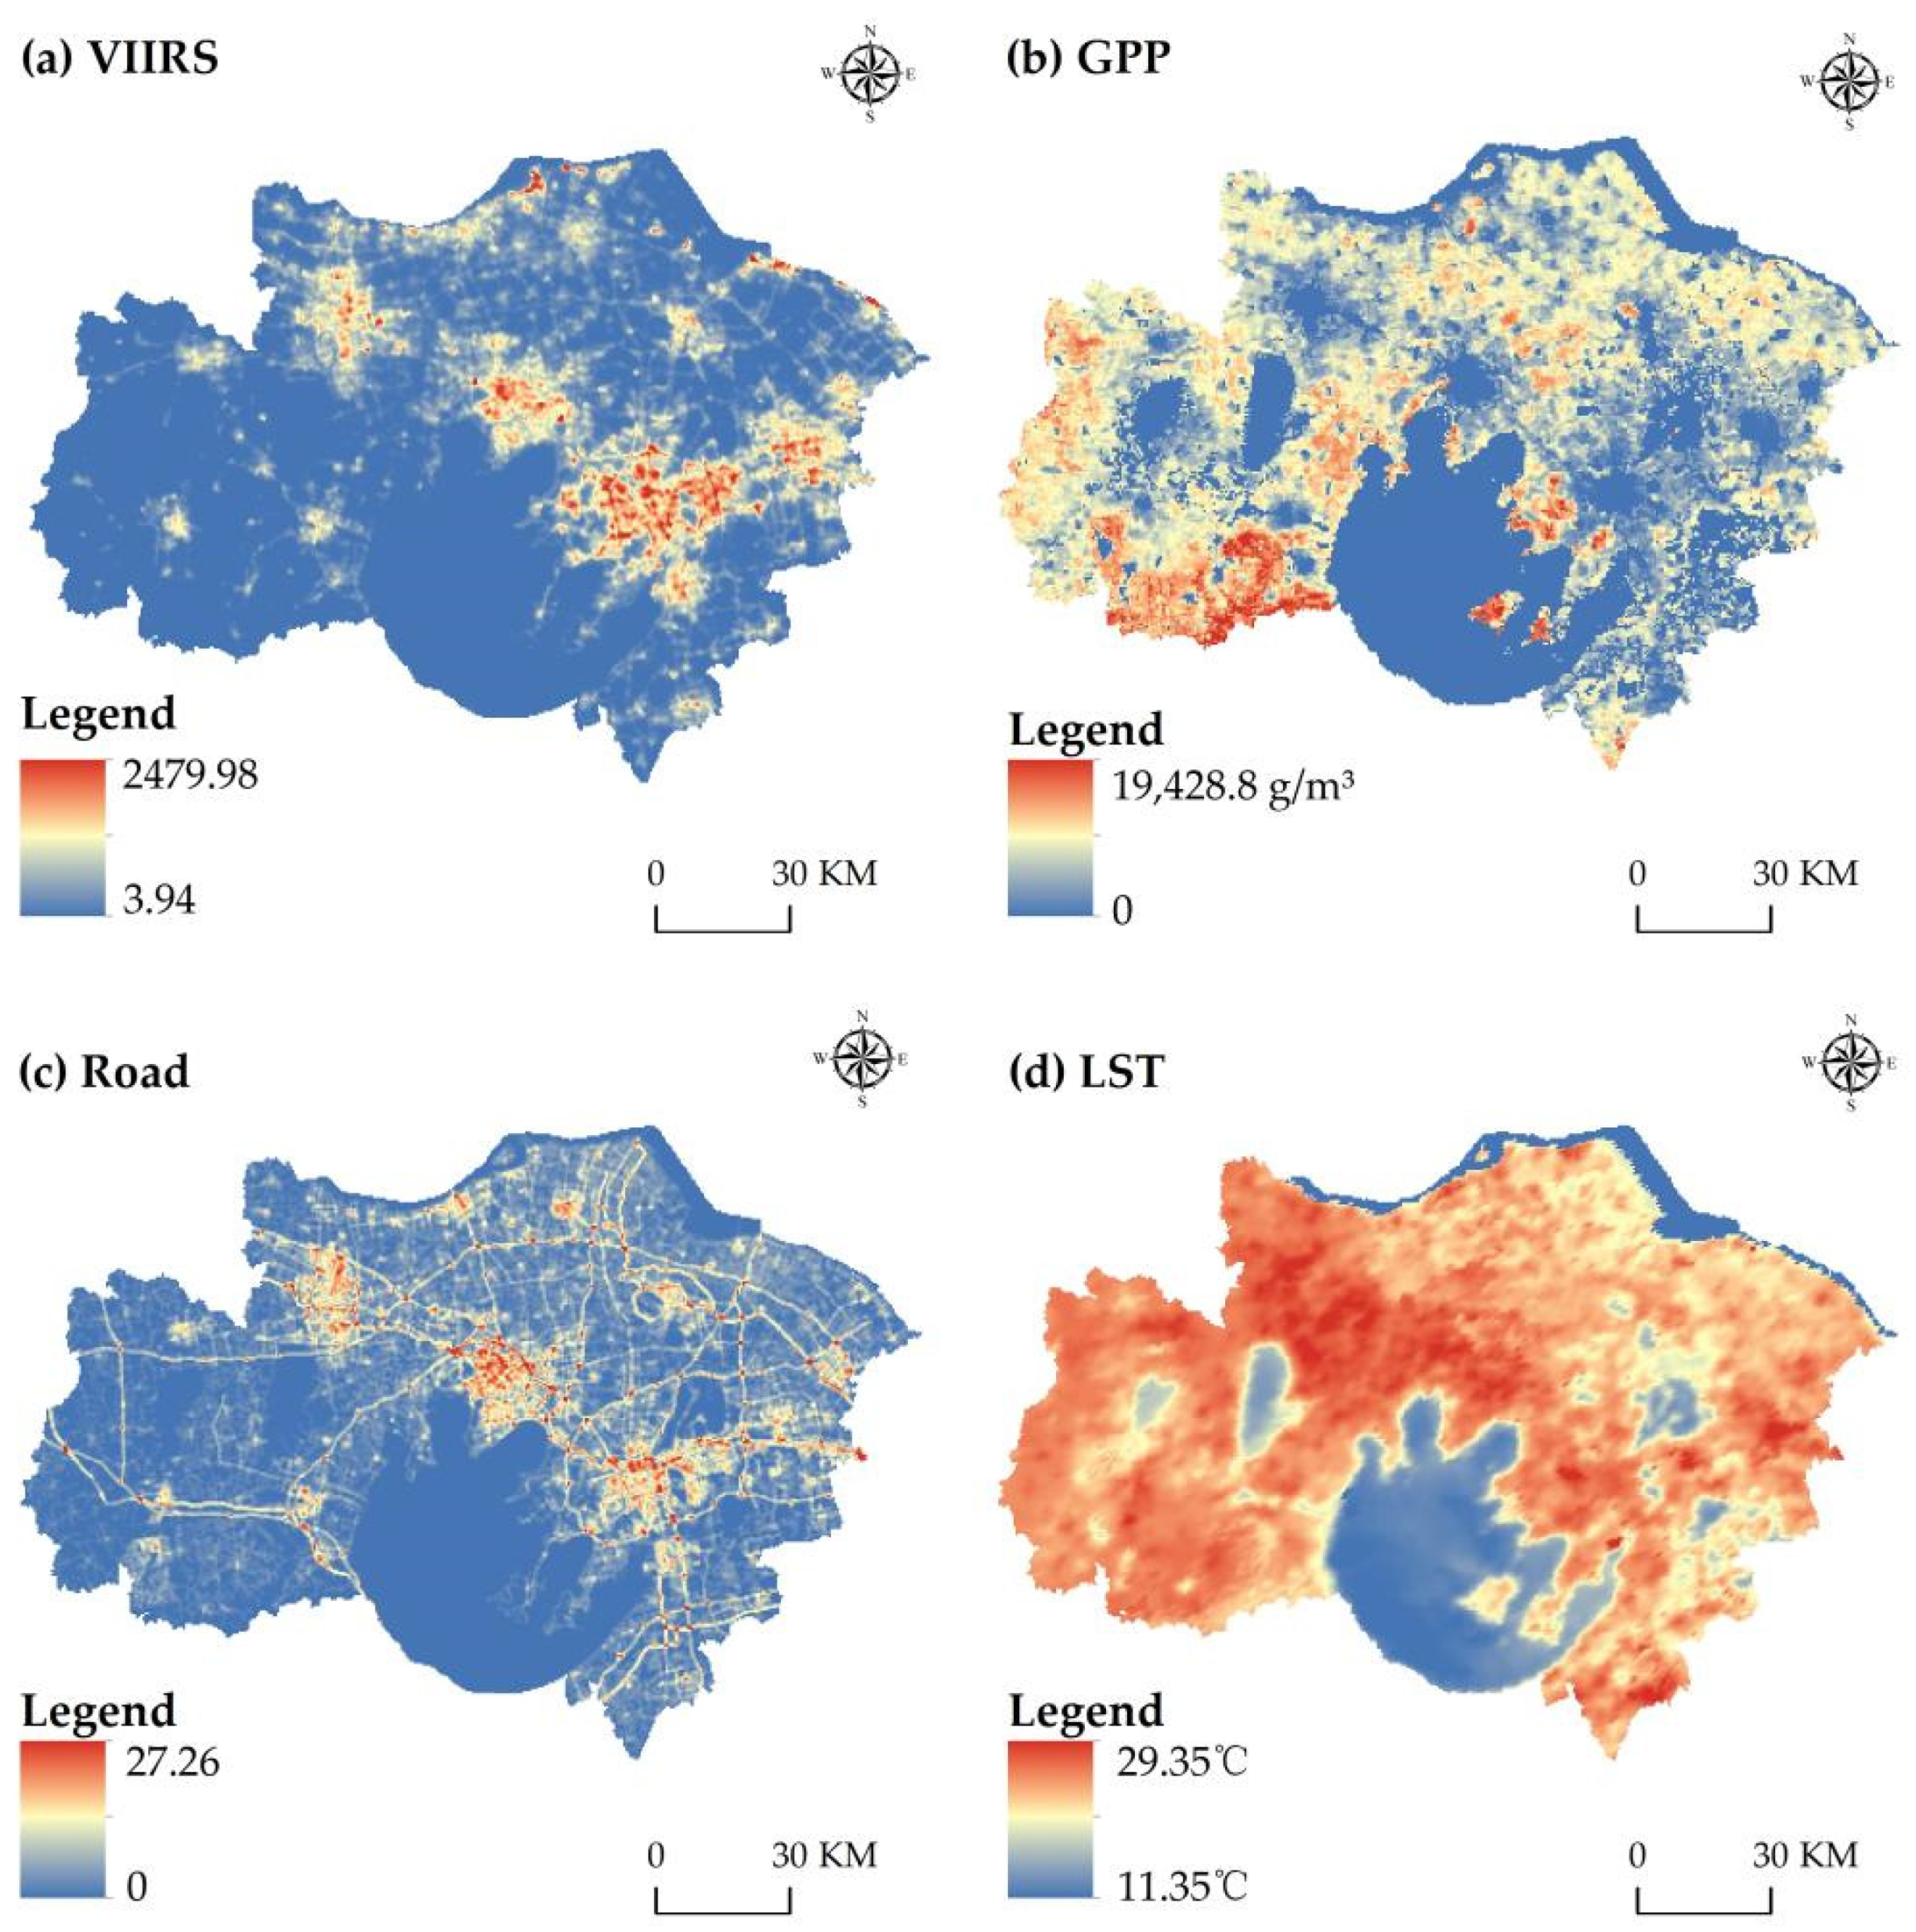
3.2. Data Collection and Preprocessing
3.3. Multivariate Logistic Regression
3.4. Measuring Land Use Conflicts
4. Results
4.1. Spatial Zoning in the Su–Xi–Chang Region
4.1.1. The Collate Partitioned Data
4.1.2. Spatial Zoning of the Su–Xi–Chang Region
4.1.3. Model Accuracy of Spatial Zoning
4.2. Spatiotemporal Characteristics of the Land Use Conflict
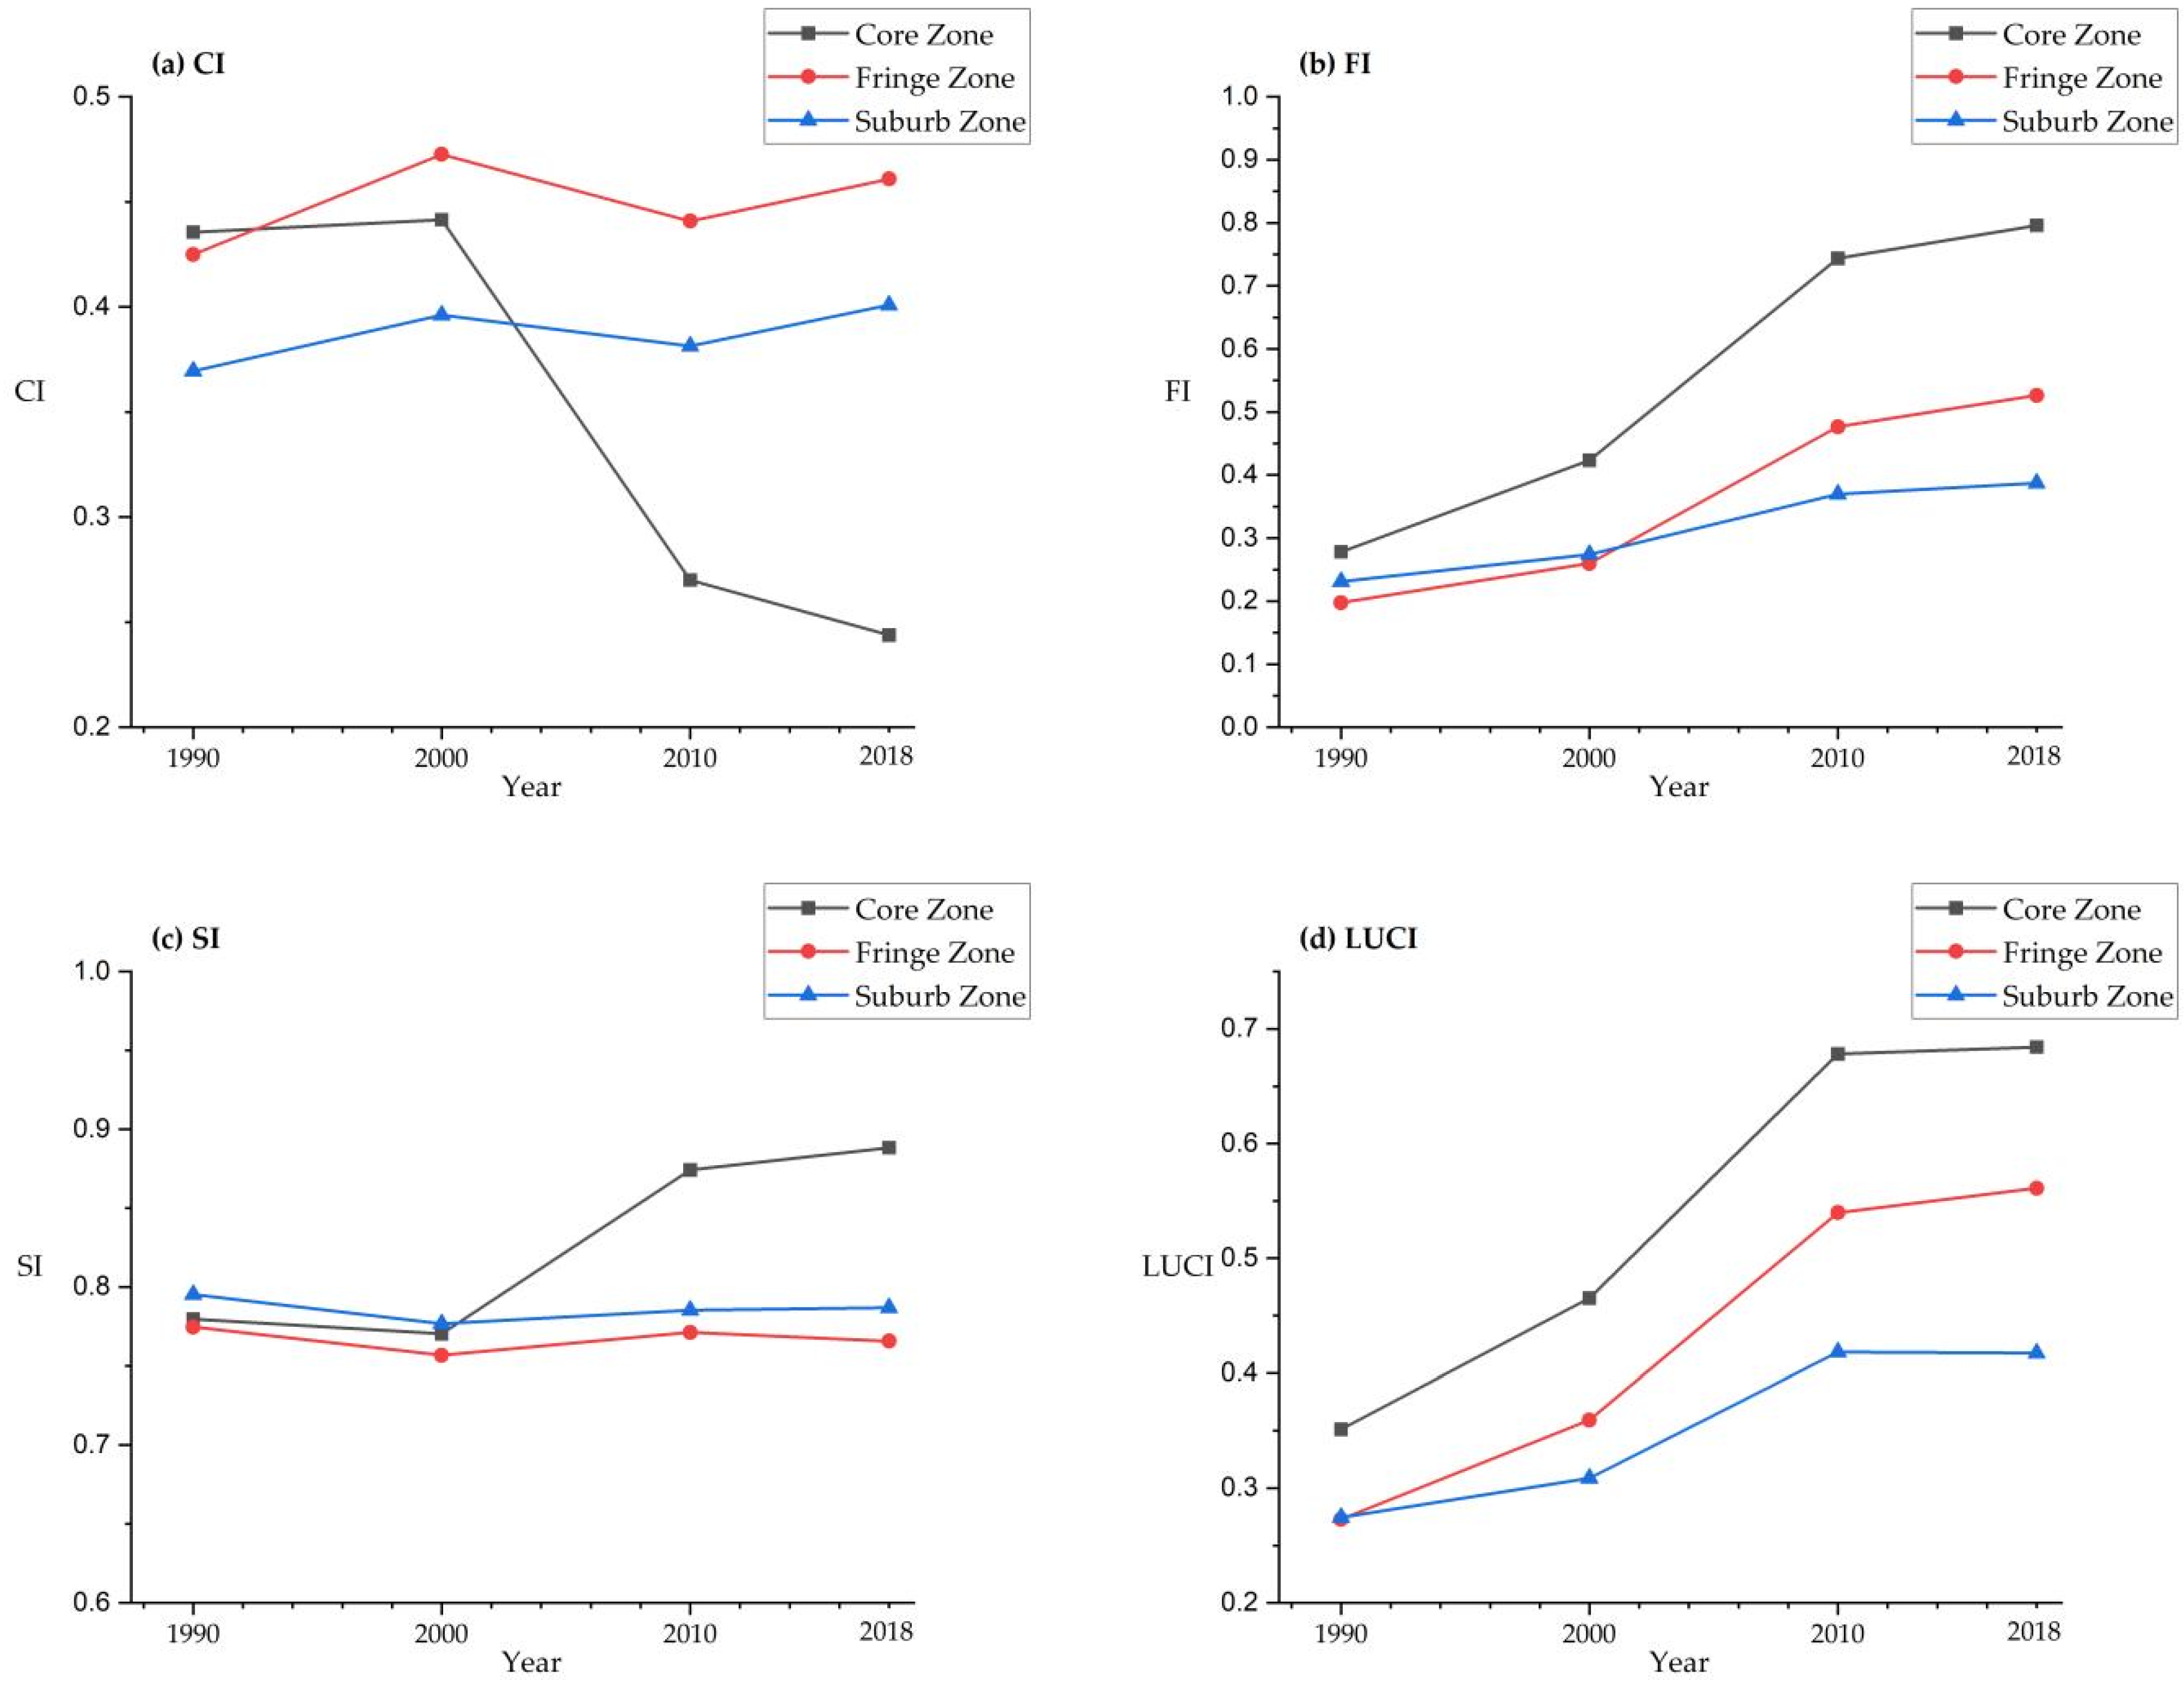
4.2.1. Changes in the Structure of the Land Use Conflict
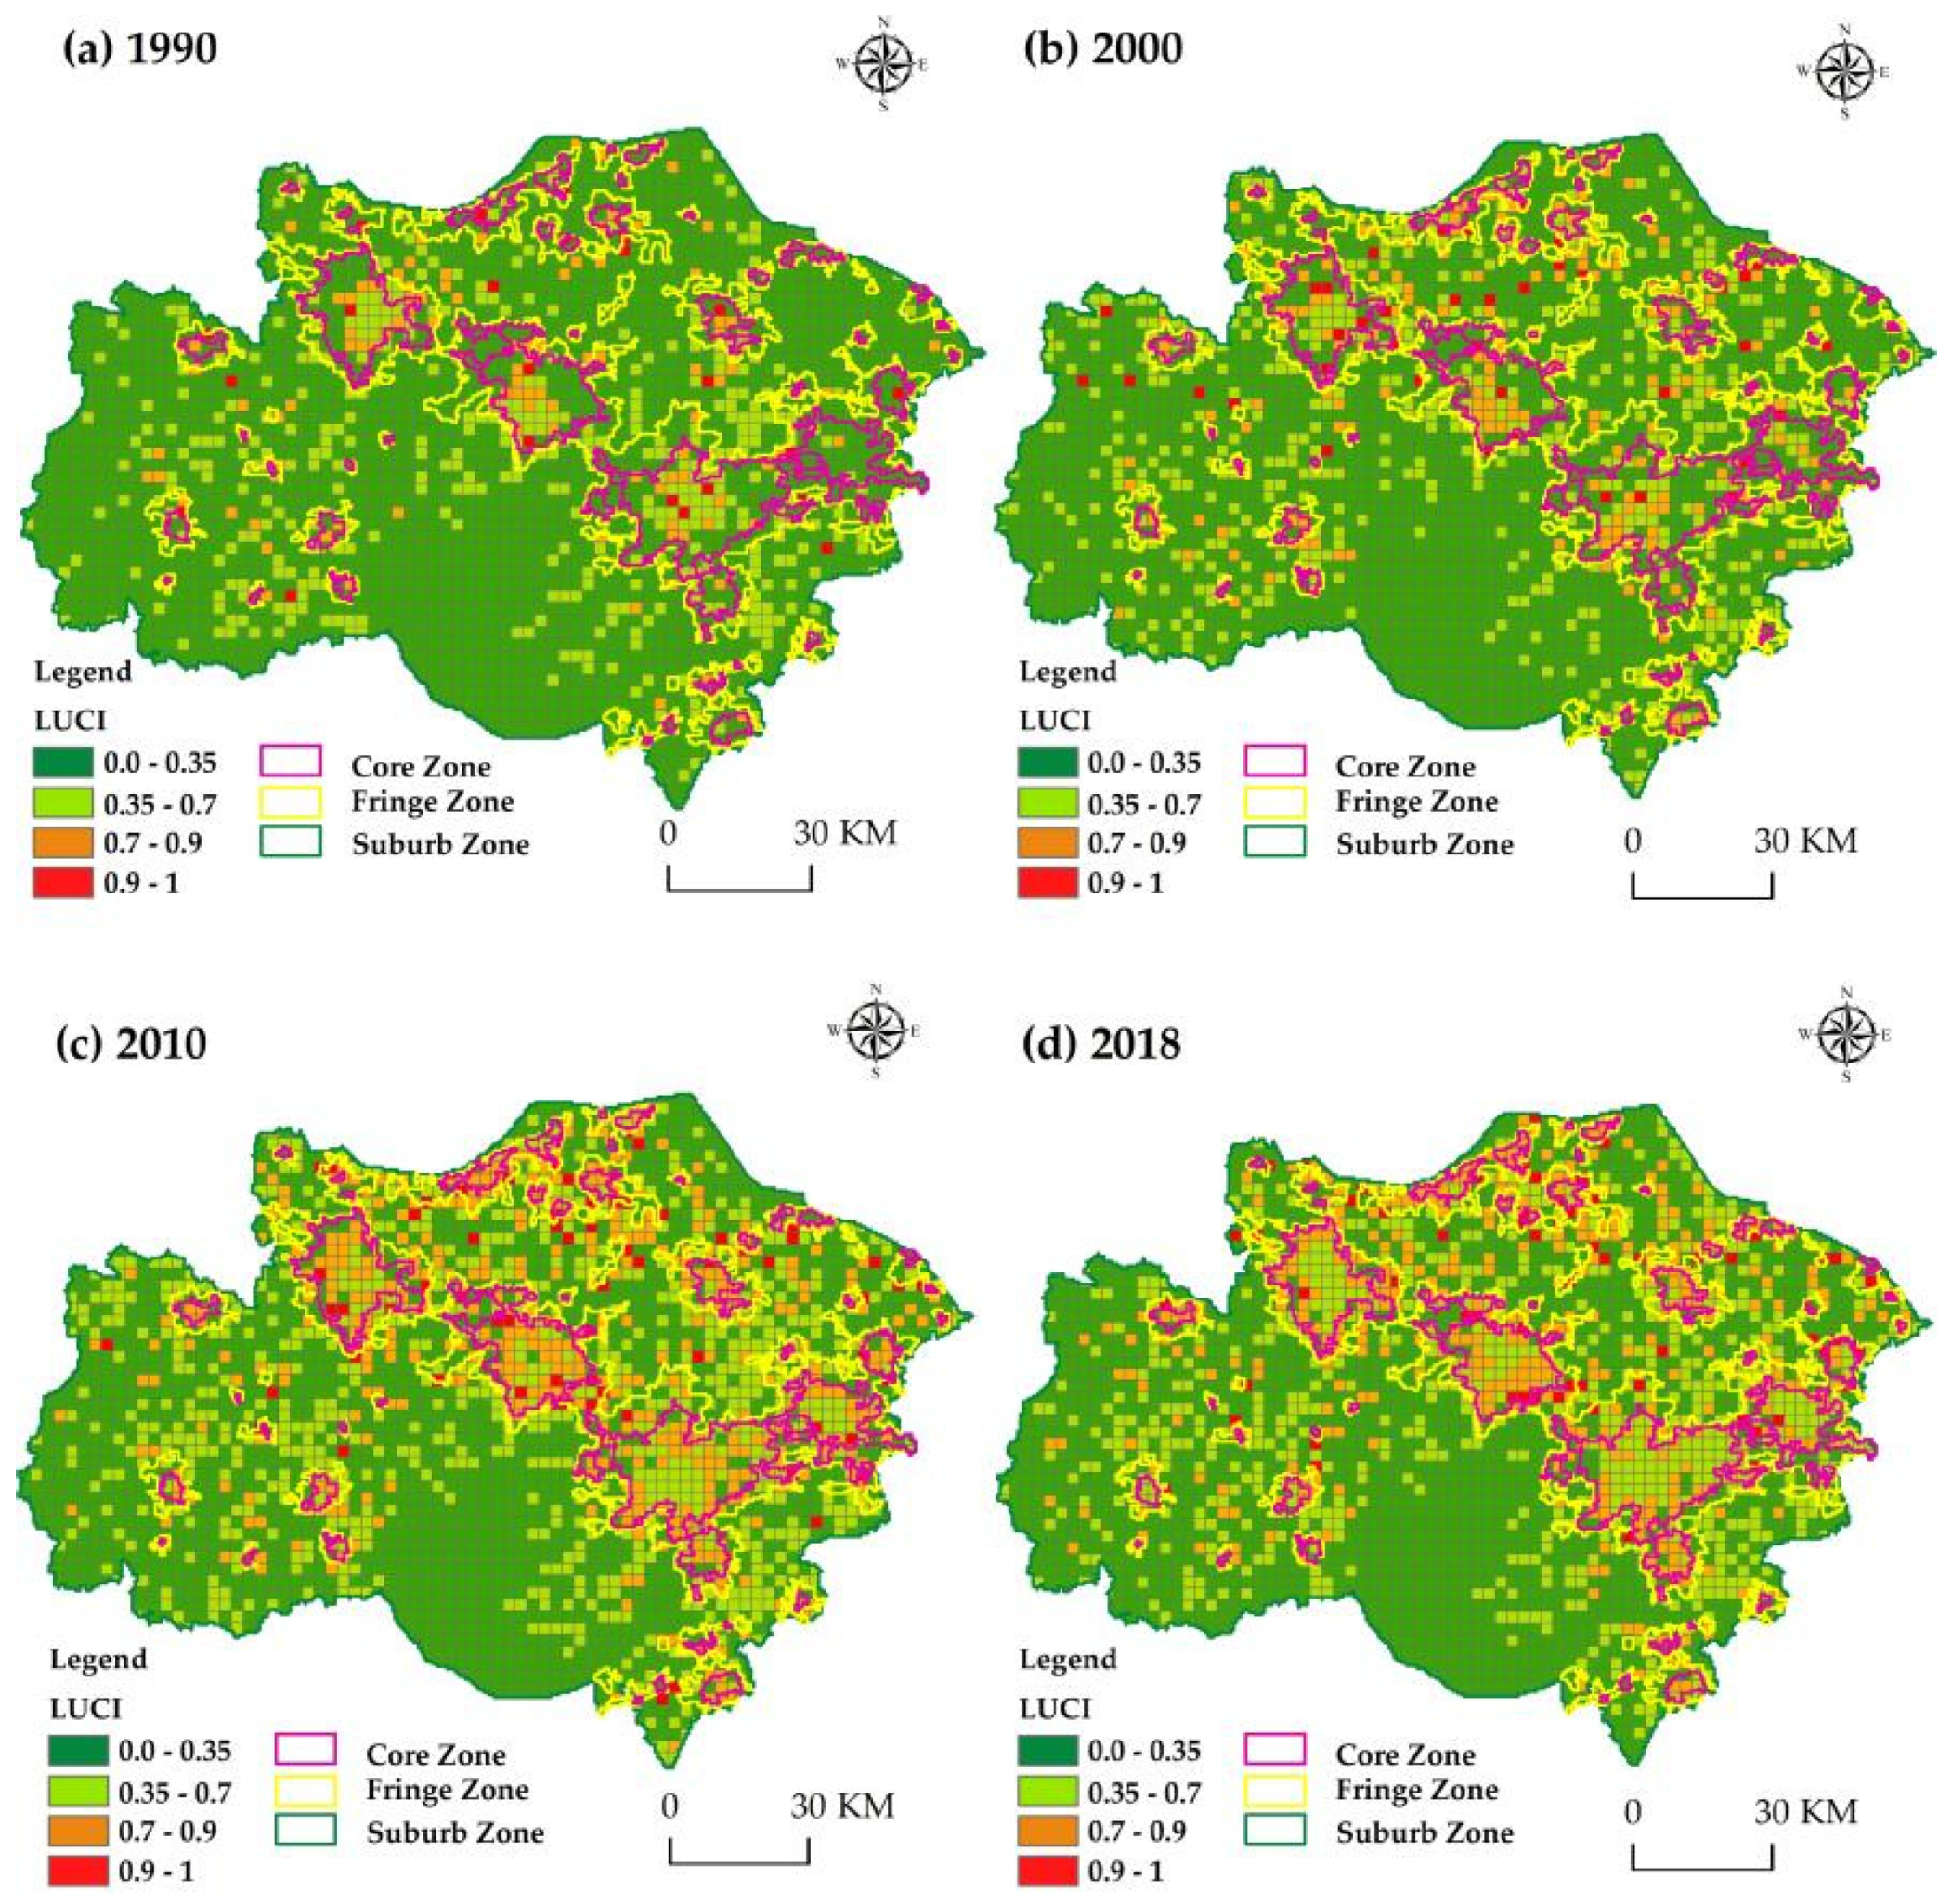
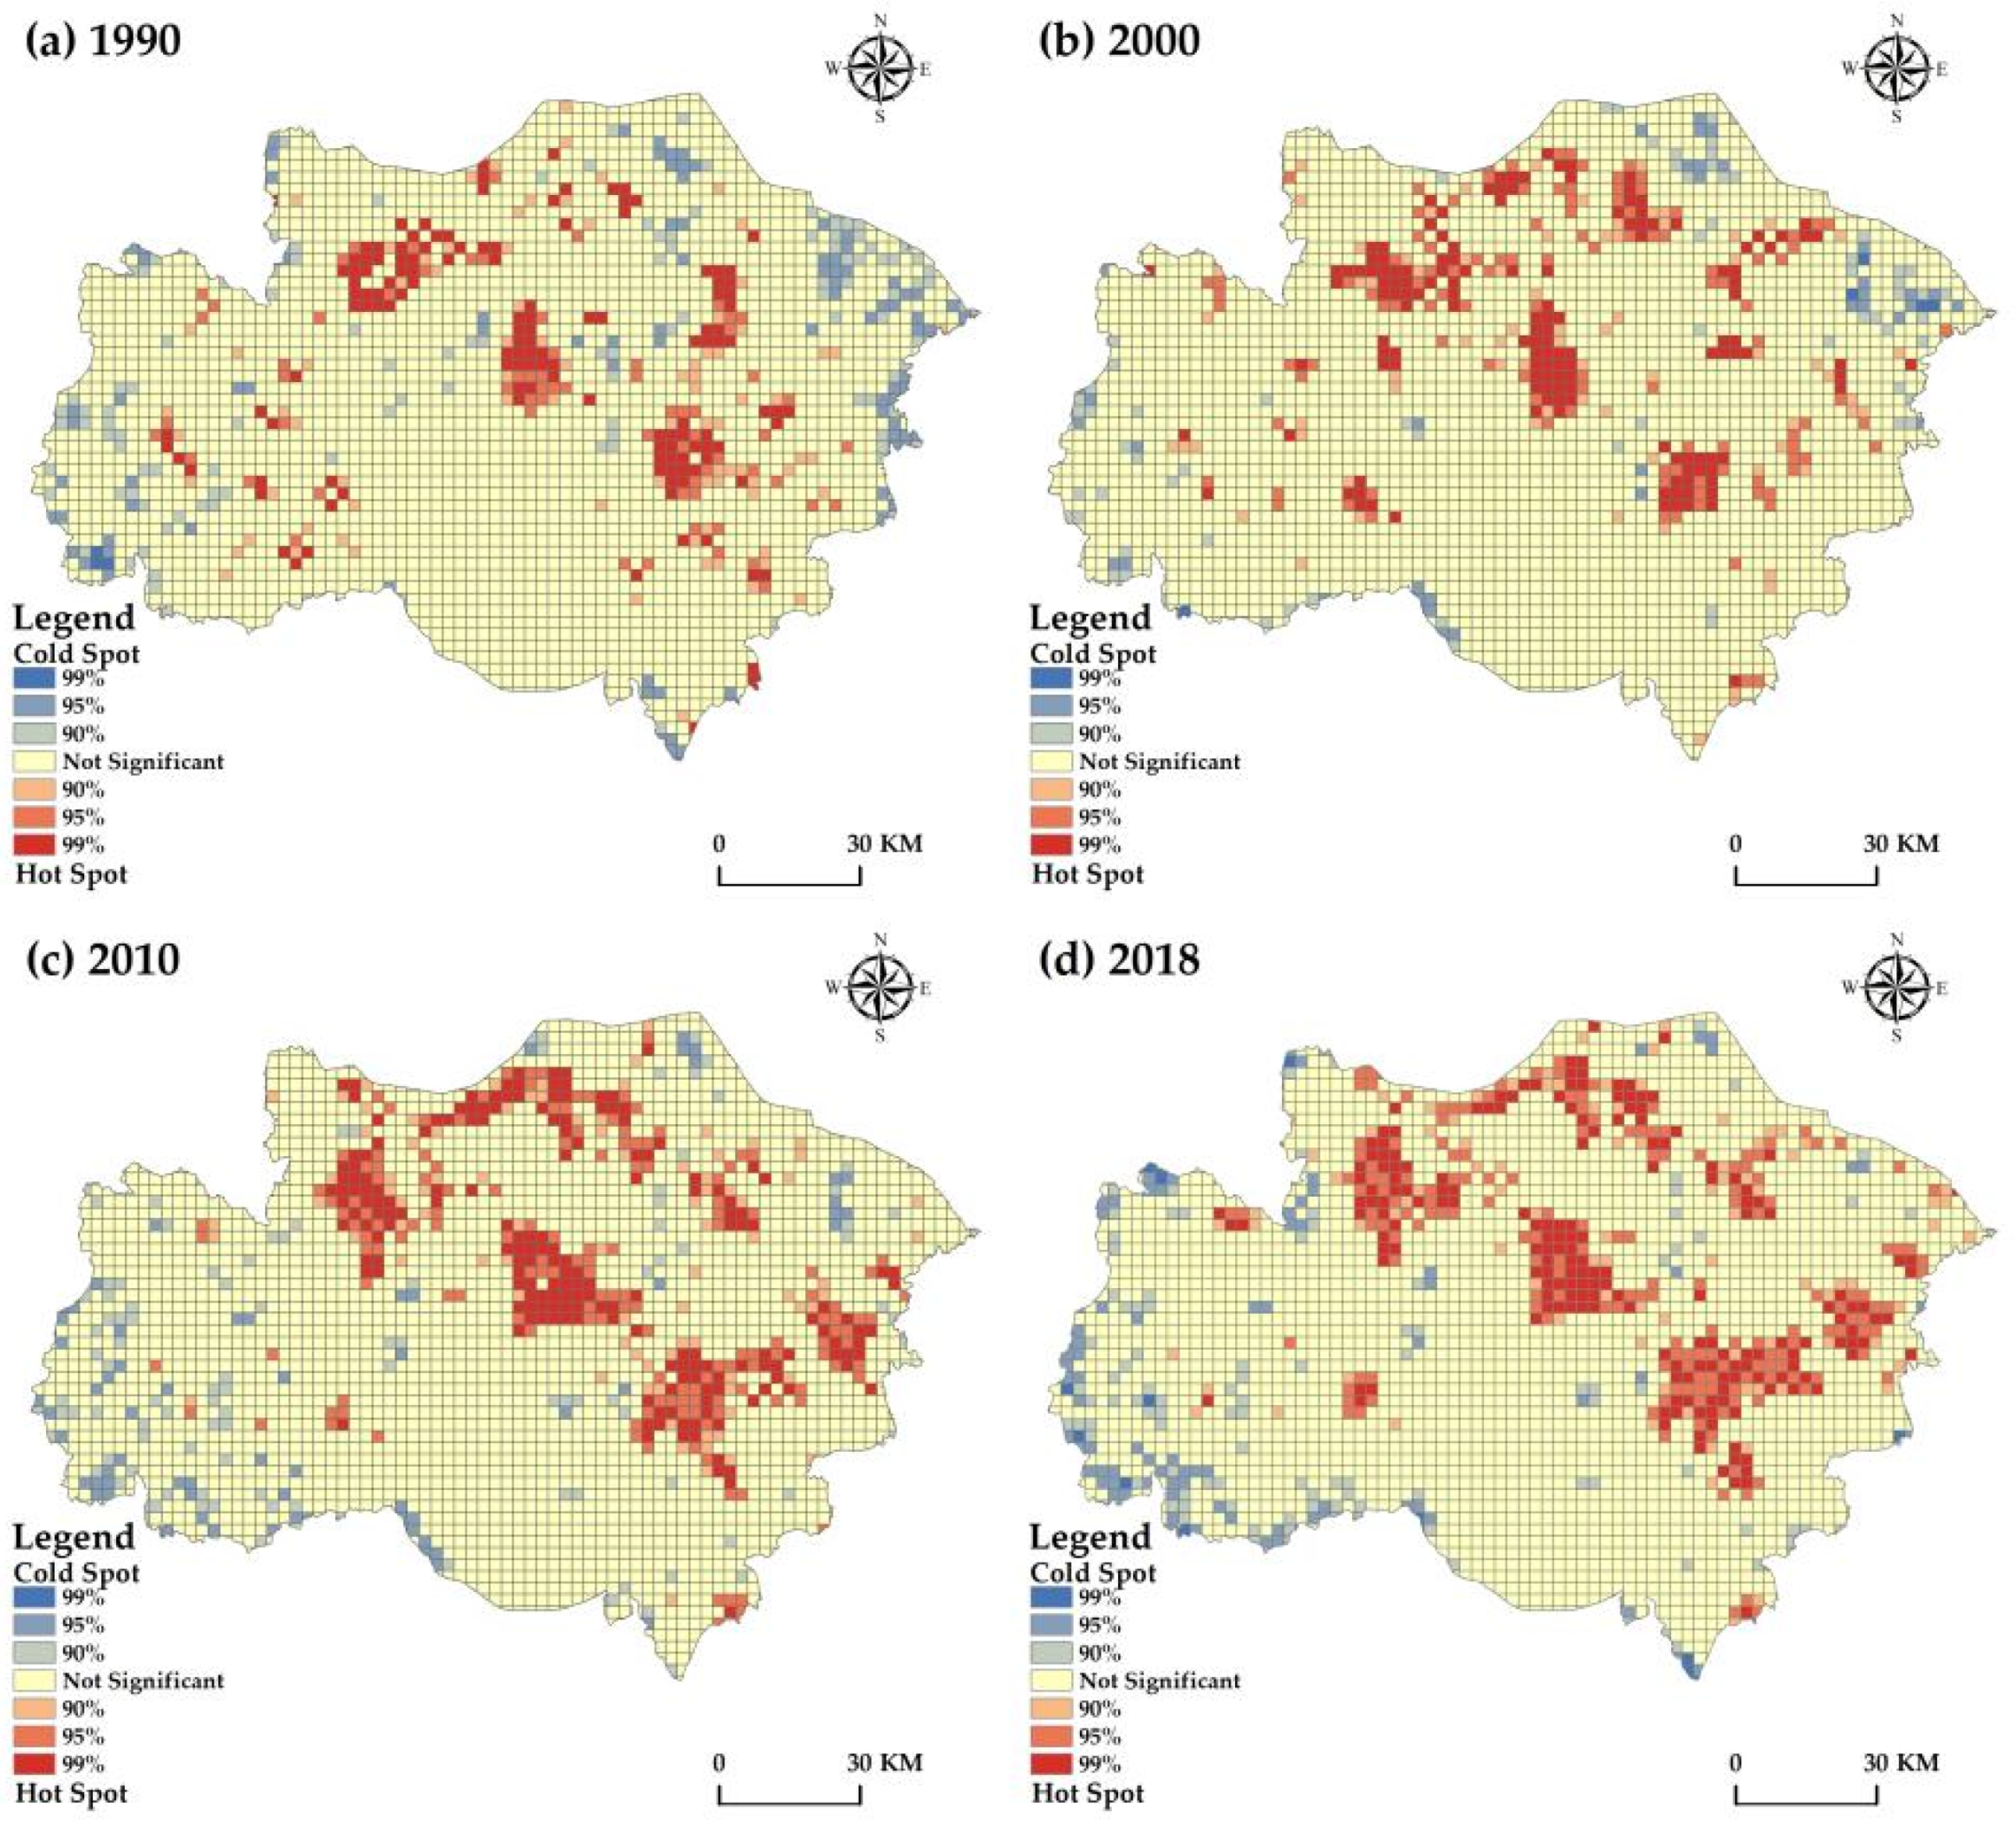
4.2.2. Spatial Patterns of the Land Use Conflict
5. Discussion
5.1. Analysis of the Results of the LUCI in the Su–Xi–Chang Region
5.2. Limitations and Prospects
6. Conclusions and Policy Implications
- (1)
- Considering that land use competition is fierce, the rapid urban expansion and frequent changes in land use patterns, such as cultivated land, forests, and grassland, are more likely to cause landscape fragmentation in the fringe zone and surrounding areas of central cities with fragile ecological environments (Wujiang, South of Wuxi City and Huishan). Measures related to the cultivated and forest land protection such as the Grain for Green Project and cropland held-replenish balance should be strictly implemented to improve the carrying capacity of the environment. Likewise, later monitoring and management are crucial for the maintenance of ecological restoration achievements due to the rapid expansion of urban construction land.
- (2)
- In the core zone that features a higher level of economic development and urbanization, construction land has high comparative advantage over cultivated and ecological ones due to the development stage of China. Therefore, it is necessary to delineate the boundary line of urban development so as to reasonably control the extent of urban expansion.
- (3)
- At the same time, reasonably controlling the boundary of urban space expansion and optimizing the population structure can give autonomy to the powerful driving effect of talents to the economy instead the overuse of natural resources.
- (4)
- In the suburban zone, the areas with intense and severe conflict levels are widespread and fragmented due to the high spatial competition between cultivated land and forests or grassland and rapid urban expansion. Our results could well serve the national strategy to better coordinate the ecological, production, and urban spaces through rational division of the basic farmland protection line, urban development boundary, and the ecological protection red line [58]. For ecological lands such as forests, grassland, and water, which have lower competition than other production lands, it is necessary to prevent their use as cultivated and construction lands in order to maintain their ecosystem structure and functions.
Author Contributions
Funding
Institutional Review Board Statement
Informed Consent Statement
Data Availability Statement
Acknowledgments
Conflicts of Interest
References
- Bao, W.; Yang, Y.; Zou, L. How to reconcile land use conflicts in mega urban agglomeration? A scenario-based study in the Beijing-Tianjin-Hebei region, China. J. Environ. Manag. 2021, 296, 113168. [Google Scholar] [CrossRef] [PubMed]
- Reyes-Garcia, V.; Orta-Martinez, M.; Gueze, M.; Luz, A.C.; Paneque-Galvez, J.; Macia, M.J.; Pino, J.; Taps, B.S.T. Does participatory mapping increase conflicts? A randomized evaluation in the Bolivian Amazon. Appl. Geogr. 2012, 34, 650–658. [Google Scholar] [CrossRef]
- Reuveny, R.; Maxwell, J.W.; Davis, J. On conflict over natural resources. Ecol. Econ. 2011, 70, 698–712. [Google Scholar] [CrossRef]
- Yu, B.; Lyu, C. Analysis of land use conflict: Concepts and methods. Prog. Geogr. 2006, 3, 106–115. [Google Scholar]
- Ali, S.; Xu, H.; Ahmed, W.; Ahmad, N.; Solangi, Y.A. Metro design and heritage sustainability: Conflict analysis using attitude based on options in the graph model. Environ. Dev. Sustain. 2020, 22, 3839–3860. [Google Scholar] [CrossRef]
- Ali, S.; Xu, H.; Xu, P.; Zhao, S. The analysis of environmental conflict in Changzhou foreign language school using a hybrid game. Open Cybern. Syst. J. 2017, 11, 94–106. [Google Scholar] [CrossRef][Green Version]
- Zhou, G.; Peng, J. The evolutionary characteristics and impact effects of spatial conflicts: The case of Chang-Zhu-Tan urban agglomeration. Adv. Geogr. Sci. 2012, 31, 717–723. [Google Scholar]
- Jiang, S.; Meng, J.; Zhu, L.; Cheng, H. Spatial-temporal pattern of land use conflict in China and its multilevel driving mechanisms. Sci. Total Environ. 2021, 801, 149697. [Google Scholar] [CrossRef]
- Ma, X.; Tang, J. A review of the research on land use conflict in coastal zones based on CiteSpace atlas analysis. Urban Plan. Des. 2017, 11, 42–50. [Google Scholar]
- Zhou, D.; Lin, Z.; Lim, S.H. Spatial characteristics and risk factor identification for land use spatial conflicts in a rapid urbanization region in China. Environ. Monit. Assess. 2019, 191, 677. [Google Scholar]
- Calvert, K.; Mabee, W. More solar farms or more bioenergy crops? Mapping and assessing potential land-use conflicts among renewable energy technologies in eastern Ontario, Canada. Appl. Geogr. 2015, 56, 209–221. [Google Scholar] [CrossRef]
- Brown, G.; Raymond, C.M. Methods for identifying land use conflict potential using participatory mapping. Landsc. Urban Plan. 2014, 122, 196–208. [Google Scholar] [CrossRef]
- de Groot, R. Function-analysis and valuation as a tool to assess land use conflicts in planning for sustainable, multi-functional landscapes. Landsc. Urban Plan. 2006, 75, 175–186. [Google Scholar] [CrossRef]
- Torre, A.; Melot, R.; Magsi, H.; Bossuet, L.; Cadoret, A.; Caron, A.; Darly, S.; Jeanneaux, P.; Kirat, T.; Pham, H.V.; et al. Identifying and measuring land-use and proximity conflicts: Methods and identification. SpringerPlus 2014, 3, 85. [Google Scholar] [CrossRef] [PubMed]
- Adam, Y.O.; Pretzsch, J.; Darr, D. Land use conflicts in central Sudan: Perception and local coping mechanisms. Land Use Policy 2015, 42, 1–6. [Google Scholar] [CrossRef]
- Carr, D.L.; Suter, L.; Barbieri, A. Population Dynamics and Tropical Deforestation: State of the Debate and Conceptual Challenges. Popul. Environ. 2005, 27, 89–113. [Google Scholar] [CrossRef]
- Kim, I.; Arnhold, S. Mapping environmental land use conflict potentials and ecosystem services in agricultural watersheds. Sci. Total Environ. 2018, 630, 827–838. [Google Scholar] [CrossRef]
- Zou, L.; Liu, Y.; Wang, J.; Yang, Y.; Wang, Y. Land use conflict identification and sustainable development scenario simulation on China’s southeast coast. J. Clean. Prod. 2019, 238, 117899. [Google Scholar] [CrossRef]
- Pacheco, F.A.L.; Varandas, S.G.P.; Sanches Fernandes, L.F.; Valle Junior, R.F. Soil losses in rural watersheds with environmental land use conflicts. Sci. Total Environ. 2014, 485, 110–120. [Google Scholar] [CrossRef]
- Valle, R.F.; Varandas, S.G.P.; Sanches Fernandes, L.F.; Pacheco, F.A.L. Groundwater quality in rural watersheds with environmental land use conflicts. Sci. Total Environ. 2014, 493, 812–827. [Google Scholar] [CrossRef]
- Yang, Y.; An, Q.; Zhu, L. Diagnosis based on the PSR model of rural land-use conflicts intensity. Prog. Geogr. 2012, 31, 1552–1560. [Google Scholar]
- Peterseil, J.; Wrbka, T.; Plutzar, C.; Schmitzberger, I.; Kiss, A.; Szerencsits, E.; Reiter, K.; Schneider, W.; Suppan, F.; Beissmann, H. Evaluating the ecological sustainability of Austrian agricultural landscapes—the SINUS approach. Land Use Policy 2004, 21, 307–320. [Google Scholar] [CrossRef]
- Lin, G.; Jiang, D.; Fu, J.; Cao, C.; Zhang, D. Spatial Conflict of Production-Living-Ecological Space and Sustainable-Development Scenario Simulation in Yangtze River Delta Agglomerations. Sustainability 2020, 12, 2175. [Google Scholar] [CrossRef]
- Fang, C.; Yu, D. Urban agglomeration: An evolving concept of an emerging phenomenon. Landsc. Urban Plan. 2017, 162, 126–136. [Google Scholar] [CrossRef]
- Fu, Y.; Zhang, X. Mega urban agglomeration in the transformation era: Evolving theories, research typologies and governance. Cities 2020, 105, 102813. [Google Scholar] [CrossRef]
- Feng, R.; Wang, F.; Wang, K.; Xu, S. Quantifying influences of anthropogenic-natural factors on ecological land evolution in mega-urban agglomeration: A case study of Guangdong-Hong Kong-Macao greater Bay area. J. Clean. Prod. 2021, 283, 125304. [Google Scholar] [CrossRef]
- Henderson, S.R. Managing land-use conflict around urban centres: Australian poultry farmer attitudes towards relocation. Appl. Geogr. 2005, 25, 97–119. [Google Scholar] [CrossRef]
- Ma, Q.; He, C.; Wu, J. Behind the rapid expansion of urban impervious surfaces in China: Major influencing factors revealed by a hierarchical multiscale analysis. Land Use Policy 2016, 59, 434–445. [Google Scholar] [CrossRef]
- Tong, L.; Hu, S.; Frazier, A.E. Hierarchically measuring urban expansion in fast urbanizing regions using multi-dimensional metrics: A case of Wuhan metropolis, China. Habitat Int. 2019, 94, 102070. [Google Scholar] [CrossRef]
- Huang, X.; Xia, J.; Xiao, R.; He, T. Urban expansion patterns of 291 Chinese cities, 1990–2015. Int. J. Digit. Earth 2019, 12, 62–77. [Google Scholar] [CrossRef]
- Fu, Q.; Xu, L.; Zheng, H.; Chen, J. Spatiotemporal Dynamics of Carbon Storage in Response to Urbanization: A Case Study in the Su-Xi-Chang Region, China. Processes 2019, 7, 836. [Google Scholar] [CrossRef]
- Feng, Y.; Li, H.; Tong, X.; Chen, L.; Liu, Y. Projection of land surface temperature considering the effects of future land change in the Taihu Lake Basin of China. Glob. Planet Change 2018, 167, 24–34. [Google Scholar] [CrossRef]
- Yirsaw, E.; Wu, W.; Shi, X.; Temesgen, H.; Bekele, B. Land Use/Land Cover Change Modeling and the Prediction of Subsequent Changes in Ecosystem Service Values in a Coastal Area of China, the Su-Xi-Chang Region. Sustainability 2017, 9, 1204. [Google Scholar] [CrossRef]
- Bu, J.; Sun, Z.; Ma, R.; Liu, Y.; Gong, X.; Pan, Z.; Wei, W. Shallow Groundwater Quality and Its Controlling Factors in the Su-Xi-Chang Region, Eastern China. Int. J. Environ. Res. Public Health 2020, 17, 1267. [Google Scholar] [CrossRef] [PubMed]
- Liu, J.; Kuang, W.; Zhang, Z.; Xu, X.; Qin, Y.; Ning, J.; Zhou, W.; Zhang, S.; Li, R.; Yan, C.; et al. Spatiotemporal characteristics, patterns, and causes of land-use changes in China since the late 1980s. J. Geogr. Sci. 2014, 24, 195–210. [Google Scholar] [CrossRef]
- Li, D.; Xu, E.; Zhang, H. Influence of ecological land change on wind erosion prevention service in arid area of northwest China from 1990 to 2015. Ecol. Indic. 2020, 117, 106686. [Google Scholar] [CrossRef]
- Ning, J.; Liu, J.; Zhao, G. Spatio-temporal characteristics of disturbance of land use change on major ecosystem function zones in China. Chin. Geogr. Sci. 2015, 25, 523–536. [Google Scholar] [CrossRef]
- Zhong, Y.; Lin, A.; He, L.; Zhou, Z.; Yuan, M. Spatiotemporal Dynamics and Driving Forces of Urban Land-Use Expansion: A Case Study of the Yangtze River Economic Belt, China. Remote Sens. 2020, 12, 287. [Google Scholar] [CrossRef]
- Xu, Q.; Zheng, X.; Zhang, C. Quantitative Analysis of the Determinants Influencing Urban Expansion: A Case Study in Beijing, China. Sustainability 2018, 10, 1630. [Google Scholar] [CrossRef]
- Dubovyk, O.; Sliuzas, R.; Flacke, J. Spatio-temporal modelling of informal settlement development in Sancaktepe district, Istanbul, Turkey. ISPRS J. Photogramm. 2011, 66, 235–246. [Google Scholar] [CrossRef]
- Marondedze, A.K.; Schütt, B. Dynamics of Land Use and Land Cover Changes in Harare, Zimbabwe: A Case Study on the Linkage between Drivers and the Axis of Urban Expansion. Land 2019, 8, 155. [Google Scholar] [CrossRef]
- Lambin, E.F.; Meyfroidt, P. Global land use change, economic globalization, and the looming land scarcity. Proc. Natl. Acad. Sci. USA 2011, 108, 3465. [Google Scholar] [CrossRef] [PubMed]
- Fan, J.; Wang, Y.; Zhou, Z.; You, N.; Meng, J. Dynamic Ecological Risk Assessment and Management of Land Use in the Middle Reaches of the Heihe River Based on Landscape Patterns and Spatial Statistics. Sustainability 2016, 8, 536. [Google Scholar] [CrossRef]
- Song, Z.; Yu, L. A study on the generalised space of urban–rural integration in Beijing suburbs during the present day. Urban Stud. 2014, 52, 2581–2598. [Google Scholar] [CrossRef]
- Li, X.; Lu, L.; Cheng, G.; Xiao, H. Quantifying landscape structure of the Heihe River Basin, north-west China using FRAGSTATS. J. Arid. Environ. 2001, 48, 521–535. [Google Scholar] [CrossRef]
- Liao, L.; Dai, W.; Chen, J.; Huang, W.; Jiang, F.; Hu, Q. Spatial conflict between ecological-production-living spaces on Pingtan Island during rapid urbanization. Resour. Sci. 2017, 39, 1823–1833. [Google Scholar]
- Mo, W.; Wang, Y.; Zhang, Y.; Zhuang, D. Impacts of road network expansion on landscape ecological risk in a megacity, China: A case study of Beijing. Sci. Total Environ. 2017, 574, 1000–1011. [Google Scholar] [CrossRef]
- Asempah, M.; Sahwan, W.; Schütt, B. Assessment of Land Cover Dynamics and Drivers of Urban Expansion Using Geospatial and Logistic Regression Approach in Wa Municipality, Ghana. Land 2021, 10, 1251. [Google Scholar] [CrossRef]
- Zhao, J.; Luo, Z.; Zhao, Y.; Cao, L.; Ran, F.; Jiang, C. Diagnosis of the intensity of regional land use conflict based on improved grey target model:A case of nanchang city. Acta Agric. Univ. Jiangxiensis 2017, 39, 1256–1263. [Google Scholar]
- Zhou, D.; Xu, J.; Wang, L. Land use spatial conflicts and complexity: A case study of the urban agglomeration around Hangzhou Bay, China. Geogr. Res.-Aust. 2015, 34, 1630–1642. [Google Scholar]
- Moran, P.A.P. Notes on continuous stochastic phenomena. Biometrika 1950, 37, 17–23. [Google Scholar] [CrossRef] [PubMed]
- Ord, J.K.; Getis, A. Local Spatial Autocorrelation Statistics: Distributional Issues and an Application. Geogr. Anal. 1995, 27, 286–306. [Google Scholar] [CrossRef]
- Jiang, S.; Meng, J. Process of land use conflict research: Contents and methods. Arid Land Geogr. 2021, 44, 877–887. [Google Scholar]
- Peng, J.; Zhou, G.; Tang, C.; He, Y. The analysis of spatial conflict measurement in fast urbanization region based on ecological security: A case study of Changsha-Zhuzhou-Xiangtan urban agglomeration. J. Nat. Resour. 2012, 27, 1507–1519. [Google Scholar]
- Sadehvand, Z.; Jandaghi, G.; Fathi, M.R.; Azar, A. Designing and Explaining a Model for Agility in Official statistics Supply Chain Based on the Public Value Approach. Iran. J. Trade Stud. 2021, 25, 233–268. [Google Scholar]
- Safari, H.; Etezadi, S.; Moradi-Moghadam, M.; Fathi, M.R. Maturity evaluation of supply chain procedures by combining SCOR and PST models. Int. J. Process Manag. Benchmarking 2021, 11, 707–724. [Google Scholar] [CrossRef]
- Nasrollahi, M.; Fathi, M.R.; Sobhani, S.M.; Khosravi, A.; Noorbakhsh, A. Modeling resilient supplier selection criteria in desalination supply chain based on fuzzy DEMATEL and ISM. Int. J. Manag. Sci. Eng. Manag. 2021, 16, 264–278. [Google Scholar] [CrossRef]
- Wang, Y.; Fan, J.; Zhou, K. Territorial function optimization regionalization based on the integration of “double evaluation”. Geogr. Res. 2019, 38, 2415–2429. [Google Scholar]


| Data Name | Data Type | Time Period | Data Source |
|---|---|---|---|
| Land cover data | Grid | 1990, 2000, 2010, 2018 | Resource and Environment Science and Data Center |
| NTL data | Grid | 2018 | National Oceanic and Atmospheric Administration |
| GPP data | Grid | 2018 | United States Geological Survey (USGS) |
| LST data | Grid | 2018 | United States Geological Survey (USGS) |
| Road maps | Vector | 2018 | National Catalogue Service for Geographic Information |
| Road | Length (km) | Weight |
|---|---|---|
| Expressway | 2721.64 | 9 |
| National highway | 1080.08 | 7 |
| Provincial highway | 3417.09 | 7 |
| Urban main road | 9178.48 | 5 |
| County highway | 3174.17 | 3 |
| Urban road | 39,980.66 | 3 |
| Country road | 1531.86 | 1 |
| Variable | Regression Coefficient | Standard Error | Wald | Degree of Freedom | Significance |
|---|---|---|---|---|---|
| NTL (X1) | −25.49 | 1.74 | 215.49 | 1 | <0.001 |
| GPP (X2) | 6.01 | 0.48 | 153.53 | 1 | <0.001 |
| Road (X3) | −10.61 | 1.13 | 88.80 | 1 | <0.001 |
| LST (X4) | −5.16 | 0.56 | 85.58 | 1 | <0.001 |
| intercept | 5.06 | 0.29 | 308.41 | 1 | <0.001 |
| Type | Area (km2) | Percentage (%) |
|---|---|---|
| Core Zone | 2113 | 9.61 |
| Fringe Zone | 2432 | 11.06 |
| Suburb Zone | 17,443 | 79.33 |
| Total | 21,988 |
| Degree | Classification | Unit Number | Proportion/% | ||||||
|---|---|---|---|---|---|---|---|---|---|
| 1990 | 2000 | 2010 | 2018 | 1990 | 2000 | 2010 | 2018 | ||
| Mild | 0.0–0.35 | 2417 | 2165 | 1757 | 1677 | 81.24 | 72.77 | 59.06 | 56.37 |
| Moderate | 0.35–0.7 | 434 | 591 | 737 | 794 | 14.59 | 19.87 | 24.77 | 26.69 |
| Intense | 0.7–0.9 | 101 | 179 | 420 | 438 | 3.39 | 6.02 | 14.12 | 14.72 |
| Severe | 0.9–1.0 | 23 | 40 | 61 | 68 | 0.77 | 1.34 | 2.05 | 2.29 |
| Total | 2975 | 2975 | 2975 | 2975 | 100 | 100 | 100 | 100 | |
| Average | 0.269 | 0.318 | 0.407 | 0.418 | |||||
Publisher’s Note: MDPI stays neutral with regard to jurisdictional claims in published maps and institutional affiliations. |
© 2022 by the authors. Licensee MDPI, Basel, Switzerland. This article is an open access article distributed under the terms and conditions of the Creative Commons Attribution (CC BY) license (https://creativecommons.org/licenses/by/4.0/).
Share and Cite
Qiu, G.; Wang, Y.; Guo, S.; Niu, Q.; Qin, L.; Zhu, D.; Gong, Y. Assessment and Spatial-Temporal Evolution Analysis of Land Use Conflict within Urban Spatial Zoning: Case of the Su-Xi-Chang Region. Sustainability 2022, 14, 2286. https://doi.org/10.3390/su14042286
Qiu G, Wang Y, Guo S, Niu Q, Qin L, Zhu D, Gong Y. Assessment and Spatial-Temporal Evolution Analysis of Land Use Conflict within Urban Spatial Zoning: Case of the Su-Xi-Chang Region. Sustainability. 2022; 14(4):2286. https://doi.org/10.3390/su14042286
Chicago/Turabian StyleQiu, Guoqiang, Yinghong Wang, Shanshan Guo, Qian Niu, Lin Qin, Di Zhu, and Yunlong Gong. 2022. "Assessment and Spatial-Temporal Evolution Analysis of Land Use Conflict within Urban Spatial Zoning: Case of the Su-Xi-Chang Region" Sustainability 14, no. 4: 2286. https://doi.org/10.3390/su14042286
APA StyleQiu, G., Wang, Y., Guo, S., Niu, Q., Qin, L., Zhu, D., & Gong, Y. (2022). Assessment and Spatial-Temporal Evolution Analysis of Land Use Conflict within Urban Spatial Zoning: Case of the Su-Xi-Chang Region. Sustainability, 14(4), 2286. https://doi.org/10.3390/su14042286