Abstract
The reliance on roads to provide fluent mobilization has raised great concern when facing functional degradation. Disruption of the critical segments of a road network may significantly increase the distance traveled by a community. This paper proposes a method for measuring road network vulnerability when facing disruption by assessing all road segments within a network. The assessment is based on two of the shortest disjointed diversion routes from one end of the segment to the other, supporting the strategy of reaching equilibrium flow in an emergency condition. To generate diversion routes for the purpose of reconnecting a disrupted segment, the shortest path patterns are generated through the formation of adjacent polygons using GIS. Accordingly, this paper proposes a segment vulnerability index based on the support of diversion routes. Additionally, the model introduces supporting vulnerability, a parameter for measuring the potential of a road segment becoming a supporting diversion route when its surrounding segments are disrupted. By adopting the Malaysian Peninsular road network as a case study, the developed index can assist transportation agencies in planning and maintaining road assets while prioritizing vulnerable road segments relative to the entire road network.
1. Introduction
The movement of humans and goods is highly reliant on the efficiency of road networks. Road networks provide connection to almost all parts of the land, creating higher demand for a well-established and resilient road network system. Usually, for developing countries, the shortcomings in policy planning during the drastic expansion of road networks tends to concern the underestimation of changes in the economy, population growth, future expansion, and uncertainties in regions with dynamic topography [,]. Moreover, unpredictable climate change can trigger natural disasters such as landslides, floods, and earthquakes, which cause instability and have destructive cascading effects on the road network system [,]. Whether this may prevent a few road users from reaching their destination or result in rough congestion, the negative impact of an impaired road network system will always cause distress to the affected society [,,]. This issue has made road network resiliency a national concern and, hence, warrants further studies for future improvement.
Malaysia has experienced a series of road collapse events in the past, especially during the months of monsoon season from October to January. In this period, prolonged rainfall triggers landslide disasters in hilly regions and, in the worst case, impacts the road network system by causing total link disconnection. These complications are alarming as the slope structure deteriorates over time, becoming no longer predictable []. Shown in Figure 1 are examples of road collapse events that have impacted roads in rural areas. These roads were typically long-stretching, low-volume roads designed to meet the social and economic needs of a small population []. These collapses resulted in a long period of segment closure for reconstruction work and the subsequent alteration of traffic patterns for an extended time []. Although the link closure could be avoided by distant travelers through a diversion to other paths with the assistance of today’s navigation apps, the issue persisted in terms of impact for direct link users whose daily travel became impossible, particularly when towns were cut off in isolated areas [,,]. Accordingly, diversion routes became a necessity for access to remote areas, and they acted as a direct solution to sustain the local needs.
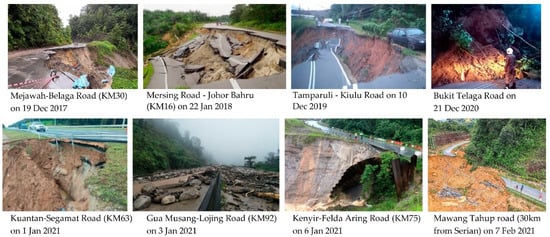
Figure 1.
Previous road disruption events (from various internet news sources).
Experience from previous road disruption events has revealed that the response and recovery procedures put in place by transportation agencies lacked predictive impact knowledge ahead of time []. To address the shortcoming, an index based on the topological layout of a network was prepared to characterize accessibility prior to disastrous events. This index establishes whether a blocked road segment stretching between two intersections can still be reconnected through adequate network support, or will result in isolation. The vulnerability of disrupted road segments based on diversion routes proposed herein can provide transportation agencies with advanced knowledge for planning and maintaining road networks. The resulting vulnerability index also has wider applications, such as the prioritizing of locations to reduce excess vulnerability by various mitigation means.
This paper explores road network vulnerability by evaluating all segments within the studied road network using a GIS-based method. The method considers the failure of each road segment individually, following an assessment based on the available diversion routes that could allow reconnecting the affected segment. In addition to searching for only one path, this study investigates the second shortest path. The rule of internally disjointed paths is applied to verify that the two new routes do not intersect, thereby providing path options and enabling flow optimization. As a disrupted segment only necessitates a direct connection over a short distance as a solution, a complex pathfinding method is not required. The goal is rather focused on producing a conclusive result for the whole network, with the ability to track all paths created.
The vulnerable network analysis compares the original segment distance with the first and the second diversion route distances. The two-path choice is established to support excessive traffic overflow in high-volume areas to reach an optimal user equilibrium [,]. The two-path choice also enables the conversion of bidirectional lanes to a single direction, facilitating both directions of incoming vehicles. This complements the search for independent routes on an extensive scale, as proposed by Campos et al. [], without assigning any specific source and destination, making the developed model applicable to any road network.
The method in this paper uses a GIS tool to form cycles resembling a round trip via a diversion route, while obtaining the correct topology where overpasses exist. It has made it possible to conduct the vulnerability measure for an entire network. From the complete cycle model developed, Supporting Vulnerability, the SV parameter is introduced to measure a segment’s roles in becoming the diversion route for its respective disrupted segments. These can be referred to as backup alternatives [], with the ability to reveal the identity of the disrupted segments by backtracking the cycles created. In other words, this enables us to summarize the attributes of multiple segments were they to malfunction. The method is tested on the Malaysian Peninsular road network, and the results are presented in a mapping index relative to the whole road network. To recall the few contributions made, this paper:
- Provides a GIS-based method for a vulnerability index referenced to direct link users by using two internally disjointed paths;
- Introduces the Supporting Vulnerability measure to backtrack paths that acted as diversion routes for all their respective disrupted segments.
The literature review in Section 2 discusses previous works. Section 3 explains the methodology of the proposed model development, including graph theory, topological requirement, modeling of the road network in GIS, and the calculation workflow. Section 4 presents the results and discussion based on the Malaysian Peninsular road network. Section 5 demonstrates the proposed method with traffic data. Section 6 concludes the study with limitations, and Section 7 suggests future work.
2. Literature Review
The concept of road vulnerability has no definite measure, as it depends on the application context []. Researchers continually develop new methods to better understand road network operations under emergency scenarios. The vulnerability of a road network can be defined as its susceptibility to disturbance, which is measured by the impact affecting the accessibility [,,]. The links with the most severe impact—vastly called critical links—are deemed weak in alternatives and important to the system performance [,].
There are two approaches to a road vulnerability study. Considering the topological properties of road networks, the first approach defines the network based on graph theory, or complex network theory. It analyzes the layout structure, consisting of lines and nodes [,]. Another approach explores the roadway design, physical structure, and traffic load to meet the temporal needs of a changing environment [,]. An example of this is measuring network-based accessibility considering both the supply and demand sides []. The first approach is applicable for broader network coverage studies, requiring a simplified network interpretation, while the second is more specific to system performance with heavier roadway attributes.
The techniques to quantify network vulnerability have been conducted in several ways. Current trends are less likely to conduct link importance on an undisturbed network, and claim the most important ones as critical links. Some questioned that this might disregard the possibility for the network to adapt and function normally even after a link is disrupted []. Therefore, recent studies have predicted the amount of damage for a certain area, for the case of a disconnected network, by calculating the difference between the performance functions before and after removing the links [,,,]. The consequence of a road disruption indicates the magnitude of the true impact, which affects the accessibility of road users in reaching their destination []. These impacts are usually contagious throughout the flow of the surrounding network [].
The technique of removing links or nodes can be intentionally selected or randomly selected, if based on uncertainty []. Single-link removal or multiple-link removal depends on the severity of the disruption scenario. For example, Bono and Gutiérrez [] evaluated the degree of accessibility due to multiple road blockages for an urban road network due to earthquake damage. They mentioned that the increase in isolation is not directly proportional to the blocked roads, but due to the roads being poorly connected in the first place. Bagloee et al. [] found a variety of critical combination scenarios after identifying the devastating impacts of each link removal. Jenelius [] conducted an impact-based measure on rerouting alternatives after removing, at most, two links within an origin–destination pair. Chen and Lu removed nodes according to the sequence of degree and betweenness on an integrated transportation network []. Crucitti et al. [] demonstrated the collapse of an entire network after breaking down a single node with the largest load. In a real context, multiple-link disruptions are suitable for prominent disaster cases, such as in Japan where frequent earthquakes affect large areas []. Single-link disruption is more appropriate for Malaysia’s landslide scenarios because, in reality, the probability for consecutive link failure for this type of disaster is low []. Furthermore, single-link failures are more frequent, and better represent extensive incidents.
The result of link disruption can be seen in the decreased accessibility of larger network connectivity. Connectivity reliability is regarded as the most fundamental measure, since it guarantees accessibility from one place to another. This is considered necessary for a community to pursue its activity []. It can be viewed as the probability that the network nodes remain accessible by having at least one path without disruption when links have been removed [,]. The consequences of road disruption can be measured by the decrease in accessibility []. The worst case implication would be the isolation of a community that will require emergency life support [,,]. To measure this, Sakakibara et al. [] developed a topological index that measures dispersiveness/concentration, and how disrupted links can result in isolation by the number of subgraphs created. Haghighi et al. [] combined probability and consequence for the disruption of critical links, resulting in links with very limited alternative routes that can help absorb the traffic. Australia has adopted the remoteness index, which provides a measure of accessibility to service centers of different populated localities []. As these studies can lean towards pure topological measure, connectivity reliability may be appropriate when congestion is not an issue, or when dealing with a relatively sparse network such as an interstate highway system [].
The instinct of pathfinding when encountering a disrupted link is by accessing alternatives for a preferred diversion route. Most studies concerning alternative paths emphasize the need for multiple options. One reason is that personal preference could vary in selecting a new route []. A greater reason is that path options indicate the dispersiveness of vehicle flow; the more options there are, the less likely traffic concentration is. To refine this, some studies preferred the path to have minimum overlay to prevent convergence. Daganzo [] explained how the user choice of selecting a diversion increases the link’s capacity at intersections, resulting in oversaturation, and how temporary disturbance can change the saturation state of the static network. Campos et al. [] developed an algorithm defining two independent paths from one origin (disaster area) to two destinations (shelters), such that the paths do not intersect, to avoid oversaturation. He et al. [] simulated a route guidance strategy and aimed to achieve an optimal splitting rate of vehicles traveling on parallel routes to reach a single destination. Li et al. [] compared three popular alternative route techniques: penalty, dissimilarity, and plateau. The results showed similarity in quality; the real-time application reflected the user’s choices differently. The introduction of a plateau technique with the ant colony algorithm was demonstrated by Feng et al. []. The technique produced high separation and low average route lengths. Dissimilar alternative paths, proposed by Jeong et al. [], customized the new searched path by adjusting the limit of shared length ratio and travel cost ratio with the already searched shortest path.
In general, most of the studies discussed here agreed that more path variation with less convergence to accommodate the new movement pattern is a positive solution. For this study, we adopted the strict rule of internally disjointing paths to deny intersections of, at most, two identified paths. The method proposed does not intend to prove the efficiency of the rule, but to realize its implementation on a large-scale network based on the suggestions and proven results of previous works.
Analyzing road disruption involves selecting studied samples based on real disaster-susceptible areas, or predictive failure locations. However, this is not the case for most vulnerability studies that take proactive action. Vulnerability measures often rank the infrastructure assets according to a proposed vulnerability metric. Most critical assets identified from these rankings, called the vulnerability index, are then proposed to decision-makers to build contingency plans, or to design network enhancements []. The vulnerability index can be calculated in many ways, showing the critical state of a link relative to another. It can indicate the proportion of the overall uncertainty of a performance measure, contributed to by the uncertainty of its link capacity []. For example, El-Rashidy and Grant-Muller [] combined different weights from physical attributes, such as length and number of lanes with operational characteristics, combining aspects of network flow into a single vulnerability index. Balijepalli and Oppong [] proposed a vulnerability index by considering the reduction in serviceability of a road link, which can range from partially blocked to total disruption in an urban road area.
The literature discussed show that various attempts have been made to quantify the road vulnerability index. Their common goal is to arrange road assets according to a defined critical state order. We conclude this overview by classifying them into two scopes. Most studies achieved a vulnerability index by applying complex methods and algorithms, and demonstrated their methods on a small or personalized road network by assigning candidate links or paths according to a defined origin–destination pair [,,,,,,,,,,]. The second group considered a relatively larger network, usually based on existing road structure, to increase practicability confidence, and conducted an assessment on a larger number of samples, if not on overall samples [,,,,]. This study took the challenge of the second approach, with the intention to carry forth the result as a data inventory to assist future processes. A complete assessment allows for data to be available instantly when needed, and caters to unknown and constantly changing locations of environmental risk.
3. Methodology
The technique used to generate the diversion routes selected for this study was based on network topology and shortest path demand, and was supported by available resources for road data. Diversion routes are usually susceptible to traffic spillover where they meet at intersections. Thus, the internal disjoint rule was adopted as an advance measure. The reconnection assigned at both ends of a segment was chosen in the view that direct link users were implicated the most, and required an instant access recovery. Long-range travelers have the potential to bypass the impacted network, as more detour options are available. This makes the developed method appropriate for local users that are affected by road disruption.
3.1. Graph Theory
Studying a road network requires turning a unified interpretation of the existing infrastructure into a simplified form representing the actual road system []. A set of rules are applied for the unified interpretation, which can be defined by a mathematical form called graph theory. A connected graph eliminates disconnected routes, as long as there are paths between every pair of vertices []. This means every node is reachable by any wheeled vehicle in the system. Non-directed graphs are applicable for each segment to be bidirectional, representing two lanes working in both directions.
The Malaysian Peninsular road network studied in this paper exists in the form of connected, non-directed, weighted, non-planar and multi-graph networks, similarly explained by Rebaiaia and Ait-Kadi [] and Sven Henning et al. []. Additionally, the rules for this study allow crossing of an edge (non-planar graph), such as an overpass, and consider loop and multiple edges as connecting a pair of nodes (multi-graph) [].
An intersection is interpreted as a vertex, v, and a road segment as an edge, e, creating a whole network with a complete set of vertices and edges called a graph, G = (V,E). A path, P, is a finite sequence of vertices traversed only once, and can be arranged as P = (v1, v2, v3, …, vn) such that the edge set, E = {vi vi+1 | i = 1, …, n − 1}. A cycle, C, is a path having closed ends, where initial and terminal vertices are equal. It can be arranged as C = (v1, v2, v3, …, vn) such that the edge set, E = {vi vi+1 | i = 1, …, n − 1} ∪ {v1 vn}. Each segment with a pair of vertices (u,v) is tested for its length and diversion route distances according to the shortest path. Each polygon formed in the GIS model is referred to as a cycle with the perimeter length as the complete cycle’s distance.
3.2. Topological Requirement
A well-interpreted road network is required to produce a reliable result. Sources which provide road vector data, whether from OpenStreetMap (OSM) or official data from the transportation department, are usually defective. Therefore, the foremost crucial process when establishing a road network database is to ensure that the topology is correct, meaning the connection between segments must be accurate so that path findings or enclosed boundaries are obtainable.
In a simple scenario of a road network, every endpoint with four edges is considered as an intersection. However, in a real road network layout, a non-planar graph translates a certain crossing as non-intersection []. An overpass can be seen as two crossings through flyovers, bridges or tunnels at different elevations without any possible connection. Simplification of non-planar graphs can misrepresent intersection points, street lengths and routing in specific areas that contain a non-negligible number of grade separations [].
In the GIS model, polygon formation ignores overpasses because of planar simplification. This is demonstrated in the network sample in Figure 2, where seven enclosed polygons were created. Cycle formation is explained for segments A, B, C, and D. Segment B overpasses segments C and D, thus creating the diversion routes, explained as cycles, to join multiple polygons. Cycles in red resemble the first-choice alternative for their respective segments based on smaller size, while blue cycles resemble the second-choice alternative, acting as a support in case the first alternative is unable to endure excessive traffic burden. The two paths formed are internally disjointed paths, the rules of which will be explained in the following section.
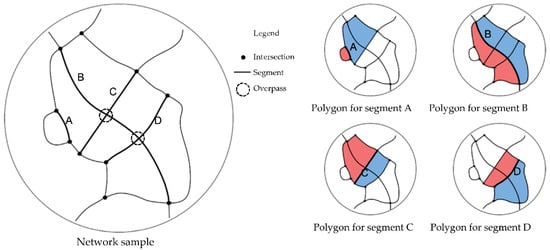
Figure 2.
Cycle formation from polygon, segment, intersection and overpass.
3.3. Modeling the Road Network in GIS
Each road segment in Malaysia belongs to a road category according to the functions of the road, namely expressway, highway, primary road, secondary road and minor road. The authority categorizes these roads by privatization/toll road, federal road, state road, local authority road, or other roads []. This study limited the roads into three major categories, although some are selected from a fourth category based on arbitrary selection for necessary connections in certain areas. For some stretches consisting of two classes, the upper class was selected to represent the segment. As the OSM data was originally prepared by tracing from the latest satellite images (georeferenced), the same approach was used to edit the network to include the under-construction highways, which might have significant changes in connectivity.
The road network of the study area was retrieved from OSM in the form of a shapefile. The data consisted of unconnected street lines obtained after filtering unnecessary layers []. Each line was then connected as a polyline segment, having the end vertices either as an intersection, or one end as an end road []. The unconnected lines were validated further using dangles in ArcGIS. Figure 3 shows the GIS modeling process using its functional terms in ArcGIS.
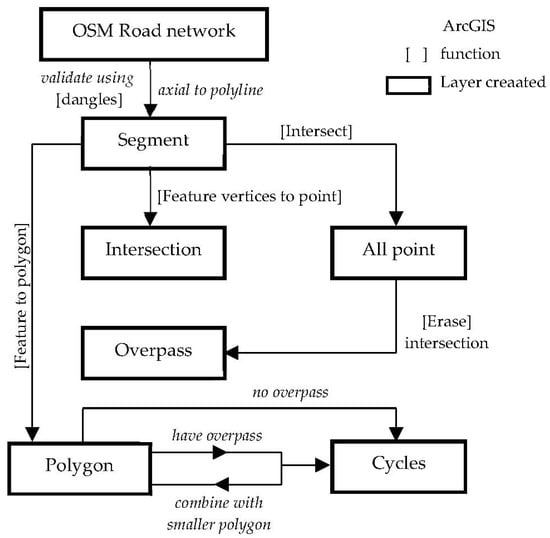
Figure 3.
GIS Modeling Process.
Each vertex in the model was identified either as an intersection or overpass. The overpass layer was completed in ArcGIS by the following steps: (1) creating endpoints for both ends for all segments using the function Feature Vertices to Point; (2) creating all points regardless of overpass using the function Intersect; and (3) Erasing the layer created in step 1 using the layer created in step 2. The following process is to create polygon layers using the function Feature to Polygon. Meanwhile, the segment layer was used to create polygon features. Polygons were formed at any closed boundary regardless of overpasses or intersections. The polygons in contact with an overpass were combined with the smaller neighboring polygon using the function Union to become a valid cycle with the smallest perimeter. If a polygon’s perimeter consisted only of intersections, it was considered a valid cycle.
To validate the cycles, Network Analysis was conducted in ArcGIS to compute the shortest path for several erased segments, and the workability verified the procedure to be performed on the rest of the network. This GIS-based method was uncovered from the constraints to conduct the shortest path analysis based on Dijkstra’s algorithm for all segments, as the process was too time-consuming.
3.4. Calculation Workflow
The shortest path problem was essentially the method of finding the second shortest path between two vertices in a given graph, if the original path was blocked []. Assigning each edge with a value is called an edge-weighted graph []. The practical aspect of a weighted graph allows a given path to be evaluated based on its smallest cumulative edge values. The approach is based on three assumptions. First, single-link failure is assigned to all segments and assumed as a total disconnection. Second, each link is considered a failure, occurring one at a time. Third, the paths to be determined are from end to end of the failed link. Assuming that e is the edge connecting u,v, then the distance, d, between two vertices u,v, is the length of the edge, e:
d(u,v) = eu,v
Every edge length was identified based on its georeferenced feature in GIS. The next step implies the removal of the edge, eu,v, to search for the first diversion route. After this edge is removed from the graph, G\e only proceeds if a new path exists, P, which is still connecting u,v such that the number of connected components, c, is two or more:
G\eu,v ⇒ ∃ P: u→v|c(u,v) ≥ 2
If vertices u and v are disconnected after the edge is removed, then it is a cut edge that has created a subset component in the network []. The edge is either a bridge or a loop, therefore c(u,v) = 1. However, if there are multiple path options, the new path is configured using the shortest path distance:
In Equation (3), α is the new distance through the path, P, such that the path is the minimum distance connecting u,v. Once this is achieved, the distance of the path is summed using:
where α is now the length of all edges belonging to the nth path. In this analysis, the processes of Equations (2)–(4) are repeated twice to find the first diversion route, P1, and the second diversion route, P2, after the first path is removed, G\P1. By this means, the two paths do not share any vertex or edge other than the initial and terminal vertices, and are called internally disjointed paths []. In using the GIS polygon feature to create the first and the second diversion routes as cycles, C, the enclosed perimeter is calculated combining both the original length as in Equation (1) and the path as in Equation (3) which can be seen as:
d(Pn) = ∑e∈ Pnα(e)
d(Cn) = d(u,v) + d(Pn)|Pn: u→v ∪ e(u,v) = Cn
Equation (5) is the result of enclosed Pn which connects with e(u,v) to form cycle, Cn. Note that Pn is always the shortest path connecting u,v. Hence, two paths (P1 and P2) were identified from every two cycles formed adjacent to d(u,v). The workflow above is illustrated in Figure 4.
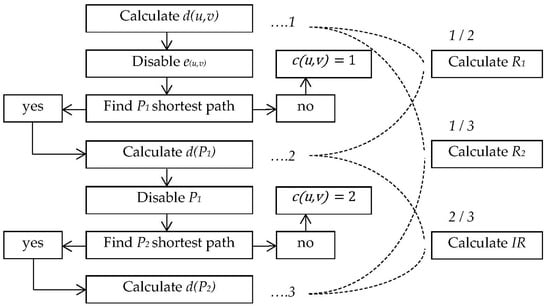
Figure 4.
Workflow Diagram.
The following part demonstrates the calculation process on a sample network and proposes a relationship between the segments, the first diversion path and the second diversion path, through the calculation of the distance ratio Rn, and the independent route, IR. Based on the GIS model, the Supporting Vulnerability (SV) parameter is explained by measuring the most dependent path of a segment when the surrounding segments are disrupted.
The method to calculate the diversion route distance for each segment from one end to the other is explained using the sample road network in Figure 5a. Vertices labeled from v1 to v14 are joined by segments and are considered intersections. There are more than two segments connected at each vertex and the segment length is labeled on each segment. In the GIS model, polygons are formed from every closed cycle of connected road segments. The sample consists of seven cycles labeled from A to G, with the lists of cycle information in Figure 5b.
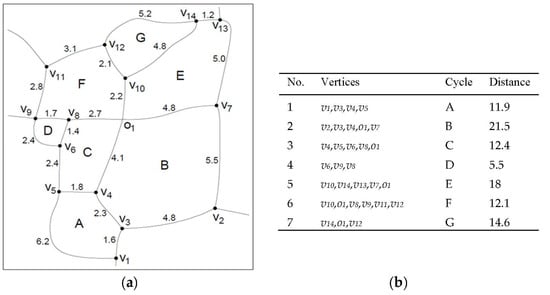
Figure 5.
(a) Sample Network; (b) List of Cycles.
The diversion path distance, d(P), for a particular segment is the polygon’s perimeter, d(Cn) minus the length of that segment, d(u,v). Division route distances for P1 and P2 are satisfied by the following:
- (a)
- d(P1) = d(C1) − d(u,v);
- (b)
- d(P2) = d(C2) − d(u,v);
- (c)
- d(P1) < d(P2) | C1 ∩ C2 = e(u,v).
Diversion route P1 is always shorter than P2 since it is the primary option. Both cycles only intersect at point u and v in common. Diversion route P2 will be considered an emergency option, assuming P1 to become the primary route in a scenario of disruption on the original segment. For example, in the network sample in Figure 5, disruption on segment v4, o1, v10, where o1 is an overpass, will create a perimeter from the combination of polygons C, D and F as C1, and cycle B and E as C2.
From the result of P1 and P2, the diversion routes are assessed based on their lengths in comparison with the original segment length to gain the diversion distance ratio, R. This indicates the vulnerability of the new path to be considered in comparison to the original segment:
Rn = d(u,v)/d(Pn)
The value of Rn is used to measure the diversion route’s reliability, where 1 is reliable and 0 is extremely unreliable [,]. If the value of Rn is closer to 1, the path has almost the same distance as the original and is considered equally reliable; thus, no issue arises for direct link users. The lower value of Rn indicates a less desired the path to take, which may reach a point of total cancellation of the trip. Both ratio diversion paths are calculated as:
- (a)
- R1 = d(u,v)/d(P1);
- (b)
- R2 = d(u,v)/d(P2).
Segment disruption will greatly interfere with the surrounding paths with heavy traffic flow locations. The independent route predicts the segment’s endurance to function in the worst-case scenario []. From the two new routes considered in this study, independent routes are evaluated by comparing the distances between P1 and P2 using R. If both values are close to 1, the two options are similarly reliable and there is a possibility of creating a one-way direction for each path. This indication is applicable for highways that are highly dependent on outskirt routes in cases of disruption. Therefore, the vulnerability of both diversion routes is termed as independent route, IR by the following:
IR = d(P1)/d(P2)
Finally, a new parameter for measuring the vulnerability of the diversion path is proposed herein. The parameter is achievable with the completed GIS model, called Supporting Vulnerability, SV. It is defined as the vulnerability of a segment in becoming a diversion route for its surrounding disrupted segments. Through the GIS model, SV indicates the number of cycles formed in the model passing through the edge u,v, or the number of intersected cycles, f. It is explained as:
The number of cycles, f, accounts for all the identified cycles that have one of their edges intersecting with the edge u,v, such that the cycles traverse in their own path. In some cases where the edge u,v is within the cycle’s perimeter, it is excluded because the interference to traffic flow is uncertain in this condition. The complete result of this exercise from Figure 5 is shown in Table 1. The overall methodology applied to the road network of the Malaysian Peninsular is presented in Section 4.

Table 1.
Exercise Result.
4. Result and Discussion on the Malaysian Peninsular Road Network
The road network created had a total length of 24,512.3 km, covering the entire Malaysian Peninsular with an area of 242,363.8 sq/km. The street data originating from OSM was filtered to include only the main network based on the road categories according to the Malaysian authority. A total of 6718 segments consisting of 245 expressways, 1395 federal roads, 2532 state roads, and 2546 local authority roads were developed. Furthermore, 4517 intersections and 602 overpasses were identified. The road network displayed each segment as polyline joining at intersections, creating the road structure presented as bidirectional.
The results are presented in a map, using a color scale with red as the most vulnerable segments and blue as the least vulnerable segments when affected by disruption. The less vulnerable segment was considered reliable compared with the rest. Certain segments, such as end segments (bridge edge) and loops, where the diversion path was absent, were considered unavailable in data, and therefore were absolute red throughout the displayed results. The following results illustrate the network in ranking scale as a whole, and a few specific regions are emphasized for additional elaboration.
The first output is the length of each segment. This length is based on two end nodes, where the segments meet at intersections or meets an end road. Figure 6a shows the seven longest segments with the character of positioned terrain listed in Figure 6b. Long-stretched road segments are usually interstate connectors, connecting distinct areas or cities passing through harsh topographic landscapes. Segments A, B, C, D, and F in Figure 6a run through mountainous areas with minimum surrounding accessibility. Segment G stretches along the Pahang River, placing its exit through two bridges located on each end node. Segment E flows between coastal and rural areas. Disruption along any long stretch of these roads significantly affects not only the interstate traveler on reaching their destination, but also deteriorates the region’s logistic and economic activities. Different terrains are also exposed to different types of risks.
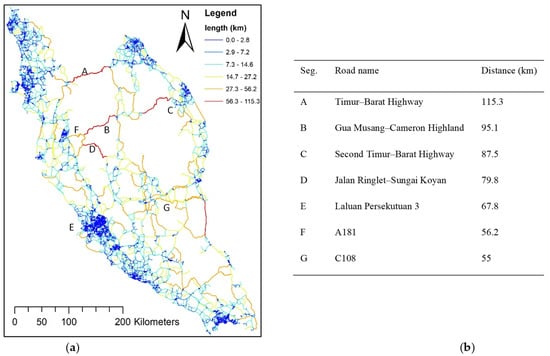
Figure 6.
(a) Segment length, d(u,v); (b) list of seven longest segments.
In the case of segment disruption, the first choice of diversion path can be identified visibly by the smaller cycle adjacent to the disrupted segment. Figure 7a shows the first diversion path, P1, of the Malaysian road segments. It must be mentioned that 286 segments are cut edges and are shown in red throughout the results, where the disruption of these segments will cause one end to be isolated from the rest of the network. In Figure 7a, Segments 1 and 3 rely on cycle A to complete the end-to-end node journey, indicating that they are among the longest in the sample. Segment 2 relies on cycle B, as it is the shorter cycle. Segments 4 and 5 rely on cycles D and C, respectively.
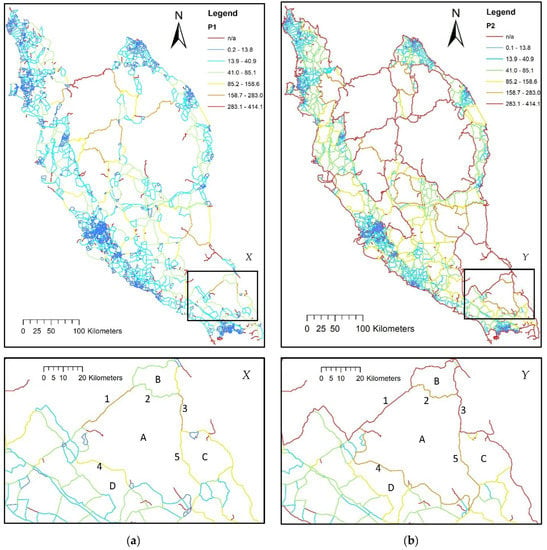
Figure 7.
(a) First diversion path distance, d(P1); (b) Second diversion path distance, d(P2).
Figure 7b shows the result for the second diversion path, P2. Contrary to P1, P2 shows the diversion path associated with the larger cycle adjacent to the segment. Notably, 942 segments do not have P2. Generally, the longest P2 distances are mostly located along the boundaries of the largest cycles. Figure 7b (lower) shows that cycle A is the largest in its region. Therefore, the segments around it, namely segments 2, 4 and 5, depend on cycle A as P2, but are considered unreliable due to its long distance. Coastal aligned segments and isolated segments, i.e., segments 3 and 1, respectively, have no P2 and only rely on P1. Overall, P2 routes are significantly longer than P1, with the average means of each category being more than double (see Table 2).

Table 2.
Road category statistics for original segment, diversion route and ratio based on distance.
Every diversion route was evaluated by comparing its distance with the original route distance. Figure 8a,b show the results for the ratio of first and second diversion path distances to the original distances, R1 and R2, respectively (refer to Equation (6)). Larger values of R indicate that the diversion path distance is closer to the original route distance, and therefore raises less issues in handling disruption. Certain segments that have an R value above 1 are where the segment stretches for longer than the diversion path. A closer R value to 0 shows the segment to be more critical in a state of disruption, as the diversion route is multifold in the distance.
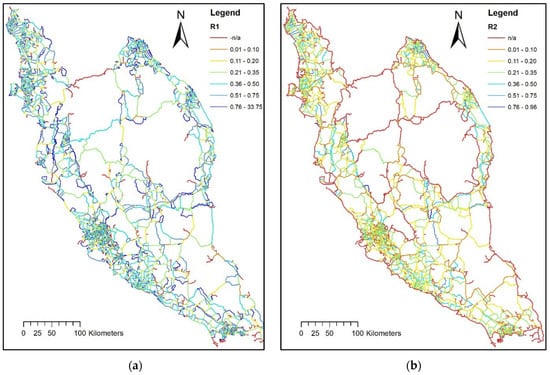
Figure 8.
(a) First diversion path ratio to original, R1; (b) second diversion path ratio to original, R2.
The purpose of the ratio between the original and the diversion route indicates the feasibility of using the diversion route compared with the initial traveling distance. This influences the users’ choice of other possible options, or their choice not to travel. The significance of R1 and R2 is that the diversion path does not always rely on distance. Longer diversion distance is not always interpreted to be more unreliable. The ratio reflects the characteristics of the new path to be either similarly reliable or less reliable than the original path.
Independent route, IR defines the potential of a segment to be functionally stable in handling disruptions. It is defined as the distance balance between P1 and P2, as portrayed in Figure 9. Segments of high IR value (blue) are observed as having a similar size between both adjacent cycles. Therefore, the cycles’ distances are homogeneous. In contrast, low IR value (red) segments only depend on the P1 option to support any transferred traffic burden. One may view the IR as reasonable if the R values are high. As this study concerns only total disconnection, having two diversion path options, regardless of how low the R value is, is still sufficient in terms of alternative access. This indication may benefit the road operators for strategizing traffic alterations on disrupted roads, or plan for road closures suitable for heavy capacity road areas when reaching equilibrium flow.
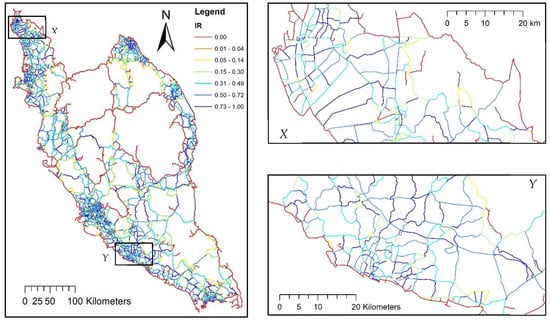
Figure 9.
Independent route, IR, emphasizing area X and area Y.
Completing distance measurement allows for empirical analysis based on the distances of the original segments, the first diversion route and the second diversion route. The three divisions of distance categories are summarized based on: (1) road classes according to the authority; (2) interval length of 10 km; and (3) interval 1000 counts of segment length in ascending order. Table 2 lists the distribution of each category on segment count and total distance, as well as the means of the variables d(u,v), d(P1), d(P2), R1, R2, and IR. This only accounted for samples with available routes, n, as total value. Segments having no value (referring to P1 and P2) were excluded.
The reliability of the diversion route for each category can be seen in a higher R value. The result shows that as the category of road length increases, the diversion path decreases in distance, as seen in R1 and R2, for both interval categories. This dictates that longer road segments have a shorter alternative options, relatively, compared with already shorter segments which may have relatively longer detours. In a bigger network, it can be concluded that diversion routes from end-to-end segments have a better performance.
Finally, Supporting Vulnerability, SV, is introduced to backtrack all diversion paths. It measures the number of diversion paths supported by each segment. In Figure 10a, the result of SV is shown for paths supporting P1 only. For example, area X in Figure 10b, where segment k supports twelve other segments as their first diversion route, SVk = 12, means that segment k would be highly depended on if the supported segments (1 to 12) were disrupted by any cause. This example is only one out of every segment with the components of SV. The ability of GIS to intersect, unite, join and relate data in the form of vectors or values enables an in-depth process of connecting information. The relationship of SV to d(u,v), P, R, and IR allows us to summarize the detailed attributes of the cycles created, each representing a diversion path for a disrupted segment. Examples of the detailed attributes are the total distance of all supported segments, average ratio, and spatial integration of encounter cycles, such as the intersection encountered.
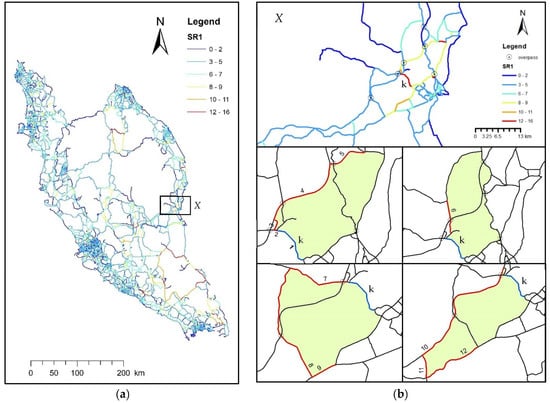
Figure 10.
(a) Supporting Vulnerability for First Diversion Route, SV1 based on segment count; (b) components for Supporting Vulnerability for segment k.
It is significant to mention that there is a hierarchical assessment of the proposed method, besides choosing a preferred measure. For example, a high ratio value of R is not always preferable if the length of the original route itself is already too long. Another example is that the search for an optimal independent route is not always reliable if the first and second diversion ratios (R1 and R2) are low, even though the IR value is high. The SV is not achievable without the complete formation of the cycle model and its attributes. As such, the method should follow the order as proposed, and the vulnerability depends on the type of solution or the level of critical insight.
5. Application of the Proposed Vulnerability Index with Traffic Data
In this section, the proposed method of road network vulnerability is demonstrated for its impact prediction using available traffic data. The significance of the diversion path concerning direct link users is also discussed. Segments labeled 1 to 5, listed in Table 3, are chosen for discussion, with the assumption that Segment 3 is disrupted due to being exposed to landslide risk—this area has a history of collapse, and suffered a landslide on 22 January 2018. Figure 11a shows the network layout. The supplementary traffic data consists of the following: (1) annual average daily traffic (AADT); (2) level of service (LOS); and (3) roadway capacity. AADT and LOS are consensus data based on the year 2019 (before pandemic) provided by Road Traffic Volume Malaysia (RTVM). LOS is a qualitative measure that describes traffic conditions; A represents the best condition, while F represents heavily congested flow with traffic demands exceeding highway capacity. Figure 11b summarizes the information in an inverse bar graph to show the amount of traffic involved in reference to the potential of an increase in travel distance.

Table 3.
Diversion route and roadway data for segment 1 to 5.
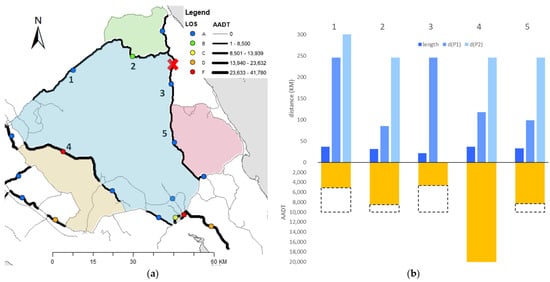
Figure 11.
(a) Road network with traffic data; (b) graph presentation for segments 1 to 5 based on data in Table 3.
Segment 3 showed a relatively long first diversion route, d(P1), but with not much traffic involved. Similar traits can be seen for segment 1. If disrupted, the transfer of traffic flow would be expected to be along the parameter of the adjacent blue cycle because, in this case, no other options are available. A different case would be for segments 2, 4 and 5, having their own diversions colored green, yellow and red, respectively. Segment 4 is already at a critical state with LOS level F, and should be a location of concern.
A betweenness measure of before and after disruption was conducted using four different sets of radii: 100 km, 200 km, 300 km and 400 km. This briefly shows the changes in movement patterns on a regional level of the network area. For example, the betweenness of 100 km involves the shortest flow for each node to all other nodes within the radius of 100 km, and so on. The difference in betweenness of before and after removing segment 3 for all radii are shown in Figure 12. Blue indicates the decrease and red indicates the increase in flow distribution. Note that this is to show the impact towards the movement of the surrounding network, but does not necessarily reflect the actual increase or decrease in traffic volume, which is beyond the scope of this study.

Figure 12.
Difference in betweenness of after and before disruption: (a) 100 km radius; (b) 200 km radius; (c) 300 km radius; (d) 400 km radius.
In Figure 12a, a movement of the 100 km radius is seen to only have decreased in flow (cancelation of trips) because the cycle to complete the detour is larger than 100 km. This is what we refer to as an implication to direct link users. From 200 km onward, the impact of the disruption in reference to the diversion route can be seen as partly involved. All directly connected segments show a decrease in flow, while the opposite sides of the disrupted link show the most increase. As the radius increases to 400 km, the local network is less relevant, as distant travelers are adapted to other route options to reach further destinations. It can be expected that segment 4 has the potential for traffic disturbance according to the high LOS, and for being the main path to support traffic after the disruption of segment 3.
In actuality, the increase in traffic volume is not totally applied to the cycles, because the vehicles involved are also distributed to other paths. This might be significant to areas with weak accessibility to other alternatives, as featured by the proposed vulnerability index. In the concern about the impact of the network at a larger scale, major issues are neglected, as stressed by this paper. The proposed method considers the impact on locals living near the site of the disrupted road, who depend on it to pursue daily activities. Therefore, the reference of a diversion route should be considered as one of a vulnerability measure when analyzing road disruption. In any case, a conclusive relationship with traffic volume, as proposed in this section, is yet to be tested for a comparative result. To do so, a complete traffic flow analysis would need established traffic and roadway data for at least the larger part of the Malaysian road network to complement the vulnerability index developed.
6. Conclusions
Road vulnerability can be measured using various methods. This paper proposed the vulnerability index of a road network based on diversion routes to reconnect disrupted road segments. The technique used a GIS-based method to create cycles for pathfinding. This allowed searching for the first and the second shortest diversion routes, with the rule that the two paths did not intersect. The method was demonstrated on the main road network of the Malaysian Peninsular, consisting of 6,718 segments of which 286 (4.3%) were identified as cut edges, meaning disruption along these segments would leave one end out of reach. It also revealed that 941 segments (14%) had no second diversion route. This was either due to: (1) only one diversion path being available; (2) the second internally disjointed path being interrupted by the first; or (3) the second diversion path depending on a cycle that was too large, and considered unreliable.
The vulnerability of the diversion path was demonstrated by the ratio of the original segment to the first and second diversion routes, and resulted in users’ preferences on choosing a detour or not travelling at all. The ratio suggested that the alternative path’s performance opposed the distance counterpart. According to the ascending interval category, an increase in the length of the disrupted segment was seen to have a relatively shorter detour, meaning longer segments had better options available within the network. In contrast, shorter segments had relatively longer diversions.
The application with traffic flow emphasized that reconnecting a disrupted segment from both endpoints was appropriate for the vulnerability of direct link users. Even though it is certain that traffic flow will increase along the diversion path created (parameter of cycles), this does not necessarily transfer to the total traffic burden. Long-range travelers have detour options for other parts of the network, due to various origin–destination factors. Additionally, most road collapse events concerned are usually at sparse and hilly locations, where traffic involved in these areas is less significant compared with urban areas. Traffic impact or congestion is not the primary concern; thus, the pertaining issues are on the local’s lifeline when their daily travels are disabled.
Independent routes suggest a balance between the first and second diversion routes, which is useful for reconfiguring traffic flow. Supporting Vulnerability, SV, derived from the completed GIS model developed, is a new vulnerability parameter proposed. It summarizes the detail attributes, such as cumulative distances of all supported segments, average ratio, and spatial integration of encountered cycles. SV is recommended for a critically unstable region, where exposure to disaster is prevalent and affects multiple segments. It may become convenient for the further understanding of road connectivity and the reconfiguring of network structures according to improved resilience standards.
The method of road network vulnerability assessment proposed in this study is constrained by certain conditions. It is bounded by specific rules and processes justifiable by graph theory, and suitable for all ranges of georeferenced networks. Although the method provided is more on the supply side, involving an immediate solution to reconnect disrupted segments, it does not account for other pathfinding measures, such as fastest route, least cost, or path with an optimal flow. The production of cycles as diversion routes using GIS has restricted other measures. The diversion route created from the end-to-end of a segment can only be made as a reference for direct link users, and is lacking for distant travelers who might avoid the impacted local network in the first place. However, the method proposed has successfully provided an overall segment assessment for a large network.
This study adopted the challenge to completely assess all segments within a road network, with the intention of carrying forth the result as a data inventory to assist future processes. Consequently, we have made the analyzed data available in an instant when needed, which can cater to unknown and constantly changing locations of environmental risk. It is expected that the result will be of interest to transportation agencies as predictive impact knowledge prior to disruptive events. The specific results for every road segment provide beneficial reference to road emergency operators to either plan for road closure, locate critical segments for mitigation plans in case of disruption, or to study a specific vulnerable segment for better insight into the consequences of disasters. The index allows for the prioritizing of locations for planning purposes to reduce excess vulnerability in disaster-prone areas. The model developed is topological-based, deterministic, and applicable to any road network.
7. Future Research
In defining a new path to reconnect a disrupted segment, our method considered internally disjointed routes, which limited the search for new paths, as can be seen through the descending number of options. This rule can be made less strict by tolerating some portion of the shared segments. However, the shared segment must be minimized to comply with the recommendations of previous works, suggesting less convergence to prevent traffic spillover.
Additionally, it is recommended that for future study, origin–destination can be predetermined while limiting the study area to smaller scales. For example, on a bidirectional highway stretch, the length of a studied segment can be customized by assigning the origin and destination at the highest point of traffic inflow and outflow. By using the method proposed, the independent path configured is able to be tested, and suggests the direction of higher vehicle rate to be utilized on the first diversion path, and a lesser vehicle rate to be utilized on the second diversion path.
The method proposed also has application potential for exploring higher levels of road network complexity, such as in urban areas. Therefore, the network model is preferable to include every existing road capable of functioning as an emergency route to provide maximum resilience for road network operation under disruptive events.
Author Contributions
Conceptualization, data curation, formal analysis, funding acquisition, investigation, methodology, project administration, writing—original draft, visualization, A.A.H.R.; resources, supervision, funding acquisition, R.Z.; writing—review and editing, funding acquisition, E.A.; validation, funding acquisition, A.N.A.; resources, funding acquisition, N.M.Y. All authors have read and agreed to the published version of the manuscript.
Funding
This research was funded by Malaysian Ministry of Higher Education under the grant FRGS, cost center no: (Q.J130000.2551.21H52).
Institutional Review Board Statement
Not applicable.
Informed Consent Statement
Not applicable.
Data Availability Statement
Not applicable.
Acknowledgments
The authors would like to thank Universiti Teknologi Malaysia for supporting financial grant, Disaster Preparedness and Prevention Centre, Malaysia-Japan International Institute of Technology, GreenPROMPT research team members, Department of Construction Management, School of Civil Engineering, UTM, PLUS Berhad and those who provided with the opportunity for this research.
Conflicts of Interest
The authors declare no conflict of interest.
References
- Taylor, M.A.P.; Sekhar, S.V.C.; D’Este, G.M. Application of Accessibility Based Methods for Vulnerability Analysis of Strategic Road Networks. Netw. Spat. Econ. 2006, 6, 267–291. [Google Scholar] [CrossRef]
- Ahmadzai, F. Analyses and modeling of urban land use and road network interactions using spatial-based disaggregate accessibility to land use. J. Urban Manag. 2020, 9, 298–315. [Google Scholar] [CrossRef]
- Jaroszweski, D.; Chapman, L.; Petts, J. Assessing the potential impact of climate change on transportation: The need for an interdisciplinary approach. J. Transp. Geogr. 2010, 18, 331–335. [Google Scholar] [CrossRef]
- Rehak, D.; Senovsky, P.; Hromada, M.; Lovecek, T.; Novotny, P. Cascading Impact Assessment in a Critical Infrastructure System. Int. J. Crit. Infrastruct. Prot. 2018, 22, 125–138. [Google Scholar] [CrossRef]
- Kim, J.; Park, J.; Kim, K.; Kim, M. RnR-SMART: Resilient smart city evacuation plan based on road network reconfiguration in outbreak response. Sustain. Cities Soc. 2021, 75, 103386. [Google Scholar] [CrossRef]
- Redzuan, A.A.; Anuar, A.N.; Zakaria, R.; Aminudin, E.; Alias, N.E.; Yuzir, M.A.M.; Alzahari, M.R. A review: Adaptation of escape route for a framework of road disaster resilient. IOP Conf. Ser. Mater. Sci. Eng. 2019, 615, 012002. [Google Scholar] [CrossRef]
- Pregnolato, M.; Ford, A.; Wilkinson, S.M.; Dawson, R.J. The impact of flooding on road transport: A depth-disruption function. Transp. Res. Part D Transp. Environ. 2017, 55, 67–81. [Google Scholar] [CrossRef]
- Parkin, G.; Kilsby, C.; Glendinning, S.; Bransby, M.F.; Hughes, P.N. Climate-change impacts on long-term performance of slopes. Proc. ICE—Eng. Sustain. 2009, 162, 59–66. [Google Scholar]
- Chamorro, A.; Echaveguren, T.; Allen, E.; Contreras, M.; Dagá, J.; de Solminihac, H.; Lara, L.E. Sustainable Risk Management of Rural Road Networks Exposed to Natural Hazards: Application to Volcanic Lahars in Chile. Sustainability 2020, 12, 6774. [Google Scholar] [CrossRef]
- Haghighi, N.; Kiavash, S.; Fayyaz, S.K.; Liu, X.C.; Grubesic, T.H.; Wei, R. A Multi-Scenario Probabilistic Simulation Approach for Critical Transportation Network Risk Assessment. Netw. Spat. Econ. 2018, 18, 181–203. [Google Scholar] [CrossRef]
- Sakakibara, H.; Kajitani, Y.; Okada, N. Road Network Robustness for Avoiding Functional Isolation in Disasters. J. Transp. Eng. 2004, 130, 560–567. [Google Scholar] [CrossRef]
- Zahari, M.Z.M.; Zulkifli, N.A.M.; Mohamad, M.R.; Olabayonle, O.A.; Kadir, N.A.A.; Bachok, S. Route Planning For Crowd Management In Disaster Prone Areas. Plan. Malays. 2020, 18, 14. [Google Scholar]
- Kontogiannis, S.; Paraskevopoulos, A.; Zaroliagis, C. Time-Dependent Alternative Route Planning: Theory and Practice. Algorithms 2021, 14, 220. [Google Scholar] [CrossRef]
- He, Z.; Guan, W.; Ma, S. A traffic-condition-based route guidance strategy for a single destination road network. Transp. Res. Part C Emerg. Technol. 2013, 32, 89–102. [Google Scholar] [CrossRef]
- Campos, V.; Bandeira, R.; Bandeira, A. A Method for Evacuation Route Planning in Disaster Situations. Procedia—Soc. Behav. Sci. 2012, 54, 503–512. [Google Scholar] [CrossRef]
- Jenelius, E. Redundancy importance: Links as rerouting alternatives during road network disruptions. Procedia Eng. 2010, 3, 129–137. [Google Scholar] [CrossRef]
- Gecchele, G.; Ceccato, R.; Gastaldi, M. Road Network Vulnerability Analysis: Case Study Considering Travel Demand and Accessibility Changes. J. Transp. Eng. Part A Syst. 2019, 145, 05019004. [Google Scholar] [CrossRef]
- Berdica, K. An Introduction to Road Vulnerability: What Has Been Done, Is Done and Should Be Done. Transp. Policy 2002, 9, 117–127. [Google Scholar] [CrossRef]
- Oliveira, E.L.D.; Portugal, L.D.S.; Junior, W.P. Indicators of reliability and vulnerability: Similarities and differences in ranking links of a complex road system. Transp. Res. Part A 2016, 88, 195–208. [Google Scholar] [CrossRef]
- Hardiansyah; Muthohar, I.; Balijepalli, C.; Priyanto, S. Analysing vulnerability of road network and guiding evacuees to sheltered areas: Case study of mt merapi, central java, indonesia. Case Stud. Transp. Policy 2020, 8, 1329–1340. [Google Scholar] [CrossRef]
- Xu, X.; Chen, A.; Yang, C. An Optimization Approach for Deriving Upper and Lower Bounds of Transportation Network Vulnerability under Simultaneous Disruptions of Multiple Links. Transp. Res. Procedia 2017, 23, 645–663. [Google Scholar] [CrossRef]
- Mattsson, L.-G.; Jenelius, E. Vulnerability and resilience of transport systems—A discussion of recent research. Transp. Res. Part A Policy Pract. 2015, 81, 16–34. [Google Scholar] [CrossRef]
- Liu, J.; Lu, H.; Chen, M.; Wang, J.; Zhang, Y. Macro Perspective Research on Transportation Safety: An Empirical Analysis of Network Characteristics and Vulnerability. Sustainability 2020, 12, 6267. [Google Scholar] [CrossRef]
- El-Rashidy, R.A.; Grant-Muller, S.M. An assessment method for highway network vulnerability. J. Transp. Geogr. 2014, 34, 34–43. [Google Scholar] [CrossRef]
- Balijepalli, C.; Oppong, O. Measuring vulnerability of road network considering the extent of serviceability of critical road links in urban areas. J. Transp. Geogr. 2014, 39, 145–155. [Google Scholar] [CrossRef]
- Chen, A.; Yang, C.; Kongsomsaksakul, S.; Lee, M. Network-based Accessibility Measures for Vulnerability Analysis of Degradable Transportation Networks. Netw. Spat. Econ. 2007, 7, 241–256. [Google Scholar] [CrossRef]
- Iida, Y. Basic Concepts and Future Directions of Road Network Reliability Analysis. J. Adv. Transp. 1999, 33, 125–134. [Google Scholar] [CrossRef]
- Starita, S.; Scaparra, M.P. Assessing road network vulnerability: A user equilibrium interdiction model. J. Oper. Res. Soc. 2020, 72, 1648–1663. [Google Scholar] [CrossRef]
- Duan, Y.; Lu, F. Robustness of city road networks at different granularities. Phys. A 2014, 411, 21–34. [Google Scholar] [CrossRef]
- Sugishita, K.; Asakura, Y. Vulnerability studies in the fields of transportation and complex networks: A citation network analysis. Public Transp. 2021, 13, 1–34. [Google Scholar] [CrossRef]
- Buldyrev, S.V.; Parshani, R.; Paul, G.; Stanley, H.E.; Havlin, S. Catastrophic cascade of failures in interdependent networks. Nature 2010, 464, 1025–1028. [Google Scholar] [CrossRef] [PubMed]
- Chen, M.; Lu, H. Analysis of Transportation Network Vulnerability and Resilience within an Urban Agglomeration: Case Study of the Greater Bay Area, China. Sustainability 2020, 12, 7410. [Google Scholar] [CrossRef]
- Bono, F.; Gutiérrez, E. A network-based analysis of the impact of structural damage on urban accessibility following a disaster: The case of the seismically damaged Port Au Prince and Carrefour urban road networks. J. Transp. Geogr. 2011, 19, 1443–1455. [Google Scholar] [CrossRef]
- Bagloee, S.A.; Sarvi, M.; Wolshon, B.; Dixit, V. Identifying critical disruption scenarios and a global robustness index tailored to real life road networks. Transp. Res. Part E Logist. Transp. Rev. 2017, 98, 60–81. [Google Scholar] [CrossRef]
- Crucitti, P.; Latora, V.; Marchiori, M. Model for cascading failures in complex networks. Phys. Rev. E 2004, 69, 045104. [Google Scholar] [CrossRef]
- Muriel-Villegas, J.E.; Alvarez-Uribe, K.C.; Patiño-Rodríguez, C.E.; Villegas, J.G. Analysis of transportation networks subject to natural hazards—Insights from a Colombian case. Reliab. Eng. Syst. Saf. 2016, 152, 151–165. [Google Scholar] [CrossRef]
- Wakabayashi, H.; Iida, Y. Upper and lower bounds of terminal reliability in road networks: An efficient method with Boolean algebra. J. Nat. Disaster Sci. 1992, 14, 29–44. [Google Scholar]
- Yang, S.-R. Settlement Isolation Susceptibility due to Heavy Rain Caused Road Closure. Adv. Mater. Res. 2013, 723, 656–663. [Google Scholar] [CrossRef]
- Nicholson, A. Transport network reability measurement and analysis. Transportes 2003, 11, 49–62. [Google Scholar] [CrossRef][Green Version]
- Daganzo, C.F. Queue Spillovers in Transportation Networks with a Route Choice. Transp. Sci. 1998, 32, 3–11. [Google Scholar] [CrossRef]
- Li, L.; Cheema, M.A.; Lu, H.; Ali, M.E.; Toosi, A.N. Comparing Alternative Route Planning Techniques: A Comparative User Study on Melbourne, Dhaka and Copenhagen Road Networks. arXiv 2021, arXiv:2006.08475. [Google Scholar] [CrossRef]
- Feng, L.; Lv, Z.; Guo, G.; Song, H. Pheromone based alternative route planning. Digit. Commun. Netw. 2016, 2, 151–158. [Google Scholar] [CrossRef][Green Version]
- Jeong, Y.-J.; Kim, T.J.; Park, C.-H.; Kim, D.-K. A dissimilar alternative paths-search algorithm for navigation services: A heuristic approach. KSCE J. Civ. Eng. 2009, 14, 41–49. [Google Scholar] [CrossRef]
- Ghosn, M.; Dueñas-Osorio, L.; Frangopol, D.M.; McAllister, T.P.; Bocchini, P.; Manuel, L.; Ellingwood, B.R.; Arangio, S.; Bontempi, F.; Shah, M.; et al. Performance Indicators for Structural Systems and Infrastructure Networks. J. Struct. Eng. 2016, 142, F4016003. [Google Scholar] [CrossRef]
- Van Steen, M. An Introduction to Graph Theory and Complex Networks, 1st ed.; 2010. Available online: https://pages.di.unipi.it/ricci/book-watermarked.pdf (accessed on 6 December 2021).
- Rebaiaia, M.-L.; Ait-Kadi, D. Network Reliability Evaluation and Optimization: Methods, Algorithms and Software Tools. CIRRELT 2013, 79, 5–7. [Google Scholar]
- Henning, S.; Biemelt, P.; Abdelgawad, K.; Gausemeier, S.; Evers, H.H.; Trächtler, A. Methodology for Determining Critical Locations in Road Networks based on Graph Theory. IFAC-PapersOnLine 2017, 50, 7487–7492. [Google Scholar] [CrossRef]
- Bang-Jensen, J.; Gutin, G. Digraphs Theory, Algorithms and Applications; Springer: London, UK, 2002; pp. 1–38. [Google Scholar]
- Sohouenou, P.Y.R.; Christidis, P.; Christodoulou, A.; Neves, L.A.C.; Presti, D.L. Using a random road graph model to understand road networks robustness to link failures. Int. J. Crit. Infrastruct. Prot. 2020, 29, 100353. [Google Scholar] [CrossRef]
- JKR Malaysia. A Guide on Geometric Design of Roads; Arahan Teknik (Jalan) 8/86; Roads Branch, Public Works Department Malaysia: Kuala Lumpur, Malaysia, 2020. [Google Scholar]
- Needham, M.; Hodler, A.E. Graph Algorithms: Practical Examples in Apache Spark and Neo4j; O’Reilly Media: Sebastopol, CA, USA, 2019. [Google Scholar]
- Ahmadzai, F.; Rao, K.M.L.; Ulfat, S. Assessment and modelling of urban road networks using Integrated Graph of Natural Road Network (a GIS-based approach). J. Urban Manag. 2019, 8, 109–125. [Google Scholar] [CrossRef]
- Soltani-Sobh, A.; Heaslip, K.; Stevanovic, A.; Khoury, J.E.; Song, Z. Evaluation of transportation network reliability during unexpected events with multiple uncertainties. Int. J. Disaster Risk Reduct. 2016, 17, 128–136. [Google Scholar] [CrossRef]
Publisher’s Note: MDPI stays neutral with regard to jurisdictional claims in published maps and institutional affiliations. |
© 2022 by the authors. Licensee MDPI, Basel, Switzerland. This article is an open access article distributed under the terms and conditions of the Creative Commons Attribution (CC BY) license (https://creativecommons.org/licenses/by/4.0/).