1. Introduction
Everything we do in our daily life has some impact on the environment. Human awareness and the social responsibility of business are important for sustainability’s sustained improvement. Even though the internet and technological advances have improved human lives (e.g., communication, sanitation, transportation, health care, and entertainment), there are still some drawbacks of technology. Consider, for instance, environmental sustainability. Each online activity comes with a cost as it causes a few grams of carbon footprint emission, especially due to the data centers and servers needed to support the internet. Online services are associated with a carbon footprint from data centers, network infrastructures, and other heavy devices. For instance, CO
2 emissions of digital technology increased by 450 million tons since 2013 globally [
1]. It is still an arguable and debated topic, as to how this carbon footprint is best calculated. Therefore, we try here to analyze how much carbon dioxide is generated by online activity and to compare the results of four different calculation methods.
As of today, data centers are mostly used for organizational emails, internet, and online social interaction activities. A data center is a group of computer servers designed for processing, storing, and distributing a large amount of data. The main purpose of the data center is to manage user interactions with server-based software tools and web portals. Generally, data centers consist of 15 components such as redundant computing hardware setups, infrastructure, connectivity, cabling system, energy production system, networks, uninterrupted power supply, and automatic transfer switch devices [
2]. From the architectural perspective, the datacenter can be on-premises, hybrid or cloud-based. The hybrid data center is a combination of on-premises and cloud-based infrastructure that allows data to be shared over the network. Generally, the data center architecture is based on business needs.
Data centers are basically huge devices that consume high electrical power, water for cooling, and produce heat. A typical data center consumes 100 W/ft
2 while office buildings consume 7–10 W/ft
2. From 2000 and 2005, data center energy usage increased by 16.7%, then by 56% between 2005–2010 per year. Data center energy consumption amounted to 205 TW in 2018 and the amount rose to 416 TW in 2020 globally [
3]. As a result of Moore’s law, global data centers might consume between 658 TW and 752 TW per hour by 2030. In recent years, user-to-data center IP traffic has been increased due to a large volume of data transfer such as live video streaming or videos. According to Cisco Systems’ data center, the annual growth of each component between 2016 and 2020 is as follows: application workloads—18.6%, storage—31.2%, networking—24.7%, respectively. Comparing traditional data centers to cloud data centers, a cloud data center is more efficient in terms of energy consumption. IP traffic, due to 5G and mobile device usage, is estimated to increase at 25.2% average growth for data-to-user and at 32.7% for data center-to-data center traffic. Data center storage will also increase to meet a growth of social networking storage needs of 35.6% and 37% exclusively in 2021 [
4].
Data centers consume a lot of energy and water, which contributes to carbon dioxide emissions that are harmful to the environment. However, data centers have been redesigned by means such as reducing water consumption using water-cooling technology, green power to reduce electricity consumption, and recycling programs, in order to reach sustainability goals. The growth in data centers and electricity use of servers increase carbon dioxide (CO2) emissions. While there is an industry adopted metric of PUE (power usage effectiveness) defined by the Green Grid consortium, there is currently no commonly agreed methodology of measuring the PUE because data center operators can define non-IT facility/IT equipment energy differently [
2].
According to U.S. Energy Information Administration (2020), the global data centers consumed 205 billion kWh, using around 4.4 kg CO
2/kWh. In contrast, average coal mining factory emissions are 4 times less than data centers—around 1 kg CO
2/kWh. A globally increasing number of internet users creates a demand for data center services while new forms of technology and information services accelerate the demand rapidly. Another example is that watching 30 min of Netflix generates 1.6 kg of CO
2, which is the same as driving 4 miles. Netflix streaming services consume 370 TWh per year which is 1.8 times larger than the combined total for the world’s data centers [
5].
One of the Shift Project findings was that one hour of watching online video streaming consumes 6.1 kWh which is the same as driving an electric car more than 30 km, using LED power for more than a month constantly, or boiling a kettle for three months. Recent studies have shown how much energy and electricity have been consumed for Information Communication Technology but how this online habit impacts the environment is less analyzed. Understanding environmental sustainability and consumption behaviors are the most important factors of being sustainable. However, individuals have less information about how our daily simple internet surfing habits contribute to carbon footprint [
6].
Energy and electricity consumption are getting more demanding due to the internet of things and blockchain technologies. There are 23 papers that estimated the carbon footprint of data centers, networks, or general consumption of ICT (Information and Communication Technology). However, some papers overestimated or underestimated electricity consumption by not including the contribution of data centers. Therefore, this paper aims to define the carbon emission of top-visited online applications using four different calculation formulas. The paper consists of two main sections. The first presents previous research papers and findings on this topic and the second presents an analysis and estimation of online activities used by many people.
2. Literature Review
Dinesh et al. [
7] stated that the world’s ICT (Information and Communication Technology) infrastructure nearly consumes 1500 TWh of electricity, around 10% of global usage, and ICT accounts for 2% of global carbon emissions, with the data centers. The concept of a green data center is now getting more popular, which is a system whereby mechanical, lighting, electrical, and other types of equipment are designed for minimum environmental impact and maximum energy efficiency. The concept of the green data center is Reduce (reducing resources), Reuse (reusing resources), Recycle (recycling resources) and Renew (use renewable resources). In other words, green data center metrics are carbon footprint, heat reuse, water efficiency, and renewable energy [
7].
A carbon footprint is the total greenhouse gas emissions caused directly and indirectly by individuals, organizations, or a product. Generally, the carbon footprint can be defined as the full life cycle of carbon equivalent emissions and effects from all products and services. The ICT sector includes all consumer and corporate devices. The World Economic Forum highlights that the ICT and E&M (Entertainment and Media) sector has a large impact on the environment due to its carbon footprint, energy consumption, and the supply of energy [
8]. In recent years, the growth of ICT footprints, carbon emissions, and energy consumption has accelerated. A study for Sweden showed that ICT sector data traffic has increased 4 times and carbon footprint (CO2) has increased 6 times between 2005 and 2015. From the analysis done by Jens et al. (2016), use of smartphones is the largest carbon footprint producer among all devices. A wide range of Internet of Things devices such as home appliances, security systems, and smart speakers are becoming increasingly available with an always-on connection to the internet. It can be concluded that using technology is more harmful than manufacturing the device itself [
9].
As mentioned by the Cisco report, the data centers’ traffic has grown 23% between 2013 and 2018 and this growth might continue, as global IP traffic is expected to increase from 1400 EB (2010) to 156,000 EB in 2030 [
10]. The International Energy Agency (IEA) estimated that world electricity demand will increase from 20,000 TWh to 28,000 TWh in 2030. In a worst-case scenario, the electricity usage (TWh) of data centers will be 7922 TWh and expected electricity usage around 2967 TWh in 2030. Anders et al. estmate that in 2030, global ICT electricity usage will increase 51% in the worst case, while the best-case scenario will be 21% growth [
11]. In 2010, global data center electricity consumption was 400 TWh and the number doubled by 2020 as it reached to 800 TWh [
12].
According to the IPCC (Intergovernmental Panel on Climate Change), CO2 emissions need to decrease by 45% by 2030, but emissions have been increasing annually. By Salahuddin and Alam’s data analysis, a one percent increase in internet users will raise electricity consumption by 0.026%.
Data centers or technological advances have a direct impact on energy and electricity consumption but make some positive contributions to quality of human life, sustainable innovation, productivity, and economic growth. In some countries, such as India or China, ICT plays an important role in the country’s GDP growth [
13]. Mohammad et al.’s study has investigated the correlation between economic growth and electricity consumption [
14]. The study findings were that 1% of economic growth will cause 0.13–0.25% rise in electricity consumption based on the data between 1985 and 2012.
From the sustainability perspective, ‘green ICT’ and ‘ICT for green’ concepts have been discussed in recent studies. Gains in environmental efficiency are said to constitute green ICT and green ICT can support sustainable development. Moreover, ‘ICT for green’ aims to enhance energy efficiency by using ICT products and services. Although data centers consume a large amount of electricity, a few studies have investigated several types of server models and water-cooling systems which would help to reduce electricity consumption [
15].
Nowadays, a cloud data center is the main function to support enterprise business operations. With a cloud data center, clients can run their applications and manage their data within a virtual infrastructure that runs on the cloud servers [
16]. With increasing numbers of internet users in the world, the data centers’ demand hugely increases energy consumption. While operation costs of data centers increase, on the other hand, prices of hardware decrease. The energy use distribution of a data center is server—70%, access switch—15%, aggregation switch—10%, and core switch—5% [
17]. However, there are ways to build a more sustainable data center: for instance, energy-saving data network equipment which can save energy by 20–50% [
18], a data center cooling model [
15], and a green data center [
17].
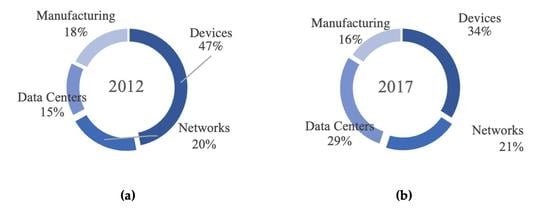
Cisco, one of the biggest global computer networking companies, analyzes and forecasts global internet adoption, device/connection, and network performance annually. According to Cisco’s annual report [
10], devices connected to the internet per person increased from 2.1 in 2015 to 3.3 in 2020 on average, while video streaming services escalated almost 25% per year globally. This raises energy and electricity consumption in both network and data centers as shown in
Figure 1. Internet video such as Netflix or YouTube or live video streaming consumption almost doubled as did use of the web, file sharing, IP VOD, and gaming [
10].
As Mike Berners-Lee (2020) mentioned in the book “How bad are bananas?”, daily calls and messages using mobile data generate 70 kg CO
2. The internet generates about 3.7% of global greenhouse emissions [
1], such as 0.3 g CO
2 per spam email, 50 g CO
2 per email with an attachment [
19], and 1.76 g CO
2 per uses of web browser per page view, respectively [
20]. The studies found that having one hour of video conference produces approximately 43 kg CO
2 [
21] and watching online videos generates 300 million tonnes of CO
2 a year [
22]. In of 2019, 34 billion pieces of equipment with 4.1 billion internet users in the world, generated 1400 million tons of greenhouse gases and used 6800 TWh energy. The number of devices will rise by 50% and the digital footprint will double or triple in 2025 [
23]. Another study [
24] showed that the carbon footprint of ICT in 2015 was similar to 2010 due to energy-efficient devices and smartphone usage.
3. Materials and Methods
This study is based on secondary data of four popular applications (YouTube, Facebook, Netflix and TikTok) watch hours, the number of users and calculation method defined by the report [
1]. Also, it deals with the carbon footprint of internet activities using the four different methods of ‘The Shift Project Method’ (from a non-profit which aims to limit climate change) [
1], ‘Andrae’s Method’ [
25], ‘Obringer’s Method’ [
26] and ‘Hintemann’s Method’ [
27]. They have calculated and formulated the methods to measure how much CO
2 is generated by internet activity. Some methods are based on the network and its energy consumption while others are focused on user device and screen resolution. The impacts of energy, device, network, and electricity impacts are considered. A detailed comparison of the methods is described below in
Table 1 [
1].
Those four analyses all considered and included watching hours, type of device (smart phone, computer), data center, and networks (Wi-Fi, cellular data). Obringer et al. [
26] provided the results without specifying how they calculated them. They claimed that they used both top-down and bottom-up methods. In the following section the formulas used to calculate online activities are presented. Based on their gathered data such as watch hours, resolution, electricity consumption, and average data, the author used backward calculation in order to get the calculate of CO
2. First, electricity intensity is calculated and then energy impact. This is converted into carbon dioxide measurement. After getting CO
2 kg/kWh, then multiply by the number of users.
Energy impact of online activity:
3.1. According to the Shift Project
TSP model included viewing time, device as laptop and smartphone, network type as Wi-Fi and cellular data and region. Their assumptions were as follows [
1,
2]:
Electricity consumption:
Laptop: 0.00034 kWh/min
Energy impact:
WIFI: 0.000000000152 kWh/byte
Energy impact:
0.000000000072 kWh/byte (Comes from: “1 PB~72 MWh”)
Average emission of 0.519 kg CO2e/kWh per hour
Findings: By using such data and their method, the author calculates according to their formula as follows:
Device × watching time + Data size × (Data center impact + Network Impact). Then, as a result 1 h of streaming (0.54 kWh) at 1080p by laptop [
1].
After that, calculating emissions: Average emission (0.519 kg CO2/kWh) × 0.54 kWh × 1000 = 280.26 g CO2.
3.2. According to Andrae 2020
The Andrae method is aimed to measure electricity consumption including data centers, Wi-Fi and fixed access, devices as mobile phone, laptops, TVs, and other internet connected devices. Andrae’s assumptions were as follows [
1,
3,
4]:
Electricity intensity: 0.18 kWh/GB
Wi-Fi: 0.07 kWh/GB
Fixed access networks data centers: 0.015 kWh/GB
1 h of video streaming: 202 kg CO2e
Total: 0.265 kWh/GB, excluding devices
Per hour: 1 GB–3 GB of data, 2 h per day on weekdays, 4 h on weekends
Findings: By using Andrae’s estimation as mentioned above, calculating the days: 2 × 52 weekends × 4 + 260 weekdays × 2 = 936 h per year.
936 h × 3 GB of data (per hour) = 2808 GB of data
285 kWh/936 h = 0.304 kWh 1 h of video streaming which is 72 g of CO2 per GB.
3.3. According to Hintemann and Hinterholze
The top-down approach is used for this method. First, total energy was calculated and then compared to the volume of streaming data in GB. Watching one hour of HD resolution needs 220–370 watt of electricity which is about 100–175 g of carbon dioxide. This calculation is based on energy only and considers data centers, network, and devices [
1,
5].
Data centers electricity: 0.0321 kWh/GB
Fixed network: 0.075 kWh/GB
Total: 0.1071 kWh/GB
Findings: 1 h of video streaming: 220–370 watt/hours = 100–175 g CO2
3.4. According to Obringer et al.
Networks—24% of ICT electricity consumption; devices are 80% which equals to 0.31 = 0.248 while data centers’ electricity consumption is 25% = 0.113. Then, adding networks, devices, and data centers will be 0.24 + 0.248 + 0.113 = 0.601. Streaming video uses 304,920 GWh per year [
1,
6].
1 h of video streaming:
1080p: ~1.9–2.55 GB/hour (average 2.255)
4K: ~ 3.5–7 GB/hour
Energy intensity: 4.91 kWh/GB
Carbon footprint = 0.0007-ton CO2
Findings: Watching one hour of video online with 4K resolution produces 280.26 g CO
2 emission according to the formula. Detailed explanations are presented in
Table 2 [
1].
4. Results
Table 2 shows the carbon footprint of internet activities per hour by watching hours based on four different methods based on [
1,
11,
25,
26,
27,
28]. The main differences were the time spent on the actions and the data size of the video. They all gathered the data in a different way which may explain the different results. Andrae highlighted that a wireless network uses less energy as his method is based on networks and electricity consumption, while Hintemann and Hinterholze’s focused on resolution and user device. They pointed out that data volumes increase more than the electricity demand of networks and data centers. Only Obringer et al. considered water and land footprint in their assumptions. They proposed calculations of carbon, water, and land footprints in several different countries. Obringer et al.’s assumptions were 7 GB per hour of 4K resolution while Andrae’s was 3 GB. Those four methods have their own characteristics: Obringer et al. calculated from the environmental sustainability perspective while Hintemann and Hinterholze’s method was focused on the device and resolution. Andrae’s method is useful, giving an estimation of best-and-worst case scenario.
The calculation is as follows. One hour of video streaming produces on average 135 g CO
2 according to [
27], while it would be 13.5 g CO
2 by using Facebook. If we compare YouTube watching hours to the other three applications, then Netflix has 6 times more, Facebook 0.1 less and Tiktok has 2 times more watching hours than YouTube. Netflix is watched by 6 times more than YouTube, and multiplying by 6 equals (280.26 g—YouTube) to 1681.56 g CO
2e. The same multiplication applies to the other applications. The results shown in
Table 3 are based on the author’s calculation.
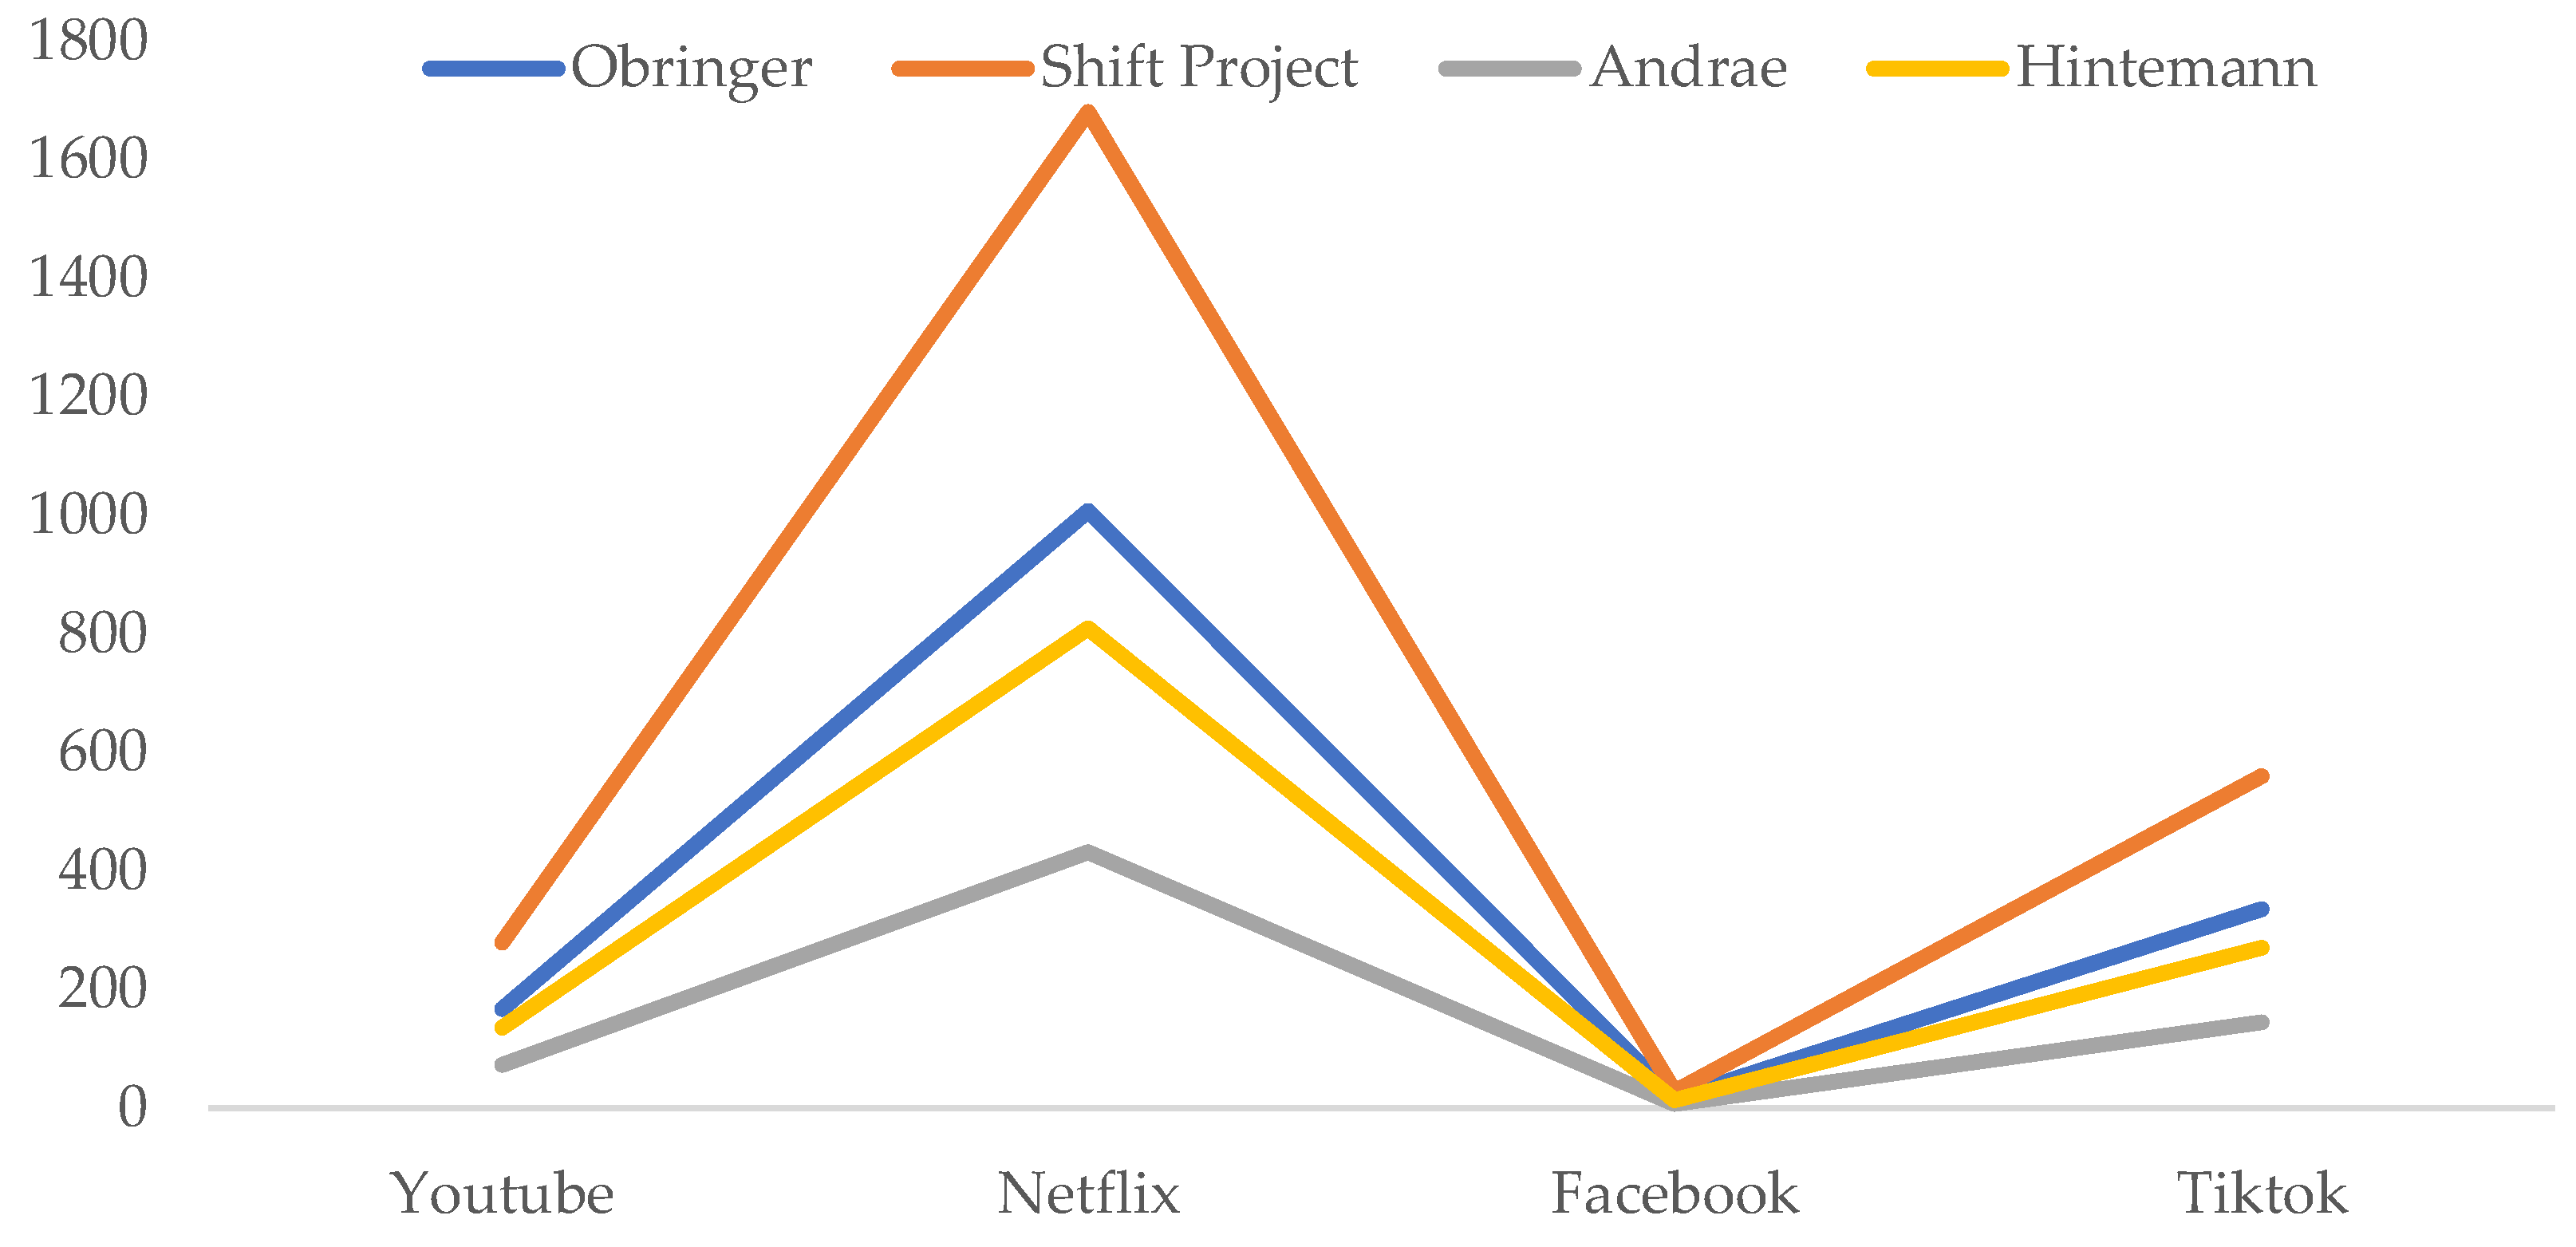
Even YouTube’s carbon dioxide per hour is less than Netflix’s, but the amount increases when we calculate it by the number of users. As shown in the below chart, the Hintemann and Hinterholze calculation gave the highest estimate among all four methods while the lowest was Obringer. As illustrated in
Figure 1, the comparison has shown that each calculation method gives different results.
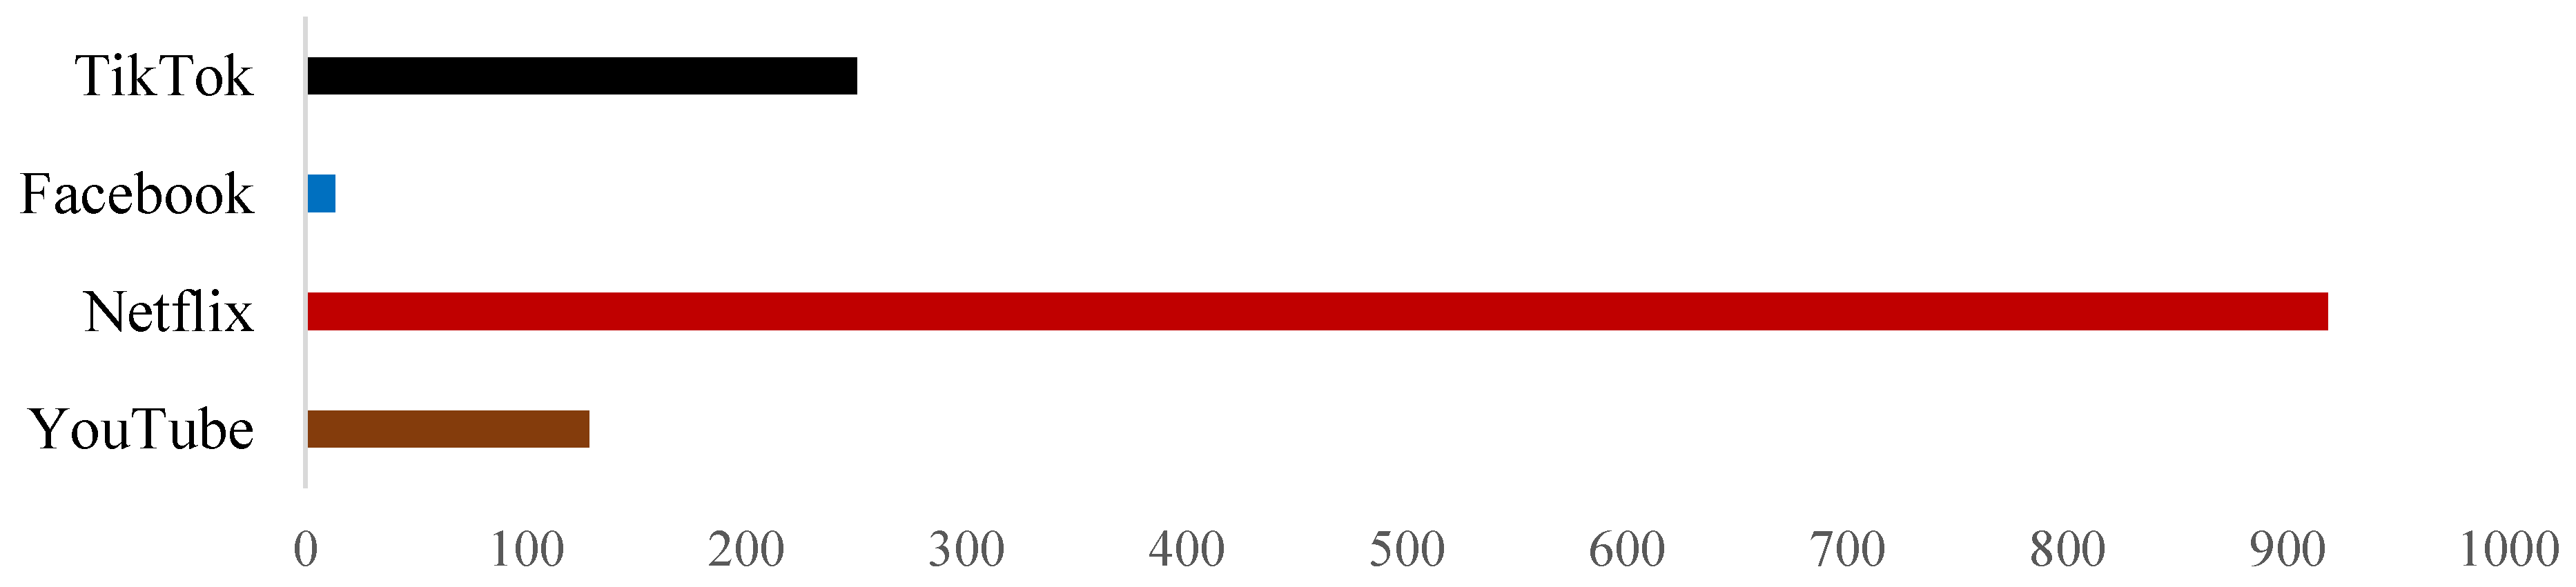
The average result of the above 4 methods is shown below in
Figure 2. Netflix generates the highest CO
2 among the four applications due to its high resolution, the number of users, and its watching hours.
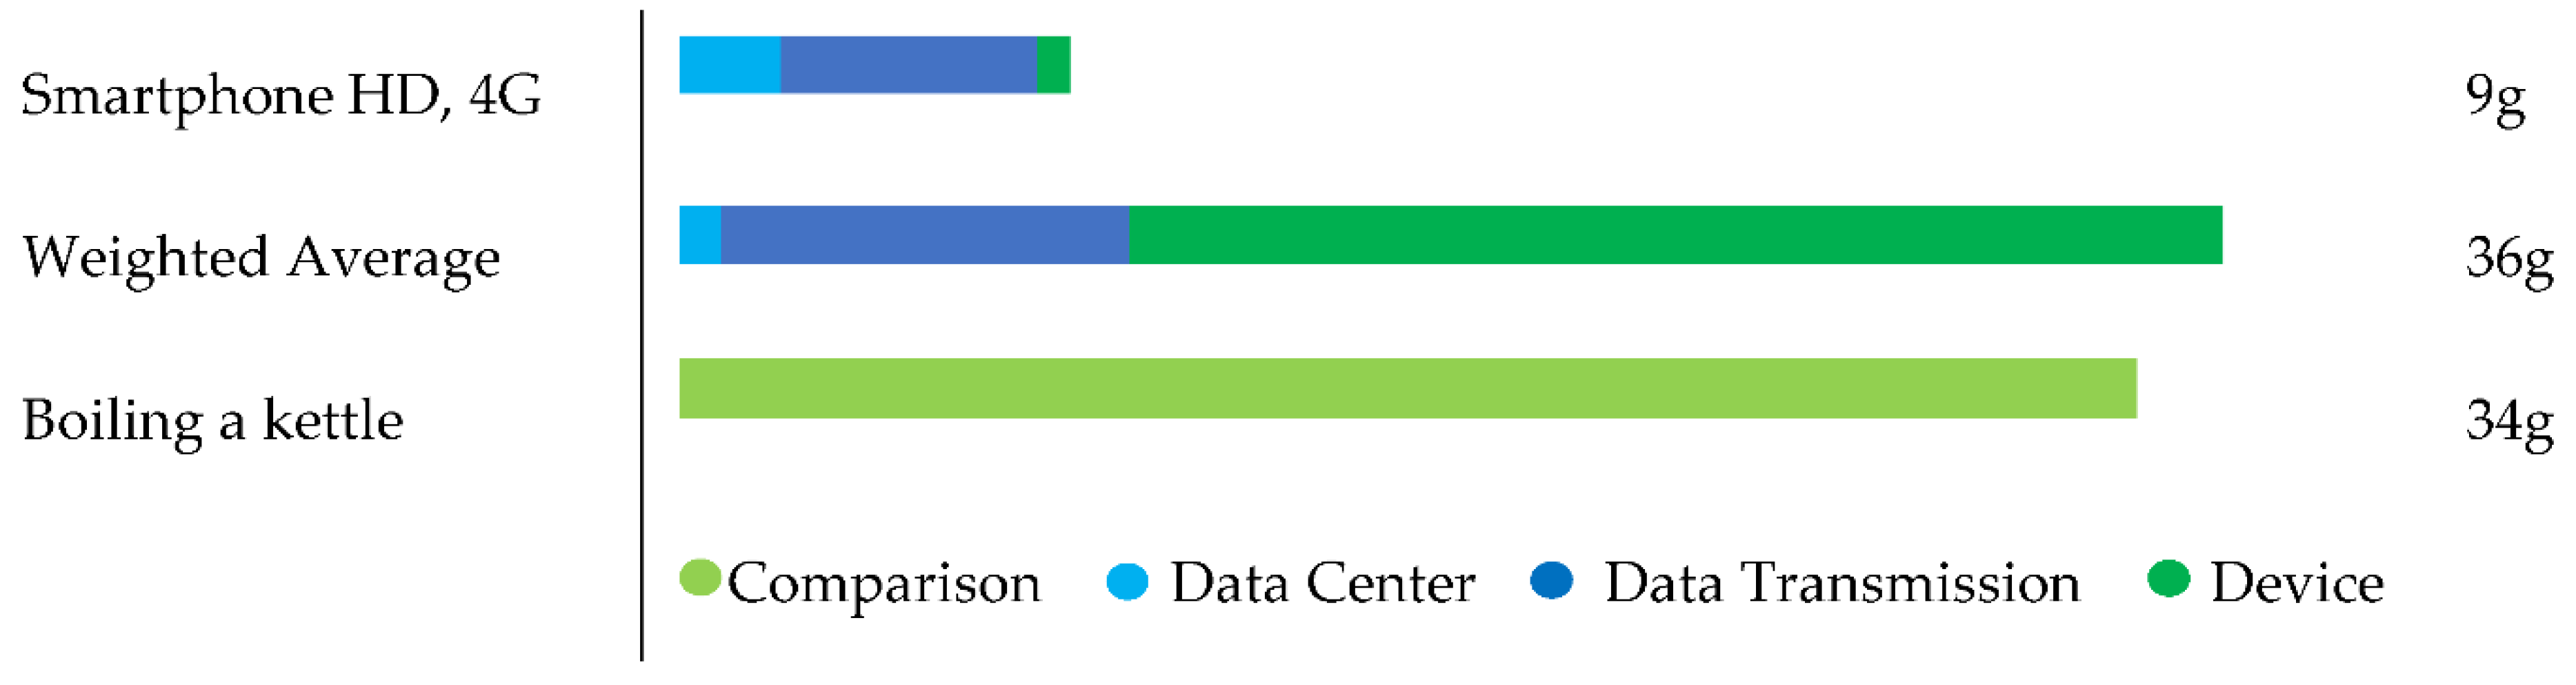
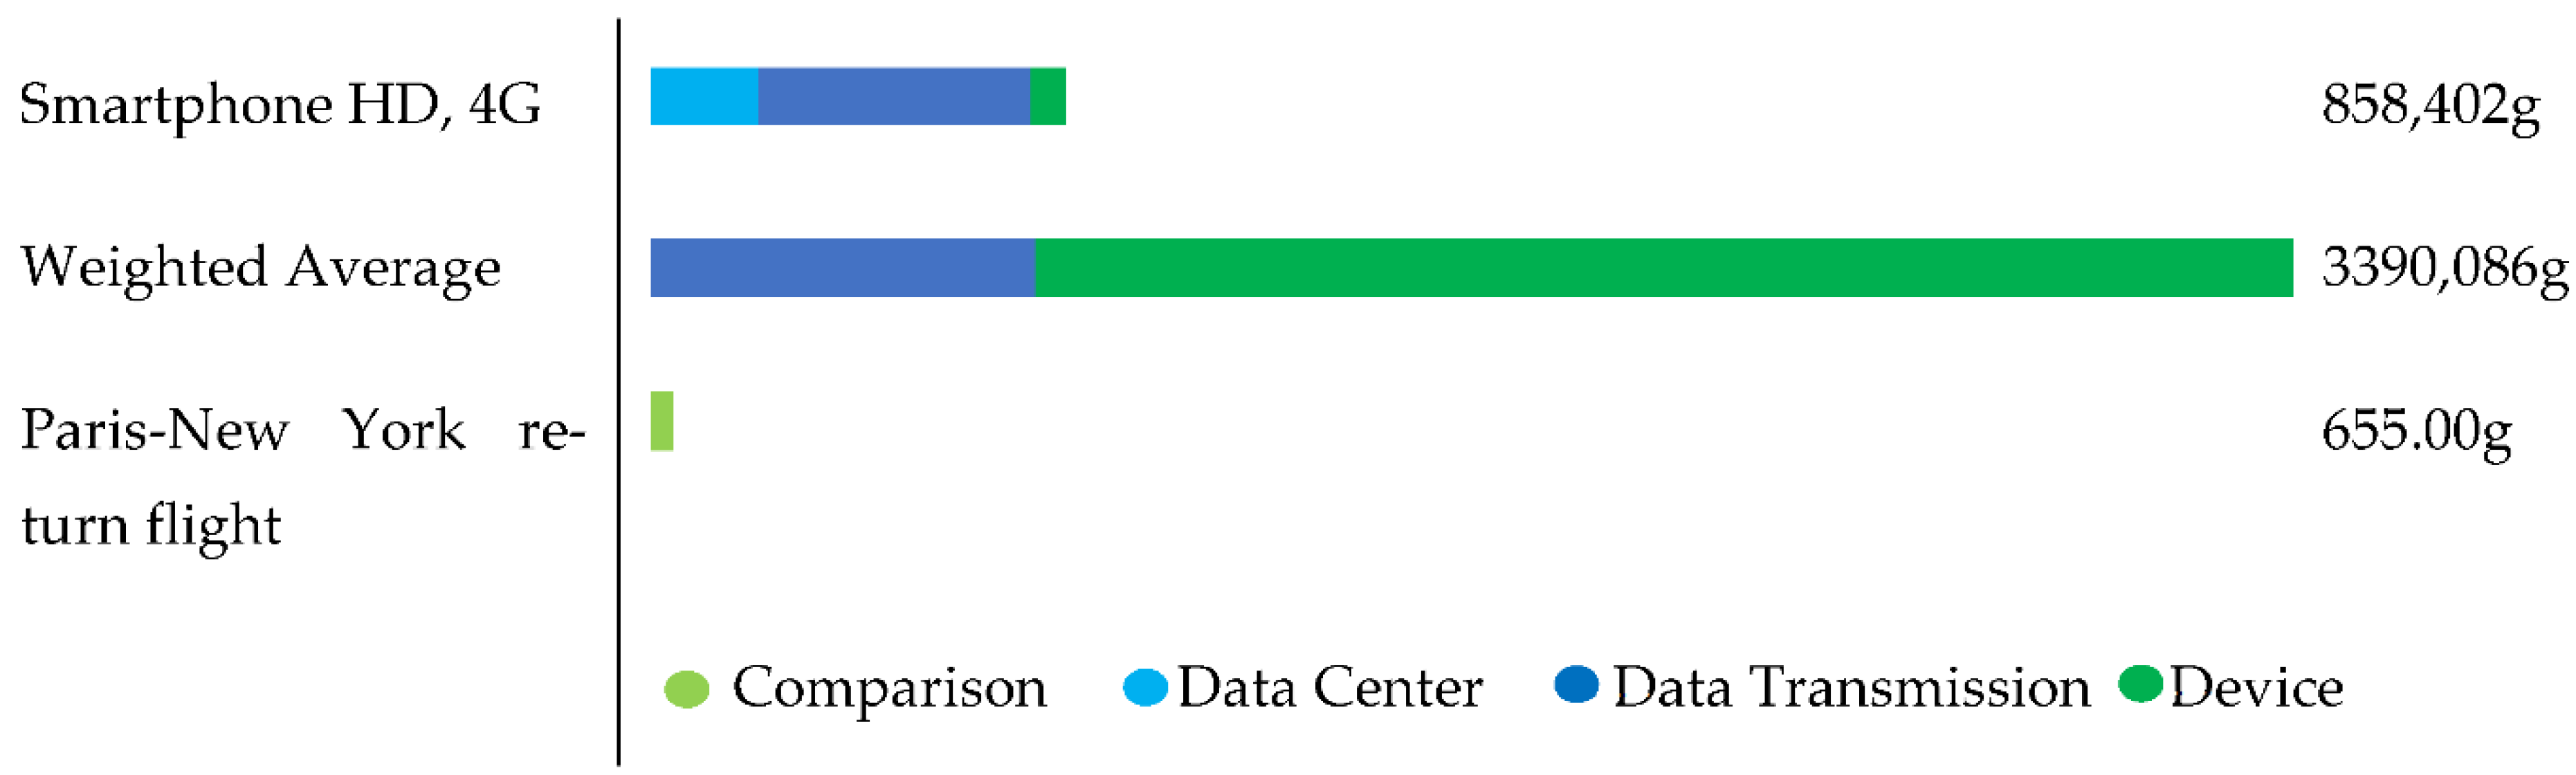
The second main purpose of this paper is to publicize the carbon footprint of internet activity. Most people think the internet and ICT have less harmful effects on the environment. If we compare the result for boiling water or a Paris to New York two-way flight as shown in
Figure 3, then 1 h of video streaming is almost the same as boiling a kettle. but if we consider day-long use as
Figure 4, then it generates 13 times more CO
2 than the flight. Thus, internet activity as watching online video or internet surfing is considered as an invisible pollutant that generates a substantial carbon footprint.
6. Conclusions
Using social media is one of the invisible polluters that affects the Earth’s air, water, and noise. There is a substantial infrastructure constantly running behind each internet activity such as network devices, data center machines, ISP routers, etc., which consumes a lot of energy. Hence, the growing number of internet users and social media trends have contributed to the increase of carbon footprint.
Therefore, this paper aims to analyze how social media platforms (data center) produces a carbon footprint and how much CO2 is generated by an hour of use. YouTube, Netflix, Facebook, and Tiktok were selected as the most popular social media applications. In order to calculate the CO2 emissions, four different methods were chosen and compared. The disparity among the four chosen methods is quite high as according to the Shift project, watching online video for per hour produces 280.26 g CO2 as contrasted to 72 g CO2 by the Andrae method, based on author’s calculation.
By estimating the CO2 emissions of the four applications based on their data, watching one hour of video by Netflix produces 6 times more CO2 than watching YouTube, with an estimate for Netflix of 1681.56 g CO2e per hour. Netflix is the most used application with the highest CO2 emissions among the four applications we compared.
Since it is impossible to limit internet users, we need to implement more green data centers, renewable energy, and energy-efficient ways of internet usage. It is important to measure the performance in order to achieve sustainability goals. Furthermore, research and innovations are needed to improve the existing technology so that it supports environmental sustainability.


