Article

How to Achieve Passenger Satisfaction in the Airport? Findings from Regression Analysis and Necessary Condition Analysis Approaches through Online Airport Reviews

1
School of Civil Aviation, Ballıca Campus, Samsun University, Samsun 55420, Turkey
2
Graduate School of Social Sciences, Yunus Emre Campus, Anadolu University, Eskişehir 26210, Turkey
3
Faculty of Aeronautics and Astronautics, Iki Eylül Campus, Eskişehir Technical University, Eskişehir 26555, Turkey
4
Faculty of Business, FPT University, Hanoi 100000, Vietnam
5
Department of Business Management, National Taipei University of Technology, Taipei 10608, Taiwan
*
Author to whom correspondence should be addressed.
Sustainability 2022, 14(4), 2151; https://doi.org/10.3390/su14042151
Submission received: 17 January 2022 / Revised: 3 February 2022 / Accepted: 7 February 2022 / Published: 14 February 2022
(This article belongs to the Special Issue Aviation Management and Air Transport Industry II)

Abstract

:
Delivering high-quality service to passengers can be critical for an airport’s survival, competitiveness, profitability, and long-term growth in a highly competitive environment. The present study aims to examine the relationship between airport service attributes and passenger satisfaction. To this end, we conducted multi-method research consisting of symmetric (multiple regression analysis—MRA) and asymmetric (necessary condition analysis—NCA) approaches. The research data consists of 1463 valid online reviews (n = 1463) of the top 50 busiest airports in Europe retrieved from Skytrax. The MRA was employed to examine the net effect of the eight airport service attributes on passenger satisfaction, while the NCA was used to explore the necessary conditions and level of necessity to achieve passenger satisfaction. Using MRA, the findings reveal that airport staff is the most influential predictor of passenger satisfaction, whereas airport shopping and airport Wi-Fi connectivity do not have a significant effect on passenger satisfaction. Moreover, the NCA results found that six of the eight conditions are necessary to achieve passenger satisfaction at the airport. To complement and comprehend the findings, this study also sheds light on the antecedents underlying airport passenger satisfaction in the post-COVID-19 era using NCA.

1. Introduction

The air transport industry is a business that has been growing and taking shape in a highly competitive environment. According to the International Civil Aviation Organization (ICAO) statistics, annual passenger traffic increased by 3.6% compared to the previous year and reached 4.5 billion in 2019. Furthermore, the number of departures was recorded as 38.3 million in 2019, up 1.7% from the previous year [1]. Following this growth, the impact of the COVID-19 pandemic on the air transport industry has been devastating. Despite the challenges posed by COVID-19, the aviation industry is optimistic, with passenger traffic expected to reach 8.2 billion by 2038, growing at an annual rate of 3% on average [2].
While governments initially owned and operated airport terminals, the commercialization and privatization movements ushered in a significant paradigm shift [3]. As a result of increased competition brought about by commercialization and privatization, an environment has developed in which airports place a premium on service quality and customer satisfaction in order to survive. Therefore, airport operators’ primary concern is monitoring and improving service quality and passenger satisfaction [4]. This concern is entirely justified, as Airport Council International (ACI) reports that a 1% increase in customer satisfaction results in an average 1.5% increase in non-aeronautical revenue [5]. Thus, it is critical for airports, particularly large international airports, to understand service quality perceptions to gain a competitive edge and maximize non-aeronautical revenues [4,6].
The foregoing importance of airport service quality has received increasing attention from scholars. In this context, a plethora of research has frequently discussed airport service quality attributes and their pivotal role in customer satisfaction [3,7,8,9]. In doing so, scholars mainly used traditional methods, such as regression analysis or structural equation modeling (SEM), to quantify these complex relationships [6,9]. Such approaches are useful for elucidating the net effects of variables but fail to handle the complexity of the causal relationships that exist in an asymmetrical manner in the practical world [10]. To address this gap, this study aims to examine the relationship between airport service attributes and passenger satisfaction from both symmetric and asymmetric perspectives through the combined use of multiple regression analysis (MRA) and necessary condition analysis (NCA; see Figure 1). The MRA typically identifies factors that contribute to or detract from the expected outcome, whereas the NCA determines whether these antecedents are necessary to generate the expected outcome [11]. Although NCA is a relatively new method, it has received increasing attention from the business research literature [11,12,13].
This study contributes to the literature in a number of ways. Given that the expected outcome does not occur without the necessary predictors, the necessary conditions are critical in terms of both theory and practice [14]. Although previous research has taken a symmetrical approach to examining the antecedents of passenger satisfaction at the airport, the necessity of the antecedents has remained unexplored. In this regard, this study is the first empirical attempt to analyze the must-have antecedents to achieve passenger satisfaction using NCA. Second, this study presents findings from both the pre-COVID-19 and, complementarily, post-COVID-19 periods, highlighting which service attributes are the key success factors for passenger satisfaction. In doing so, it sets out findings based on sufficiency and necessity logic. Lastly but most importantly, the analysis of online reviews in the airport sector has remained an under-researched area in the literature [15]. Therefore, this study offers an innovative and alternative method based on the asymmetric analysis of online reviews using the NCA approach in air transport research.
The remaining sections of the paper are organized as follows. Section 2 summarizes the pertinent literature and formulates the proposed hypotheses. Section 3 details the data collection process and explains research methods. The results of the MRA and NCA are discussed in Section 4. To complement current study findings, Section 5 examines the necessary conditions for post-COVID-19 passenger satisfaction. Finally, Section 6 discusses the findings while setting out limitations and avenues for future research.

2. Literature Review and Hypotheses Formulation

2.1. Airport Service Quality and Dimensions

The world is currently undergoing a pandemic crisis of COVID-19. However, optimistic forecasts indicate that the aviation industry will reach its 2019 level by 2024 [16]. Both the mitigation of the pandemic and the gradual improvement of welfare will increase global and regional demand for air travel [4]. Thus, it is likely that there will be a more competitive environment for airports, and passengers will have more airport options [9]. It is worth noting here that airport competition is moderated by several factors. One of these factors to consider is whether the airport has a unique catchment area [17]. According to Graham [18], competition is weakest when an airport is located on an island or in a remote area. For example, while only one airport serves tourism destinations such as Sharm El-Sheikh, Rhodes, Palma de Mallorca, more than one airport competes in destinations such as Paris (Charles de Gaulle and Orly) and London (Heathrow, Gatwick, Stansted, City and Luton). In this regard, it should be noted that in the Rhodes and Palma de Mallorca cases, there was no competitive pressure on the airport management to improve service levels [17]. Customer perceptions of service quality and satisfaction stand out as an important performance indicator for management, especially for competitive ones [19] since providing high-quality services creates a critical competitive advantage and increases profitability significantly [3]. Therefore, airport service quality (ASQ) should be considered at the same level of importance as concepts such as profitability and competitive advantage and should be carefully considered [9].
In airport literature, the term “service quality” refers to superiority or excellence in service delivery [20,21]. In other words, service quality reflects the gap between customers’ expectations and the perception of the service received [22]. Therefore, the most critical step in defining and delivering high-quality service is to understand what passengers expect. Meeting or exceeding passenger expectations results in passenger satisfaction with the services offered by the airport [23]. Passenger satisfaction strengthens customer loyalty and purchase intention while improving airport operators’ overall business performance [24]. Thus, airport managers must prioritize ASQ because it is inextricably linked to customer satisfaction, airport efficiency, and non-aviation revenues [19,22].
Although numerous studies have been conducted on airline service quality, there is a dearth of literature on airport services [4]. The first few studies in this field, which date back to the 1980s, focused on the level of services in airport terminals. Following the 1990s, as commercialization and liberalization increased, scholars placed a premium on understanding customers’ needs and perceptions of terminal services [25]. In the 2000s, efforts to understand customer needs shifted from a managerial point of view to a consumer point of view. In addition, the number of studies addressing the effect of airport service attributes on passenger satisfaction has increased rapidly in recent years [26] (see Table 1). Given the dynamic nature of airport operations, it is necessary to understand the relationships between ASQ and behavioral outcomes such as customer satisfaction and customer loyalty [4].
When Table 1 is carefully examined, it becomes clear that scholars have conducted ASQ studies in various parts of the world. Several of these studies examined multiple airports in order to conduct a more comprehensive analysis. While surveys have been frequently used as a data source, the use of primary data has been a common practice in the extant literature. However, secondary data is an alternative data source that has recently been used in ASQ assessment [15,34]. These data, derived from passengers sharing their experiences regarding airport services across various platforms, are less susceptible to the social desirability effect and have broad representativeness [28,35]. Methodologically speaking, it is clear that ASQ research employs a variety of advanced techniques, including CA, QFD, DLM and OLR. It is worth noting, however, that the most frequently used methods are SEM and MCDM. That is, the existing literature frequently discusses service attribute prioritization and the impact of airport service attributes on a variety of behavioral outcomes. However, these studies did not specify the extent to which service attributes are likely to exist or whether they should be necessary. Therefore, there is a need for complementary methods that establish the necessity of airport service attributes. Consequently, this study attempts to bridge this gap by utilizing the novel NCA method to identify the necessity of airport service attributes.

2.2. Online Passenger Reviews

We live in a digital age, and online reviews, also known as electronic word of mouth, are critical components of service systems [36]. Online reviews reflecting customers’ experiences provide information about products, services and brands and allow customers to voice their experiences [37]. Customers share their service experiences on public online platforms such as Google and Twitter, as well as on travel-related platforms such as TripAdvisor and Skytrax [28]. Via these platforms, it is always possible to access online reviews that are independent of time and place and have a high spread rate [38]. Therefore, customer feedback via online platforms contributes to the growth of electronic word of mouth [39].
Through online review platforms, customers can freely rate and evaluate the services they have received [38]. Passenger voices are louder and stronger than ever before, thanks to the growing popularity of such platforms [40]. This situation benefits both passengers and airport operators in a variety of ways. Customer-generated online reviews have a significant impact on the decision-making process of potential passengers, as they are considered objective and reliable information [7]. From the managers’ point of view, customer reviews provide a wealth of data that enables real-time customer feedback analysis. Thus, online customer reviews provide a cost-effective and timely method of gathering consumer feedback in the air transport industry [36].
Online reviews have been used as secondary data in many areas of marketing applications, ranging from pricing [41] to brand management [42]. With the widespread use of Web 2.0 in recent years, online customer reviews have been suggested as an alternative method for assessing ASQ, as passengers express their opinions more frequently about service providers (i.e., airports) [28,40]. As a result, large volumes of online reviews amplify customers’ voices, allowing for more effective ASQ strategies to be monitored and developed [39].

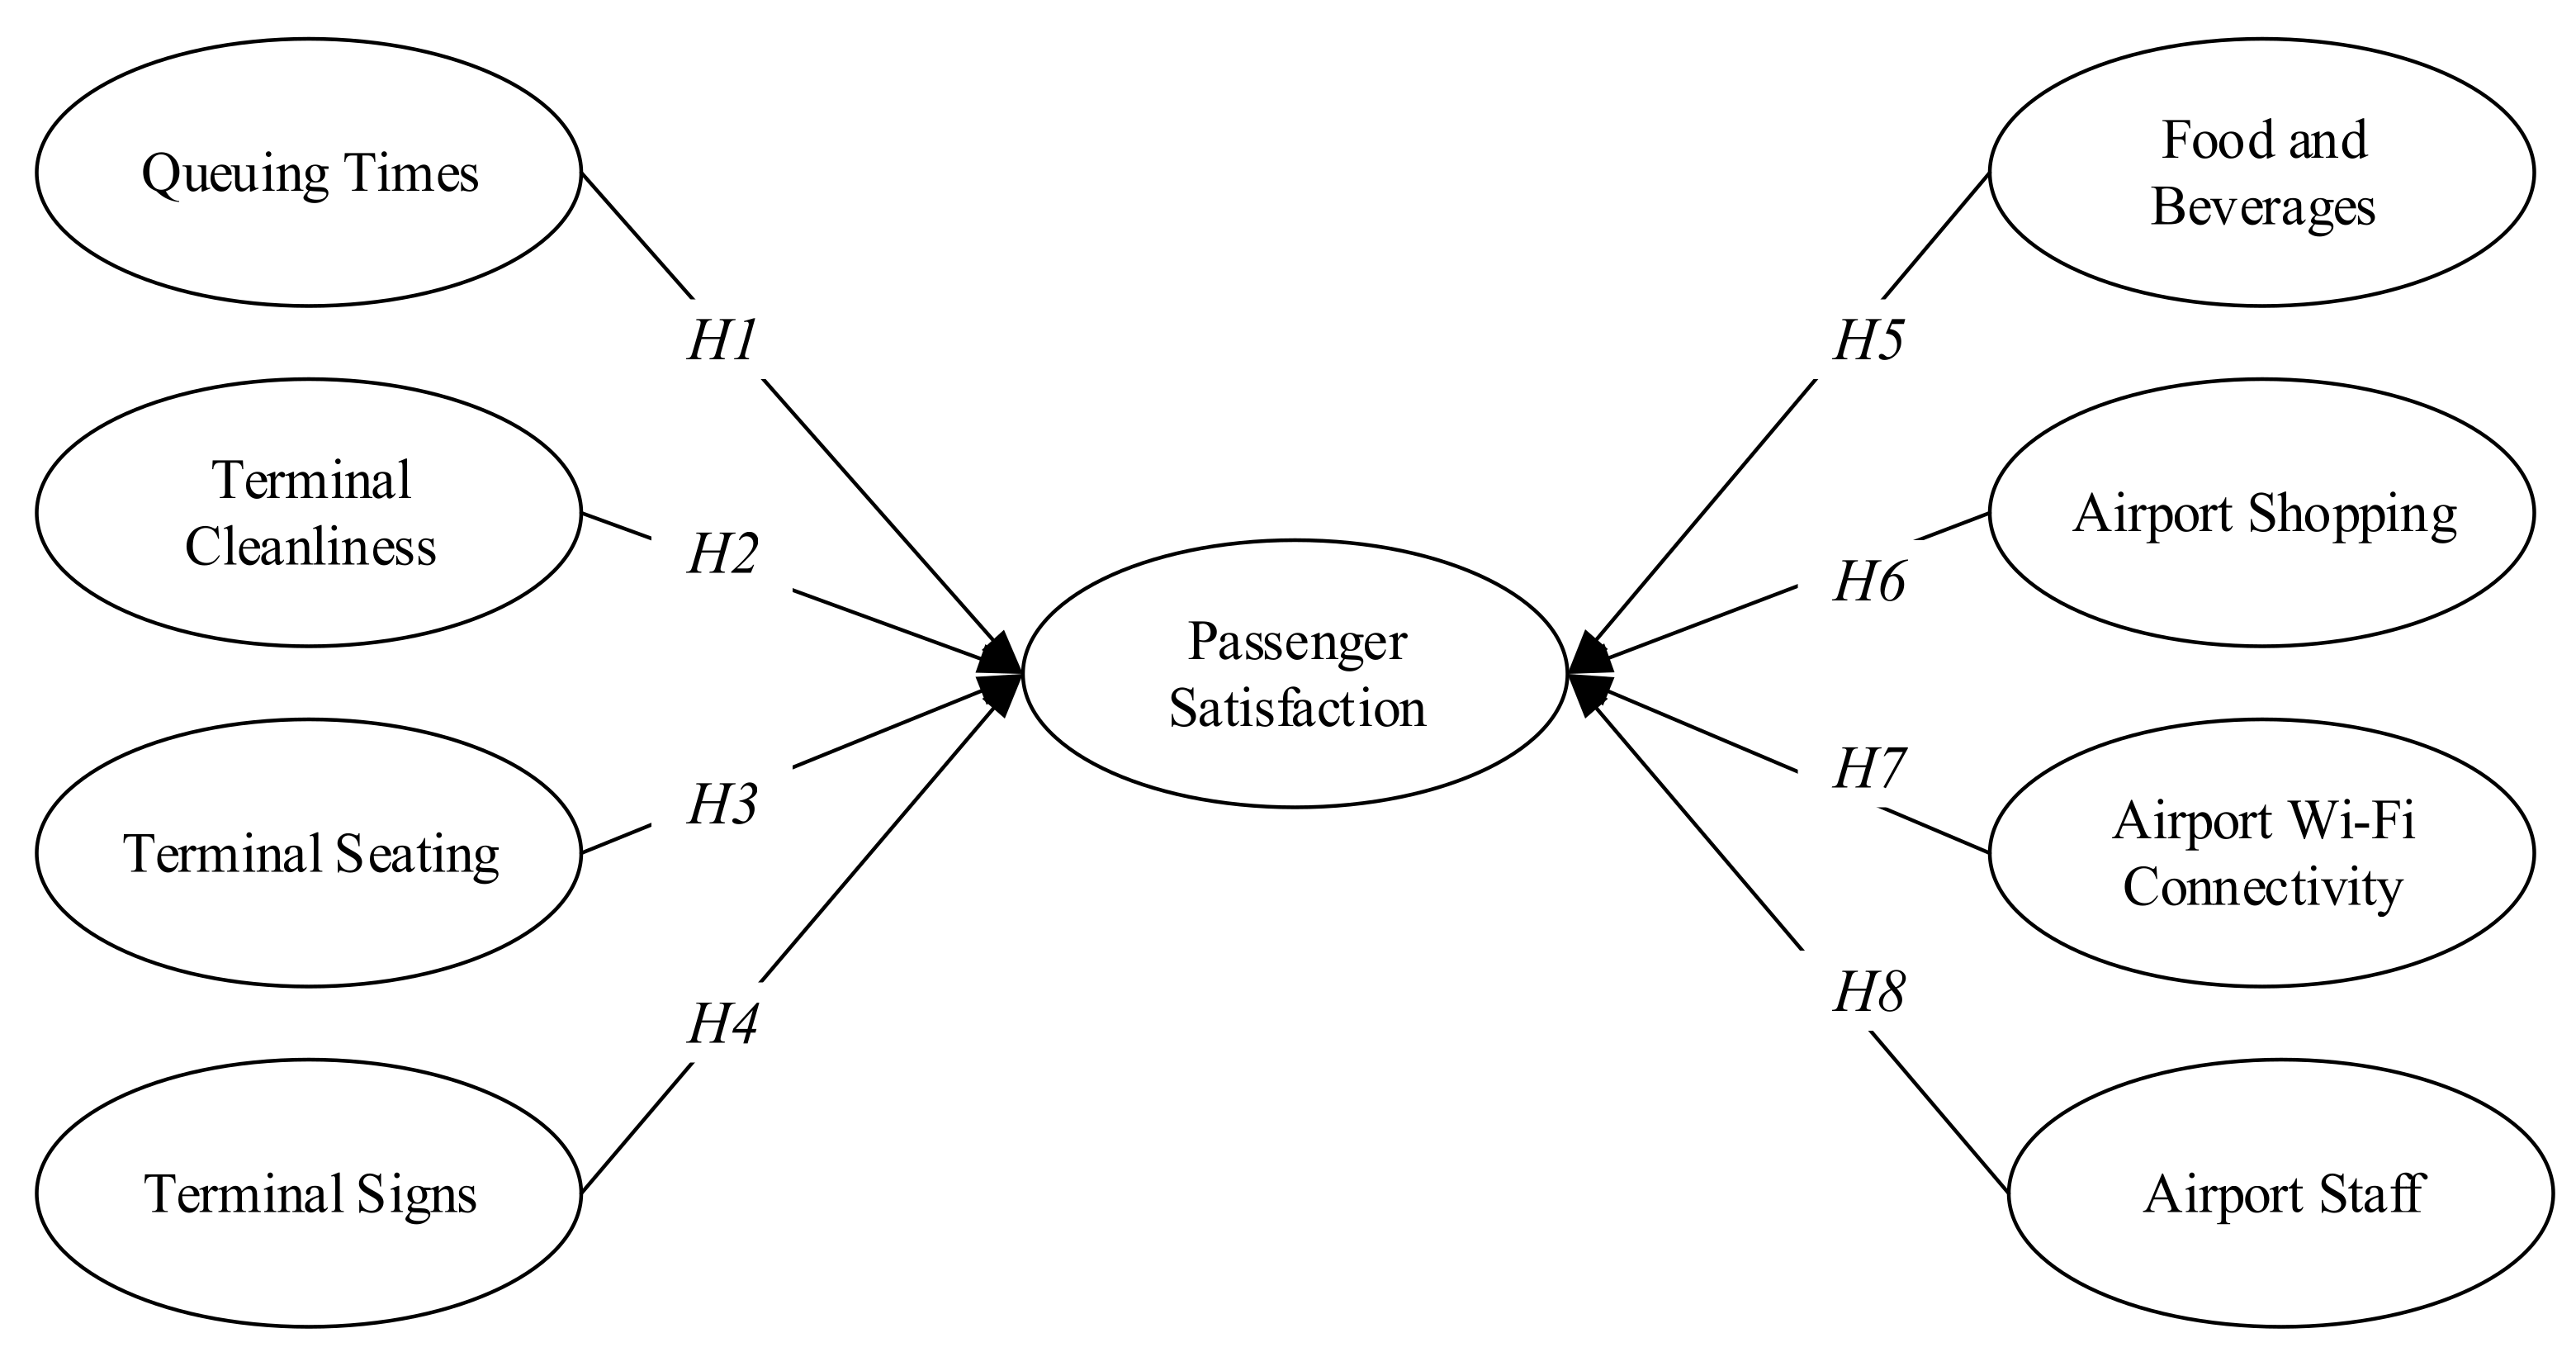
2.3. Research Hypotheses

During passenger transactions (e.g., check-in, boarding), airline passengers must queue [43]. These queues impede passengers’ access to services and waste their time [44]. Airport operators should strive to keep queueing times to a minimum, as longer queueing times have a negative impact on ASQ. Yavuz [45] stated in this regard that queueing times are critical for achieving overall passenger satisfaction. Moreover, queuing time is found to be one of the most influential factors on satisfaction [46,47]. Consequently, the following hypothesis is posited:
Hypothesis 1 (H1).
Queuing times is significantly associated with passenger satisfaction.
Terminal cleaning has always been a sensitive issue for passengers. This sensitivity has increased significantly in the aftermath of the COVID-19 pandemic, and tolerance for service failures in this area has decreased [7]. The cleanliness of the terminal facilities is a critical factor in ensuring passengers’ comfort and satisfaction [34]. The research findings shows that terminal cleanliness has a positive effect on passenger emotions, thereby increasing overall passenger satisfaction [48]. Based on the above literature, we formulated the following hypothesis:
Hypothesis 2 (H2).
Terminal cleanliness is significantly associated with passenger satisfaction.
Passengers spend considerable time in airport terminals during boarding and check-in procedures [25,49]. For a variety of customer groups, from disabled passengers to children, the availability and comfort of the seating areas in the terminal are critical for a pleasant experience [50,51,52]. In this regard, a plethora of research has been carried out on designing suitable seating areas for different passenger groups [50]. Wakefield and Blodgett [51] stated that the distance between seats affects mobility and, ultimately, the quality of delivered services at the airport. According to Zheng [52], seating areas can positively affect overall customer satisfaction. Consistent with the foregoing discussion, we propose the following:
Hypothesis 3 (H3).
Terminal seating is significantly associated with passenger satisfaction.
Airport terminals have turned into a giant ecosystem that includes many service components, from specialty retailers to food and beverage services [25]. In this case, passengers’ access to and receipt of services has become even more difficult [53]. At this point, the signs in the terminal help passengers find where they need to go. Adequate terminal signage is vital for passengers’ access to services, as inadequate or misleading signage increases the risk of missing a flight [53,54,55]. According to Kichhanagari [56], signs in terminal areas play a critical role in passenger satisfaction. On the other hand, it has been noted that signs increase the quality of the services offered by airports [55]. Thus, we suggested the following hypothesis:
Hypothesis 4 (H4).
Terminal signs are significantly associated with passenger satisfaction.
The profitability of airports is primarily based on non-aeronautical or commercial activities, particularly on retail and food and beverage services [57]. Food and beverage facilities allow passengers to meet their needs and spend their leisure time effectively [21]. In this regard, the extant literature suggests that as the number of facilities and alternatives for food and beverages at airports increases, so do passengers’ perceptions of service quality and satisfaction [58]. Customer satisfaction is also influenced by high airport retailing pricing policies as a result of higher airport concession fees [57,59]. For customer satisfaction, it is therefore essential to provide reasonable prices. Han et al. [60] concluded that food and beverage services at the airport are among the most important factors affecting customer satisfaction. Therefore, in the context of the ASQ, this study hypothesized that:
Hypothesis 5 (H5).
Food and beverages are significantly associated with passenger satisfaction.
Shopping is a popular pastime for airport passengers [25]. The shopping activity, which alleviates the boredom of the passengers by providing entertainment while they wait for their flights, is an important source of non-aeronautical revenue for airport operators. Shopping facilities is a significant predictor of overall satisfaction [7]. In this respect, Han and Kim [61] stated that customers who are satisfied with their shopping experience increase their loyalty to the airport. Likewise, Perng et al. [62] discussed that passengers feel pleasant, especially after check-in, and that shopping activities are an activity that can increase passenger satisfaction. The above literature led to the following hypothesis:
Hypothesis 6 (H6).
Airport shopping is significantly associated with passenger satisfaction.
With technological advancements, one of the primary services provided by airports has been Wi-Fi [19,63,64]. Passengers can easily complete their tasks with this service and spend their leisure time more effectively [65]. They also express concern about the absence or weakness of Wi-Fi service at airports and regard this service as essential [63]. Lubbe et al. [64] asserted that Wi-Fi hotspots are a significant determinant of ASQ. The preceding discussion provides support for the following hypothesis:
Hypothesis 7 (H7).
Airport Wi-Fi connectivity is significantly associated with passenger satisfaction.
Passengers expect their needs at the airport to be met in a friendly and courteous manner by competent staff. The passenger-centered orientation of the airport staff also shapes the service perceptions of the passengers [26]. Accordingly, courtesy displayed by staff during the flight-related transactions positively affects the service perception [4,21]. In addition, Mirghafoor et al. [31] asserted that airport staff is critical in service quality. Furthermore, Paramonovs and Ijevleva [23] emphasized the importance of airport staff courtesy and competence in determining customer satisfaction or dissatisfaction. The above literature led to the following hypothesis:
Hypothesis 8 (H8).
Airport Staff is significantly associated with passenger satisfaction.
Figure 1. Research model.
Sustainability 14 02151 g001

3. Methodology

3.1. Data and Data Pre-Processing

The data for this study is secondary data drawn from Skytrax. Skytrax, an international air transport rating organization, has been monitoring the perceptions toward airport and airline services worldwide since 1999 through online passenger reviews [66]. Passengers can rate their airline, seats, lounges, and airport experiences for a variety of attributes and share their reviews as text comments via the Skytrax mechanism [66]. The reasons for using this data source in the analysis are as follows [35]:
  • Skytrax requires passengers to verify themselves prior to leaving a review.
  • Many sources of participant bias do not pose a threat, as passengers share reviews voluntarily.
  • Skytrax compiles highly representative data from a global network of airports.
Punel et al. [67] concluded that Skytrax is a well-established and reliable indicator of passenger satisfaction in aviation services. In recent years, air transport research has relied on Skytrax as a data source for its inclusive and reliable nature [7,35,36,38,40,67,68,69]. Due to the richness of the data, the existing literature frequently uses the Skytrax source to reflect online word of mouth [68].
Airport passenger reviews in the Skytrax mechanism begin with respondent demographic information, such as passenger name, country of residence, airport name, date of visit, and travel purpose, and continue with ratings of eight airport service attributes (i.e., queueing times, terminal cleanliness, terminal seating, terminal signs, food and beverages, airport shopping, Wi-Fi connectivity, and airport staff). Following that, passengers are asked to rate their intention to recommend and their overall rating, which indicates passenger satisfaction. Airport service attributes are rated on an ordinal scale from one to five, while the overall rating is based on a sliding scale from one to ten (lowest to highest score). Finally, the intention to recommend is operationalized as binary terms (yes or no).
This present study gathered passenger reviews from the 50 busiest airports in Europe in 2019. Note that Europe contributes to the worldwide passenger traffic with a share of 25.9% and is the second busiest region in terms of passenger traffic [2]. Further, in Europe, there are multi-airport systems (MASs), which refers to the presence of more than one airport serving a major city [70]. Since this study includes the Paris, Milan, Moscow, and London MASs, it has a practically representative sample of airport competition. Appendix A contains a list of airports included in the study. The data collection process was conducted in two phases: pre-COVID-19 and post-COVID-19 periods, in order to provide a comprehensive picture of the issue. The pre-COVID-19 period encompasses a 19-month period ending in December 2019 (June 2018–December 2019), when the WHO reported the first case of COVID-19 [71]. The post-COVID-19 period, which started in March 2020, when Europe was declared the new epicenter of the COVID-19 pandemic, ended in September 2021 [72]. The date of visit was considered when categorizing passenger reviews. It is worth noting here that we discovered no passenger reviews from the post-COVID-19 period in April 2020. After removing missing data from the variables of interest, we obtained a sample of 1463 reviews for the pre-COVID-19 period and 151 reviews for the post-COVID-19 period.
As independent variables, the study used queuing times (QT), terminal cleanliness (TCL), terminal seating (TSE), terminal signs (TSI), food and beverages (FB), airport shopping (ASH), airport Wi-Fi connectivity (AWC), and airport staff (AST). Passenger satisfaction (SAT), called overall rating, was treated as the dependent variable of the study.

3.2. Data Analysis

In this present study, we used a multi-method approach to investigate the relationship between airport service attributes and passenger satisfaction. The first step in this approach is to employ MRA to test the proposed relationships. While doing this, MRA examined the effect of airport service attributes on passenger satisfaction. MRA is frequently used to determine the net effect of a set of independent variables on a dependent variable [73]. By concentrating on symmetrical relationships (e.g., if X increases, Y increases), the underlying logic of MRA is sufficiency logic, implying whether various factors are sufficient to increase/decrease the outcome [11].
Additionally, the second approach, NCA, was used to corroborate and gain additional insight from the MRA findings. NCA does so by determining which airport service attributes (conditions) are necessary to achieve a high level of passenger satisfaction. Originally proposed by Dul [74], the NCA identifies what conditions are necessary and to what extent they must be present for an outcome to occur. It should also be noted that the existence of the necessary conditions does not ensure that the outcome will occur, but without the necessary conditions, the outcome will never occur [74]. The causal logic of necessary conditions is fundamentally different from sufficiency logic [75]. The underlying necessity logic of NCA identifies the factors that must exist in order for an outcome to occur and establishes this situation with an expression such as “Y requires X.” [11,13]. The literature concludes that sufficiency logic and necessity logic are complementary to each other [76]. Thus, the extant business research literature frequently integrates MRA and SEM with NCA to validate proposed hypotheses of sufficiency logic using necessity logic, thereby gaining deeper insights [10,11,12,76,77].
The necessary conditions for a particular outcome can also be examined by employing another asymmetric approach, qualitative comparative analysis (QCA), and its variant, fuzzy-set qualitative comparative analysis (fsQCA). However, the QCA statements are binary, and one must calibrate the data prior to analysis. Furthermore, unlike NCA, QCA lacks a technique such as a bottleneck table that indicates which conditions are required at which level [11]. As another point, NCA precisely defines more necessary conditions compared to QCA and is less prone to type 1 and type 2 errors [31]. As a result, NCA is a very powerful tool for data analysis.
NCA is a process that entails the analysis and interpretation of necessary condition hypotheses using three components: a scatterplot, an effect size, and a bottleneck table [75]. To begin, a scatterplot is drawn between the necessary condition (X) and the desired outcome (Y). Between the empty zone and the full zone with observation, a ceiling line is then drawn. The presence of empty space (no observation) in the upper left corner of this ceiling line signifies that condition X is necessary for outcome Y [76,78]. The ceiling line is drawn using two distinct techniques: ceiling envelopment-free disposal hull (CE-FDH) and ceiling regression-free disposal hull (CR-FDH). CE-FDH is suitable for discrete or categorical data and draws a step-function ceiling line, whereas CR-FDH relies on a regression line and is typically used with continuous data [79].
In the next step, the effect size (d) is used to determine whether the empty space above the ceiling line is of significant size [75]. Bear in mind that the effect size is between 0 and 1, and the larger the empty space, the larger the effect size [76]. The following is a suggested general rule of thumb for the necessary condition effect size: 0 < d < 0.1 “small effect”, 0.1 ≤ d < 0.3 “medium effect”, 0.3 ≤ d < 0.5 “large effect”, and d ≥ 0.5 “very large effect” [80]. Dul [74] established a necessary condition threshold of 0.1 and recommended rejecting the necessity hypothesis if the effect size does not exceed this value. As another metric, accuracy gives the ratio of observations that are not in the empty zone to the total number of observations as a percentage. Accuracy typically greater than or equal to 95% indicates that the necessary condition hypothesis is accepted [76]. The NCA also provides a significance value (p) calculated from the permutation test to ensure that the effect size does not arise randomly [78]. The p-value is used to determine whether the resulting effect size d is a random result between unrelated variables [79].
Finally, NCA utilizes a bottleneck table to analyze the ceiling line from a unique perspective. This table depicts which conditions and what level must be fulfilled in order to achieve the desired level of outcome [80]. Thus, NCA has the potential to provide important insights in situations involving multiple necessary conditions [75].

4. Results

4.1. Descriptive Statistics

Descriptive statistics and Spearman’s rank correlations for variables of interest are depicted in Table 2. Accordingly, the average ratings of passengers across airport service attributes vary between 2.03 and 2.63 (on a one-to-five scale), thus indicating that the majority of passengers in our sample are either dissatisfied or neutral in terms of their airport experience. On the other hand, an average passenger satisfaction rating of 3.02 suggests that passengers are fairly dissatisfied with their airport experience (on a scale of one to ten). Additionally, one can see that the variables of interest have moderately positive and significant correlations. Specifically, the airport service attribute that has the strongest correlation with passenger satisfaction is airport staff (ρ = 0.762, p < 0.01), followed by terminal seating (ρ = 0.723, p < 0.01) and queuing times (ρ = 0.711, p < 0.01).

4.2. Regression Analysis Results

MRA is a powerful statistical technique that has been successfully applied in the literature for large-scale analysis of online passenger reviews [68]. Before proceeding with the MRA, several assumptions must be met. Given the general rule of thumb (N > 50 + 8k, k is the number of independent variables) in Pallant [81], the sample size is large enough to perform MRA. As seen in Table 3, there is no risk of collinearity because the variance inflation factor (VIF) values are less than the conservative threshold of 5 [73]. Considering the standardized residual plot, no significant deviation from normality was detected. Finally, the Durbin–Watson statistics of 1.934, ensures that errors are free of autocorrelation [73].
In Table 3, the significance of the F test indicates that the relationship model between airport service attributes and passenger satisfaction is significant (p < 0.001). Moreover, the proposed model is responsible for 74.8% (R2 = 0.748) of the variance in passenger satisfaction, and six service attributes are statistically significant at the p < 0.05 level. It should also be noted that this value yields substantial explanatory power in consumer behavior research [73].
As per Table 3, the most strongly predictive airport service attribute of passenger satisfaction is airport staff (β = 0.350, p < 0.001), followed by queuing times (β = 0.206, p < 0.001) and terminal seating (β = 0.158, p < 0.001). Thus, hypotheses H8, H1, and H3 were accepted. Apart from these, the effects of terminal cleanliness (β = 0.068, p < 0.01), terminal signs (β = 0.137, p < 0.001), and food and beverages (β = 0.073, p < 0.01) on passenger satisfaction were also found to be significant. As a result, the research model also supported hypotheses H2, H4, and H5. However, the significant effect of the last two predictors in the research model on passenger satisfaction could not provide evidence of support. In other words, Hypothesis H6 testing the significant effect of airport shopping on passenger satisfaction was rejected (β = 0.031, p = 0.173). Similarly, hypothesis H7 testing the significant effect of airport Wi-Fi connectivity on passenger satisfaction was rejected as well (β = 0.026, p = 0.148).

4.3. Necessary Condition Analysis Results

It is very important to ensure that there are no contrarian cases when using symmetrical approaches such as MRA. If contrarian cases appear in the data, it becomes necessary to analyze the research model using an asymmetric approach [82]. In the study data, the detection of contrarian cases using Cramer’s V test justifies the analysis of the relationships between predictor variables and passenger satisfaction using NCA (p < 0.05). Therefore, in this section, we performed NCA. The literature suggests that NCA works efficiently with small to large sample sizes [82]. Therefore, for a sound analysis, not all of the data used in the MRA (n = 1463) were used in this section; instead, random data reduction was applied. To achieve this objective systematically, only 25% of the data were randomly selected, and NCA analysis was applied (n = 366).
NCA is sensitive to data skewness, and outliers can result in deflated or eliminated necessity effect sizes. Therefore, as Richter [11] suggested, we examined the z-scores of the observations and determined that they were all within the recommended range. Moreover, since the skewness and kurtosis values of the data ranged within ±3, the data was assumed to have a normal distribution [82]. Following Richter et al. [11], the latent variable score of each variable was calculated by ADANCO software v.2.2.1, and these scores were used as NCA input. NCA analysis was carried out using the NCA package in the R environment [83]. Permutation testing was used to determine the statistical significance of the necessary condition hypotheses using 10,000 random subsamples. When examining the ceiling lines, CE-FDH lines were adopted, which gave more stable results [76]. The scatter plots for all the relationships proposed are available on the Open Science Framework: https://osf.io/9g8bs (accessed on 10 January 2022).
The effect size of the necessary conditions for passenger satisfaction is summarized in Table 4. Accordingly, the results meaningfully (d ≥ 0.1) and significantly (p < 0.05) reveal that terminal cleanliness (d = 0.278, p < 0.05), terminal seating (d = 0.222, p < 0.05), terminal signs (d = 0.167, p < 0.05), food and beverages (d = 0.167, p < 0.05), airport shopping (d = 0.111, p < 0.05), and airport staff (d = 0.139, p < 0.05) are necessary conditions to generate passenger satisfaction. At this point, the effect size of six of the eight antecedents falls into the medium effect size category. Moreover, the accuracy of the conditions being 100% confirms the necessary conditions [74]. On the other hand, although the queuing times and airport Wi-Fi connectivity factors yielded a small effect size, they did not exert any meaningful necessary effect on passenger satisfaction, as Dul [74] suggested.
This section has also specified by bottleneck analysis at what level the necessary conditions should occur in order to achieve a certain level of passenger satisfaction. Table 5 summarizes the findings from the bottleneck table. To maintain a high level of passenger satisfaction (>60%), the level of terminal cleanliness should not fall below 50%, and the level of terminal seating should not fall below 25%. For another example, to achieve 80% passenger satisfaction, at least 75% of terminal cleanliness, at least 50% of terminal seating, at least 50% of terminal signs, at least 50% of food and beverages, at least 50% of airport shopping, at least 25% of airport staff, and at least 50% of airport staff must occur.

5. Complementary Analysis for Post-COVID-19 Period

The following section analyzes the necessary conditions for passenger satisfaction in the post-COVID-19 period in order to complement the findings of the previous section and to further extend the application of NCA to the air transport research. Similarly to the previous section, a multiple NCA analysis was performed using the NCA package [83]. To focus on airport passenger satisfaction in the post-COVID-19 period, only 151 online passenger reviews from March 2020 to September 2021 were considered.
Prior to conducting the analysis, we calculated latent variable scores for the variables of interest using the same procedure [11]. The effect sizes of the necessary conditions and the corresponding p values as a result of the permutation test performed with 10,000 random subsamples are shown in Table 6. As per table, queuing times (d = 0.361, p < 0.05), terminal cleanliness (d = 0.500, p < 0.05), terminal seating (d = 0.111, p < 0.05), terminal signs (d = 0.306, p < 0.05), and airport staff (d = 0.333, p < 0.05) were identified as critical (necessary) conditions for generating passenger satisfaction. The NCA findings indicate that terminal cleanliness has the greatest effect, with a very large effect size. The necessary condition with the second-largest effect size was queuing times, followed by airport staff and terminal signs. Note that all three conditions provided a large effect size. The last necessary condition, terminal seating, resulted in a medium-sized effect. The fact that the accuracy values of the examined relationships are 100% also confirms the support of the necessary condition hypotheses. Apart from these, food and beverages (d = 0.083) and airport shopping (d = 0.083) were found to be unnecessary conditions by not exceeding the required effect size threshold. Finally, airport Wi-Fi connectivity was flagged as an entirely superfluous condition for passenger satisfaction (d = 0.000, p = 1.00).

6. Conclusions

6.1. Discussion and Theoretical Contributions

The measurement of the ASQ is an important issue for both practitioners and scholars [25]. As such, we investigated the effect of airport service attributes on passenger satisfaction using a multi-method approach consisting of MRA and NCA.
First, the results from MRA reveal that; a. queuing times, b. terminal cleanliness, c. terminal seating, d. terminal signs, e. food and beverages, and f. airport staff have positive effects on passenger satisfaction (a. β = 0.206, p < 0.001; b. β = 0.068, p = 0.001; c. β = 0.158, p < 0.001; d. β = 0.137, p < 0.001; e. β = 0.073, p < 0.01; f. β = 0.350, p < 0.001). These findings are also in line with that of previous research [31,34,45,52,56]. Surprisingly, airport shopping and airport Wi-Fi connectivity have no significant effect on passenger satisfaction (β = 0.031, p > 0.173, β = 0.026, p > 0.148). Shopping at airports is not a core product of flight services, as it is typically done to occupy passengers’ spare time [84]. On the other hand, since passengers buy shopping services from airport stores, they are likely to evaluate the service quality exclusively through those stores [84,85]. According to Halpern and Mwesiumo [7], service failures in airport shopping and Wi-Fi connectivity have the least impact on passenger loyalty. In a nutshell, this finding reflects the fact that shopping has a negligible effect on the overall ASQ. On the other hand, while Pamucar et al. [33] asserted that access to Wi-Fi is the most influential service parameter in Spanish airports, the literature includes numerous contradictory findings. Halpern and Mwesiumo [7] concluded that Wi-Fi connectivity has no effect on passenger satisfaction, while Bunchongchit and Wattanacharoensil [40] concluded that Wi-Fi access has an effect only on business passenger satisfaction. Likewise, Pandey [4] noted that one of the lowest-priority service criteria at airports is Internet access/Wi-Fi. Due to the widespread adoption of Wi-Fi connectivity in airports in recent years, each airport offers a varying level of Wi-Fi service, and this finding may be related to this fact. Further, passengers may not require airport Wi-Fi hotspots since mobile operators have powerful infrastructures at large airports. They can also access the Internet via their mobile operators’ cellular data [86]. In this case, the airport’s Wi-Fi service might not have a significant impact on customer satisfaction.
Regarding the NCA results, six out of eight service attributes were identified as necessary conditions for passenger satisfaction in the pre-COVID-19 period. On the other hand, we found no evidence that Wi-Fi connectivity and queuing times are necessary conditions for passenger satisfaction, as both yielded small effect sizes. It is surprising that queuing time is a sufficient but not a necessary condition, even though Wi-Fi connectivity confirms the MRA findings as an unnecessary condition. It should be noted, however, that the NCA is a complementary approach to traditional methods such as MRA, rather than a substitute for them [10]. As a result of the combined MRA and NCA findings, smooth queuing times increase passenger satisfaction, but there is no minimum level of queuing time to ensure passenger satisfaction is achieved.
To complement the NCA findings of the pre-COVID-19 period, we also analyzed the post-COVID-19 period. Accordingly, food and beverage services, airport shopping, and airport Wi-Fi connectivity are not necessary conditions to achieve passenger satisfaction. In line with the MRA findings from the pre-COVID-19 period, post-COVID-19 findings also indicate that airport shopping and Wi-Fi connectivity are not necessary conditions in reaching passenger satisfaction. In contrast to the pre-COVID-19 period, however, food and beverages were also found to be an unnecessary condition. The COVID-19 pandemic has also altered the eating habits of consumers. While there is no evidence that the viruses that cause respiratory diseases are transmitted through food, it is clear that consumer concerns about food safety increased during the pandemic period. This finding may be a direct consequence of the fact that contact with food is not regarded as completely safe in the context of the pandemic [87]. That is, the absence of this attribute has no effect on passenger satisfaction, as consumers are concerned about foodborne illnesses. On the other hand, the effect size of terminal cleanliness in achieving passenger satisfaction has increased significantly in the post-COVID-19 period. In particular, providing hygiene necessities and maintaining hygiene standards at airports has been one of the top priorities for passengers [7,88,89]. To lessen travel concerns, the literature has discussed the importance of providing complimentary hand sanitizers, sanitary wipes, and masks to passengers [90]. As a result, this finding can be explained by the growing concern over hygiene and cleaning caused by COVID-19 pandemic.
The theoretical implications of this study are manifold. Firstly, this study examined the antecedents of airport satisfaction through the use of a multi-method design, including a symmetrical approach (i.e., MRA) and asymmetrical approach (i.e., NCA). The existing literature relies largely on the expectancy-disconfirmation theory to explain airport service quality [91]. While this situation is often treated using sufficiency logic in empirical studies, necessity logic remained unexplored [3]. Therefore, this study advances current understanding in this regard by combining MRA and NCA for the first time in ASQ literature. Sustainable service quality entails providing uninterrupted services with exceptional sustainable quality for a long time [92]. The sustainability of service quality has an impact on customer satisfaction. In this regard, this study has the potential to help the sustainability of service quality standards of airports based on the attributes drawn by Skytrax using the integrated approach of MRA and NCA. This present study also provides additional insights into passenger satisfaction by demonstrating the necessary conditions for achieving it. Along with defining sufficient and necessary antecedents for passenger satisfaction, this study utilizes online reviews in airport research, an area that remains under-researched [15]. Thus, while the current literature analyzes online reviews in the air transport sector using a variety of methods, including multinominal logistic regression [7], one-way ANOVA [69], sentiment analysis [67], response surface analysis [93], latent semantic analysis [39], PLS path modeling [40], content analysis [20], structural topic modeling [94], and CONCOR analysis [37], this study applied the NCA method for the first time. Finally, this study is one of the few that examines passenger satisfaction in the post-COVID-19 era [95,96,97,98].

6.2. Managerial Implications

This study has significant implications for practitioners in the air transport industry. As online review sites have grown in popularity, the number of consumers who voluntarily share their travel experiences on platforms such as Skytrax and TripAdvisor has increased significantly. These online reviews shed light on consumer needs and wants, providing air transport managers with a rich source of information to increase customer satisfaction [15,19]. Using the MRA method, this study examined the factors that contribute to passenger satisfaction in the airport industry. These findings help airport managers in determining the impact of various service attributes on passenger satisfaction and implementing more effective management strategies. Understanding the factors that contribute to customer satisfaction in airport service delivery, which spans multiple service processes, is critical for survival in a competitive environment.
The necessary conditions provide critical insights into business theory and practice [80]. The NCA findings in this study reveal the critical service attributes (a.k.a. necessary conditions) required to achieve passenger satisfaction at the airport during the pre-COVID-19 and post-COVID-19 periods. Airport managers must understand the elements necessary to satisfy passengers during turbulent times such as COVID-19. According to the findings of this study, managers can precisely identify and strengthen the critical factors that should exist to ensure passenger satisfaction. Customer satisfaction will improve if airport managers define the necessary conditions for achieving passenger satisfaction through the use of NCA and allocate their limited resources appropriately.
From a methodological standpoint, this study, by utilizing the NCA method, provides all managers in the airline industry with a powerful and useful tool for defining the necessary conditions for achieving critical outcomes such as passenger satisfaction and revisit intention.

6.3. Limitations and Future Research

This study has some limitations derived from the Skytrax data used. To begin, Skytrax does not provide data on income, gender, age, education, or airline type (i.e., full-service carriers vs. low-cost carriers) for control during the analysis. Secondly, the research model is limited as the pre-determined attributes established by Skytrax are used in the study. While this current study covers the airport servicescape, signage, and the quality of delivered services—the three primary dimensions identified in the literature—future research should provide more comprehensive and passenger-driven frameworks [3,33]. Moreover, scholars can validate our findings by utilizing primary data for both the MRA and NCA applications when handling airport service attributes. Third, reviews are shared voluntarily through Skytrax. However, consumers often tend to write reviews when they are extremely satisfied or extremely dissatisfied [99]. At this point, it should be noted that under-reporting bias may occur in the passenger ratings, considering that the satisfaction level of our sample is 3.02 out of 10. On the other hand, because the upper left corner of the NCA scatterplot is taken into account, the social desirability effect of the dependent variable may result in the attenuation of necessity effects in NCA [79]. In this regard, the Skytrax data used in this study are less susceptible to the social desirability effect, though they are still susceptible to under-reporting biases [35,99]. As a result, we encourage scholars to analyze such secondary data more frequently in future studies when using NCA.
Future research can also analyze behavioral outcomes such as passenger loyalty and purchase intention using the NCA method, which is extended to the ASQ literature in this study. Furthermore, because culture has a significant moderating effect on passenger behavior [68], scholars should consider cultural differences when evaluating ASQ. It is clear from this study that terminal cleanliness comes to the fore in complementary analysis with the effect of the COVID-19 pandemic. However, Skytrax defines terminal cleanliness broadly, encompassing the cleaning of seats, washrooms, and public areas. As a result, the secondary data used in this study are unable to specifically investigate the elements of terminal cleanliness. Using primary data, future studies can elucidate the necessary cleaning components for passenger satisfaction in more detail. For example, fresh insights can be gained into the effect of restroom cleaning on satisfaction, a self-evident basic need for the traveling public, particularly during this COVID-19 period. Finally, by drawing on the secondary data used by the study, future studies can evaluate ASQ and passenger satisfaction using mathematically simple yet powerful MCDM (multi-criteria decision-making) and machine learning tools [100,101].

Author Contributions

Conceptualization, M.B., E.Ö., and Ş.A.; methodology, M.B. and P.-H.N.; software, M.B. and E.Ö.; validation, Ş.A. and E.Ö.; formal analysis, M.B.; investigation, E.Ö. and Ş.A.; resources, E.Ö. and P.-H.N.; data curation, E.Ö.; writing—original draft preparation, M.B. and Ş.A.; writing—review and editing, P.-H.N., E.Ö., and J.-F.T.; visualization, Ş.A. and H.-A.P.; supervision, P.-H.N. and J.-F.T.; project administration, M.B. and J.-F.T.; funding acquisition, P.-H.N. and J.-F.T. All authors have read and agreed to the published version of the manuscript.

Funding

This research was funded by FPT University, Vietnam, grant number 1342/QD-DHFPT, 2022. This research was supported in part by the Ministry of Science and Technology in Taiwan under grants MOST 109-2410-H-027-012-MY2.

Institutional Review Board Statement

Not applicable.

Informed Consent Statement

Not applicable.

Data Availability Statement

The data presented in this study are available on request from the corresponding author.

Acknowledgments

The authors would like to express sincere thanks and gratitude to the helpful comments from reviewers.

Conflicts of Interest

The authors declare no conflict of interest.

Appendix A

Table A1. List of top 50 airports in terms of passenger traffic in Europe.
RAirportCountryCityIATA CodePassengers—2019Total Reviews in Skytrax
1Heathrow AirportUnited KingdomLondonLHR80,886,589931
2Charles de Gaulle AirportFranceParisCDG76,150,007675
3Amsterdam Airport SchipholNetherlandsAmsterdamAMS71,707,144490
4Frankfurt am Main AirportGermanyFrankfurtFRA70,556,072582
5Adolfo Suárez Madrid–Barajas AirportSpainMadridMAD61,734,037189
6Josep Tarradellas Barcelona–El Prat AirportSpainBarcelonaBCN52,686,314265
7Istanbul AirportTurkeyIstanbulIST52,009,220496
8Sheremetyevo International AirportRussiaMoscowSVO49,438,545140
9Munich AirportGermanyMunichMUC47,941,348264
10Gatwick AirportUnited KingdomLondonLGW46,574,786516
11Leonardo da Vinci–Fiumicino AirportItalyRomeFCO43,532,573264
12Dublin AirportIrelandDublinDUB32,907,673255
13Orly AirportFranceParisORY31,853,04989
14Vienna International AirportAustriaViennaVIE31,662,189242
15Zurich AirportSwitzerlandZürichZRH31,507,692158
16Lisbon AirportPortugalLisbonLIS31,173,000262
17Copenhagen AirportDenmarkCopenhagenCPH30,256,703220
18Palma de Mallorca AirportSpainPalma de MallorcaPMI29,721,12389
19Manchester AirportUnited KingdomManchesterMAN29,367,4771255
20Malpensa AirportItalyMilanMXP28,846,299166
21Oslo AirportNorwayOsloOSL28,592,619144
22Domodedovo International AirportRussiaMoscowDME28,252,33763
23London Stansted AirportUnited KingdomLondonSTN28,124,292888
24Brussels AirportBelgiumBrusselsBRU26,360,003130
25Stockholm Arlanda AirportSwedenStockholmARN25,642,703
26Athens International AirportGreeceAthensATH25,574,03094
27Düsseldorf AirportGermanyDüsseldorfDUS25,507,566120
28Berlin Tegel AirportGermanyBerlinTXL24,227,570107
29Vnukovo International AirportRussiaMoscowVKO24,001,521213
30Helsinki AirportFinlandHelsinkiHEL21,861,0828
31Malaga AirportSpainMalagaAGP19,856,299197
32Pulkovo AirportRussiaSaint PetersburgLED19,581,262116
33Warsaw Chopin AirportPolandWarsawWAW18,869,30244
34Luton AirportUnited KingdomLondonLTN18,213,901127
35Geneva AirportSwitzerlandGenevaGVA17,926,629778
36Václav Havel Airport PragueCzech RepublicPraguePRG17,804,900227
37Hamburg AirportGermanyHamburgHAM17,308,773116
38Budapest Ferenc Liszt International AirportHungaryBudapestBUD16,173,39943
39Boryspil International AirportUkraineKyivKBP15,260,281103
40Alicante AirportSpainAlicanteALC15,047,84082
41Edinburgh AirportUnited KingdomEdinburghEDI14,733,96673
42Henri Coandă International AirportRomaniaBucharestOTP14,707,376483
43Nice Côte d’Azur AirportFranceNiceNCE14,485,42388
44Orio al Serio International AirportItalyMilan/BergamoBGY13,857,25796
45Porto AirportPortugalPortoOPO13,107,00036
46Stuttgart AirportGermanyStuttgartSTR12,721,44145
47Birmingham AirportUnited KingdomBirminghamBHX12,646,45633
48Cologne Bonn AirportGermanyCologne/BonnCGN12,368,519396
49Lyon–Saint-Exupéry AirportFranceLyonLYS11,739,60047
50Venice Marco Polo AirportItalyVeniceVCE11,561,594118

References

  1. ICAO. The World of Air Transport in 2019. Available online: https://www.icao.int/annual-report-2019/Pages/the-world-of-air-transport-in-2019.aspx (accessed on 5 December 2021).
  2. ATAG Aviation: Benefits Beyond Borders. Available online: https://www.atag.org/our-publications/latest-publications.html (accessed on 5 December 2021).
  3. Usman, A.; Azis, Y.; Harsanto, B.; Azis, A.M. Airport service quality dimension and measurement: A systematic literature review and future research agenda. Int. J. Qual. Reliab. Manag. 2021, in press. [Google Scholar] [CrossRef]
  4. Pandey, M.M. Evaluating the service quality of airports in Thailand using fuzzy multi-criteria decision making method. J. Air Transp. Manag. 2016, 57, 241–249. [Google Scholar] [CrossRef]
  5. ACI. ACI Releases New Research Paper Analyzing the Influence of Customer Service Quality on Airports’ Non-Aeronautical Revenue. Available online: https://aci.aero/news/2016/08/08/aci-releases-new-research-paper-analyzing-the-influence-of-customer-service-quality-on-airports-non-aeronautical-revenue/ (accessed on 5 December 2021).
  6. Bezerra, G.C.L.; Gomes, C.F. Antecedents and consequences of passenger satisfaction with the airport. J. Air Transp. Manag. 2020, 83, 101766. [Google Scholar] [CrossRef]
  7. Halpern, N.; Mwesiumo, D. Airport service quality and passenger satisfaction: The impact of service failure on the likelihood of promoting an airport online. Res. Transp. Bus. Manag. 2021, 41, 100667. [Google Scholar] [CrossRef]
  8. Isa, N.A.M.; Ghaus, H.; Hamid, N.A.; Tan, P.L. Key drivers of passengers’ overall satisfaction at klia2 terminal. J. Air Transp. Manag. 2020, 87, 101859. [Google Scholar] [CrossRef]
  9. Hong, S.-J.; Choi, D.; Chae, J. Exploring different airport users’ service quality satisfaction between service providers and air travelers. J. Retail. Consum. Serv. 2020, 52, 101917. [Google Scholar] [CrossRef]
  10. Tho, N.D. Strategic orientations and firm innovativeness: A necessary condition analysis. Balt. J. Manag. 2019, 14, 427–442. [Google Scholar] [CrossRef]
  11. Richter, N.F.; Schubring, S.; Hauff, S.; Ringle, C.M.; Sarstedt, M. When predictors of outcomes are necessary: Guidelines for the combined use of PLS-SEM and NCA. Ind. Manag. Data Syst. 2020, 120, 2243–2267. [Google Scholar] [CrossRef]
  12. Lee, W.; Jeong, C. Distinctive roles of tourist eudaimonic and hedonic experiences on satisfaction and place attachment: Combined use of SEM and necessary condition analysis. J. Hosp. Tour. Manag. 2021, 47, 58–71. [Google Scholar] [CrossRef]
  13. Shahjehan, A.; Qureshi, J.A. Personality and impulsive buying behaviors. A necessary condition analysis. Econ. Res. Ekon. Istraz. 2019, 32, 1060–1072. [Google Scholar] [CrossRef] [Green Version]
  14. Olya, H.; Altinay, L.; Farmaki, A.; Kenebayeva, A.; Gursoy, D. Hotels’ sustainability practices and guests’ familiarity, attitudes and behaviours. J. Sustain. Tour. 2021, 29, 1063–1081. [Google Scholar] [CrossRef]
  15. Martin-Domingo, L.; Martín, J.C.; Mandsberg, G. Social media as a resource for sentiment analysis of Airport Service Quality (ASQ). J. Air Transp. Manag. 2019, 78, 106–115. [Google Scholar] [CrossRef]
  16. IATA. Optimism for Travel Restart as Borders Reopen. Available online: https://airlines.iata.org/news/optimism-for-travel-restart-as-borders-reopen (accessed on 5 December 2021).
  17. Graham, A.; Morrell, P. Airport Finance and Investment in the Global Economy, 1st ed.; Routledge: Oxfordshire, UK, 2017. [Google Scholar]
  18. Graham, A. Airport management and performance. In Air Transport Management: An International Perspective; Budd, L., Ison, S., Eds.; Routledge: Oxfordshire, UK, 2017; pp. 79–93. [Google Scholar]
  19. Lee, K.; Yu, C. Assessment of airport service quality: A complementary approach to measure perceived service quality based on Google reviews. J. Air Transp. Manag. 2018, 71, 28–44. [Google Scholar] [CrossRef]
  20. Bulut, C.; Aydogan, S. Airport service quality: A reconceptualization and a practical application on the non-aeronautical services. Aviation 2020, 24, 182–196. [Google Scholar] [CrossRef]
  21. Fodness, D.; Murray, B. Passengers’ expectations of airport service quality. J. Serv. Mark. 2007, 21, 492–506. [Google Scholar] [CrossRef]
  22. Trischler, J.; Lohmann, G. Monitoring quality of service at Australian airports: A critical analysis. J. Air Transp. Manag. 2018, 67, 63–71. [Google Scholar] [CrossRef] [Green Version]
  23. Paramonovs, S.; Ijevleva, K. Factor Analysis of Passengers’ Satisfaction at “RIGA International Airport”. Econ. Bus. 2015, 27, 46–52. [Google Scholar] [CrossRef] [Green Version]
  24. Bezerra, G.C.L.; de Souza, E.M.; Correia, A.R. Passenger Expectations and Airport Service Quality: Exploring Customer Segmentation. Transp. Res. Rec. J. Transp. Res. Board 2021, 2675, 604–615. [Google Scholar] [CrossRef]
  25. Bezerra, G.C.L.; Gomes, C.F. Measuring airport service quality: A multidimensional approach. J. Air Transp. Manag. 2016, 53, 85–93. [Google Scholar] [CrossRef]
  26. Antwi, C.O.; Fan, C.; Ihnatushchenko, N.; Aboagye, M.O.; Xu, H. Does the nature of airport terminal service activities matter? Processing and non-processing service quality, passenger affective image and satisfaction. J. Air Transp. Manag. 2020, 89, 101869. [Google Scholar] [CrossRef]
  27. D’Alonzo, L.; Leva, M.C.; Bucciarelli, E. Comparing passenger satisfaction, employees’ perspective and performance on quality and safety indicators: A field study. Sustainability 2021, 13, 5636. [Google Scholar] [CrossRef]
  28. Barakat, H.; Yeniterzi, R.; Martín-Domingo, L. Applying deep learning models to twitter data to detect airport service quality. J. Air Transp. Manag. 2021, 91, 102003. [Google Scholar] [CrossRef]
  29. Prentice, C.; Kadan, M. The role of airport service quality in airport and destination choice. J. Retail. Consum. Serv. 2019, 47, 40–48. [Google Scholar] [CrossRef]
  30. Kayapınar, S.; Erginel, N. Designing the airport service with fuzzy QFD based on SERVQUAL integrated with a fuzzy multi-objective decision model. Total Qual. Manag. Bus. Excell. 2019, 30, 1429–1448. [Google Scholar] [CrossRef]
  31. Mirghafoori, S.H.; Izadi, M.R.; Daei, A. An integrated approach for prioritizing the barriers to airport service quality in an intuitionistic-fuzzy environment. Cogent Bus. Manag. 2018, 5, 1532277. [Google Scholar] [CrossRef]
  32. Bakır, M.; Akan, Ş. Havaalanlarında Hizmet Kalitesini Entropi ve TOPSIS Yöntemleri ile Değerlendirilmesi: Avrupa’nın En Yoğun Havaalanları Üzerine Bir Uygulama. Elektron. Sos. Bilim. Derg. 2018, 17, 632–651. [Google Scholar] [CrossRef]
  33. Pamucar, D.; Yazdani, M.; Montero-Simo, M.J.; Araque-Padilla, R.A.; Mohammed, A. Multi-criteria decision analysis towards robust service quality measurement. Expert Syst. Appl. 2021, 170, 114508. [Google Scholar] [CrossRef]
  34. Bogicevic, V.; Yang, W.; Bilgihan, A.; Bujisic, M. Airport service quality drivers of passenger satisfaction. Tour. Rev. 2013, 68, 3–18. [Google Scholar] [CrossRef]
  35. Wattanacharoensil, W.; Schuckert, M.; Graham, A.; Dean, A. An analysis of the airport experience from an air traveler perspective. J. Hosp. Tour. Manag. 2017, 32, 124–135. [Google Scholar] [CrossRef]
  36. Shadiyar, A.; Ban, H.J.; Kim, H.S. Extracting key drivers of air passenger’s experience and satisfaction through online review analysis. Sustainability 2020, 12, 9188. [Google Scholar] [CrossRef]
  37. Ban, H.J.; Kim, H.S. Understanding customer experience and satisfaction through airline passengers’ online review. Sustainability 2019, 11, 4066. [Google Scholar] [CrossRef] [Green Version]
  38. Kwon, H.J.; Ban, H.J.; Jun, J.K.; Kim, H.S. Topic modeling and sentiment analysis of online review for airlines. Information 2021, 12, 78. [Google Scholar] [CrossRef]
  39. Sezgen, E.; Mason, K.J.; Mayer, R. Voice of airline passenger: A text mining approach to understand customer satisfaction. J. Air Transp. Manag. 2019, 77, 65–74. [Google Scholar] [CrossRef]
  40. Bunchongchit, K.; Wattanacharoensil, W. Data analytics of Skytrax’s airport review and ratings: Views of airport quality by passengers types. Res. Transp. Bus. Manag. 2021, 41, 100688. [Google Scholar] [CrossRef]
  41. Öğüt, H.; Taş, O. The Effect of Online Reviews on Hotel Pricing. In Proceedings of the Mediterranean Conference on Information Systems (MCIS-2019), Naples, Italy, 27–28 September 2019; Athens University of Economics and Business: Athens, Greece, 2019. [Google Scholar]
  42. Wang, Y.; Kim, J. Interconnectedness between online review valence, brand, and restaurant performance. J. Hosp. Tour. Manag. 2021, 48, 138–145. [Google Scholar] [CrossRef]
  43. Stolletz, R. Analysis of passenger queues at airport terminals. Res. Transp. Bus. Manag. 2011, 1, 144–149. [Google Scholar] [CrossRef]
  44. Aniyeri, R.; Nadar, R. Passengers queue analysis in international airports terminals in Kerala using multiphase queuing system. Int. J. Math. Oper. Res. 2018, 12, 1–30. [Google Scholar] [CrossRef]
  45. Yavuz, N.; Olgaç, S.; Aktaş, S.G.; Kantar, Y.M. Passenger Satisfaction in European Airports. In Travel and Tourism: Sustainability, Economics, and Management Issues: Proceedings of the Tourism Outlook Conferences, Belihuloya, Sri Lanka, 19–21 October 2017; Coşkun, İ.O., Othman, N., Aslam, M., Lew, A., Eds.; Springer: Berlin/Heidelberg, Germany, 2020; pp. 223–237. [Google Scholar]
  46. Günay Aktaş, S.; Ay, E.; Yavuz, N.; Olgaç, S. Tourist satisfaction with American continent airports. J. Multidiscip. Acad. Tour. 2021, 6, 89–98. [Google Scholar] [CrossRef]
  47. Lacic, E.; Kowald, D.; Lex, E. High enough? Explaining and predicting traveler satisfaction using airline reviews. In HT ’16: Proceedings of the 27th ACM Conference on Hypertext and Social Media, Halifax, NS, Canada, 10–13 July 2016; Association for Computing Machinery: New York, NY, USA, 2016; pp. 249–254. [Google Scholar] [CrossRef]
  48. Kankaew, K. The servicescape of air transport terminal affecting passenger satisfaction. In Proceedings of the IOP Conference Series: Materials Science and Engineering, Proceedings of the VIII International Scientific Conference Transport of Siberia, Novosibirsk, Russia, 22–27 May 2020; IOP Publishing Ltd.: Bristol, UK, 2020; Volume 918, pp. 1–5. [Google Scholar]
  49. Chung, Y.S.; Lu, K.H. Investigating passenger behavior in airport terminals with multisource data: Recall bias and time budget effects. Transp. Res. Part A Policy Pract. 2020, 141, 410–429. [Google Scholar] [CrossRef]
  50. Deng, P.; Zheng, M. Exploring different types of seating in international airports: Case study in Taoyuan International Airport departure hall in Terminal 1. In Proceedings of the Annual Conference of JSSD—Japanese Society for the Science of Design, Fukui, Japan, 4–6 June 2014; pp. 1–2. [Google Scholar]
  51. Wakefield, K.L.; Blodgett, J.G. The effect of the servicescape on customers’ behavioral intentions in leisure service settings. J. Serv. Mark. 1996, 10, 45–61. [Google Scholar] [CrossRef]
  52. Zheng, M.C. How airport users luggage affects their perception of seat design at airports. J. Asian Archit. Build. Eng. 2014, 13, 141–148. [Google Scholar] [CrossRef] [Green Version]
  53. Anuar, N.K.; Sabar, R. Low-Cost Passengers’ Preference of Halal Friendly Airport Design at Kuala Lumpur International Airport 2 (KLIA2) Terminal, Malaysia. In Proceedings of the International Conference on Zakat, Tax, Waqf and Economic Development 2019 (ZAWED 2019), Kedah, Malaysia, 1–2 December 2019; pp. 453–458. [Google Scholar]
  54. Lin, J.; Song, R.; Dai, J.; Jiao, P. Pedestrian guiding signs optimization for airport terminal. Discret. Dyn. Nat. Soc. 2014, 2014, 125910. [Google Scholar] [CrossRef] [PubMed] [Green Version]
  55. Fewings, R. Wayfinding and Airport Terminal Design. J. Navig. 2001, 54, 177–184. [Google Scholar] [CrossRef]
  56. Kichhanagari, R.; Motley, R.D.R.; Duffy, S.A.; Fisher, D.L. Airport terminal signs: Use of advance guide signs to speed search times. Transp. Res. Rec. 2002, 26–32. [Google Scholar] [CrossRef]
  57. Del Chiappa, G.; Martin, J.C.; Roman, C. Service quality of airports’ food and beverage retailers: A fuzzy approach. J. Air Transp. Manag. 2016, 53, 105–113. [Google Scholar] [CrossRef]
  58. Wali, R.; Kouki, R. Investigating Airport Service Quality: The Case of King Abdulaziz International Airport. PalArch’s J. Archaeol. Egypt Egyptol. 2021, 18, 282–292. [Google Scholar]
  59. Page, G. Scientific realism: What “neuromarketing” can and can’t tell us about consumers. Int. J. Mark. Res. 2012, 54, 287–290. [Google Scholar] [CrossRef]
  60. Han, S.; Ham, S.S.; Yang, I.; Baek, S. Passengers’ perceptions of airline lounges: Importance of attributes that determine usage and service quality measurement. Tour. Manag. 2012, 33, 1103–1111. [Google Scholar] [CrossRef]
  61. Han, H.; Yu, J.; Kim, W. Airport shopping–an emerging non-aviation business: Triggers of traveler loyalty. J. Travel Tour. Mark. 2018, 35, 835–845. [Google Scholar] [CrossRef]
  62. Perng, S.W.; Chow, C.C.; Liao, W.C. Analysis of shopping preference and satisfaction with airport retailing products. J. Air Transp. Manag. 2010, 16, 279–283. [Google Scholar] [CrossRef]
  63. Jiang, H.; Zhang, Y. An assessment of passenger experience at Melbourne Airport. J. Air Transp. Manag. 2016, 54, 88–92. [Google Scholar] [CrossRef]
  64. Lubbe, B.; Douglas, A.; Zambellis, J. An application of the airport service quality model in South Africa. J. Air Transp. Manag. 2011, 17, 224–227. [Google Scholar] [CrossRef] [Green Version]
  65. Chonsalasin, D.; Jomnonkwao, S.; Ratanavaraha, V. Measurement model of passengers’ expectations of airport service quality. Int. J. Transp. Sci. Technol. 2021, 10, 342–352. [Google Scholar] [CrossRef]
  66. Skytrax. About Skytrax Ratings. Available online: https://skytraxratings.com/about (accessed on 5 December 2021).
  67. Punel, A.; Al Hajj Hassan, L.; Ermagun, A. Variations in airline passenger expectation of service quality across the globe. Tour. Manag. 2019, 75, 491–508. [Google Scholar] [CrossRef]
  68. Chatterjee, S.; Mandal, P. Traveler preferences from online reviews: Role of travel goals, class and culture. Tour. Manag. 2020, 80, 104108. [Google Scholar] [CrossRef]
  69. Migdadi, Y.K.A.A. The Impact of Airline Alliance Strategy on the Perceived Service Quality: A Global Survey. J. Qual. Assur. Hosp. Tour. 2021, 22, 1–32. [Google Scholar] [CrossRef]
  70. Graham, A. Managing Airports: An International Perspective, 5th ed.; Routledge: Oxfordshire, UK, 2018. [Google Scholar]
  71. WHO. Novel Coronavirus (2019-nCoV) Situation Report-1. Available online: https://www.who.int/docs/default-source/coronaviruse/situation-reports/20200121-sitrep-1-2019-ncov.pdf (accessed on 5 December 2021).
  72. BBC. Coronavirus: Europe Now Epicentre of the Pandemic, Says WHO. Available online: https://www.bbc.com/news/world-europe-51876784 (accessed on 5 December 2021).
  73. Sarstedt, M.; Mooi, E. A Concise Guide to Market Research, 3rd ed.; Springer: Berlin/Heidelberg, Germany, 2019. [Google Scholar]
  74. Dul, J. Necessary Condition Analysis (NCA): Logic and Methodology of “Necessary but Not Sufficient” Causality. Organ. Res. Methods 2016, 19, 10–52. [Google Scholar] [CrossRef]
  75. Tóth, Z.; Dul, J.; Li, C. Necessary condition analysis in tourism research. Ann. Tour. Res. 2019, 79, 102821. [Google Scholar] [CrossRef]
  76. Garg, N. Workplace Spirituality and Employee Well-being: An Empirical Exploration. J. Hum. Values 2017, 23, 129–147. [Google Scholar] [CrossRef]
  77. Liu, Y.; Yu, C.; Damberg, S. Exploring the drivers and consequences of the “awe” emotion in outdoor sports—A study using the latest partial least squares structural equation modeling technique and necessary condition analysis. Int. J. Sport. Mark. Spons. 2021; in press. [Google Scholar] [CrossRef]
  78. Dul, J.; van der Laan, E.; Kuik, R.; Karwowski, M. Necessary Condition Analysis: Type I Error, Power, and Over-Interpretation of Test Results. A Reply to a Comment on NCA. Commentary: Predicting the Significance of Necessity. Front. Psychol. 2019, 10, 1493. [Google Scholar] [CrossRef] [PubMed]
  79. Tynan, M.C.; Credé, M.; Harms, P.D. Are individual characteristics and behaviors necessary-but-not-sufficient conditions for academic success?: A demonstration of Dul’s (2016) necessary condition analysis. Learn. Individ. Differ. 2020, 77, 101815. [Google Scholar] [CrossRef]
  80. Dul, J. Identifying single necessary conditions with NCA and fsQCA. J. Bus. Res. 2016, 69, 1516–1523. [Google Scholar] [CrossRef]
  81. Pallant, J. SPSS Survival Manual: A Step by Step Guide to Data Analysis Using IBM SPSS, 7th ed.; Routledge: New York, NY, USA, 2020. [Google Scholar]
  82. Olya, H.G.T. Towards advancing theory and methods on tourism development from residents’ perspectives: Developing a framework on the pathway to impact. J. Sustain. Tour. 2020, 28, 1–21. [Google Scholar] [CrossRef]
  83. Dul, J. NCA: Necessary Condition Analysis. Available online: https://cran.r-project.org/web/packages/NCA/NCA.pdf (accessed on 5 December 2021).
  84. Baron, S.; Wass, K. Towards an understanding of airport shopping behaviour. Int. Rev. Retail. Distrib. Consum. Res. 1996, 6, 301–322. [Google Scholar] [CrossRef]
  85. Han, H.; Hyun, S.S. Investigating customers’ shopping behaviors at airport duty-free shops: Impact of shopping flow and alternative shopping malls’ attractiveness. Asia Pac. J. Tour. Res. 2018, 23, 627–638. [Google Scholar] [CrossRef]
  86. Rajapaksha, A.; Jayasuriya, D.N. Smart Airport: A Review on Future of the Airport Operation. Glob. J. Manag. Bus. Res. 2020, 20, 25–34. [Google Scholar] [CrossRef]
  87. Duda-Chodak, A.; Lukasiewicz, M.; Zięć, G.; Florkiewicz, A.; Filipiak-Florkiewicz, A. COVID-19 pandemic and food: Present knowledge, risks, consumers fears and safety. Trends Food Sci. Technol. 2020, 105, 145–160. [Google Scholar] [CrossRef]
  88. Park, J.Y.; Mistur, E.; Kim, D.; Mo, Y.; Hoefer, R. Toward human-centric urban infrastructure: Text mining for social media data to identify the public perception of COVID-19 policy in transportation hubs. Sustain. Cities Soc. 2022, 76, 103524. [Google Scholar] [CrossRef]
  89. Blišťanová, M.; Tirpáková, M.; Brůnová, Ľ. Overview of safety measures at selected airports during the COVID-19 pandemic. Sustainability 2021, 13, 8499. [Google Scholar] [CrossRef]
  90. Sotomayor-Castillo, C.; Radford, K.; Li, C.; Nahidi, S.; Shaban, R.Z. Air travel in a COVID-19 world: Commercial airline passengers’ health concerns and attitudes towards infection prevention and disease control measures. Infect. Dis. Health 2021, 26, 110–117. [Google Scholar] [CrossRef] [PubMed]
  91. Oliver, R.L. A Cognitive Model of the Antecedents and Consequences of Satisfaction Decisions. J. Mark. Res. 1980, 17, 460–469. [Google Scholar] [CrossRef]
  92. Hadi, N.U.; Aslam, N.; Gulzar, A. Sustainable service quality and customer loyalty: The role of customer satisfaction and switching costs in the Pakistan cellphone industry. Sustainability 2019, 11, 2408. [Google Scholar] [CrossRef] [Green Version]
  93. Stamolampros, P.; Dousios, D.; Korfiatis, N.; Symitsi, E. The joint effect of consumer and service providers’ culture on online service evaluations: A response surface analysis. Tour. Manag. 2020, 78, 104057. [Google Scholar] [CrossRef]
  94. Stamolampros, P.; Korfiatis, N.; Kourouthanassis, P.; Symitsi, E. Flying to Quality: Cultural Influences on Online Reviews. J. Travel Res. 2019, 58, 496–511. [Google Scholar] [CrossRef] [Green Version]
  95. Tuchen, S.; Arora, M.; Blessing, L. Airport user experience unpacked: Conceptualizing its potential in the face of COVID-19. J. Air Transp. Manag. 2020, 89, 101919. [Google Scholar] [CrossRef] [PubMed]
  96. Kour, P.; Jasrotia, A.; Gupta, S. Understanding the Impact of Airport Service Quality on Passengers’ Revisit Intentions Amidst COVID-19 Pandemic. Enl. Tour. Pathmaking J. 2020, 10, 358. [Google Scholar] [CrossRef]
  97. Monmousseau, P.; Marzuoli, A.; Feron, E.; Delahaye, D. Impact of COVID-19 on passengers and airlines from passenger measurements: Managing customer satisfaction while putting the US Air Transportation System to sleep. Transp. Res. Interdiscip. Perspect. 2020, 7, 100179. [Google Scholar] [CrossRef]
  98. Polat, I.; Erdoğan, D.; Sesliokuyucu, O.S. The Impact of Attitude and Subjective Norm on Airline Passengers’ Travel Intention in the COVID-19 Era: Mediating Role of Perceived Risk. An. Bras. Estud. Turísticos 2021, 11, 1–15. [Google Scholar]
  99. Hu, N.; Zhang, J.; Pavlou, P.A. Overcoming the J-shaped distribution of product reviews. Commun. ACM 2009, 52, 144–147. [Google Scholar] [CrossRef]
  100. Nguyen, P.H.; Tsai, J.F.; Lin, M.H.; Hu, Y.C. A hybrid model with spherical fuzzy-ahp, pls-sem and ann to predict vaccination intention against COVID-19. Mathematics 2021, 9, 3075. [Google Scholar] [CrossRef]
  101. Nguyen, P.H.; Tsai, J.F.; Dang, T.T.; Lin, M.H.; Pham, H.A.; Nguyen, K.A. A hybrid spherical fuzzy MCDM approach to prioritize governmental intervention strategies against the COVID-19 pandemic: A case study from Vietnam. Mathematics 2021, 9, 2626. [Google Scholar] [CrossRef]
Table 1. Relevant literature on airport service quality.
AuthorsMethodsData SourceAim
Hong et al. [9]SEMPrimary DataIncheon International Airport
Isa et al. [8]SEMPrimary DataKuala Lumpur International Airport (Klia2 terminal passengers)
Bezerra and Gomes [25]SEMPrimary DataGuarulhos International Airport
D’alonzo et al. [27]OLRPrimary DataLamezia Terme Airport (Regional Airport)
Bezerra et al. [24]SEMPrimary DataSao Paulo Congonhas Airport
Barakat et al. [28]DLMSecondary DataHeathrow, Gatwick, Riyadh King Khaled, Doha Hamad Airports
Antwi et al. [26]SEMPrimary DataShanghai Pudong International Airport
Prentice and Kadan [29]SEMPrimary DataAustralian major airports
Martin-Domingo et al. [15]DMTSecondary DataLondon Heathrow Airport
Kayapınar and Erginel [30]QFDPrimary DataEskişehir Hasan Polatkan Airport
Lee and Yu [19]DLMSecondary DataReviewed airports
Mirghafoori et al. [31]MCDMPrimary DataSao Paulo international airport
Bakır and Akan [32]MCDMSecondary DataEurope’s Busiest Airport
Pamucar et al. [33]MCDMPrimary DataMain airports in Spain
Bogicevic et al. [34]CASecondary Data33 popular destination airports
Pandey [4]MCDMPrimary DataSuvarnabhumi and Don Mueang Airports
Note. OLR = ordinal logistic regression, DLM = deep learning model, DMT = data mining technique, QFD = quality function deployment, CA = content analysis, MCDM = multi criteria decision-making methods.
Table 2. Descriptive statistics and correlation matrix.
FactorsMeanSD123456789
(1) Queuing Times2.121.431
(2) Terminal Cleanliness2.631.400.607 **1
(3) Terminal Seating2.171.350.639 **0.731 **1
(4) Terminal Signs2.591.450.603 **0.651 **0.662 **1
(5) Food and Beverages2.311.350.507 **0.604 **0.692 **0.600 **1
(6) Airport Shopping2.451.370.485 **0.573 **0.632 **0.608 **0.795 **1
(7) Airport Wi-Fi Connectivity2.481.440.530 **0.568 **0.584 **0.576 **0.534 **0.504 **1
(8) Airport Staff2.031.360.618 **0.581 **0.598 **0.592 **0.556 **0.531 **0.525 **1
(9) Passenger Satisfaction3.022.770.711 **0.676 **0.723 **0.694 **0.642 **0.608 **0.582 **0.762 **1
Note. ** significant at the 0.01 level.
Table 3. Results of multiple regression analysis.
RelationshipBStd. Errorβt-Valuep-ValueDecisionVIF
Constant−1.6110.088-−18.365<0.001--
Queuing Times0.3970.0370.20610.664<0.001Supported2.142
Terminal Cleanliness0.1340.0420.0683.1870.001Supported2.595
Terminal Seating0.3230.0480.1586.763<0.001Supported3.132
Terminal Signs0.2600.0390.1376.685<0.001Supported2.406
Food and Beverages0.1490.0490.0733.0380.002Supported3.323
Airport Shopping0.0620.0460.0311.3620.173Rejected2.965
Airport Wi-Fi Connectivity0.5000.0340.0261.4490.148Rejected1.821
Airport Staff0.7120.0380.35018.573<0.001Supported2.043
R-squaredR2 = 0.748 D-W statistics = 1.934
Overall FF (8, 1454) = 538.623, p < 0.001
Dependent variable: passenger satisfaction; B: unstandardized coefficient; β: standardized coefficient.
Table 4. Results of necessary condition analyses.
ConditionCeiling LineEffect Size (d)p-ValueAccuracy
Queuing TimesCE-FDH0.0830.000100%
Terminal CleanlinessCE-FDH0.2780.000100%
Terminal SeatingCE-FDH0.2220.000100%
Terminal SignsCE-FDH0.1670.000100%
Food and BeveragesCE-FDH0.1670.000100%
Airport ShoppingCE-FDH0.1110.000100%
Airport Wi-Fi ConnectivityCE-FDH0.0560.000100%
Airport StaffCE-FDH0.1390.000100%
Table 5. Bottleneck table for passenger satisfaction.
PercentageQTTCLTSETSIFBASHAWCAST
0NNNNNNNNNNNNNNNN
10NNNNNNNNNNNNNNNN
20NNNNNNNNNNNNNNNN
30NNNNNNNNNNNNNNNN
40NNNNNNNNNNNNNNNN
50NNNNNNNNNNNNNNNN
60NN50.025.0NNNNNNNNNN
70NN50.050.025.025.0NNNNNN
80NN75.050.050.050.025.0NN50.0
9075.075.075.075.075.075.050.075.0
10075.075.075.075.075.075.050.075.0
Note. QT = queuing times; TCL = terminal cleanliness; TSE = terminal seating; TSI = terminal signs; FB = food and beverages; ASH = airport shopping; AWC = airport Wi-Fi connectivity; AST = airport staff; NN = not necessary.
Table 6. Necessary condition effect sizes for post-COVID-19 period.
ConditionCeiling LineEffect Size (d)p-ValueAccuracy
Queuing Times—Passenger SatisfactionCE-FDH0.3610.000100%
Terminal Cleanliness—Passenger SatisfactionCE-FDH0.5000.000100%
Terminal Seating—Passenger SatisfactionCE-FDH0.1110.000100%
Terminal Signs—Passenger SatisfactionCE-FDH0.3060.000100%
Food and Beverages—Passenger SatisfactionCE-FDH0.0830.000100%
Airport Shopping—Passenger SatisfactionCE-FDH0.0830.000100%
Airport Wi-Fi Connectivity—Passenger SatisfactionCE-FDH0.0001.000100%
Airport Staff—Passenger SatisfactionCE-FDH0.3330.000100%
Publisher’s Note: MDPI stays neutral with regard to jurisdictional claims in published maps and institutional affiliations.

