1. Introduction
One of the major economic and social engines contributing to the prosperity of a nation is the air transportation industry. The industry covers all transportation activities, including the movement of goods and people by air. The air system is a major asset that allows worldwide interactions among people, nations, and civilizations. It helps companies by enabling them to conduct business and encourages tourism. In growing commerce, communication, and tourism, air transport has played a vital role around the globe.
Despite significant development, air transport is facing a number of major obstacles, including excessive fuel consumption, rising fuel costs, increased air traffic, competitive circumstances, economic crises, pollution difficulties, safety and design issues, and operational challenges [
1,
2,
3]. Hence, fuel consumption was examined in this study since it is a major challenge for the air transport industry. Fuel is a key aspect for the aviation industry, since fuel consumption has an influence on growing oil prices. In addition, the improvement of the global economy in last two decades has increased oil consumption, leading to a rise in oil prices [
1].
Air traffic boosted its energy efficiency by a factor of two during the early 1970s and reduced the growing fuel consumption [
4]. Whilst the fuel economy of commercial airlines was somewhat higher than in the past, the total energy consumption climbed annually at 2% between 1970 and 1987. With steady growth in the use of fuel and aviation, the worldwide demand for aviation oil in 1971 amounted to 118,000 barrels a day and in 2006 to 4.9 million barrels a day [
4]. There are more than 500 million aircraft passengers worldwide, with around 5.8 percent of the world’s fuel use in aviation. Air fuel uses amounts between 2% and 3% of the entire use of fossil fuels, of which more than 80% are used for civil aviation [
4]. However, this excessive use of fossil fuel as a primary source of energy has become a major challenge for countries due to its threat to sustainable development [
5] The amount of traffic is predicted to rise 5% per year by 2026 and the consumption of fuel is expected to grow by 3% annually [
6]. According to Schlumberger [
7] the demand for jet fuel and gasoline in the aviation industry has grown by 14% in 2012 compared to 2009, while transport fuel consumption in the general transport sector is predicted to decline by 12% by 2035. The use of fuel is one of the primary elements in air transport direct operating costs [
6,
7].
The air transport industry is a catalyst for economic development and trade in an increasingly globalized world where people and goods are moving further, and faster, than ever. The growth of the air transport industry is increasing at a rapid rate due to the various economic and technological reasons. However, this growth in the airline industry is also facing some major challenges, like high aviation turbine fuel prices [
1]. The cost of fuel has an important influence on any nation’s economy. The direct and indirect impact of increased fuel usage on airlines is increased. The immediate result is a rise in operational expenses, while the indirect result is a decrease in the demand for air travel. Results of a research study [
8] showed that the cost of extracting fuel and its availability had significant impact on the growth of air transport. In addition, the total petrol of each flight is commensurate with the emissions of CO
2 [
9].
The growing usage of fossil fuel means that airplane pollution is increasing, and that is now an environmental concern and a threat to sustainability [
9]. Chang et al. [
10] emphasized that planes utilize a large amount of fossil fuel to ensure airline efficiency. Since the market is so competitive, it is vital that fuel consumption optimization (FCO) be incorporated to reduce the aircraft’s direct operating expenses. The FCO is designing and implementing new equations, including the set of limitations, leading to a new set of equations, including a new set of limitations and improved fuel consumption functions of different variables, subject to a constraint framework [
2,
3,
10]. The same study [
10], working along with other business and governmental bodies, aimed at reducing the fuel consumed to fly an airplane, while at the same time maintaining a minimal overall cost of running an aircraft. In addition, a reduction in emissions from aircrafts will also result in a decline in emissions of greenhouse gasses caused by air transport.
This research investigated the factors that affect the rate of fuel consumption in aircrafts, especially in civil aviation. More specifically, the research examined the predictors of total fuel consumption in aircrafts to understand and manage them more efficiently. For investigating the predicting factors of fuel consumption, the variables relevant to total fuel consumption and the need for extra fuel from recorded data at one of the international airports in Egypt were utilized as the dependent variables. The research also examined the association between various variables and aircraft total fuel and extra fuel as well as their associations with fuel flow in aircrafts. This research contributes to the limited literature review on predicators of fuel consumption in aircrafts. It reveals some implications for aviation industry, especially in relation to fuel consumption optimization, efficient fuel usage, and alternative fuel.
2. Literature Review
A comprehensive literature review (see for example, [
2,
3,
11,
12,
13,
14,
15] from several academic publications and websites pertinent to factors that affect fuel consumption and reduction of carbon pollution in aircrafts was undertaken. Recent research [
12] has confirmed that fuel is the highest cost component in aviation operations, even higher than labor costs. Fuel represents up to 39% of the direct operation total cost of some aircrafts [
16]. Hence, it is crucial to understand the factors that affect fuel consumption to ensure the efficiency of fuel consumption as well as possible. Therefore, airline companies are pursuing all endeavors to manage their fuel consumption efficiently to gain competitive advantages and ensure business sustainability [
17].
A review of research on the factors that could be associated with and/or affect fuel consumption optimization has shown several factors, including takeoff time [
16]; age at flight [
18]; number of crew and passengers [
19]; dry operating weight (DOW), difference between planned and actual DOW, zero fuel weight (ZFW), difference between planned and actual ZFW [
12,
20]; air distance [
14]; ground distance [
21]; average W/C [
22]; time, especially origin time, destination time, and actual flight time difference between planned and actual flight time [
22,
23]; alternate fuel and fuel properties [
2,
3,
15]; aircraft type [
24]; aircraft operation, aircraft technology and design, aviation infrastructure, socio-economic and political issues [
2,
3].
Takeoff time is among the key factors that help in accurately estimating the fuel consumed in flights through the starting point. Additionally, it is possible to estimate the amount of fuel, which is a way to reduce operating costs for airlines as well as to mitigate environmental impacts [
16]. For this reason, a proposal to save fuel by designing a model for aircraft take-off, considering the wind conditions during the take-off process has been suggested [
16].
The age of the aircraft model is one of the factors closely related to the volume of aircraft fuel consumption due to the link with the modernity of aircraft structures [
18]. The past few decades have witnessed a significant increase in the amount of composite materials used in aircraft structures, as this has added strength to the aircraft and reduced the weight of the aircraft. The recent development of fuel engines also had a cause and effect in determining the efficiency of fuel consumption [
18]. Hence, the age of the aircraft and old aircraft models have a large effect on the volume of fuel consumed in aviation and modern aircrafts carry advantages with their engines. It was also confirmed that aircraft type is associated with fuel consumption optimization [
24].
Number of passengers and cabin crew are among the factors that affect the volume of fuel consumption through the aircraft’s payload [
19]. Moreover, DOW is the total weight of the aircraft without fuel and payload, that is, without passengers, air freight, or even additional services that are added to the aircraft such as kitchen, newspapers, and air sales [
12]. The difference between planned and actual DOW also affects the volume of fuel consumption [
20]. Furthermore, the immediate influence of changing atmospheric pressure throughout the cruising period and its implications for airline direct operational cost reduction methods in aviation have become more essential factors for fuel usage [
12]. A study [
25] that used a big data visualization to examine the factors affecting airplane fuel consumption showed that the highest consumption of fuel was recorded during the cruise phase, which was followed by the climb phase.
When the ZFW is underestimated, the flight plan fuels are greater than necessary, and a portion of the loaded fuel is not required to complete the flight [
12]. As excess weight is carried, this results in overuse as compared to a flight planned with a precise ZFW. Long-haul trips, when the cost of weight increases higher owing to the length of the journey, amplify this impact [
26]. The flight planning system’s selection of a flight path is also influenced by ZFW estimating mistakes. This is especially true for airlines that use complex algorithms to discover the best four-dimensional flight itineraries. Based on ZFW, different lateral and vertical paths can be found. Resultantly, the flight is handled on a pro longitudinal and transverse path [
27]. Another disadvantage of overestimating ZFW is that it might cause flights to exceed the aircraft’s take-off weight restriction. Indeed, the overestimation of weight results in a loss of cargo and, as a result, a loss of income for the trip. This effect is most noticeable on cargo flights, where the take-off weight limit is frequently exceeded [
27].
One of the reasons that lead to high rates of fuel consumption is the air distance, i.e., presence of long-range flights or the presence of hub airports within the flight from the point of view of airlines [
14]. This leads to more fuel burning and increased fuel consumption because the passenger’s choice of many hub airports leads to an increase in landing points. Therefore, increasing the air distance leads to more fuel consumption; thus, many airlines have recently sought to operate many direct air routes to be an alternative to most detour routes.
Time (origin and destination) is also among the factors that affect fuel consumption. Based on traffic analysis for many flights, it was found summer months cause an increase in evening traffic and leads to an increase in fuel consumption rates [
16].
The effect of wind on the sustainability of air transport operations is crucial. Therefore, airlines have adopted alternative energy [
12]. Alternative fuel is the amount of fuel required from the approach point at the destination airport until landing at the alternative airport. Alternative fuel considers several factors to rely on, including the process of getting on the runway as well as landing at the alternative airport. Sometimes, the competent aviation authority determines an alternative airport and in this case it must have enough fuel to move to the alternative, which then requires more fuel [
15]. A recent study on predicating fuel consumption in aircrafts [
11] showed that trajectory-based operations play a key role in flight efficiency. It was found that flexible route options save up to 9% of fuel.
Several studies, e.g., [
5,
28,
29], addressed the use of fossil fuel as a key source of energy and linked fuel consumption with contrails and climate impact. Hence, there is a growing awareness among scholars and practitioners about the use of bio-jet fuel instead of petroleum jet fuel for sustainable air transport industry.
3. Research Methods
Recorded data of 400 flights were collected for flights between July 2016 to July 2019. Data were obtained from one of the international airports in Egypt. The collected data included basic information about the flights and operating details, as well as fuel consumption information. Basic information of the flights included: origin, destination, model no., tripe date, age (in years) at the time of the flight, and number of passengers and crew. Operating and other collected information included dry operating weight (KG) (DOW), zero-fuel weight (ZFW), take-off weight (TOW) and distance (KM), difference between planned and actual DOW, actual ZFW, difference between planned and actual ZFW, difference between planned and actual TOW, air distance (AIR DIST), ground distance (GDN DIST), average (AVG) W/C, average ISA, performance factor, origin time, actual destination time, actual flight time, difference between planned and actual flight time, average fuel flow (average FF), extra fuel, total fuel, and alternate fuel.
3.1. Data Collection Procedures
The collected data were accessed through personal networks by the people who were responsible for creating and storing these data. The research team were working at public institutions of tourism and hotels and were in connection with senior staff who held these data. They were asked to access the data for research purposes. An Excel sheet with details of 400 flights were provided. Data were obtained for research purposes only. Hence, companies’ names and personal details, e.g., flight number, were removed for ethical considerations.
3.2. Data Analysis
The Statistical Package for Social Sciences (SPSS) version 19.0 for Windows was used to carry out statistical analysis. Descriptive statistics were used to present the basic flight data. Categorical variables were presented as frequency and percentage, while continuous variables were presented as mean ± standard deviation (SD). Normality testing of the variables was performed and analysis of their correlations to fuel weight was carried out using Shapiro–Wilk statistics (p < 0.001) and Kolmogorov–Smirnov statistics (p < 0.001), revealing that the data were non-normally distributed. Therefore, Spearman’s rank correlation coefficient test was used to investigate the correlations between the different variables. One-way analysis of variance (ANOVA) was used to study the difference between different aircrafts’ ages. The latter category was classified as less than 3 years, 3–6 years, and more than 6 years in service. A p value was considered statistically significant at <0.05.
For investigating the predicting factors of fuel consumption, the variables relevant to total fuel consumption and the need for extra fuel were utilized as the dependent variables. Since their tests of normality demonstrated that they were non-normally distributed, the generalized linear model (GLM) using a Poisson regression with log function as function of transformation was used to transform them into normal distribution. However, the non-parametric test for independent sample (one-sample Kolmogorov–Smirnov test) showed that the distribution of the total fuel consumption variable did not follow a Poisson distribution (
p < 0.001) (see
Table 1).
Employing extra fuel as a dependent variable, such statistical tests could not be applied as the variable contained negative integers. Homoscedasticity is defined as the error variance being constant with varying values of the predicted values.
As such, it was decided to remove the aberrant outliers by using the Z score (standardized values of the observation) in a trial to render the data normally distributed without affecting their consistency. For the total consumed fuel variable, a total of 18 outliers were removed and the data showed a significant normal distribution through a
p value of 0.16. In addition, the dependent extra fuel variable was successfully transformed to its normal distribution pattern after removing 28 outliers (
p = 0.08) (
Table 1). Consequently, Fisher’s test to test the significance of the regression model to fit the variables under investigation was applied.
4. The Results
4.1. Basic Characteristics of the Flights
Approximately half (47.6%) of the aircrafts were in service for more than 6 years, whereas 37.7% of aircrafts were in service between 3 and 6 years and only 14.5% were in service less than 3 years. The mean number of total crew members was 7.48 ± 0.067, while the mean number of passengers on all flights was 93.81 ± 25.19. The mean air distance covered by the aircrafts was 1618.94 ± 426.7 km and the mean ground distance covered by the aircrafts was 1603.34 ± 395.8 km. The mean for take-off weight was 67,580.5 ± 4011.6 kg (see
Table 2).
4.2. Association between Average Total Fuel and Extra Fuel and Other Variables
Table 3 shows the correlation between total fuel consumed as well as the extra fuel and selected variables. The most positively associated factors with the total used fuel were the air distance (r
2 = 0.86,
p < 0.01), ground distance (r
2 = 0.78,
p < 0.01), TOW (r
2 = 0.68,
p < 0.01), and flight time (r
2 = 0.68,
p < 0.01). Alternate fuel (r
2 = 0.32,
p < 0.01), average ISA (r
2 = 0.24,
p < 0.01), difference between planned and actual flight time (r
2 = 0.16,
p < 0.01), and alternate time (r
2 = 0.31,
p < 0.01) were also positively correlated with total fuel but in a weak pattern despite the statistically significant associations. AVG W/C was negatively correlated with total fuel, but the relationship was moderate (r
2 = −0.35,
p < 0.01). Other weakly correlated variables to total fuel included the difference between the actual and planned ZFW (r
2 = −0.17,
p < 0.01) and the actual and planned TOW (r
2 = −0.14,
p < 0.01) (
Table 3).
The difference between planned and actual TOW was positively correlated with requiring extra fuel in a moderate relationship (r
2 = 0.32,
p < 0.01). Similarly, aircraft’s age at the time of the flight was positively associated with extra fuel (r
2 = 0.25,
p < 0.01) and this was confirmed by a significant difference (
p = 0.015) between the need for extra fuel between the different age categories as analyzed by one-way ANOVA. Other relatively weaker correlations were detected between extra fuel and the performance factor (r
2 = 0.22,
p < 0.01), the difference between actual and planned DOW (r
2 = 0.15,
p < 0.01), and the difference between actual and planned ZFW (r
2 = 0.16,
p < 0.01). Conversely, despite their statistical significance, the correlations between extra fuel and some factors were negative, such as passenger/crew ratio, alternate time, alternate fuel, actual DOW, actual ZFW, and actual TOW (
Table 3).
4.3. Association between Average Fuel Flow and Other Selected Factors
There was a strong positive association between the average fuel flow (FF) and actual TOW (r
2 = 0.74,
p < 0.01), as well as ZFW (r
2 = 0.61,
p < 0.01). Such correlation became moderately positive when other factors were considered, such as the average ISA (r
2 = 0.43,
p < 0.01), performance factor (r
2 = 0.35,
p < 0.01), actual flight b/o fuel (r
2 = 0.34,
p < 0.01), and age of the aircraft at the time of the flight (r
2 = 0.33,
p < 0.01). The differences between the aircrafts’ age groups were statistically significant in relation to the average FF, with higher average FF in the aircrafts that were in service for more than 6 years (
p < 0.001). Although both the ground and air distances showed significant associations with average FF, their associations were weak, though might reach negligible levels. On the other hand, there was a weak negative correlation between average FF and DOW (r
2 = −0.16,
p < 0.01) and average W/C (r
2 = −0.14,
p < 0.01) (
Table 4).
4.4. Predictors of Fuel Consumption
The Fisher test in the ANOVA table shows that the regression model with all variables perfectly fit the data relevant to either the total consumed fuel or the need for extra fuel (
p < 0.01). Therefore, multiple linear regression analysis was performed for both separately as dependent variables. The results of the statistical analysis revealed that the most significant predictors of the total consumed fuel were the actual ZFW (
p < 0.01), actual TOW (
p < 0.01), and actual average FF (
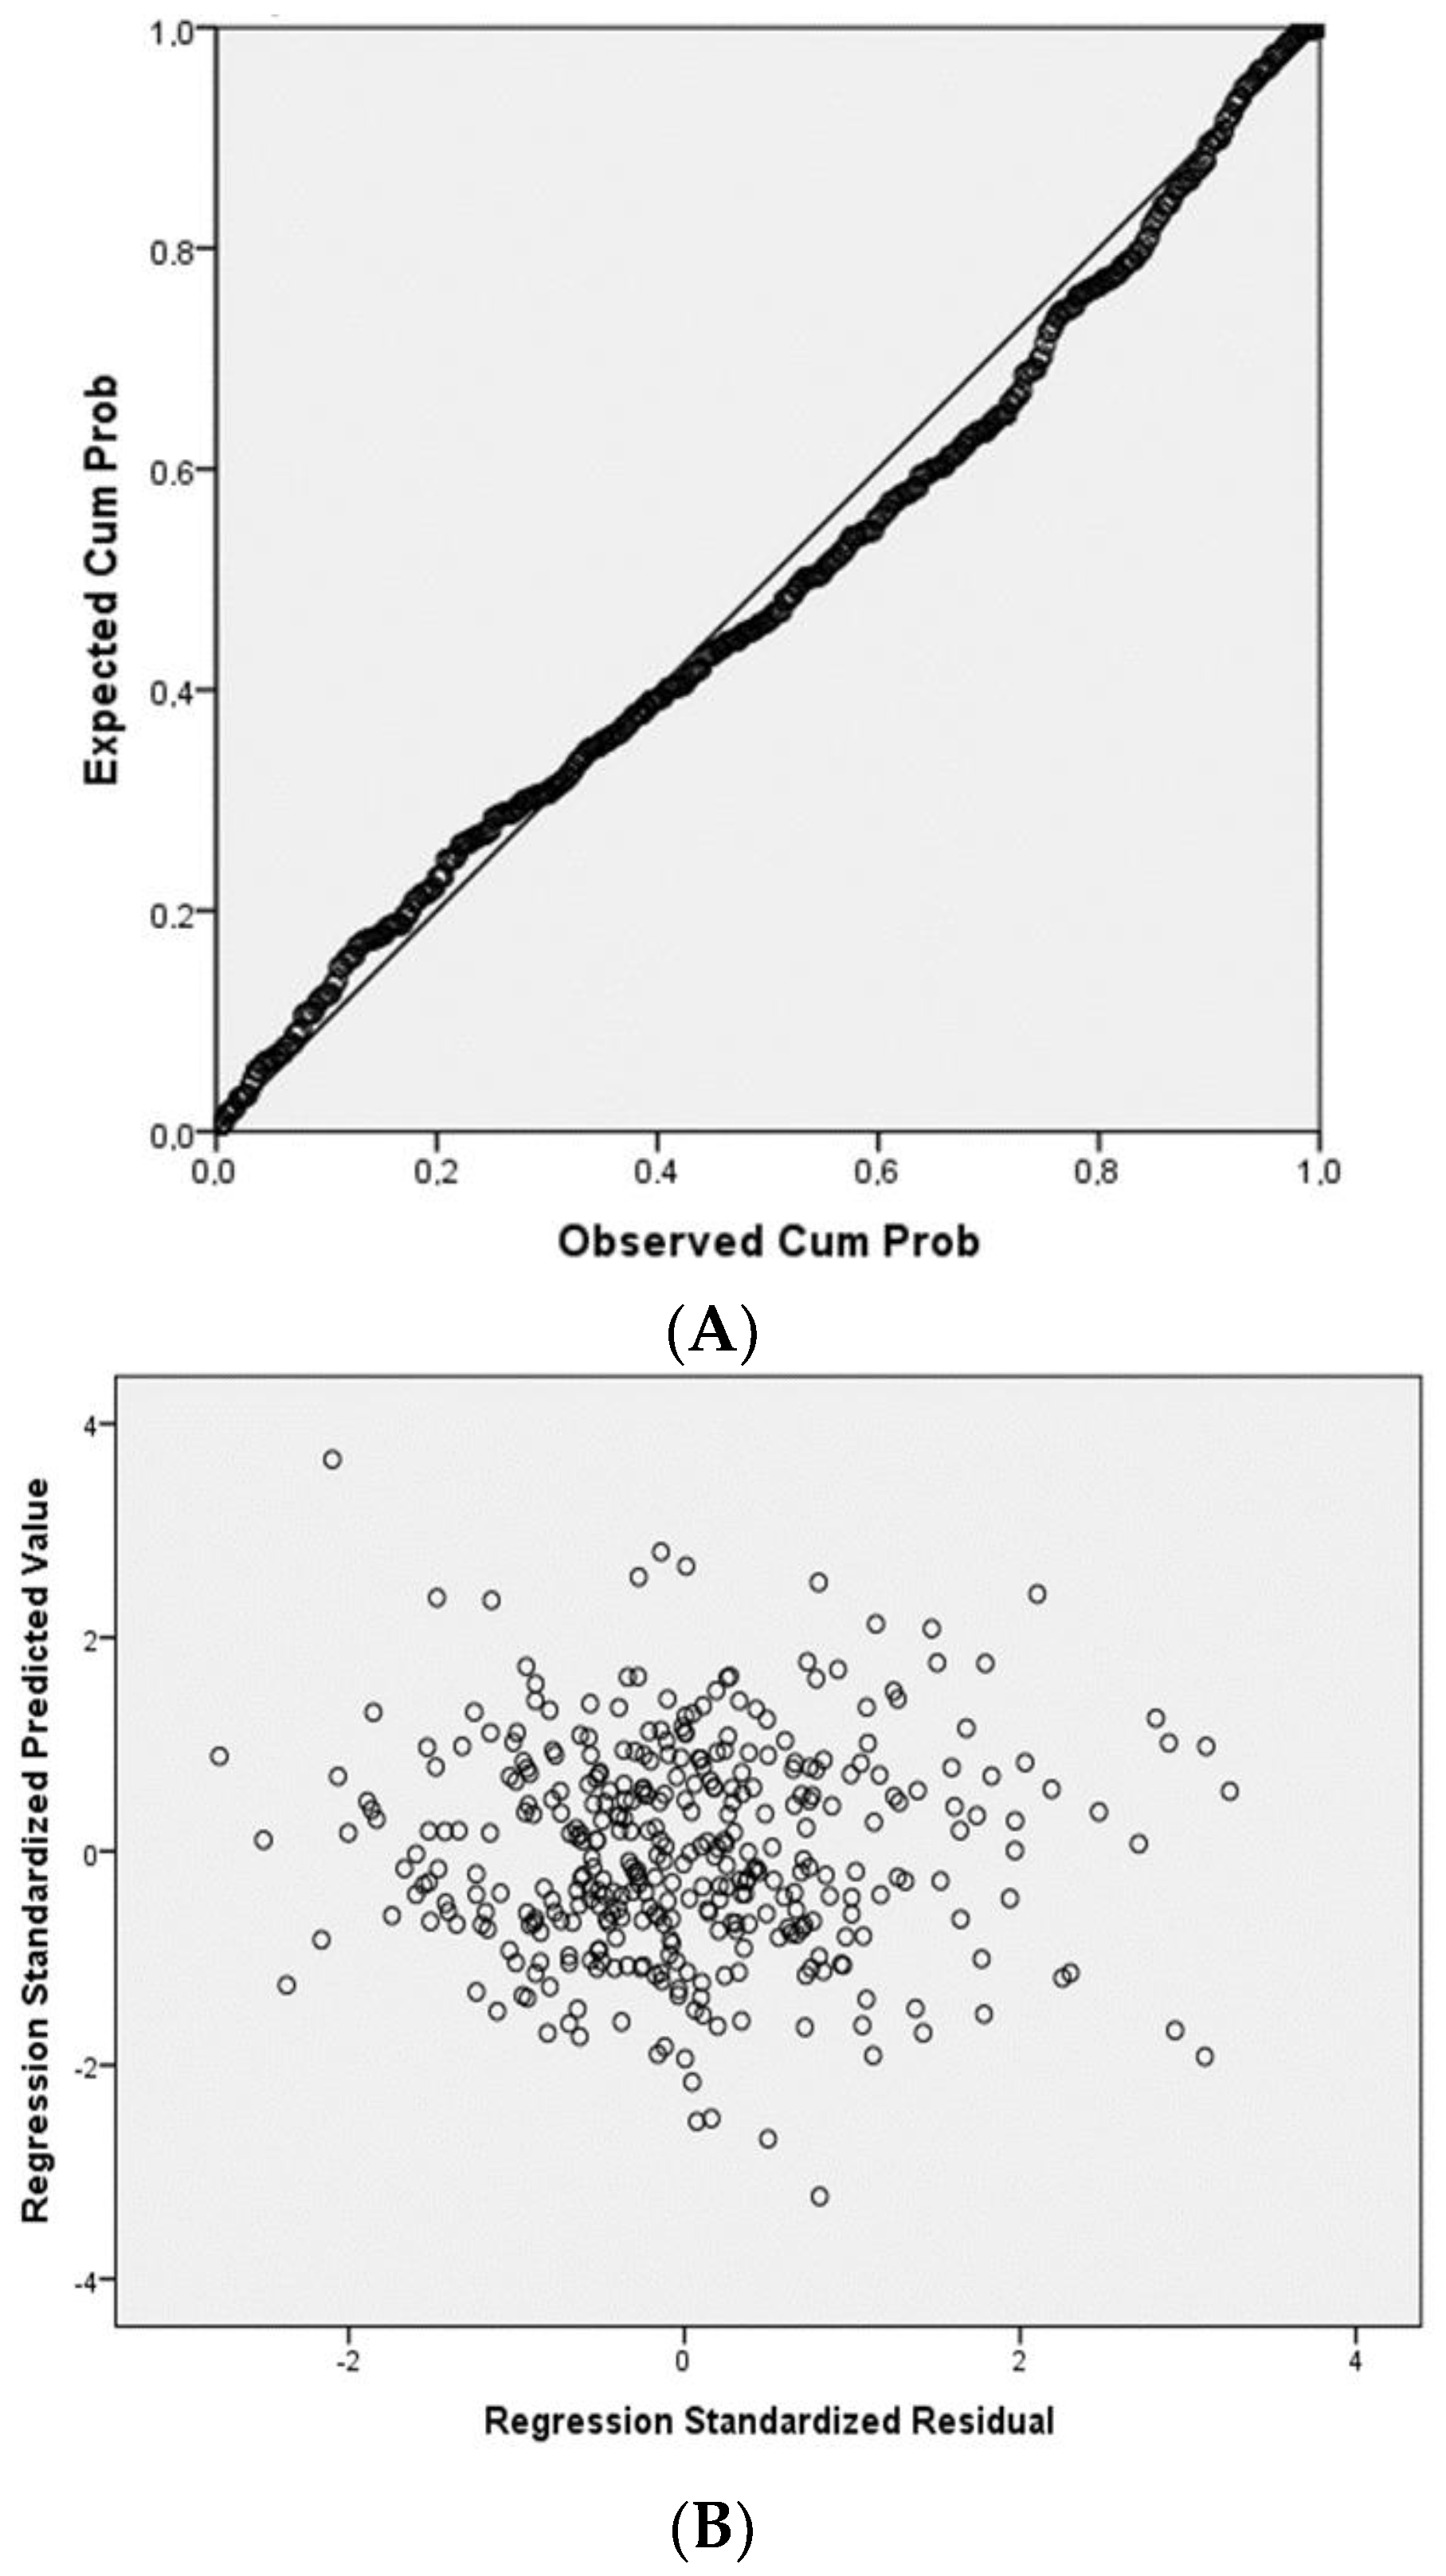
p = 0.017). In order to check the validity of the conducted model, three assumptions were tested. The first assumption was to verify that there were no significant outliers predicted by the multiple regression models.
Figure 1A shows that there were no significant outliers generated by our regression model, also the predicted values of the dependent variable using the independent variables were accurate. The second assumption was to verify the homoscedasticity.
The scatter plot in
Figure 1B showed that there was a consistent relationship between the regression standardized residual and standardized predicted values, which indicates the validity of the homoscedasticity assumption. The third assumption was to check the normality of the error distribution; in other terms, this hypothesis is used to check if a dataset is well modeled by a normal distribution.
Figure 1C, which compares the empirical cumulative distribution function of a dataset with a specified theoretical cumulative distribution function, shows that the residual values of the regression model followed a normal function of distribution, which confirmed the validity of the normality residual distribution.
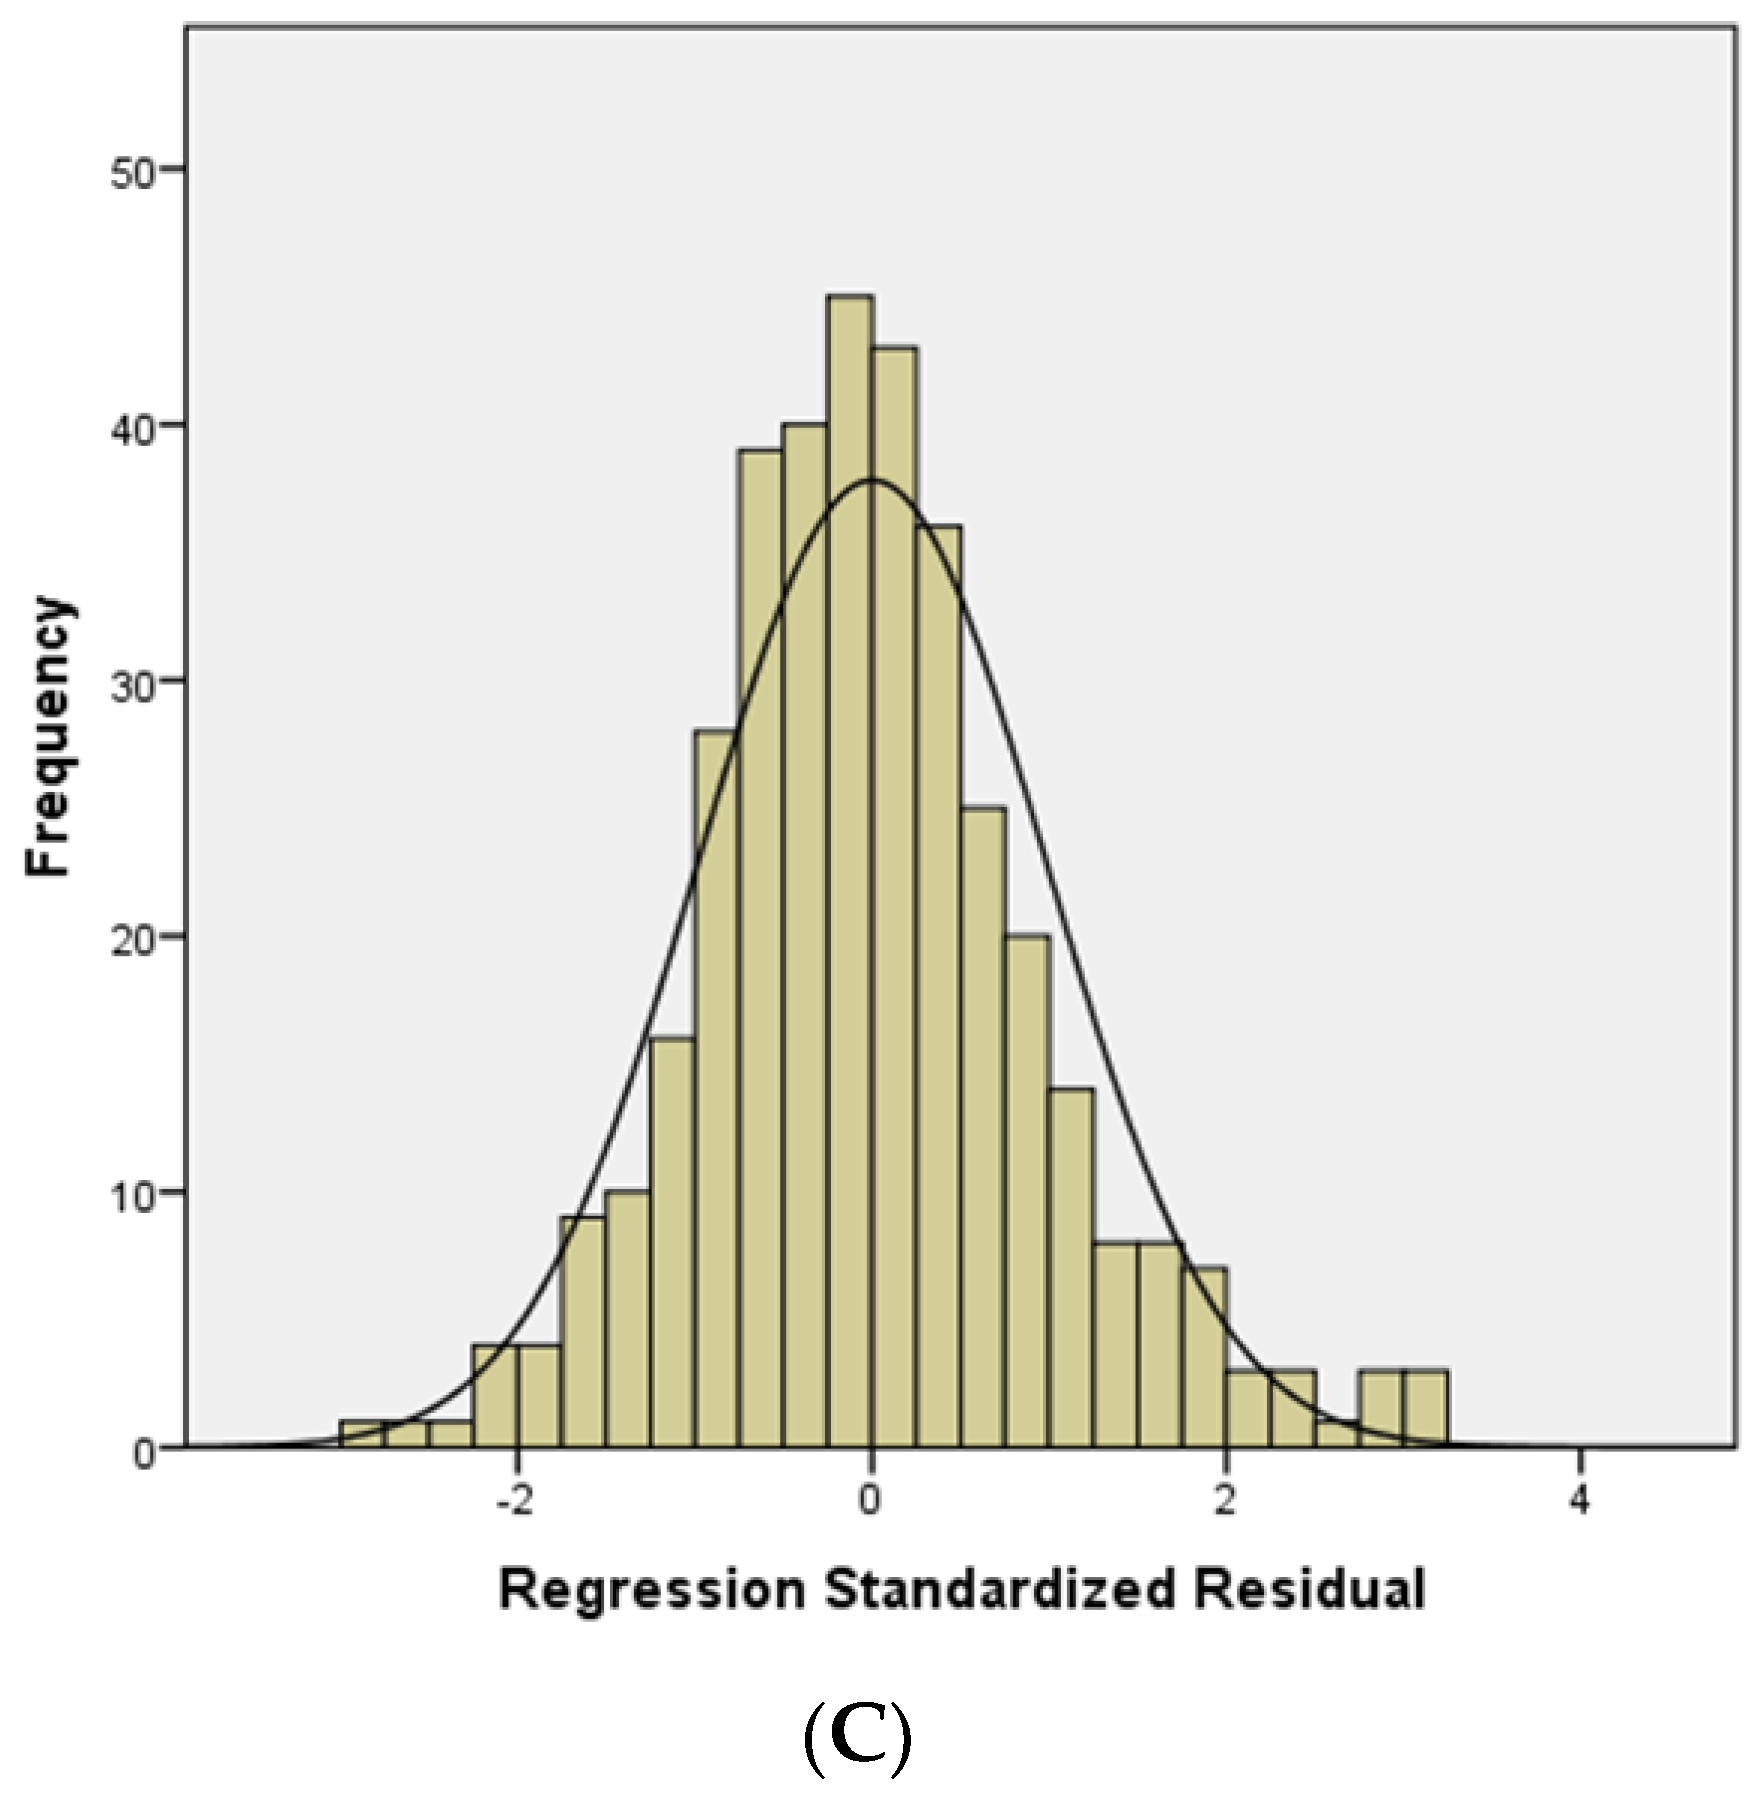
For the second dependent variable, the need for extra fuel, the significant predictive variables were the average W/C (
p = 0.046) and average ISA (
p = 0.003). Further validity analysis revealed that there were significant outliers in the dataset (
Figure 2A), the homoscedasticity was valid (
Figure 2B), and the normality of the error distribution was accurate (
Figure 2C).
5. Discussion
This research focused on the factors that could affect fuel consumption in aircrafts. The research examined the association between total fuel, extra fuel, and 21 selected factors from real random flights collected from an international airport. The results showed that the most positively associated factors with the total used fuel were the air distance (r
2 = 0.86,
p < 0.01), ground distance (r
2 = 0.78,
p < 0.01), TOW (r
2 = 0.68,
p < 0.01), and flight time (r
2 = 0.68,
p < 0.01). Alternate fuel (r
2 = 0.32,
p < 0.01), average ISA (r
2 = 0.24,
p < 0.01), difference between planned and actual flight time (r
2 = 0.16,
p < 0.01), and alternate time (r
2 = 0.31,
p < 0.01) were also positively correlated with total fuel but in a weak pattern. These results are consistent with previous research studies that found positive associations between fuel consumption optimizations and air distance [
14], ground distance [
21]; flight time [
22,
23], take-off weight [
27], alternate fuel [
15], difference between planned and actual flight time [
22,
23]. On the other side, AVG W/C was negatively correlated with total fuel (r
2 = −0.35,
p < 0.01). Other weak negatively correlated variables to total fuel included the difference between the actual and planned ZFW (r
2 = −0.17,
p < 0.01) and the actual and planned TOW (r
2 = −0.14,
p < 0.01).
The research also examined the association between average fuel flow and 13 selected factors. The results showed a strong positive association between the average fuel flow (FF) and actual TOW (r
2 = 0.74,
p < 0.01), as well as ZFW (r
2 = 0.61,
p < 0.01). Such correlation was moderately positive when other factors were considered, such as the average ISA (r
2 = 0.43,
p < 0.01), performance factor (r
2 = 0.35,
p < 0.01), actual flight b/o Fuel (r
2 = 0.34,
p < 0.01), and age of the aircraft at flight (r
2 = 0.33,
p < 0.01). The differences between the aircrafts’ age groups were statistically significant in relation to the average FF, with higher average FF in the aircrafts that were in service for more than 6 years (
p < 0.001). Although both the ground and air distances showed significant associations with average FF, their associations were weak, though might reach negligible levels. On the other hand, there was a weak negative correlation between average FF and DOW (r
2 = −0.16,
p < 0.01) and average W/C (r
2 = −0.14,
p < 0.01). Despite earlier studies (e.g., [
2,
3]) that connected fuel consumption optimization with several factors, FF has not between fully addressed in the literature, which raises the value of the current study.
The research also examined the factors that predict fuel consumption in aircrafts. The results of the statistical analysis revealed that the most significant predictors of the total consumed fuel were the actual ZFW (
p < 0.01); actual TOW (
p < 0.01), which supports the results of previous studies ZFW [
12,
20]; TOW [
27]; and actual average FF (
p < 0.05). The next sections discuss these findings and their implications for the aircraft and aviation industry overall.
5.1. Specific Fuel Consumption (SFC)
Specific fuel consumption (SFC) is one of the most important metrics employed in aviation. It is important not only in aircraft design, but also in the operation of the aircraft. SFC indicates how efficiently a power plant converts chemical into mechanical energy. While there is usually no great variation in SFC between engines within a specific class of power plants, there is a huge variation between the classes. Thus, piston engines are generally more efficient than turbo machinery, which is far more efficient than, say, rockets [
29]. This is important when ensuring the selection of a power plant matches the mission of the airplane, although most of the time this is not a problem. The primary importance is when estimating the range and endurance of the aircraft [
30].
One of the fastest expanding industries in the economy is the aviation industry [
16,
31]. The optimization of aircraft fuel use affects a broad variety of socioeconomic and political factors. A great lot of fuel savings may be achieved if these factors are effectively addressed. Moreover, the extent of public understanding of the impacts of air pollution on climate change has a major impact on fuel reduction. The public is yet to fully realize that the negative effects of aviation emissions on the global climate are not yet sufficiently well understood and there are social demands for low-emission airplanes. The broad social pressure urges the government to do something, which gives the government an indication that it needs to act. The government has discovered the problem using a scientific procedure [
32]. To enable a reduction in fuel usage, fuel economy in aircrafts is the measure of energy efficiency. Efficiency is increased with better aerodynamics and by reducing weight, and with improved engine BSFC and propulsive efficiency or TSFC.
5.2. Aviation Operations and Infrastructure
Aircraft fuel may vary based on a wide variety of conditions, from the start to the point when it can achieve cruise altitude, to the point near the landing when it is preparing to taxi. To carry out operational planning and strategy efficiently, several factors in the sector could be adjusted. Operating techniques are not always appropriate from the point of view of fuel consumption, and operational improvements are thus needed. Operational efficiency—a mixture of ground and airborne efficiency—and total efficiency may be used to assess operational efficiency. Airplane performance may largely be derived from the way fuel consumption is evaluated against a theoretical minimum, and from the efficient operating process which best minimizes the fuel consumption. The operating efficiency might be characterized as well as the payload factor in order to take care of the different fuel kinds. In addition, the operational factors to reduce passenger-km fuel use include boosting the load factor, optimizing aircraft speed, and decreasing auxiliary power utilization. Furthermore, it also enables pilots to take advantage of existing winds and accurate fuel loads and to set different flight levels and speeds to achieve the most economical efficiency. In addition, this also offers a highly sophisticated flight plan software to improve fuel efficiency for aircrafts. A standard flight contains various elements, such as cruising altitude and speed, as well as the weight and weather conditions, which influence fuel usage. Consequently, aircraft operations should be optimized from the beginning of the startup process, until landing, by cruising and driving on to the starting path, to decrease fuel consumption.
Aviation infrastructure plays a key role in optimizing fuel use. There are significant chances to reduce fuel use by changing the infrastructure in aviation. The design of an airport, for example the location of the runways and taxiways relative to the terminal buildings, obviously effects the amount of fuel an aircraft uses, since it reduces delays and time needed to taxi. Further methods of increasing the use of gasoline include airport congestion and inadequate air traffic management. Airport congestion occurs when the overall number of people, cars, and freight passing though the airport exceeds the system’s capacity at the time. The congested areas of the airport create longer taxi hours, higher fuel consumption, and more emissions to major United States and European airports [
33].
The Air Traffic Management (ATM) team is particularly important because it helps decrease the environmental impact of air transport by reducing inefficiencies during operations in aircraft. An ATM team from Rye Univ. carried out a possible fuel savings analysis by using econometric methodologies to analyze the effects of a delay at the airport, departure delay, and surplus time scheduled for flight, as well as the terminal fuel efficiency [
34]. While better design of terminals may reduce fuel consumption, improved design may aid increased fuel economy. Airports and airlines may examine several other measures to minimize the consumption and emissions of air transport fuel, in addition to aiming to avoid using fuel and emissions. There are strategies to improve these elements, including improvement of airspace use, air traffic control and operations, and other ways to leverage airspace and air traffic control and techniques to increase their use and integrate new tools and programs to discover the most efficient path. This includes establishing the best flight route determination techniques, including analyzing the influence of jet noise and fuel consumption [
34].
Alternative fuel from air transport has an influence on the use of fuel. The four dimensions were found to be separated into their respective decision-making elements. Hileman et al. [
35] said in their research that advanced aircraft design, operational advancements, and alternative fuels all contribute to a reduction in air emissions [
36].
Research has shown that a thinner body aircraft has the largest fuel burn reduction potential, but to accomplish this, it will have to promote innovative design of aircrafts and the extensive use of alternative fuels. Grote at al. [
37] evaluated technical, operational, and regulatory actions for reducing civil aviation fuel consumption in the light of the direct decrease of fuel consumption and the costs of many of the fuels on the market. The research also indicated that, owing to market limits, some actions could not be undertaken. Sgouridis et al. [
38] undertook five techniques for emission reduction in commercial air transport in order to analyze the impacts: improved engineering efficiency, improved operational efficiency, use of alternative fuels, shift of demand, and altered carbon pricing [
39].
5.3. Aviation Alternative Fuels and Fuel Properties
Other aviation fuel options, like solar power and biomass-based aviation fuel, have a crucial role to play in optimizing the total use of aviation fuel. Each major aviation industry, engine makers, and other government agencies are all doing their best in using alternative fuels in aviation due to the energy problems of the 1970s. A viable alternative fuel for air traffic may reduce fuel price volatility and hence reduce the dependence on crude oil. A study [
38] showed that economic sustainability, environmental concerns, energy diversity, and competition for power resources are significant factors for the development of alternative jet fuel. Due to its intrinsic qualities, replacement fuels for alternative fuel today do not require any changes to the aircraft and are suitable for the current aviation system, including existing infrastructure for distribution and refueling. The tests for synthetic liquid alternative jet fuels were investigated [
40] and the compatibility between materials and the current aircraft fleet was determined, but these alternatives are not suited for commercial air transport in the immediate term due to production costs and the lack of feedstock availability. This further investigation attempted to determine if alternative aviation fuels are viable. One such fuel was traditional petroleum jet fuel, which was combined with other jet fuel types, including synthetic jet fuel, biodiesel, and organic petrol. Another alternative fuel was ethanol coupled with butanol, while another option of fuel was liquefied natural gas and hydrogen and its allies, including ethanol and butanol, which were the ultimate alternatives. The potential of liquid hydrogen as an alternative fuel for commercial air travel was studied [
39] along with research by many other studies that indicated the fundamental elements that determine fuel usage. A study [
40] evaluated the compatibility with the Jet A-1, the viscosity, the temperature of the cloud point, flash points, energy content, and fuel burn’s effects on the ranges vs. payload of projected air fuel. Only hydrocarbons fulfilled the required range vs. payload after reviewing the results of the investigation [
40].
Aircraft design and technology requirements have also been taken into account. A study [
41] examined aircraft design for optimal environmental performance, including aircraft geometry, motor properties, and crossover settings, including design considerations for optimization problems. This may be established from the lowest fuel usage of the airplane. In combination with decreased generated drag, a high bypass, and high core pressures and temperatures, an aerodynamically low aspect ratio was used. The mission range and crossing number Mach were also changed to optimize the efficiency of freight fuel. This explored the ability to produce larger aircrafts with shorter ranges and found that weight reduction might be achieved in the construction of the aircraft by reducing fuel use.
The technology of airframes and the use of lightweight metals and composites enhances energy efficiency and fuel economy; though this conclusion may be radically different in other developments, including genetic breakthroughs, nanotechnologies, and non-production [
41]. With the capacity to unite the different design innovations and optimize fuel efficiency, fuel consumption may now be improved. Research into aircraft design and aviation offers the greatest potential for increasing the fuel economy in aviation and some of the literature’s most significant achievements have been given [
42].
6. Conclusions and Implications
This research study addressed fuel consumption optimization in civil aviation. The research examined the association between fuel consumption and several other factors using recorded data from an international airport. The results showed that the most positively associated factors with the total used fuel were the air distance, ground distance, TOW, and flight time. Moreover, other factors were associated with fuel consumption, but in a weak pattern, including alternate fuel, average ISA, difference between planned and actual flight time, and alternate time. The results also showed a strong positive association between the average FF and actual TOW, as well as ZFW. Additionally, moderate positive association was recorded with other factors, e.g., the average ISA, performance factor, actual flight b/o fuel, and age of the aircraft at flight. On the other hand, the results showed that the differences between the aircrafts’ age groups were statistically significant in relation to the average FF, with higher average FF in the aircrafts that were in service for more than 6 years.
According to the results of this research, indicators of fuel efficiency from the Friedman test of the regression equation with all parameters precisely matched the information relative to either the overall used fuel or the demand for more oil. This research adopted a GLM model with a fixed effect to assess the drivers of total energy usage The results revealed that the most significant predictors of the total consumed fuel were the actual ZFW, actual TOW, and actual average FF.
The results have some implications for fuel consumption optimizations. First, to reduce the weight of the flight, which significantly affects the fuel consumption, attention needs to be paid to ground crew, flight check crew, and cabin crew. Proper planning should be conducted by ground crew to provide information for flight check crew about the flight (e.g., temperature, wind, routing, navigation) and undertake appropriate maintenance for the airplane. Flight check crew are responsible for making the decision on the flight and this affects the rate of fuel consumption. Cabin crew should be at a minimal level, considering the aircraft as well as the regulations of ICAO and the destination. All these crew should be qualified and well trained to apply the aviation standards and regulations.
In relation to the ground distance, accurate information should be established during the planning phase and before scheduled time of departure. Aircraft dispatchers collect this information and refine them for flight check crew to help them make the right decision during the flight time. This includes metrological, alternative airports, and the need for extra fuel. Extra fuel should be requested enough time before the take-off time. Flexible route options should be given to flight check crew to save fuel consumption. With regard to air distance, alliances with other carriers are crucial to reduce the distance and ensure the fuel efficiency. Adopting flight management computer support will aid in fuel consumption optimization.
Airline carriers should pay greater attention to the integration of bio-fuel in the aircrafts to reduce the global carbon emissions and ensure positive climate impact. The deployment of bio-jet fuel could have an impact on expansion of bio-jet fuel and carbon reduction. This significantly affects the sustainable development of the aviation industry.
7. Limitations of the Study and Opportunities for Further Research
This research study was limited to recorded data obtained from one of the international airports in Egypt about 400 flights from one of the international airline carriers. The data included some specific factors (21 factors) that were examined in this study. However, other factors exist, but were not examined in the current research, e.g., aircraft technology and design. Further research could examine data from different airports with different carriers. Another opportunity for further research could be examining each factor investigated in current study separately and in more detail.
Author Contributions
Conceptualization, T.H.H. and A.E.S.; data curation, A.E.E.S. and A.E.S.; formal analysis, T.H.H. and A.E.S.; funding acquisition, T.H.H.; investigation, A.E.S.; methodology, T.H.H., A.E.S. and A.E.E.S.; project administration, A.E.S.; resources, T.H.H., A.E.E.S. and A.E.S.; software, T.H.H.; supervision, T.H.H.; validation, A.E.E.S., A.E.S. and T.H.H.; visualization, T.H.H. and A.E.S.; writing—original draft, T.H.H.; writing—review and editing, A.E.E.S. and T.H.H. All authors have read and agreed to the published version of the manuscript.
Funding
The Deputyship for Research and Innovation, Ministry of “Education” in Saudi Arabia, the project number (IFT20201).
Institutional Review Board Statement
Not applicable.
Informed Consent Statement
Not applicable.
Data Availability Statement
Data available on request due to privacy/ethical restrictions.
Acknowledgments
The authors extended their appreciation to the Deputyship for Research and Innovation, Ministry of “Education” in Saudi Arabia, for funding for this research work through the project number (IFT20201).
Conflicts of Interest
The authors declare no conflict of interest.
References
- Singh, V.; Sharma, S.K.; Vaibhav, S. Identification of dimensions of the optimization of fuel consumption in air transport industry: A literature review. Technology 2012, 2, 24–33. [Google Scholar]
- Singh, V.; Sharma, S.K. Evolving base for the fuel consumption optimization in Indian air transport: Application of structural equation modeling. Eur. Transp. Res. Rev. 2014, 6, 315–332. [Google Scholar] [CrossRef] [Green Version]
- Singh, V.; Sharma, S.K. Fuel consumption optimization in air transport: A review, classification, critique, simple meta-analysis, and future research implications. Eur. Transp. Res. Rev. 2015, 7, 1–24. [Google Scholar] [CrossRef]
- Greene, D.L. Energy-Efficiency Improvement Potential of Commercial Aircraft. Annu. Rev. Energy Environ. 1992, 17, 537–573. [Google Scholar] [CrossRef]
- Olabi, A.G.; Wilberforce, T.; Abdelkareem, M.A. Fuel cell application in the automotive industry and future perspective. Energy 2021, 214, 118955. [Google Scholar] [CrossRef]
- Nygren, E.; Aleklett, K.; Höök, M. Aviation fuel and future oil production scenarios. Energy Policy 2009, 37, 4003–4010. [Google Scholar] [CrossRef] [Green Version]
- Schlumberger, C.; Wang, D. Air Transport and Energy Efficiency; Transport Papers TP-38; The International Bank for Reconstruction and Development/The World Bank Group: Washington, DC, USA, 2012. [Google Scholar]
- Majka, A.; Brusow, V.; Klepack, Z. Fuel Consumption and transportation energy effective analysis. Eur. Pers. Air Transp. Syst. Study EP-D4 2007, 3, 1–23. [Google Scholar]
- Ryerson, M.S.; Hansen, M. The potential of turboprops for reducing aviation fuel consumption. Transp. Res. Part D Transp. Environ. 2010, 15, 305–314. [Google Scholar] [CrossRef]
- Chang, Y.-T.; Park, H.-S.; Jeong, J.-B.; Lee, J.-W. Evaluating economic and environmental efficiency of global airlines: A SBM-DEA approach. Transp. Res. Part D Transp. Environ. 2014, 27, 46–50. [Google Scholar] [CrossRef]
- Liu, F.; Li, Z.; Xie, H.; Yang, L.; Hu, M. Predicting Fuel Consumption Reduction Potentials Based on 4D Trajectory Optimization with Heterogeneous Constraints. Sustainability 2021, 13, 7043. [Google Scholar] [CrossRef]
- Wulandari, A.; Sari, W.P.; An, C.; Firdaus, M.I. Optimization of Fuel Tankering and Cargo Maximization at Garuda Indonesia Airline to Gain Profitability (Study Case of Route Cgk-Sub). J. Phys. Conf. Ser. 2020, 1573, 012035. [Google Scholar] [CrossRef]
- Zhang, M.; Huang, Q.; Liu, S.; Zhang, Y. Fuel Consumption Model of the Climbing Phase of Departure Aircraft Based on Flight Data Analysis. Sustainability 2019, 11, 4362. [Google Scholar] [CrossRef] [Green Version]
- Zou, B.; Kwan, I.; Hansen, M.; Rutherford, D.; Kafle, N. Airline Fuel Efficiency: Assessment Methodologies and Applications in the U.S. Domestic Airline Industry. Airl. Effic. 2016. [Google Scholar] [CrossRef] [Green Version]
- Bielaczyc, P.; Woodburn, J.; Szczotka, A.; Pajdowski, P. The Impact of Alternative Fuels on Fuel Consumption and Exhaust Emissions of Greenhouse Gases from Vehicles Featuring SI Engines. Energy Procedia 2015, 66, 21–24. [Google Scholar] [CrossRef] [Green Version]
- Carter, D.A.; Rogers, D.A.; Simkins, B.J. Does hedging affect firm value? Evidence from the US airline industry. Financ. Manag. 2006, 35, 53–86. [Google Scholar] [CrossRef]
- Oum, T.H.; Yu, C. Cost competitiveness of major airlines: An international comparison. Transp. Res. Part A Policy Pract. 1998, 32, 407–422. [Google Scholar] [CrossRef]
- Airtransport Action Group. Beginner’s Guide to Aviation Efficiency. 2010. Available online: ATAG_EfficiencyGuide_REPRINT_web.pdf (accessed on 20 June 2021).
- Burzlaff, M. Aircraft Fuel Consumption-Estimation and Visualization; Aircraft Design and Systems Group (AERO), Department of Automotive and Aeronautical Engineering, Hamburg University of Applied Sciences: Hamburg, Germany, 2017. [Google Scholar]
- Fedral Aviation Administration. Advisory Circular: Aircraft Wight and Balance Contol. 2005. Available online: https://www.faa.gov/documentlibrary/media/advisory_circular/ac120-27e.pdf (accessed on 20 June 2021).
- ICAO Annex 8 Part IIIA Paragraph 2.2.3.3. and Part IIIB Sub-part B Paragraph B2.7 e. In ICAO Doc 9760 (Airworthiness Manual) 3rd Edition-2014. Available online: https://www.icao.int/MID/Documents/2014/Airworthiness%20Manual%20Seminar/PPT.pdf (accessed on 2 June 2021).
- Kuhn, H.; Falter, C.; Sizmann, A. Renewable energy perspectives for aviation. In Proceedings of the 3rd CEAS Air&Space Conference and 21st AIDAA Congress, Venice, Italy, 24–28 October 2011; pp. 1249–1259. Available online: https://www.researchgate.net/publication/271457052_Renewable_Energy_Perspectives_for_Aviation/link/54c89bbc0cf22d626a39c5c8/download (accessed on 2 June 2021).
- Hecq, W.; Borisov, Y.; Totte, M. Daylight saving time effect on fuel consumption and atmospheric pollution. Sci. Total Environ. 1993, 133, 249–274. [Google Scholar] [CrossRef]
- Xu, H.; Xiao, K.; Cheng, J.; Yu, Y.; Liu, Q.; Pan, J.; Chen, J.; Chen, F.; Fu, Q. Characterizing aircraft engine fuel and emission parameters of taxi phase for Shanghai Hongqiao International Airport with aircraft operational data. Sci. Total Environ. 2020, 720, 137431. [Google Scholar] [CrossRef]
- Li, M.; Zhou, Q. Industrial big data visualization: A case study using flight data recordings to discover the factors affecting the airplane fuel efficiency. In 2017 IEEE Trustcom/BigDataSE/ICESS; IEEE: Piscataway, NJ, USA, 2017; pp. 853–858. [Google Scholar]
- Antoine, N.E.; Kroo, I.M. Framework for aircraft conceptual design and environmental performance studies. AIAA J. 2005, 43, 2100–2109. [Google Scholar] [CrossRef]
- Eller, R.D.A.G.; Moreira, M. The main cost-related factors in airlines management. J. Transp. Lit. 2014, 8, 8–23. [Google Scholar] [CrossRef]
- Wei, H.; Liu, W.; Chen, X.; Yang, Q.; Li, J.; Chen, H. Renewable bio-jet fuel production for aviation: A review. Fuel 2019, 254, 115599. [Google Scholar] [CrossRef]
- Xue, D.; Ng, K.K.; Hsu, L.T. Multi-objective flight altitude decision considering contrails, fuel consumption and flight time. Sustainability 2020, 12, 6253. [Google Scholar] [CrossRef]
- Givoni, M.; Rietveld, P. The environmental implications of airlines’ choice of aircraft size. J. Air Transp. Manag. 2010, 16, 159–167. [Google Scholar] [CrossRef]
- Mastroddi, F.; Gemma, S. Analysis of Pareto frontiers for multidisciplinary design optimization of aircraft. Aerosp. Sci. Technol. 2013, 28, 40–55. [Google Scholar] [CrossRef]
- Simaiakis, I.; Balakrishnan, H. Impact of congestion on taxi times, fuel burn, and emissions at major airports. Transp. Res. Rec. 2010, 2184, 22–30. [Google Scholar] [CrossRef] [Green Version]
- Wright, T.P. Factors affecting the cost of airplanes. J. Aeronaut. Sci. 1936, 3, 122–128. [Google Scholar] [CrossRef]
- Salah, K. Environmental impact reduction of commercial aircraft around airports. Less noise and less fuel consumption. Eur. Transp. Res. Rev. 2014, 6, 71–84. [Google Scholar] [CrossRef] [Green Version]
- Hileman, J.I.; De la Rosa Blanco, E.; Bonnefoy, P.A.; Carter, N.A. The carbon dioxide challenge facing aviation. Prog. Aerosp. Sci. 2013, 63, 84–95. [Google Scholar] [CrossRef]
- Agarwal, R.K. Sustainable (Green) Aviation: Challenges and Opportunities. SAE Int. J. Aerosp. 2009, 2, 1–20. [Google Scholar] [CrossRef]
- Grote, M.; Williams, I.; Preston, J. Direct carbon dioxide emissions from civil aircraft. Atmos. Environ. 2014, 95, 214–224. [Google Scholar] [CrossRef]
- Sgouridis, S.; Bonnefoy, P.A.; Hansman, R.J. Air transportation in a carbon constrained world: Long-term dynamics of policies and strategies for mitigating the carbon footprint of commercial aviation. Transp. Res. Part A Policy Pract. 2011, 45, 1077–1091. [Google Scholar] [CrossRef]
- Janić, M. Greening commercial air transportation by using liquid hydrogen (LH 2) as a fuel. Int. J. Hydrogen Energy 2014, 39, 16426–16441. [Google Scholar] [CrossRef]
- Chuck, C.J.; Donnelly, J. The compatibility of potential bioderived fuels with Jet A-1 aviation kerosene. Appl. Energy 2014, 118, 83–91. [Google Scholar] [CrossRef] [Green Version]
- Stolzer, A.J. Fuel consumption modeling of a transport category aircraft using flight operations quality assurance data: A literature review. J. Air Transp. 2002, 7, 93. [Google Scholar]
- Henderson, R.P.; Martins, J.R.R.A.; Perez, R.E. Aircraft conceptual design for optimal environmental performance. Aeronaut. J. 2012, 116, 1–22. [Google Scholar] [CrossRef] [Green Version]
| Publisher’s Note: MDPI stays neutral with regard to jurisdictional claims in published maps and institutional affiliations. |
© 2021 by the authors. Licensee MDPI, Basel, Switzerland. This article is an open access article distributed under the terms and conditions of the Creative Commons Attribution (CC BY) license (https://creativecommons.org/licenses/by/4.0/).


