Article

Efficient Plant Types and Coverage Rates for Optimal Green Roof to Reduce Urban Heat Island Effect

1
Department of Forestry & Landscape Architecture, Konkuk University, Seoul 05029, Korea
2
Rural Environment & Resource Division, National Institute of Agricultural Sciences, Jeonju 54875, Korea
*
Author to whom correspondence should be addressed.
Sustainability 2022, 14(4), 2146; https://doi.org/10.3390/su14042146
Submission received: 24 January 2022 / Revised: 11 February 2022 / Accepted: 11 February 2022 / Published: 14 February 2022
(This article belongs to the Section Social Ecology and Sustainability)

Abstract

:
Green roofs are implemented to reduce the urban heat island effect; however, studies are limited to comparing the reduction in urban heat island effect before and after implementation, and the focus is on the structural stability of the building rather than urban heat island reduction. In this study, using the sky view factor (SVF) in ENVI-met, a 3D microclimate modeling program, urban spaces were classified as closed, semi-open, and open areas. Meanwhile, the green roof types were subdivided according to the vegetation coverage rates, which included grass, shrubs, and trees. The vegetation ratio was evaluated using ENVI-met to determine which of the 10 scenarios was most effective for each urban space. The thermal environment was most comfortable in semi-open areas. Therefore, the green roof scenario with 70% grass and 30% trees was effective in closed areas, 50% shrubs and 50% trees were best in semi-open areas, and 70% grass with 30% trees, or 30% grass and 70% trees, was best in open areas. This study provides a basis for creating green roof guidelines aimed at improving the urban thermal environment, as well as creating other green infrastructure elements in cities.

1. Introduction

Due to rapid industrial development and increasing population density, cities are facing problems such as having a high building coverage ratio and large traffic volumes. These problems increase energy consumption and artificial heat, forming a unique climate called an urban heat island (UHI) [1]. The UHI effect is a phenomenon in which urban temperatures are higher than ambient temperatures, and photochemical reactions of pollutants form heat waves that make them vulnerable to the thermal environment [2,3,4,5]. If this phenomenon persists, it will promote thermal stress among urban residents, resulting in discomfort, as well as an increase in the mortality rates among the elderly and urban poor [6,7]. As urban areas continue to expand as the population increases, the UHI effect is accelerating; accordingly, research is being conducted to quantify and improve urban thermal environments [8,9,10,11,12,13,14].
In order to control the microclimate in an outdoor space, temperature and humidity should be used, but they are limited, so plans using urban spatial structures are needed [15]. In terms of urban planning, the typical way to prevent temperature rise is by blocking or absorbing solar radiation through the creation of green areas [16,17,18,19]. For example, the shading effect of trees, wind corridors, and evapotranspiration from plants all reduce net thermal radiation and increase latent heat, ultimately lowering sensible heat [20,21,22,23,24,25]. However, in cities with a lot of gray infrastructure, the physical environment of the city [26] and its economic, spatial, and temporal problems collide, making it impossible to realistically create green areas. Therefore, efforts are being made to improve the thermal environment by utilizing green infrastructure (GI) as an alternative to gray infrastructure [27,28].
The concept of GI is widely and variously defined, but the first GI concept was defined in 2002 as a strategy for sustainable community development [27]. Since then, as natural environmental policies have developed due to changes in urban microclimates, the concept of GI has been redefined as a way to enhance the value of cities through a network of natural factors [28]. As such, GI is defined as the natural factors that can increase the value of a city; thus, GI classification according to the purpose of a particular study is required. GI elements that improve the urban thermal environment include trees, grass, shrubs, green roofs, green walls, and parks [29]. From the perspective of a city’s physical environment, the city is categorized according to the types of buildings and roof surfaces, which account for 20% of all urban surfaces [30,31]. Thus, the need for GI elements that are particularly applicable to buildings is increasing. In particular, the implementation of green roofs is a new urban GI development strategy that improves the local environment by increasing the area in which vegetation can be planted in areas with a high density of buildings [32,33]. In addition to reducing the UHI effect, green roofs provide cities with increased social, environmental, and economic benefits due to several advantages such as improved rainwater management, the creation of urban habitats for plants and animals, improved air and water quality, and reduced building energy consumption costs [34,35,36,37,38,39,40]. As the density of buildings continues to rise due to increases in urban populations, the surface ratio of rooftops is also expected to proportionally increase. Therefore, the importance of green roofs is further increased [31]. However, most studies on the effect of green roofs on the thermal environment have focused on simple comparisons of the temperature and energy efficiency before and after green roof construction [41,42,43,44,45]. This is because the focus is generally on the structural stability of the buildings rather than on the urban environment as a whole, which has received comparably little attention.
Therefore, when conducting research on how to improve the thermal environment, the ratio of trees and grass should be considered simultaneously with geometric factors reflecting the physical environment of the building type and land cover and impermeable areas [26,39,46]. In addition, as the air temperature depends on the climate characteristics of the surrounding area, it is necessary to select a case site that can represent the city type rather than simply comparing the existence of green roofs or designing effective green roofs according to the building type. This study attempts to derive effective green roof designs for various urban thermal environments based on the urban area type and the composition of plant cover on the roof surface. The effect of the green roof on the thermal environment is quantitatively shown using the ENVI-met climate simulation software. The results of this study will not only confirm the relationship of green roofs with other GI, but also provide green roof design guidelines that consider the thermal environment rather than building management. In addition, it is expected that the thermal environment will be improved more effectively by designing green roofs according to the type of urban space.

2. Materials and Methods

2.1. Literature Review

ENVI-met is a three-dimensional (3D) microclimate modeling program that includes a soil model, a vegetation model, and a heat exchange model [47]. It supports a grid shape capable of spatial modeling and is able to numerically analyze detailed microclimate changes. In addition, it can determine microclimate changes in surrounding areas due to high-rise buildings and planting in urban areas. ENVI-met has the advantage of allowing the user to freely choose the conditions for factors such as vegetation, soil, and buildings, which allows analyses to be conducted according to the user’s design plan [48].
Due to these advantages, ENVI-met has recently been used in research aiming to determine the positive effects of green roofs on the thermal environment [49,50,51]. Herath et al. [49] used ENVI-met to examine the thermal environment mitigation potential of green infrastructure. A total of six scenarios were devised based on combinations of green wall and green roof coverage ratios; the results showed that a combination of trees on curbsides, 50% green roofs, and 50% green walls, decreased the temperature by 1.90 °C, suggesting that such a strategic design was needed. Kim et al. [50] used ENVI-met to analyze the effects of roads, buildings, green areas, and open spaces on temperature and humidity. A total of five green roof scenarios were created: extreme, linear (longitudinal), linear (transverse), checkerboard, and unrealized rooftop gardens; a maximum reduction of −0.2 °C was achieved with the linear pattern (longitudinal). Huang and Chen [52] also analyzed the thermal environment using ENVI-met, and five scenarios were created by changing the packaging material and green coverage ratio. Finally, scenarios with green coverage ratios of 60% in streets, 80% in parks, and 100% for the roofs of public buildings resulted in a reduction effect of up to 2.00 °C [51].
However, it is difficult to determine whether the green coverage ratio alone adequately represents the effects on the thermal environment as a whole. The climate periodically changes, and UHIs can have different thermal environments depending on building qualities such as density, number of floors, and material.
Therefore, this study considered a case study site that represents a wide-area environment. The site was subdivided by calculating the sky view factor (SVF) through ENVI-met 3D modeling. The green roof scenario was also subdivided based on the ratios of grass and trees, and the type of green roof that was most effective for the building type was derived. These methods can provide practical guidelines that deviate from existing green roof construction plans that are not realistic, and it is expected that they can be used to effectively integrate urban types into more diverse cities by dividing them based on the SVF. Finally, the potential of the green roof, such as improving the thermal environment, was determined by examining the case site as a real space with various land-cover materials.

2.2. Simulation Methodology

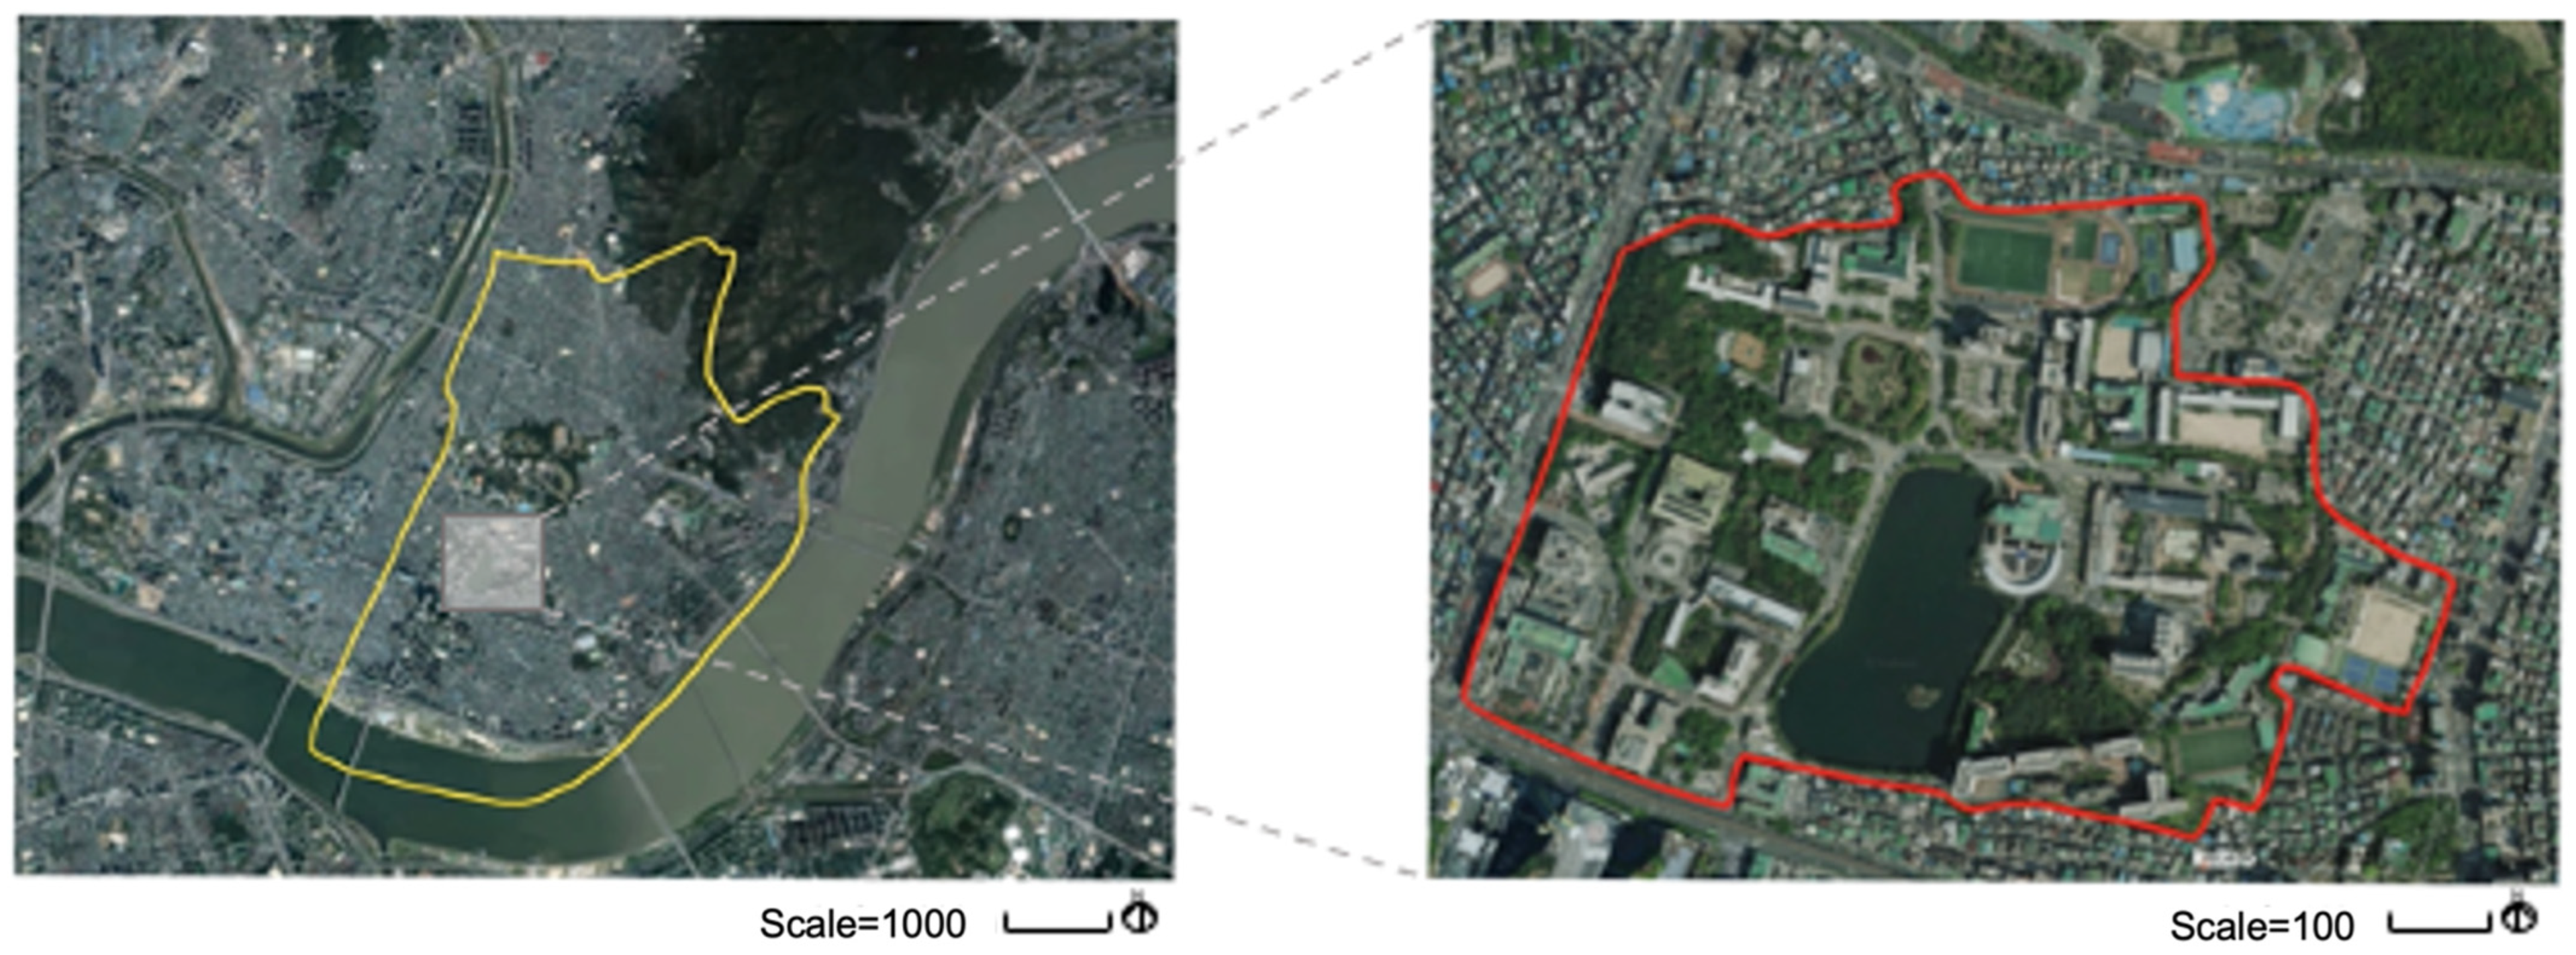
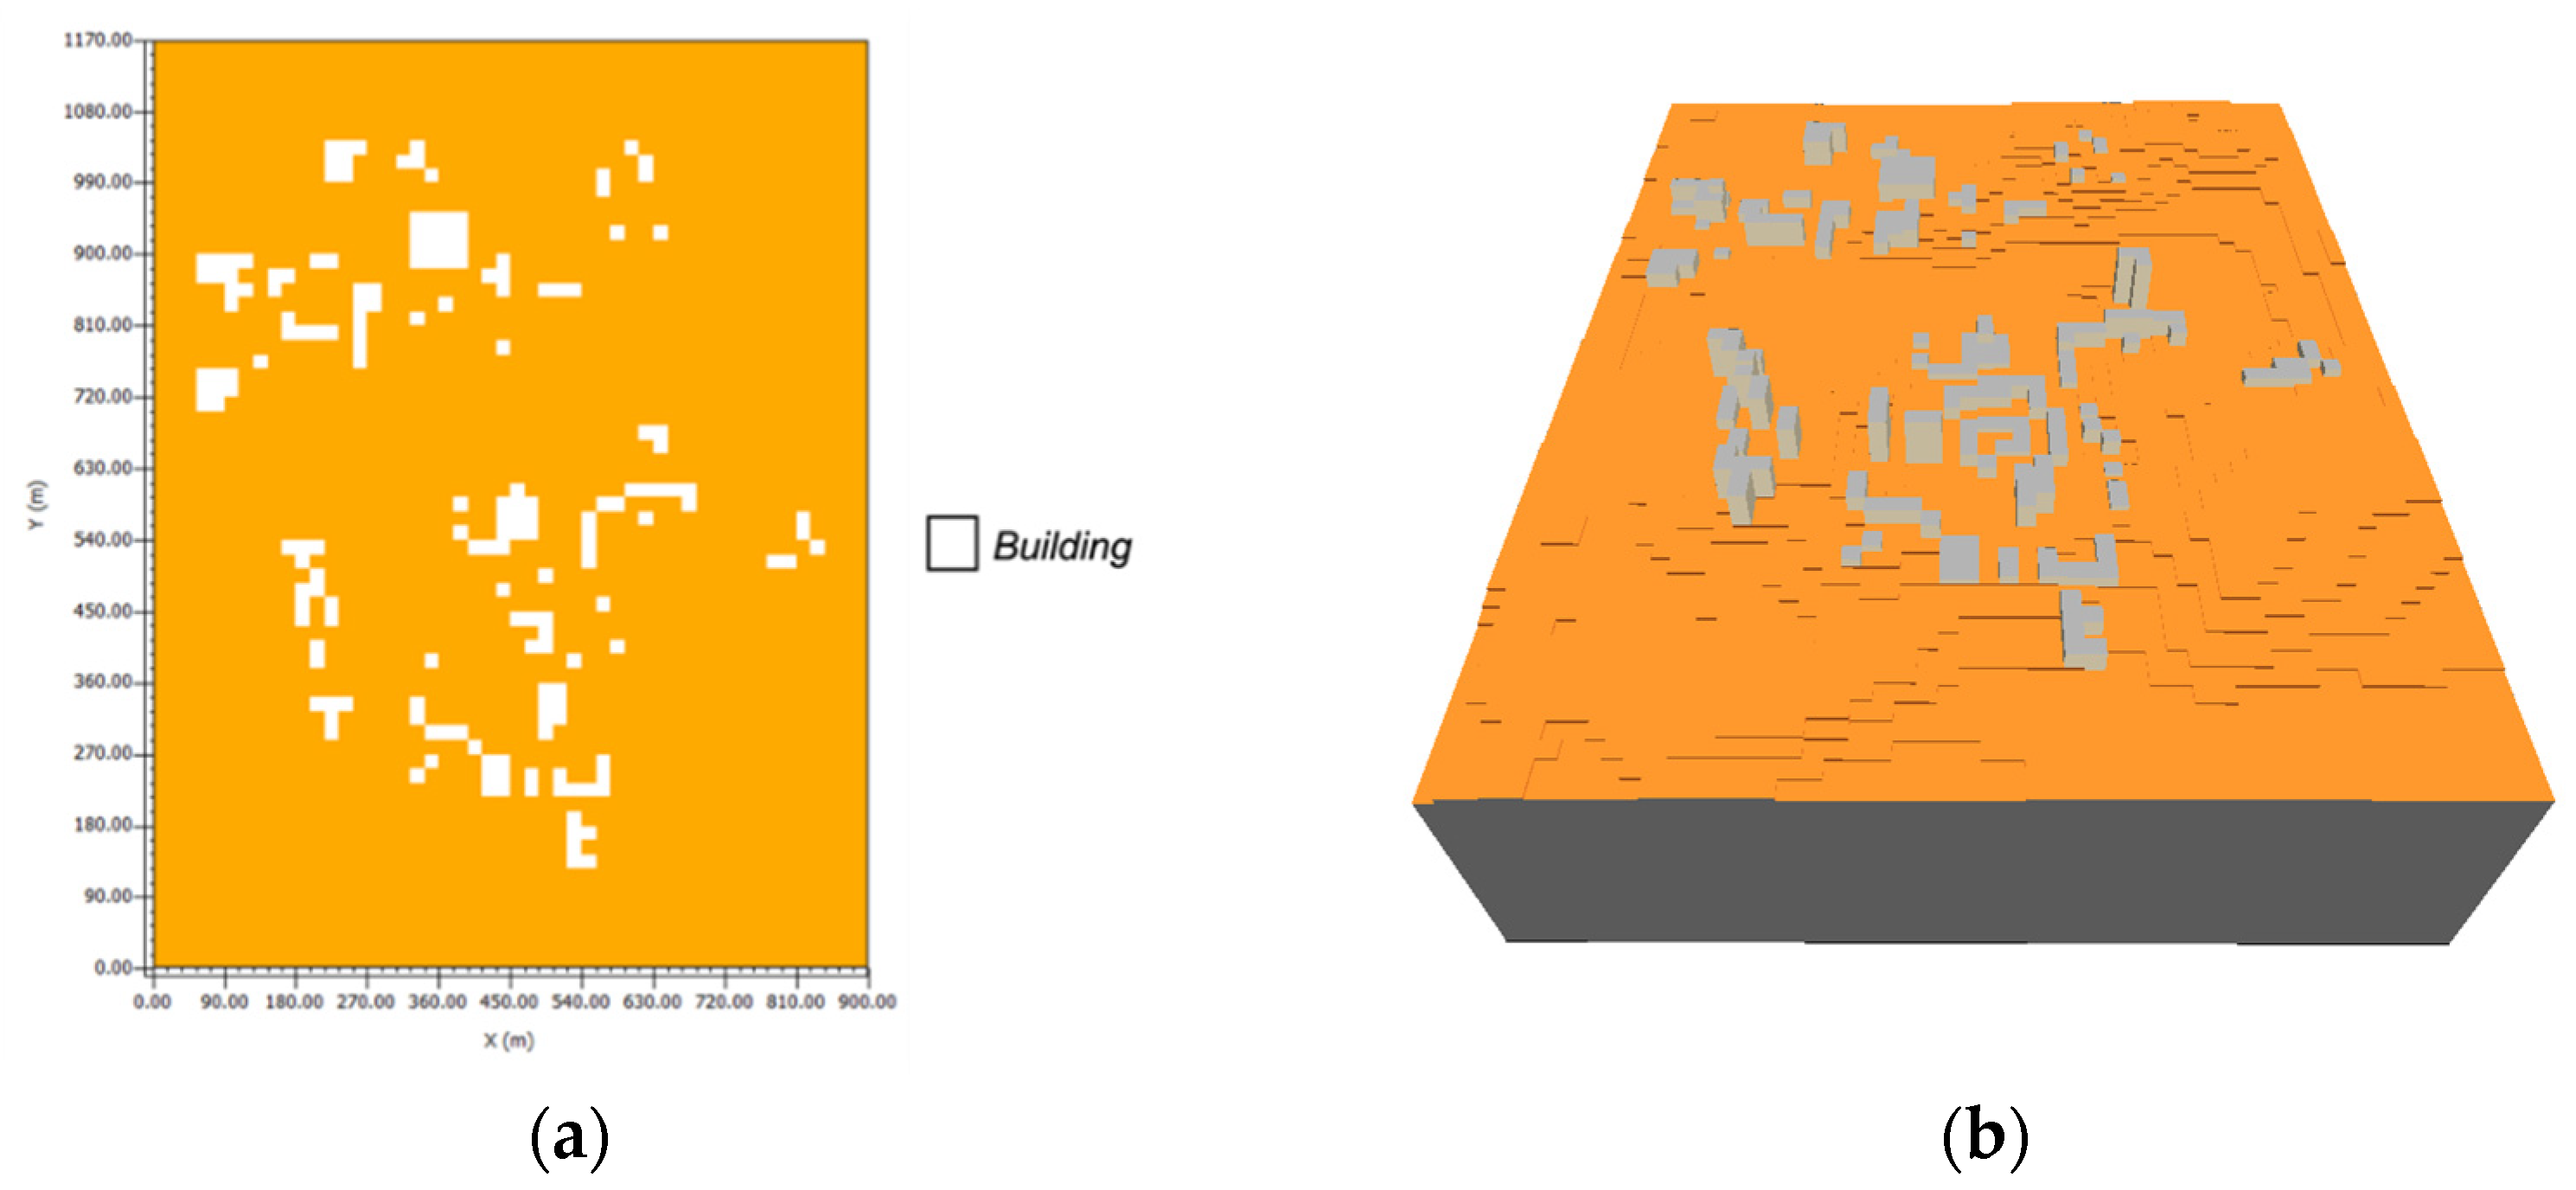
2.2.1. Site Characteristics
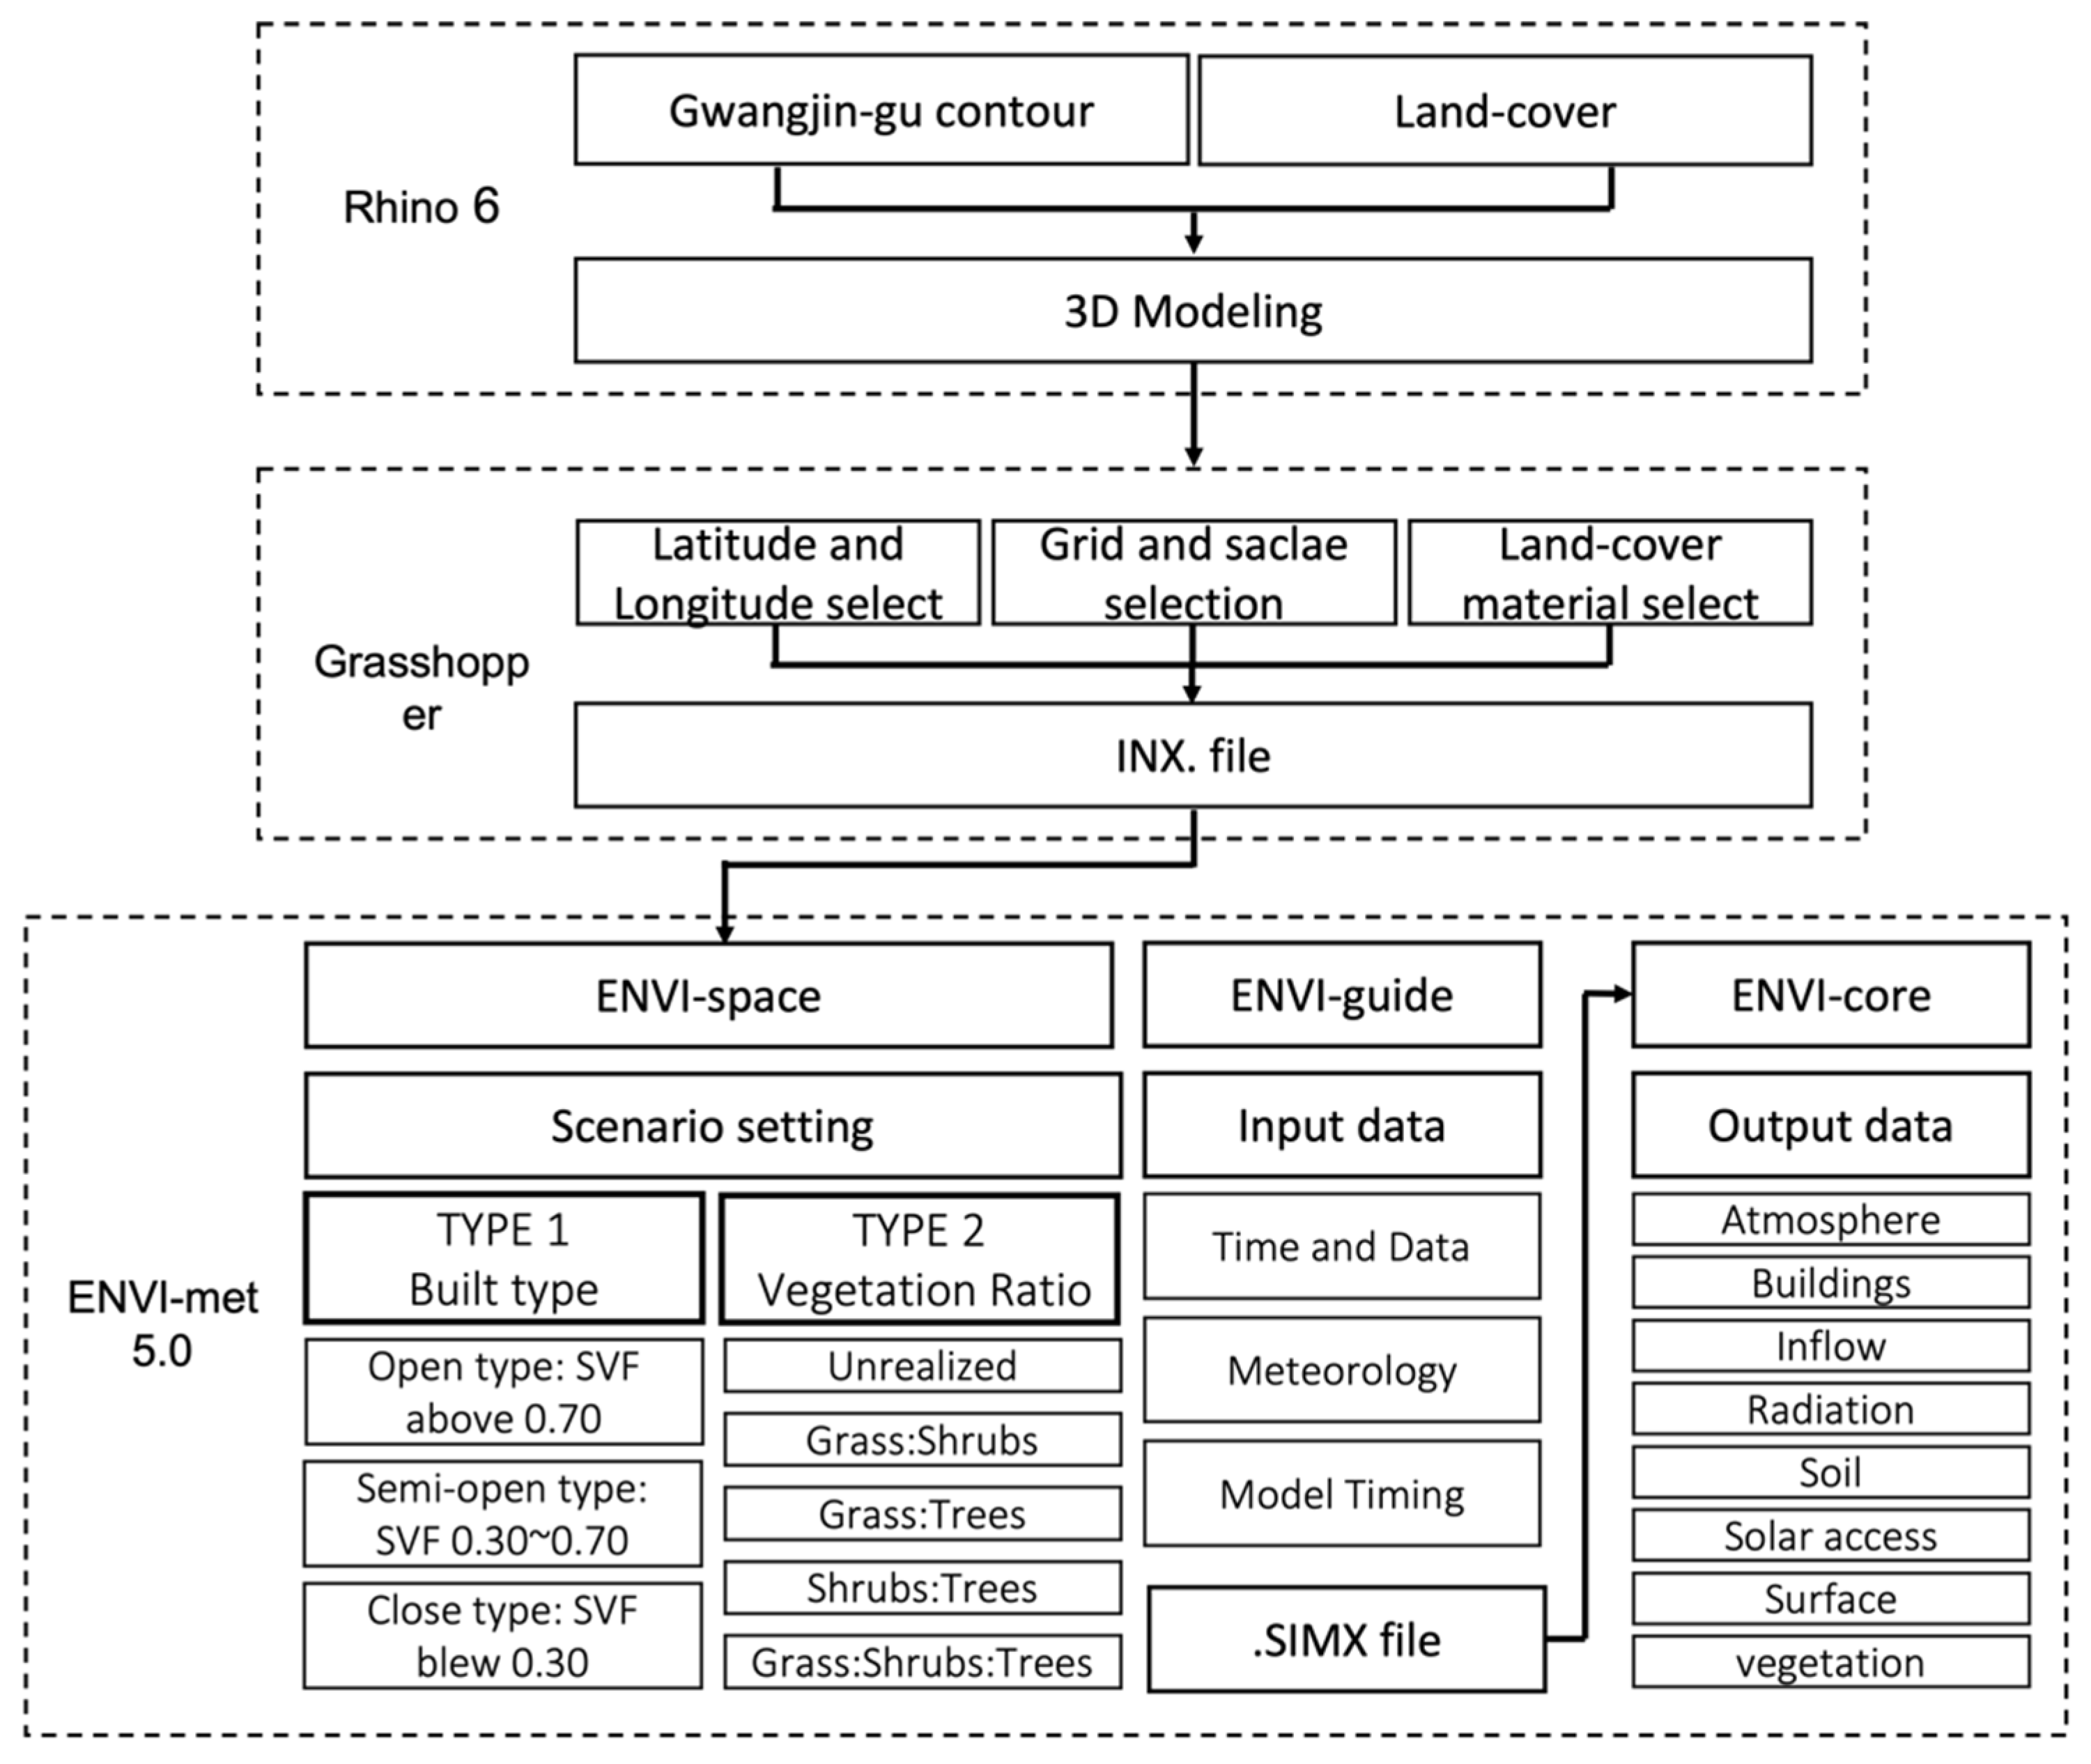
In this study, Konkuk University in Gwangjin-gu, Seoul, Republic of Korea was selected as the simulation area. It can be seen in Figure 1. This site is a university campus, which has good data accessibility due to the geographic information provided by the Seoul Metropolitan Government and Konkuk University. Additionally, air quality meters (smart-aircok outdoor type 1) measuring PM10, PM2.5, temperature, and humidity are installed across the campus, making it easy to obtain on-site information. The site is located in the central eastern part of Seoul, where high-rise buildings such as commercial facilities and residential and commercial complexes are concentrated, and it is surrounded by four-lane roads and has large residential and floating populations. Further, this area’s commercial and residential facilities are located in all directions around the campus, and in particular, the Children’s Park, a tourist attraction, is located to the north. In addition, lakes, forests, playgrounds, and roads are distributed on campus, so the types of land cover vary from waterfront, green area, and grasslands to asphalt pavement. The total area of the campus is 473,565 m2, the total number of buildings used in the analysis was 48, the tallest building was 61.4 m, the shortest building was 2.2 m, and the building material was reinforced concrete [50].

2.2.2. Simulation

The microclimate and thermal comfort of an urban space are evaluated by measurement and simulation. A considerable amount of time and money is invested in measuring the microclimate according to the complex spatial structure of the city [51]. However, use of the simulation model allows for the relatively easy implementation of the space and plan to be analyzed, enabling the situational analysis of the desired conditions [53].
Therefore, we implemented a quantitative approach using the simulation tool ENVI-met, which can evaluate the cooling effect based on evaporation, vegetation, atmosphere, radiation, soil, and turbulence. Figure 2 shows the workflow of this study.
For ENVI-met simulation, the building height and land-use status of Gwangjin-gu at the site of Konkuk University were modeled using Rhino 6. Grasshopper was used to determine the model domain settings. The model dimensions were set to 50 × 65 × 300, and the grid cell (in meters) was set to 18.0 × 18.0 × 3.00. Then, the surface materials were set. Buildings were made of concrete, lakes of water, roads of asphalt, parking lots of concrete, sidewalks of asphalt with red coating, and open spaces were defaulted. Details on the surface material settings are shown in Table 1.
The ENVI-met program “Spaces” was used to convert 2D models of the site into 3D models for thermal comfort analysis (Figure 3). Detailed scenarios were set up and green roofs were designated on a cell-by-cell basis. After that, detailed simulation meteorology was selected using ENVI-guide. Table 2 shows the parameter settings. The simulation date was set to 24 July 2021, when the average temperature was the highest among the temperatures from January to November 2021 [54], and a total of 24 hours were simulated from 00:00 to 24:00. Air temperature was set at 17–28 °C, relative humidity at 45–75%, wind speed at 2.00 m/s, wind direction at 87.2°, and roughness length at 0.010. The generated SIMX file was simulated in ENVI-core to derive the final output data.

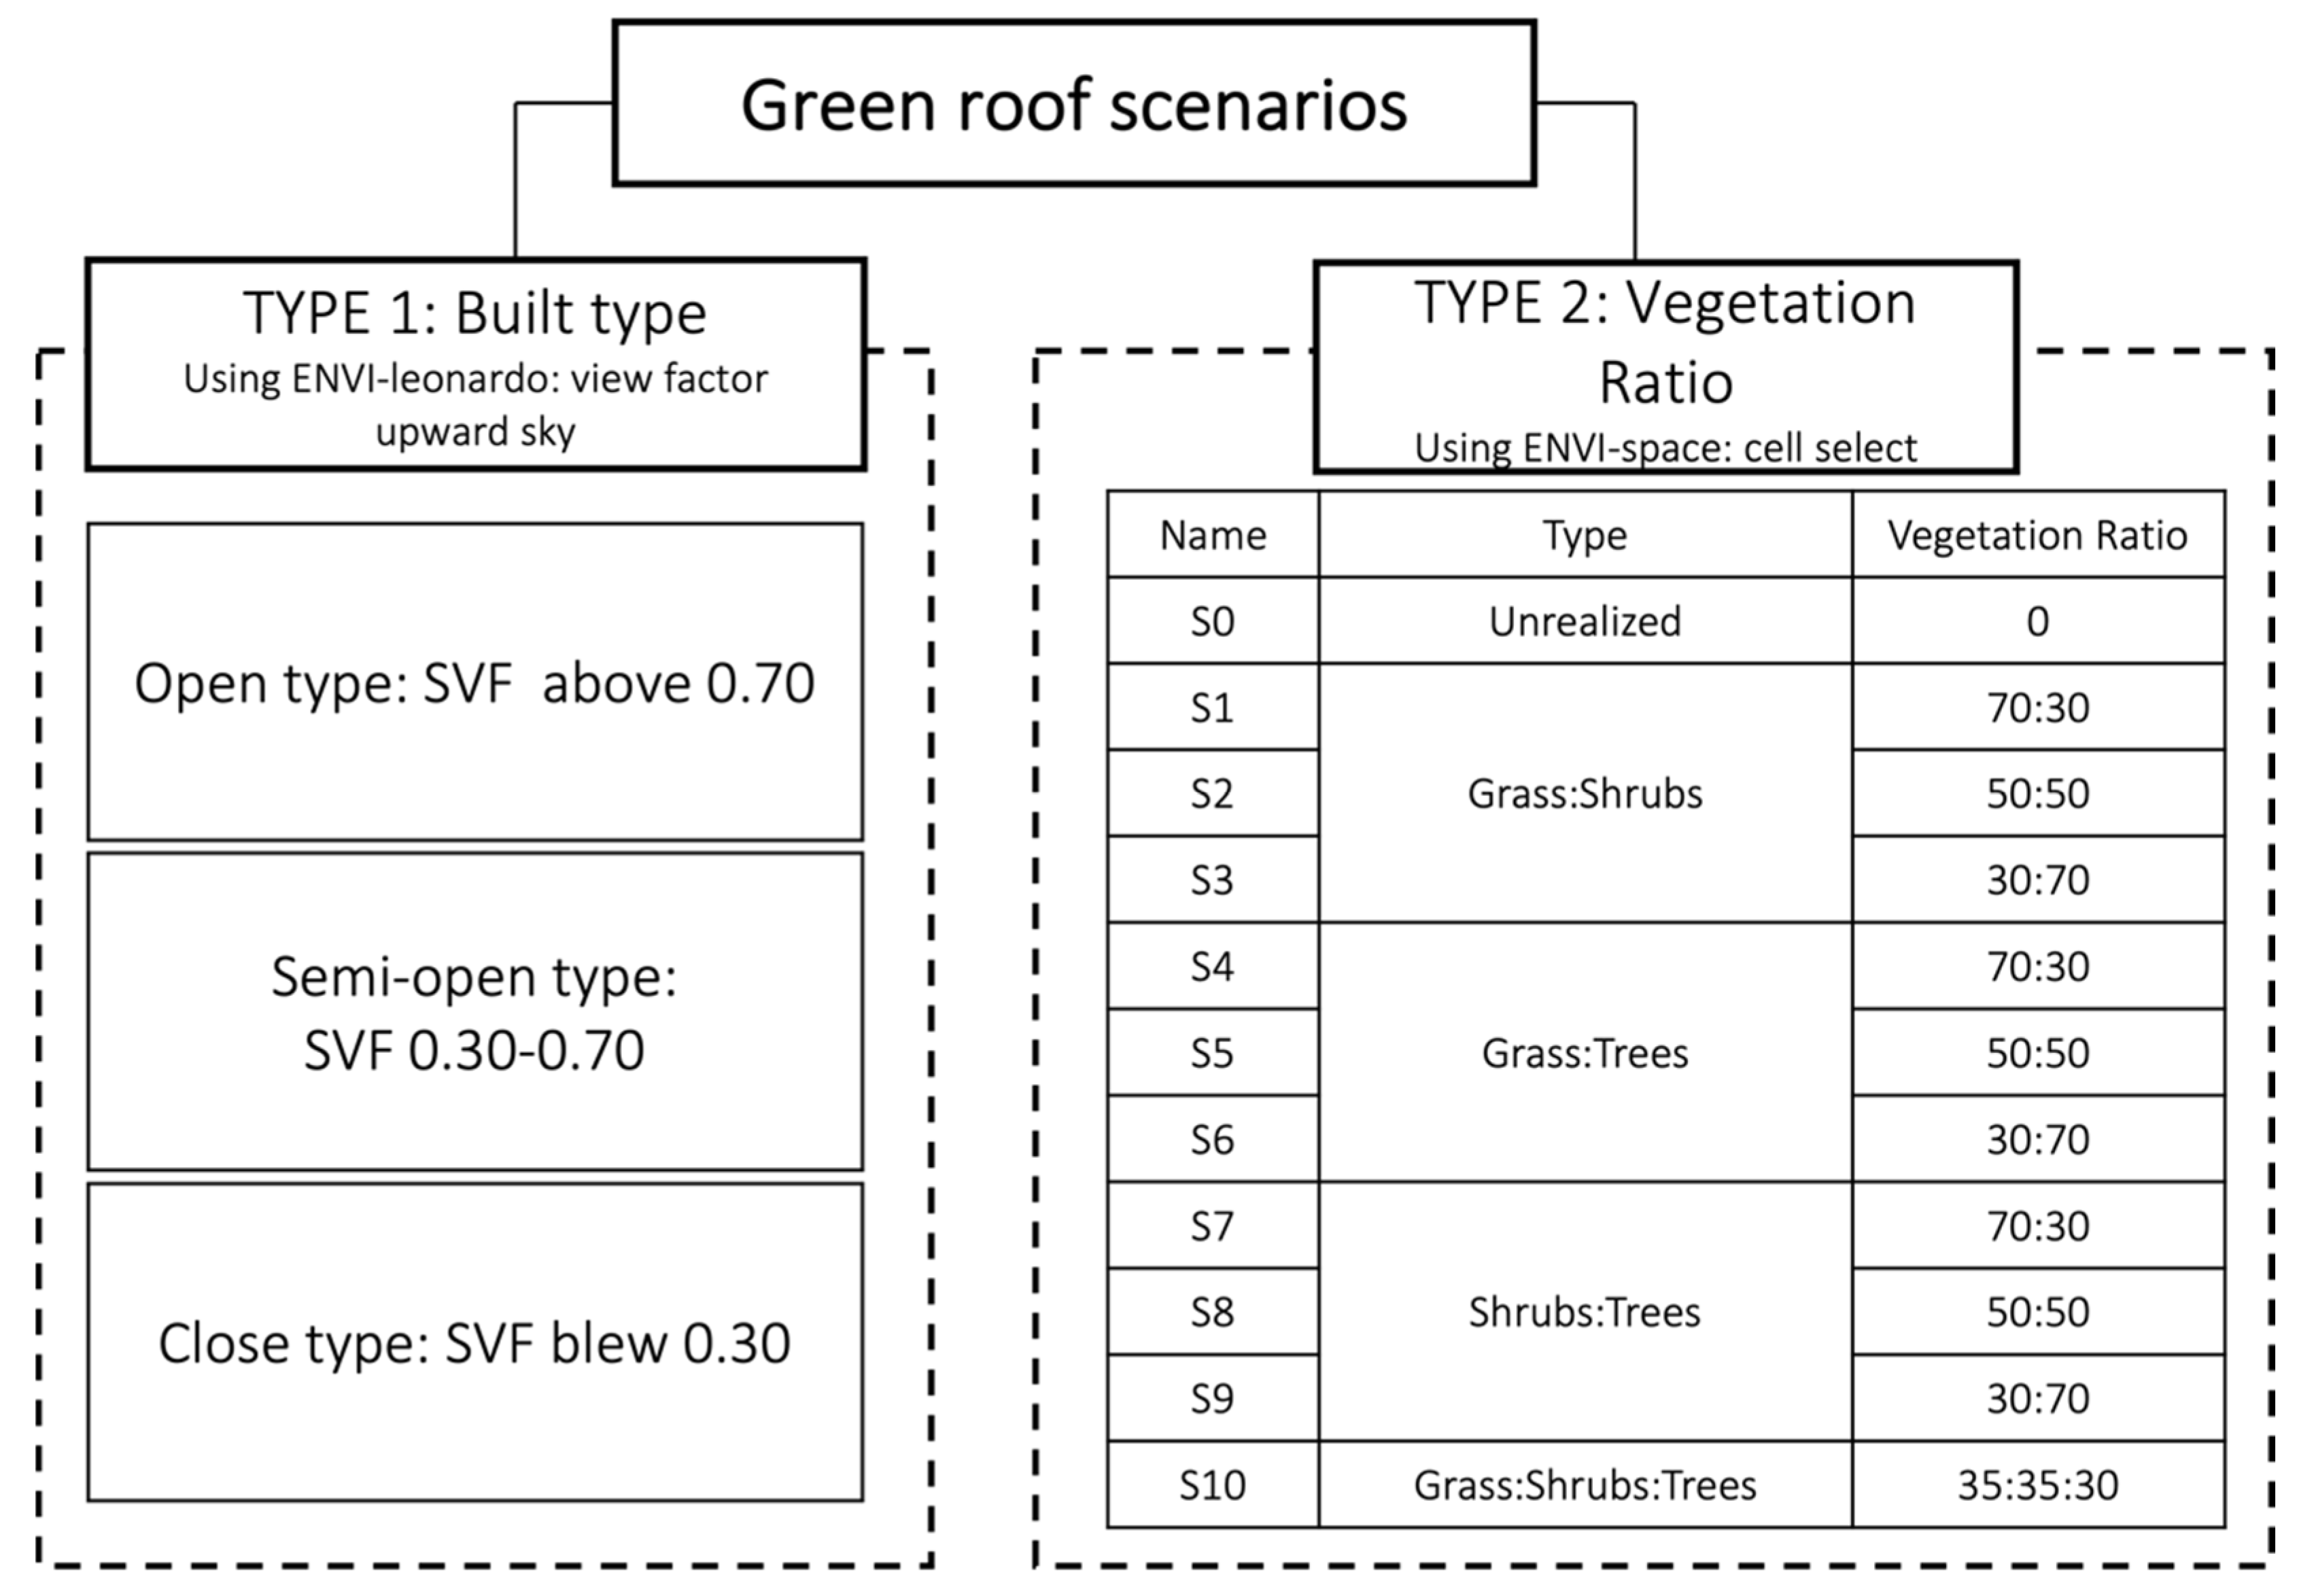
2.2.3. Setting Green Roof Scenarios

The UHI effect is mainly the result of urban geometry and land-cover type. Accordingly, to reduce the UHI effect, measures such as changing land-cover materials or forming wind corridors using geometric forms are emerging [11,12,24,26]. However, these measures are limited in terms of cost and time because changes in the geometry of land-cover materials and buildings require changes in the density, height, and other factors of the existing materials and buildings [52]. Therefore, in this study, green roofs were selected as the thermal environment improvement strategy.
Existing studies simply compare the thermal environmental effects before and after the installation of green roofs. In contrast, this study attempts to derive green roof scenarios that are effective for various urban types. Therefore, after classifying the build type according to the SVF ratio, the scenarios were constructed based on various ratios of grass, shrubs, and trees. The detailed simulation concept is shown in Figure 4. Extreme settings that included one tree with a green coverage rate of 100% were excluded because they were unrealistic, and the final scenarios consisted of 30%, 70%, and 0% green coverage rates. These settings were created in ENVI-space. Table 3 shows the detailed settings of the greenery created in these scenarios. The detailed setting including plant heights for the simulation was set to be an intensive green roof system based on the Ministry of Land, Infrastructure and Transport [55].

3. Results and Discussion
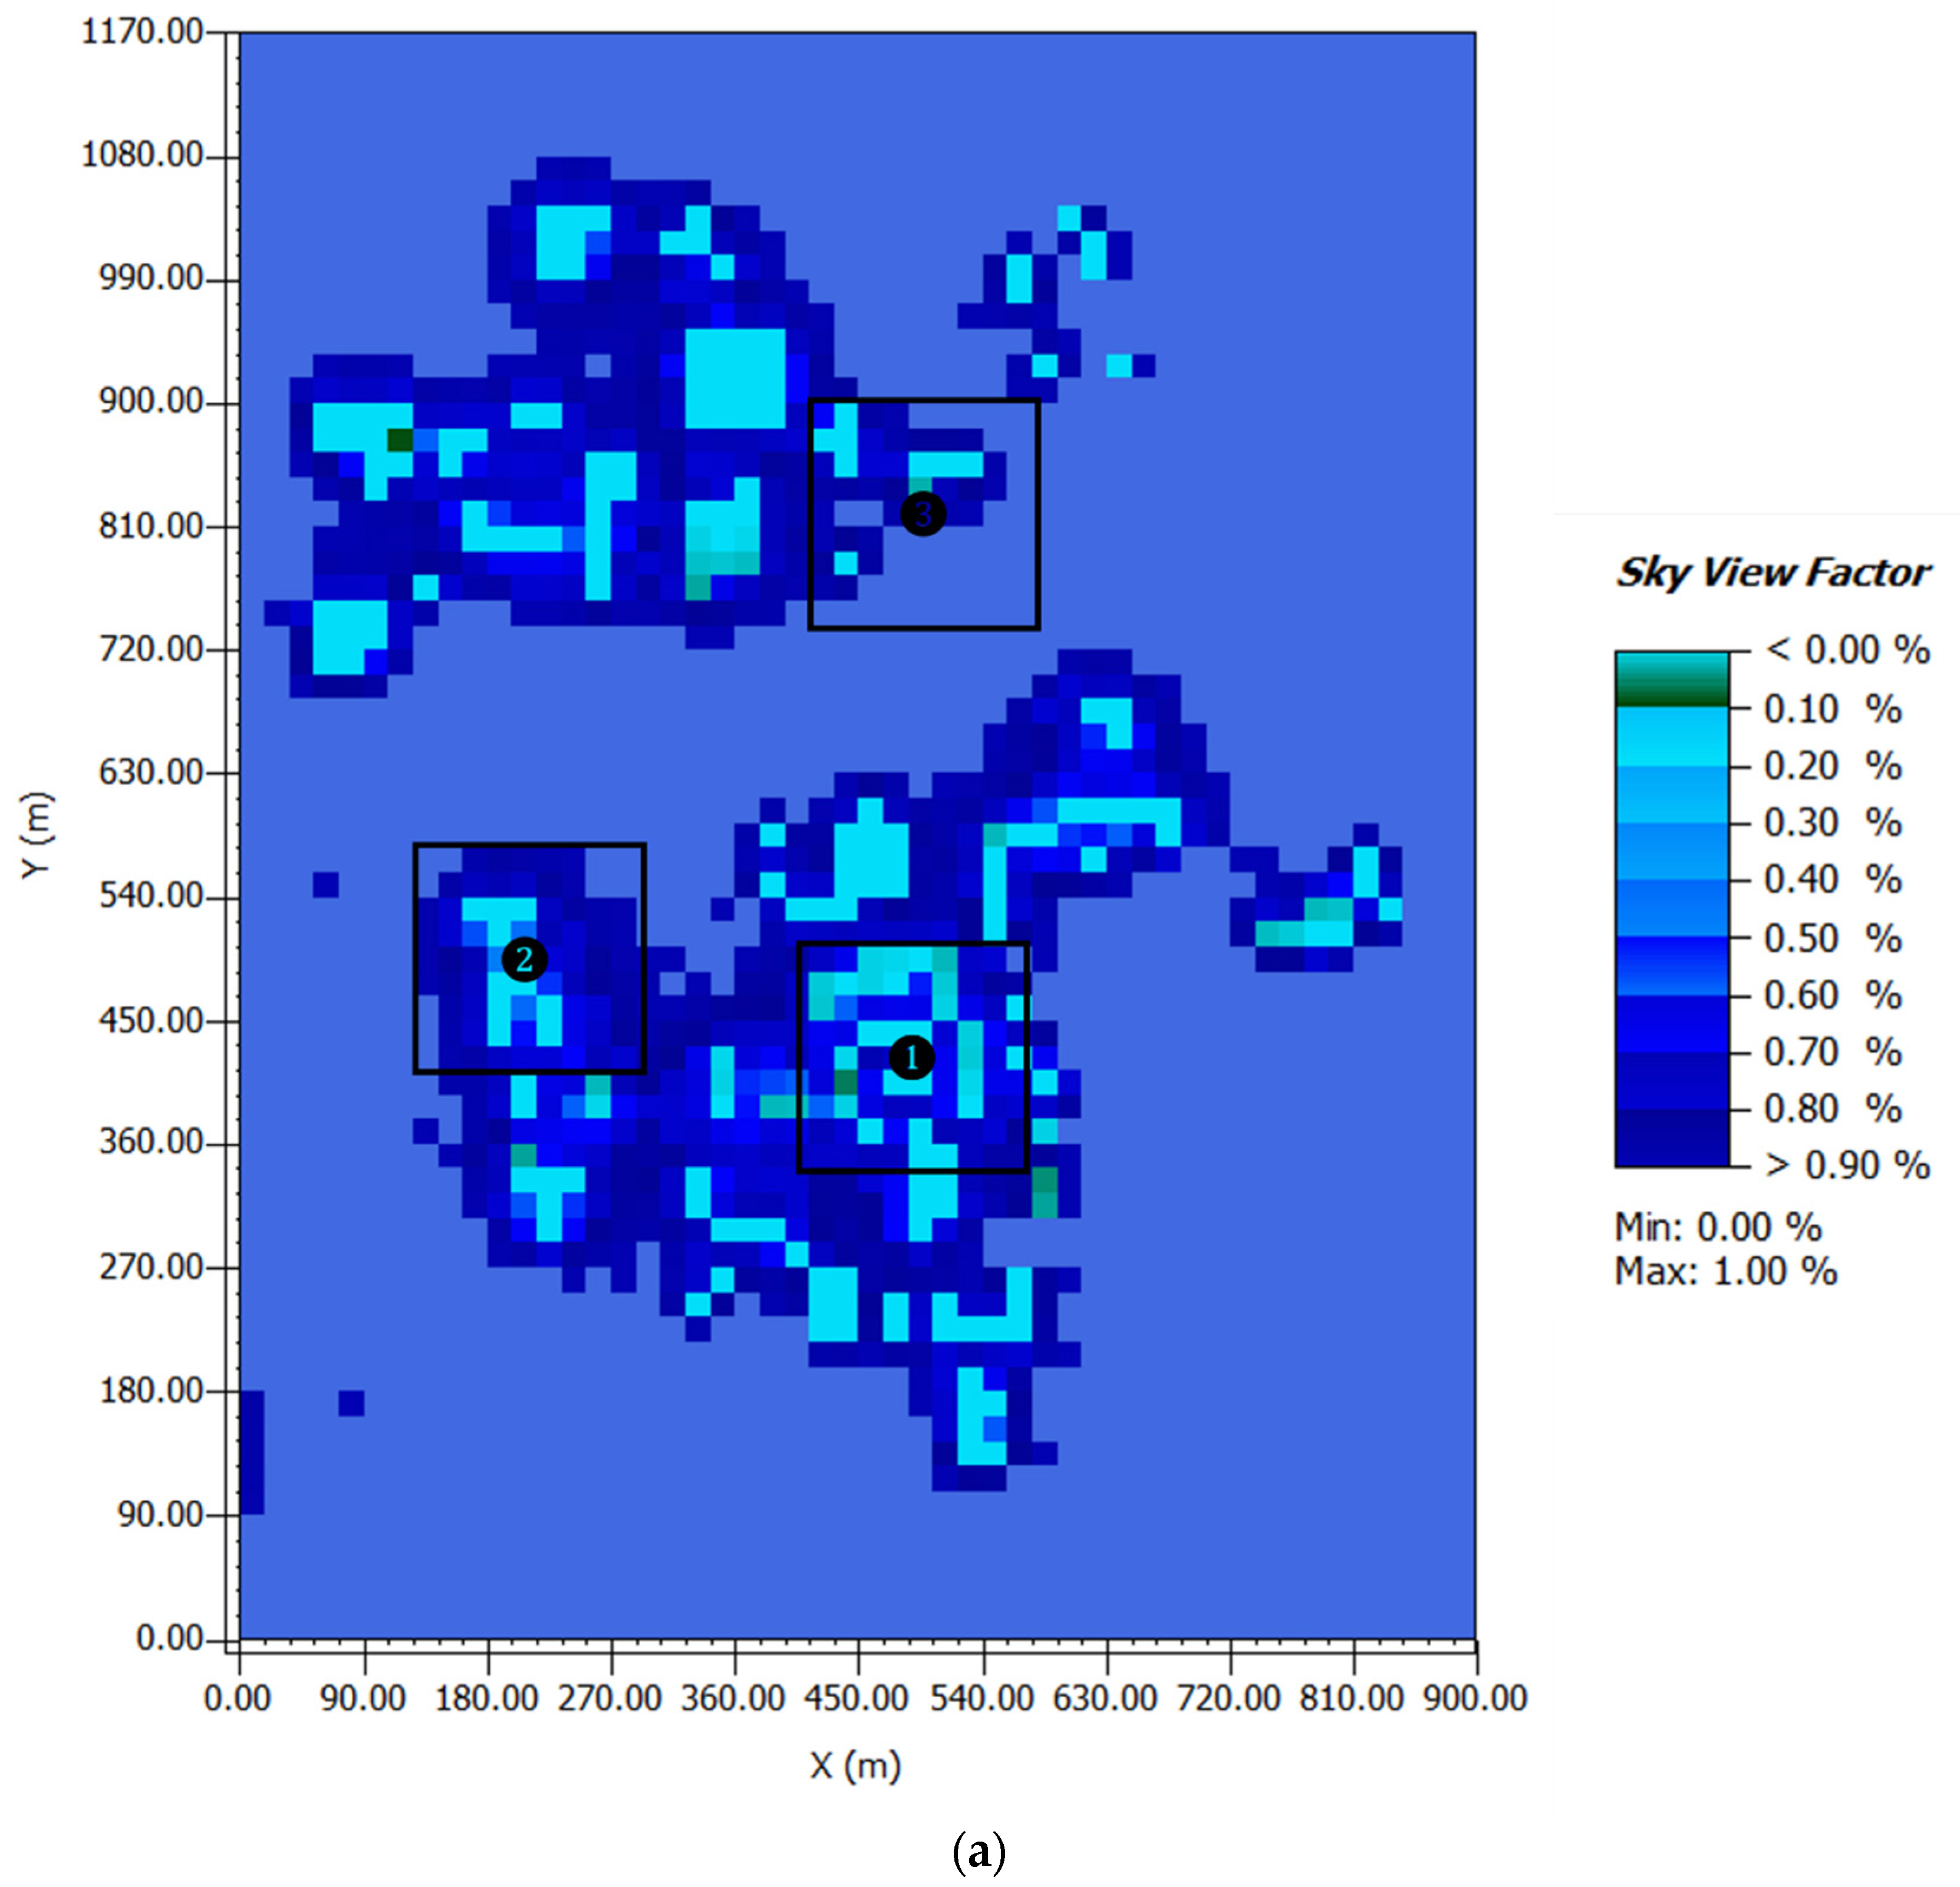
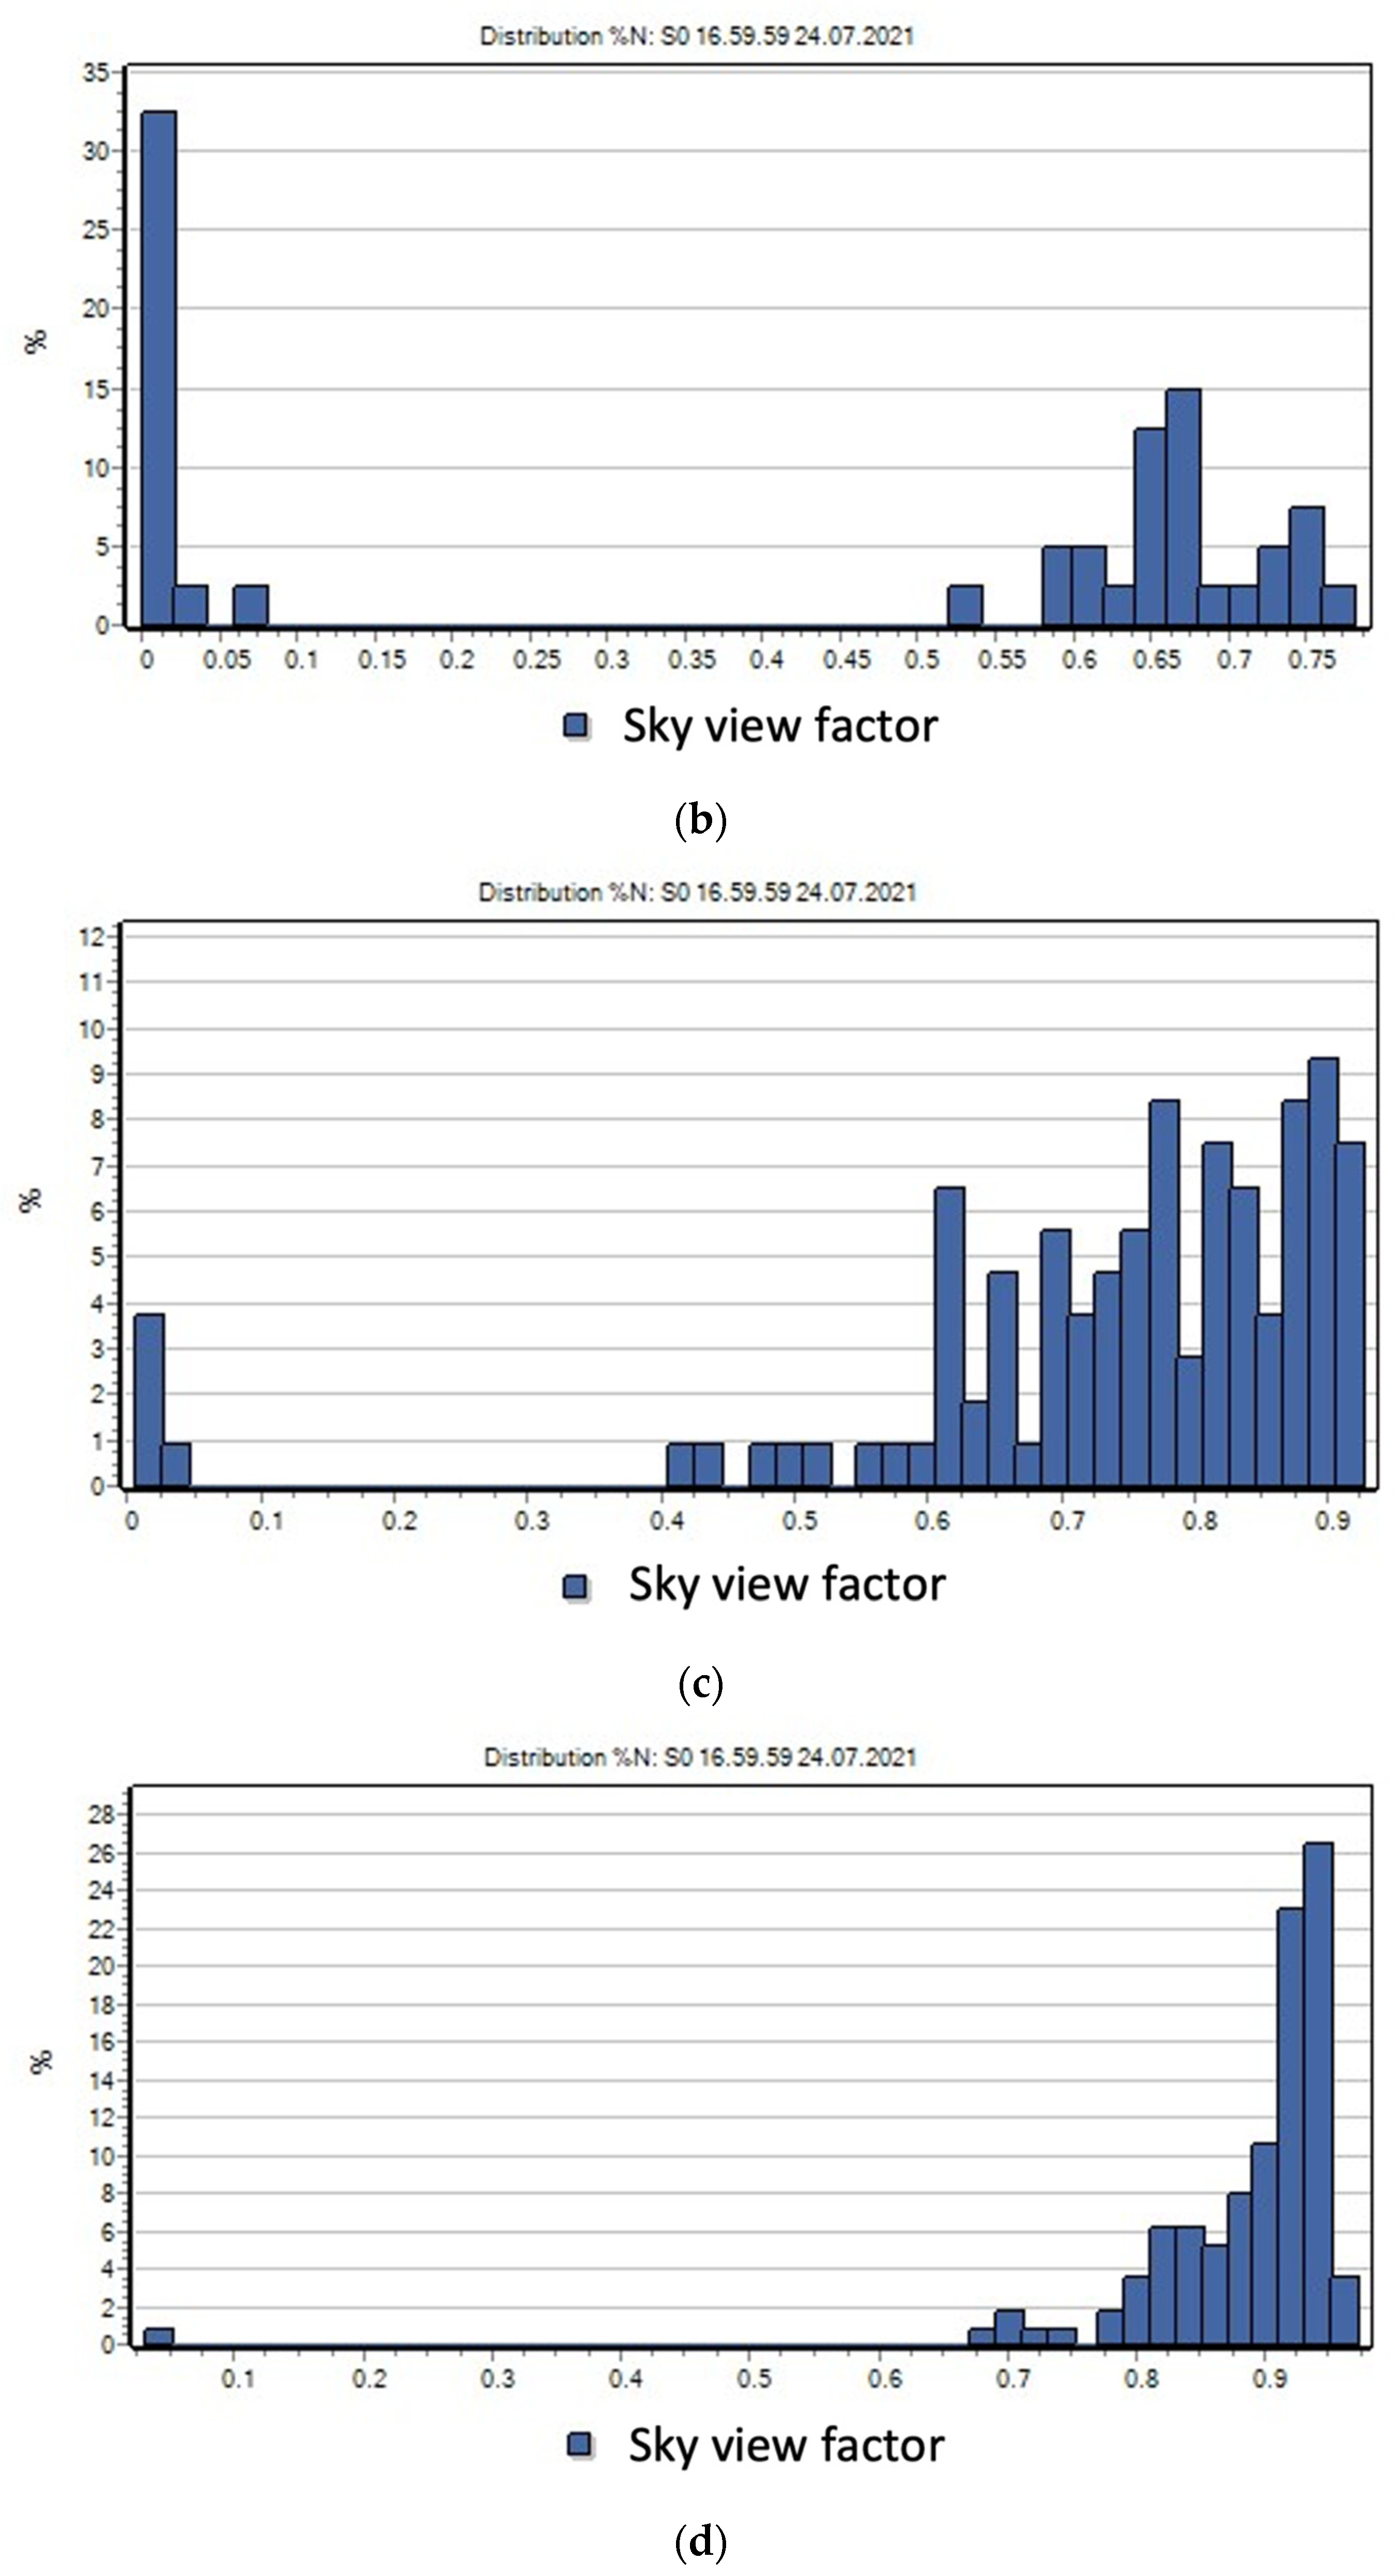
3.1. Classification

This study categorized urban spaces to derive effective green roofs according to the types of buildings. SVF is effective for analyzing UHI phenomena and atmospheric temperature by reflecting the shape and the arrangement of buildings, as well as for determining building characteristics and road widths. SVF has a value of 0.0 to 1.0, and in general, the lower the value, the more radiant heat is absorbed and the speed of heat circulation and wind is hindered, contributing to the increase in atmospheric temperature [26]. In this study, the types of city spaces were classified into closed, semi-open, and open according to the SVF in the ENVI-met surface data. Figure 4 shows the SVF through ENVI-met and the SVF ratio for each classification. For the SVF ratio distribution of the closed urban area, the average was 0.6%; the ratios from 0.0 to 0.4 represent the ratios judged to be closed, and, as they made up about 40% of the area, it was determined as closed type (Figure 5b). In addition, the SVF ratio distribution of the semi-open urban area had an average of 0.7%, and the area was determined as semi-open type (Figure 5c). The ratio distribution of the open urban area had an average value of 0.9%, so it was determined as open type (Figure 5). Table 2 shows the coordinates, average SVF (%), average building height (m), and land-cover characteristics of each urban type.

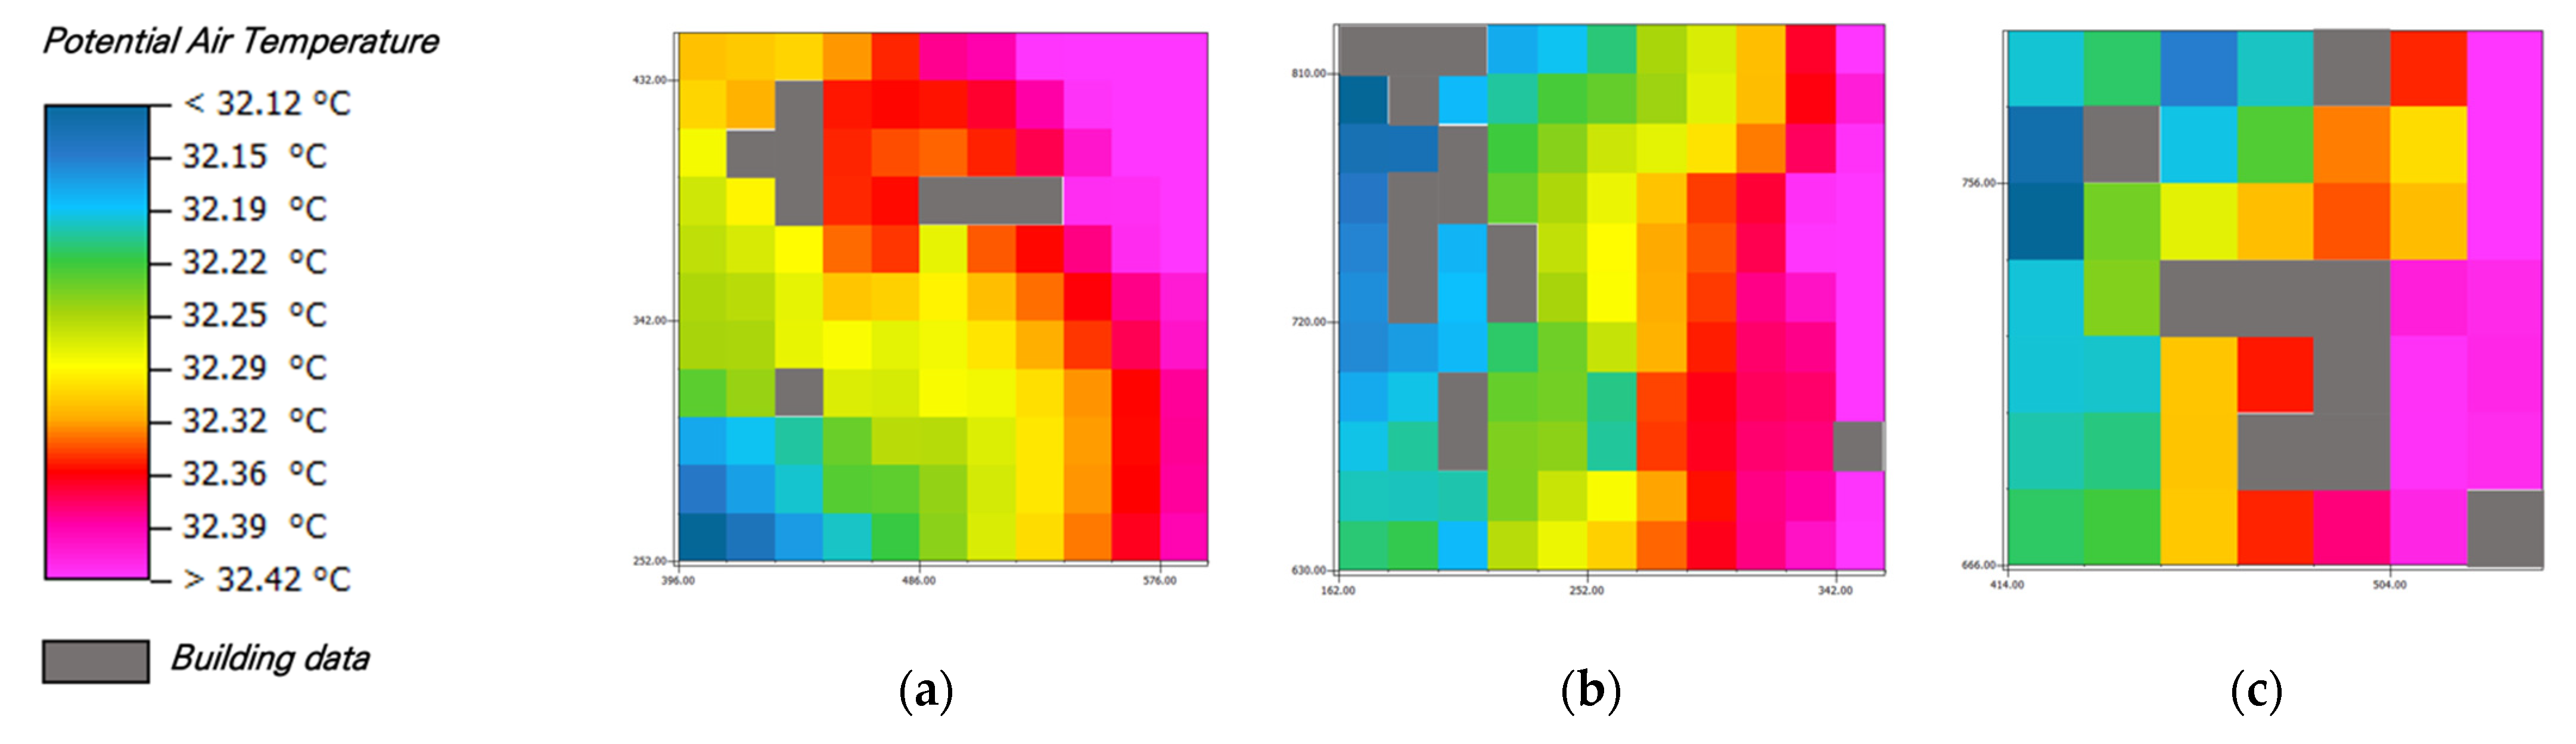
3.2. Thermal Environment Status

This study conducted simulations on air temperature, wind, and predicted mean vote (PMV) to analyze the thermal environments of the urban types. At this time, PMV is the sense of heat felt by humans in seven stages and is the most commonly used thermal comfort evaluation index thus far [56]. Table 4 is a reconstruction of the table of Matzarakis et al. [56], showing the state of thermal comfort and physiological stress according to the PMV index.
The simulations were conducted for 16:00, when the air temperature was the highest; the other settings are shown in Table 2. In addition, the ratio of grass, shrubs, and trees was set to analyze the thermal environment and the green roof patten most effective for improving the thermal environment according to the urban type; the detailed settings are shown in Figure 4 and Table 3.

3.2.1. Unrealized-Green-Roof-Area (S0) Thermal Environment

In order to create a control group to determine the effect of green roofs by scenario, the thermal environment of the concrete roof without green roofs (S0) was analyzed. Figure 6 shows an analysis of the air temperature of S0. In the case of the closed urban area, the median temperature was 32.320 °C, the highest temperature was 32.460 °C, and the lowest temperature was 32.120 °C. In the case of semi-open areas, the median temperature was 32.085 °C, the highest temperature was 32.204 °C, and the lowest temperature was 31.970 °C. The average temperature of the open area was 32.324 °C, the maximum temperature was 32.405 °C, and the minimum temperature was 32.212 °C. Therefore, the air temperature was increased in closed spaces, and it improved with moderate space openness. Figure 7 shows how the wind speed changed according to the building density. For closed urban areas, the average wind speed was 5.823 m/s, the maximum speed was 8.141 m/s, and the minimum speed was 0.160 m/s. In semi-open areas, the average wind speed was 2.066 m/s, the maximum speed was 6.531 m/s, and the minimum speed was 0.028 m/s. In open areas, the average speed was 1.921 m/s, the maximum speed was 3.520 m/s, and the minimum speed was 0.001 m/s. In the case of closed areas with a high density of a buildings, the wind speed increased due to the formation of narrow spaces between the buildings. Figure 8 shows the results for PMV, which describes the thermal comfort. PMV for the closed urban areas averaged 1.824, with a maximum of 1.890 and a minimum of 1.343. In semi-open areas, the index averaged 1.650, with a maximum of 1.801 and a minimum of 0.991. In open areas, it averaged 1.606, with a maximum of 1.762 and a minimum of 1.032. These results indicate that all three urban types were under weak stress from high temperatures. In particular, the closed urban areas were under high-temperature thermal stress. In other words, the results for S0 showed that the thermal environment of the closed area was the worst, likely due to the relatively high wind speed due to the density of tall buildings, and the high air temperature due to artificial heat caused by buildings and land cover.

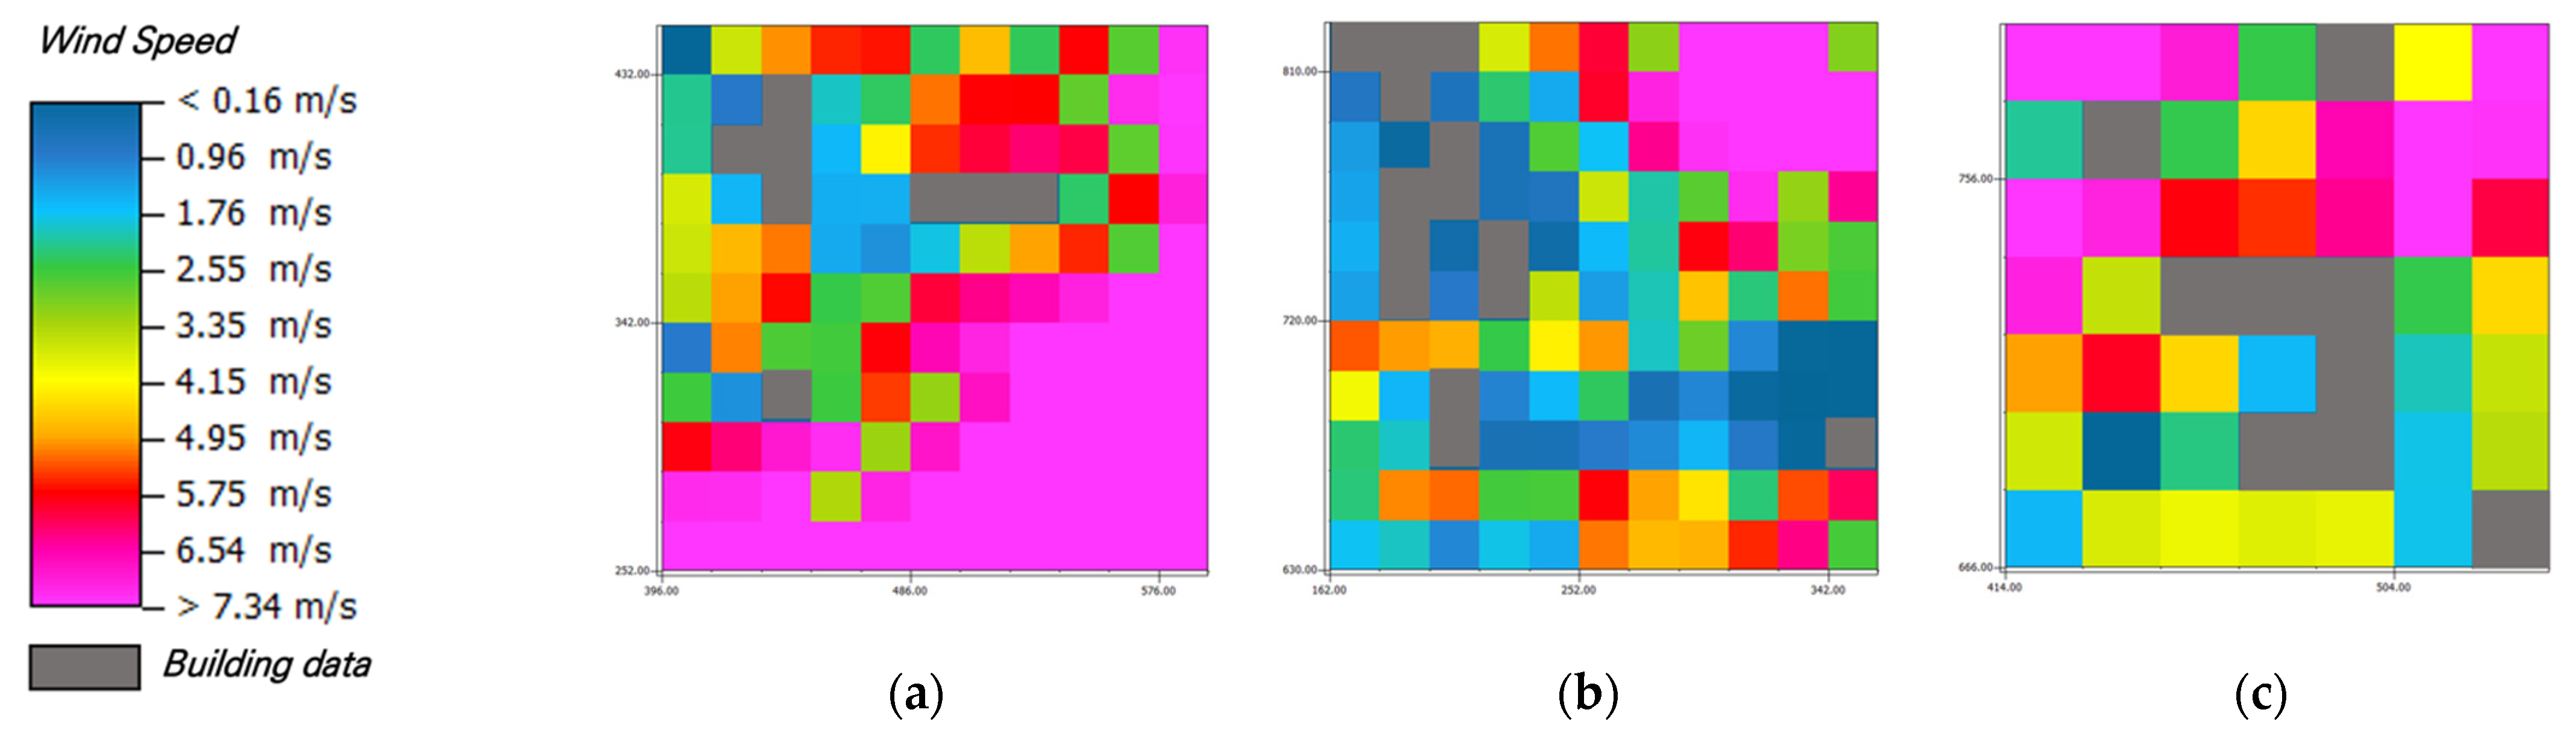
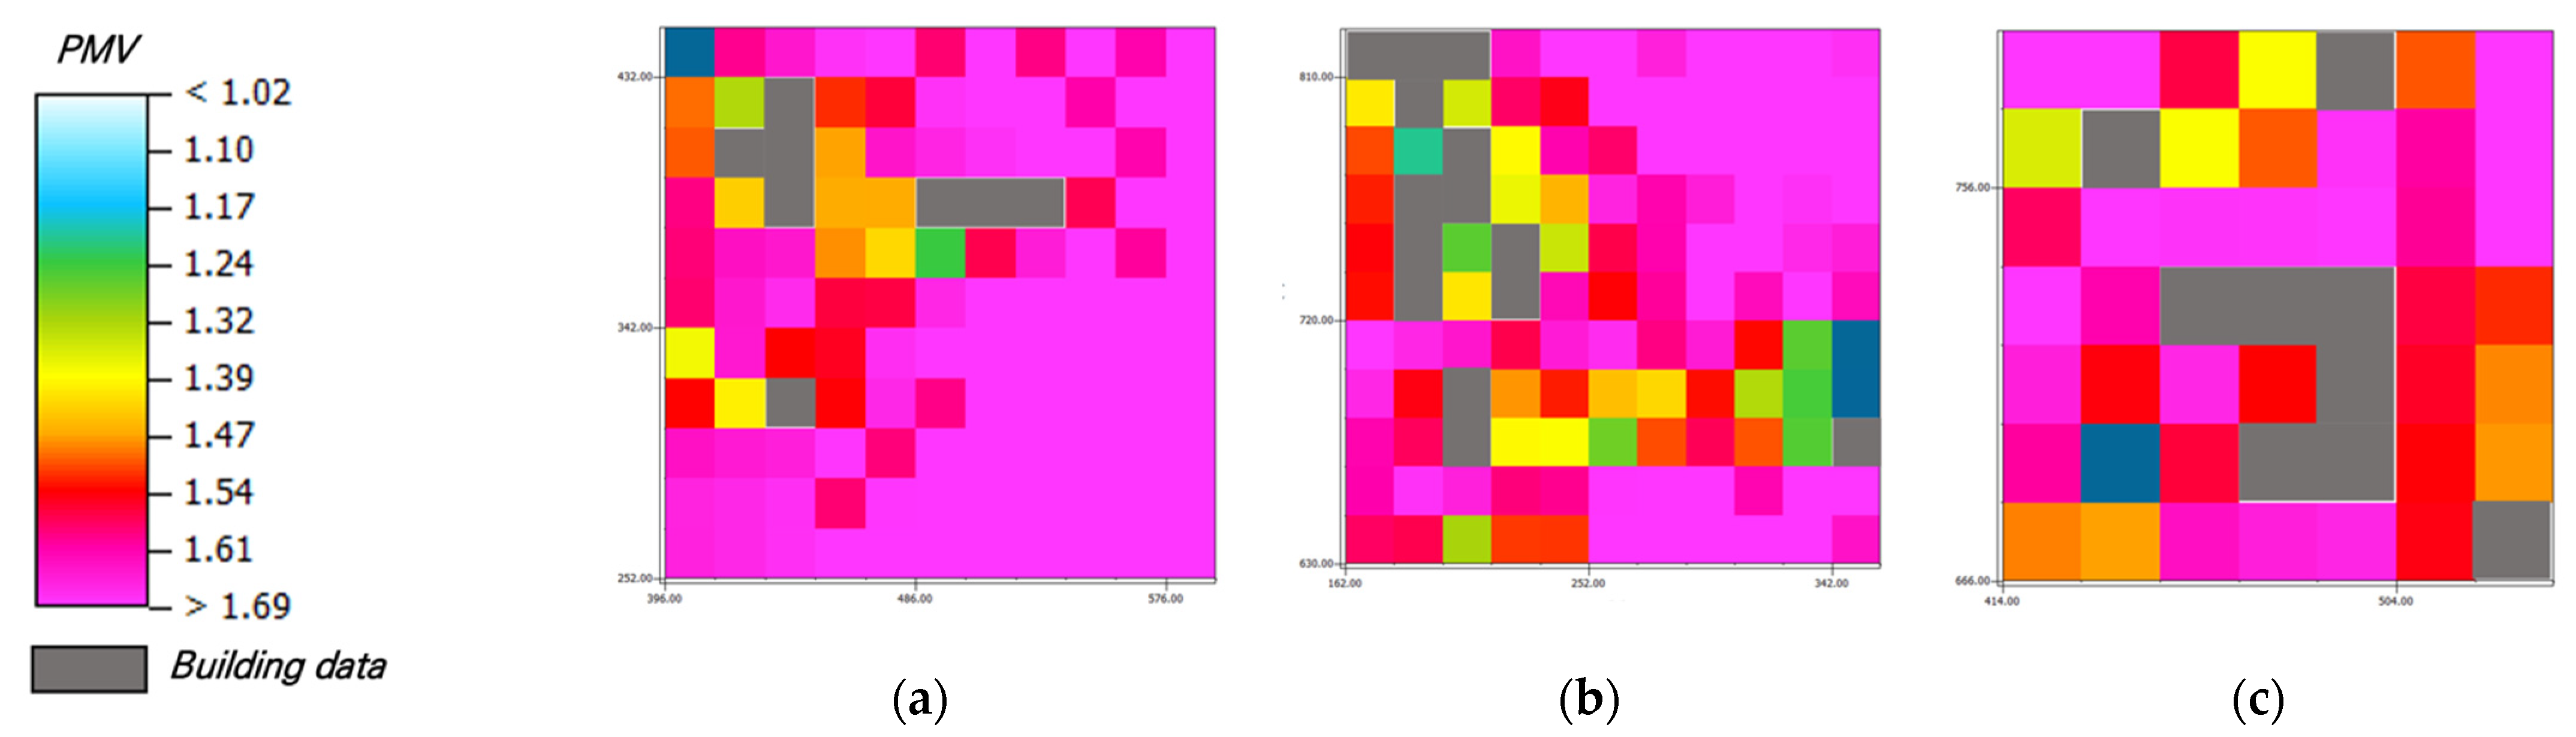
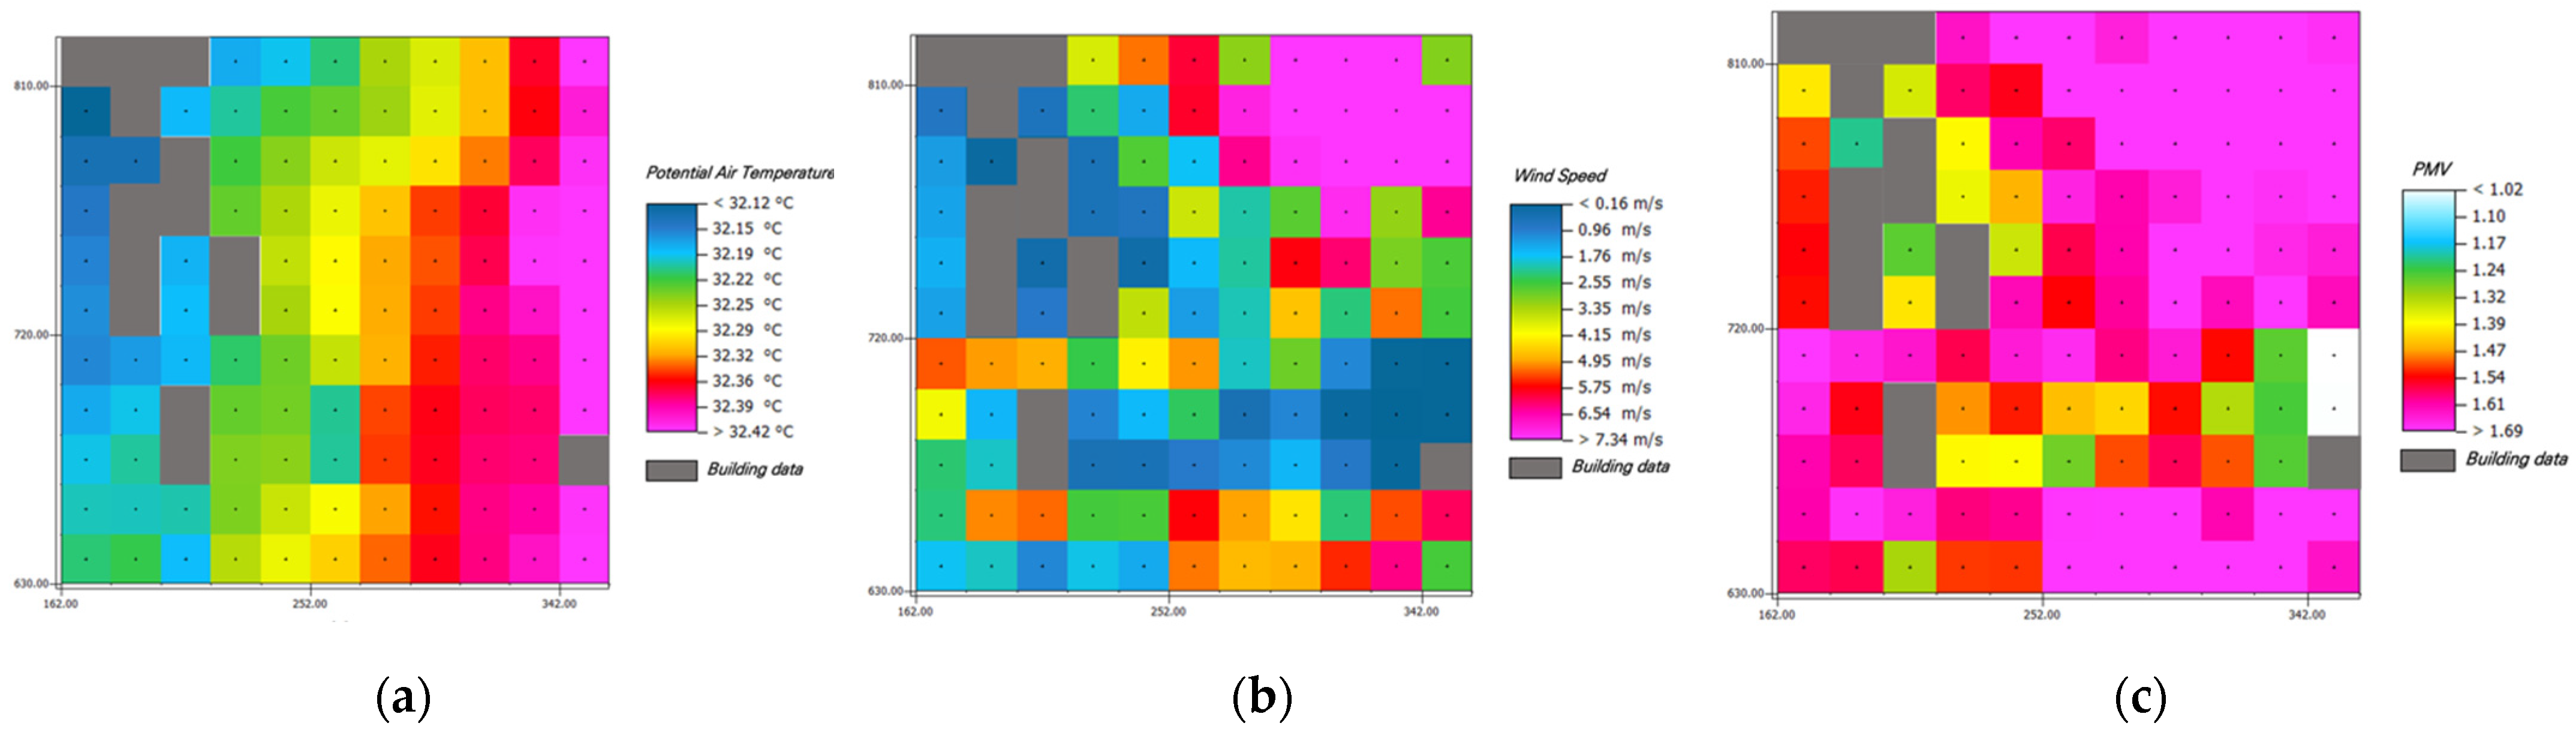
3.2.2. Closed-Area Thermal Environment

Despite being in the same space, the thermal environment changed according to urban design factors such as the building density and the land cover. Therefore, this study attempted to find an effective green roof element for each thermal environment, with the results derived using ENVI-met simulation for each scenario. Changes in air temperature, wind speed, and PMV for each closed-area scenario are shown in Table 5, Table 6, Table 7, respectively. Among them, the scenarios in which the thermal environment changes were considerable compared to S0 were S4, S6, and S7. S4 is a scenario with 70% grass and 30% trees, and S6 is a scenario with 30% grass and 70% trees in which the temperature was reduced on average by 1.001 °C compared to areas where green space was not created. The maximum wind speed of S4 and S6 was 8.143 m/s, an increase of 0.01 m/s compared to the existing scenario (S0). While the thermal aptitude of S6 remained unchanged, the thermal comfort of S4 increased by 0.008 compared to the existing scenario. In other words, in the case of the closed area, S4 was more effective than S6. The simulation results of S4 are shown in Figure 9. In the case of S7, in which there was a shrubs ratio of 70% and trees of 30%, the average temperature increased by 0.093 °C compared to the existing scenario (S0), the wind speed decreased by 0.027 m/s, and the PMV increased by 0.375, to indicate moderate high-temperature stress.

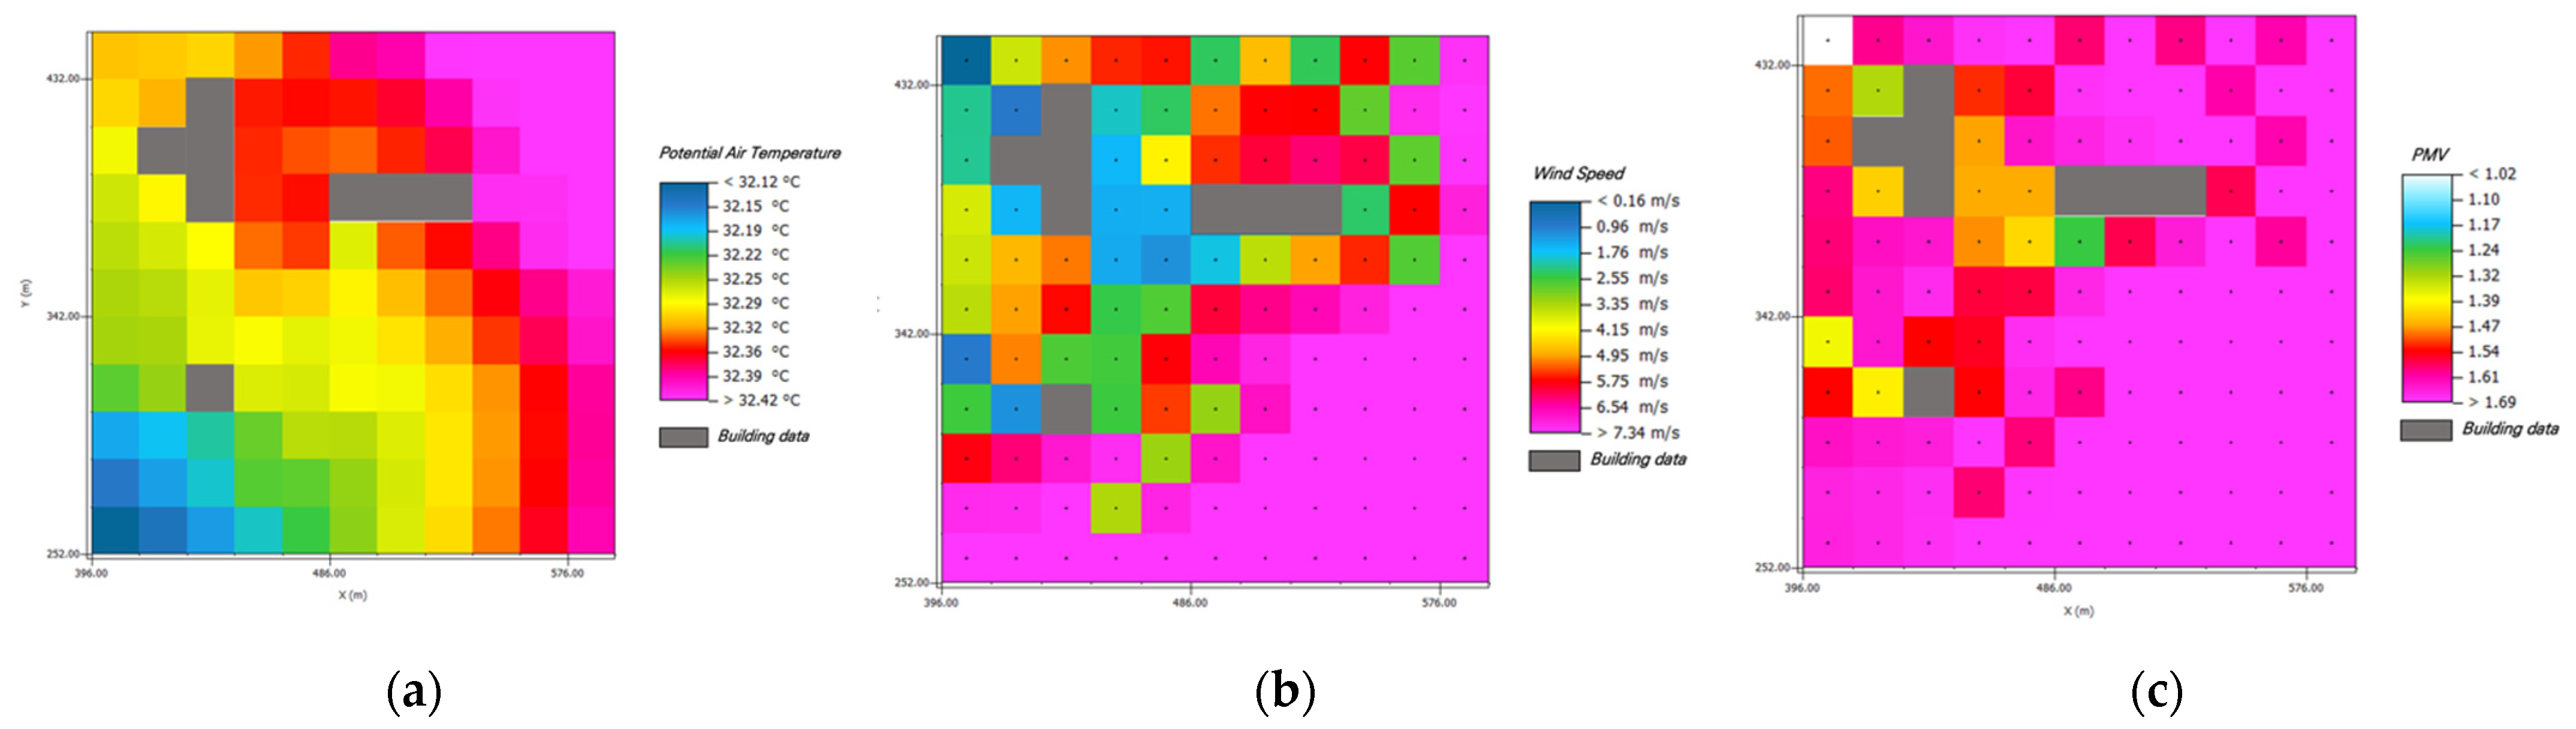
3.2.3. Semi-Open-Area Thermal Environment

The results for each scenario in the semi-open area are shown in Table 8, Table 9 and Table 10. The scenarios showing significant changes in the thermal environment were 50% for shrubs and grass, respectively (Figure 10). The scenario with a reduced thermal environment was S8, in which the average temperature, maximum temperature, and minimum temperature were all reduced by 0.002 °C compared to the existing scenario (S0). In the case of wind speed in S8, the average wind speed was increased by 0.001 m/s, but the minimum and maximum speeds were the same as in the existing scenario (S0). In the case of thermal comfort, the average was the same, but the maximum thermal comfort index decreased by 0.001 and the minimum thermal comfort index decreased by 0.002. In the case of S7, the thermal environment was deteriorated compared to the existing scenario (S0). The average temperature increased by 0.001 °C, the maximum temperature increased by 0.883 °C, and the minimum temperature increased by 0.002 °C. The average wind speed decreased by 0.006 m/s, with the maximum value decreasing by 0.013 m/s and the minimum by 0.009 m/s. As a result, thermal comfort also increased, with an average value of 0.379, a maximum value of 0.737, and a minimum value of 0.325.

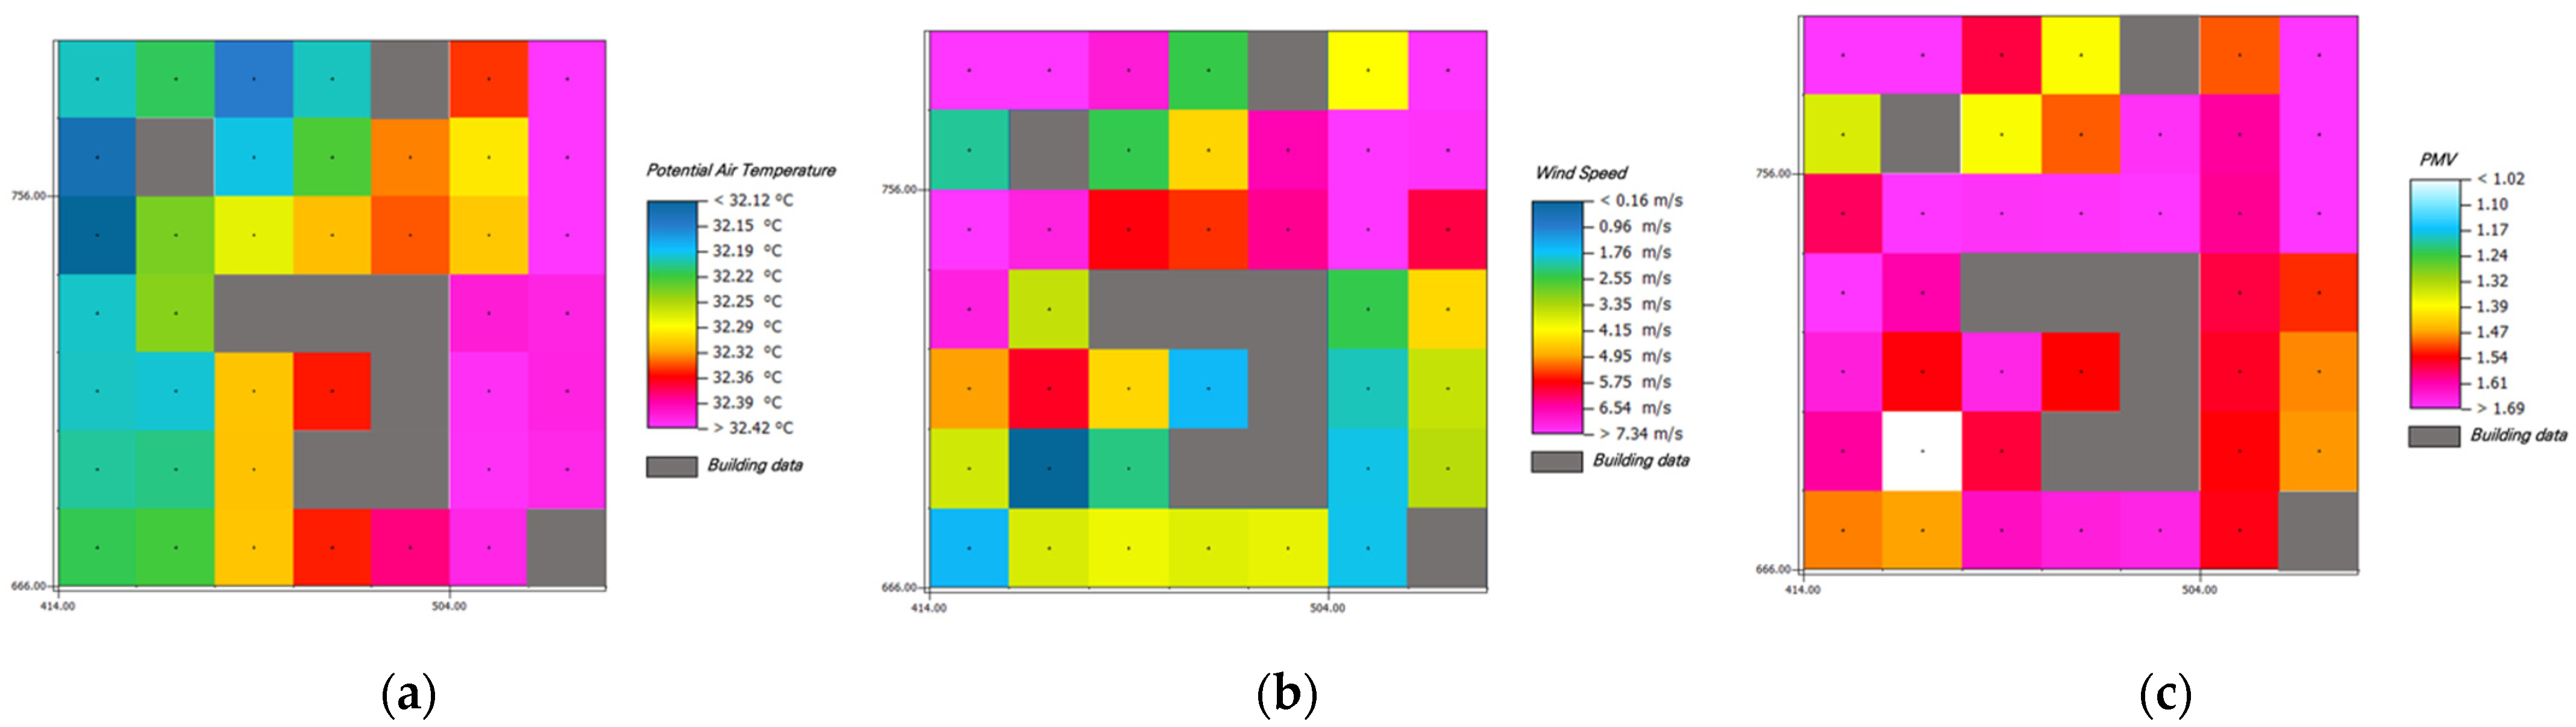
3.2.4. Open-Area Thermal Environment

The open urban area exhibited similar patterns as the closed area. Detailed information can be found in Table 11, Table 12 and Table 13. In the open area, S4, which had 70% grass and 30% trees, and S6, which had 30% grass and 70% trees, were found to be effective (Figure 11). In contrast, S7, which had 70% shrubs and 30% trees, resulted in the deterioration of the thermal environment. In the case of S4 and S6, the average temperature decreased by 0.004 °C and the maximum temperature decreased by 0.002 °C compared to the existing scenario (S0). In the case of wind speed, the average speed was 0.002 m/s and the maximum speed was 0.012 m/s. It can be seen that the thermal comfort was improved by an average value of 0.003 and a minimum value of 0.001. In the case of S7, the thermal environment deteriorated compared to the existing scenario (S0). The average temperature increased by 0.882 °C, the maximum temperature increased 0.887 °C, and the minimum temperature increased by 0.893 °C. In the case of wind speed, the average speed decreased by 0.015 m/s and the maximum speed by 0.002 m/s. Thermal comfort was also deteriorated; the average value increased by 0.593, the maximum value by 0.5, and the lowest value by 0.666 compared to the existing scenario (S0), and these results suggest high temperature stress.

3.2.5. Analysis of the Effects of Each Scenario

In the closed area, where the land cover was asphalt and the average building height was 28.2 m (SVF 0.0–0.4), green roofs with 70% grass and 30% trees were found to be the most effective. In the semi-open area, where the land cover consisted of asphalt, green spaces, and open spaces, the average building height was 32.6 m, and the SVF was 0.7, S8 with 50% shrubs and 50% trees was found to most effectively improve the thermal environment. In an open area with the building height average of 28 m, and the SVF was 0.9, green roofs with 70% grass and 30% trees, or 30% grass and 70% trees, were found to be the most effective. In the case of S7, which was set to 70% shrubs and 30% grass, the thermal environment deteriorated in closed, semi-open, and open areas. Table 14 shows the comparison between the highest value of each of the thermal environment variables among the significant scenarios in S1–S10 and the highest value of the existing scenario (S0). When the wind speed was faster than that in the existing scenario, the air temperature and PMV were slower than those in the existing scenario. Table 15 shows the results of the simulation using ENVI-core for each urban area type.
These results can be interpreted as effective green roof configurations in a form similar to that of semi-open areas, unless space is required by trees. When trees block solar radiation, they can cause space closures if you increase the density with trees, and can hinder heat circulation. In cities, long-wave radiative heat emitted from buildings is one of the factors that increases temperature; thus, heat dissipation due to sufficient circulation must be achieved. However, the lower the SVF, the less heat can be released, and the thermal environment worsens due to continuous circulation inside the city. To improve this, an appropriate green roof ratio should be created. In closed areas, the ratio of grass should be increased, and the ratio of trees should be decreased to make the roof spaces as open as possible. In semi-open areas, the ratio of grass should be increased, and using trees to form wind corridors should be applied to improve the thermal environment. Finally, open areas should likewise increase the ratio of shrubs or trees to create an intermediate SVF.
While previous studies have compared temperature based on existing green roofs compositions, this study analyzed distinctively the coverage rates of plant species that can maximize the heat-island-reduction effect by understanding urban spaces. Green roofs can be constructed to improve the thermal environment in two main ways. First, the SVF should be maintained at a median value of 0.4–0.7. In the scenario in which rooftop gardens were not created, the semi-open area had an average temperature of 32.085 °C, an average wind speed of 2.066 m/s, and a thermal comfort index of 1.650, indicating that the thermal environment was pleasant. This is deeply related to the thermal mechanism, and artificial heat emitted from the city must be circulated by the wind and moved elsewhere or released. In the case of closed areas, it is difficult to circulate artificial heat. In open areas, it is easy to release heat due to fast wind speed, but the temperature rises rapidly because solar radiation is absorbed without obstruction. Therefore, SVF should be set as 0.4–0.7 in order to induce heat circulation and prevent the direct absorption of solar radiation. Second, urban spaces that include closed or open areas should be converted to semi-open areas using shrubs and trees. For closed areas with an SVF ratio of 0.0–0.4 or more, it is effective to configure roofs with 70% grass and 30% trees. Using trees helps in heat circulation by creating wind corridors and minimizing the ratio of trees helps to avoid further space closures. In open areas, it is effective to configure trees so that their shade prevents solar radiation from directly reflecting off the building; this configuration should include 70%:30% ratio of grass to tree or vice versa.

4. Conclusions

The purpose of this study was to provide indications of the choice of green systems to be adopted according to the type of urban spatial structure rather than on building maintenance. Today’s cities have been developed so high that no city can be classified as a single type; accordingly, there is a need to establish green roof construction plans designed for each type of city. The present study was conducted using ENVI-met 3D simulation of a university in Seoul, a space that can represent the city due to the various land uses in the surrounding area. Urban spaces were classified into three categories (closed, semi-open, and open) using SVF, which reflects geometric urban spatial structures such as building shape and arrangement, and road width characteristics. The methodology used can be applied anywhere by inputting the appropriate settings into ENVI-space.
As a result of measuring the space of the target site by dividing it into closed, semi-open, and open areas according to the degree of development, semi-open areas were the most comfortable urban type in the scenario in which no green roofs were included. Therefore, in the case of closed and open areas, it is necessary to use shrubs and trees to make the space as open as it is in semi-open areas; that is, the SVF should be 0.5–0.7. In semi-open areas, it is necessary to maintain the existing SVF, but avoid shrubs in preference of the wind speed control and shadow effects of trees; thus, trees and grass should be used to improve the thermal comfort of urban residents.
This study is from the perspective of a single GI—green roofs. Thus, it is necessary to conduct further studies on the urban thermal environment that consider surrounding factors such as wind, solar energy, and land cover, as well as interactions with other GI such as green walls. It is also necessary to understand the components of GI that will change depending on the characteristics of the building such as slab and pillar capacity. Therefore, the efficiency of GI is not completely known, as the effect of improving the thermal environment is insignificant when the only GI implemented is green roofs. That is, green roofs are certain to help improve the thermal environment, but when used alone, it is highly likely that the thermal environment will not be noticeably improved. Nevertheless, this study is differentiated from studies that unify urban structures to prove the effectiveness of green roofs through simple temperature comparisons, as it divides urban types into three categories to consider green roof compositions that can be applicable to other cities. Moreover, this study used an extreme-value approach to examine the thermal environment on the hottest day. This methodology was adopted to maximize the heat-island-reduction effect of green roofs by setting it to the maximum temperature, but there is a need to generalize it through thermal environment analysis at the average temperature in the future. In the future, a follow-up study on the proposed guidelines is needed in consideration of other GI factors that can be applied not only to green roofs, but also to cities.

Author Contributions

Conceptualization, J.P.; writing—original draft preparation, J.P.; writing—review and editing, Y.S. and S.K.; supervision, S.-W.L. and K.A. All authors have read and agreed to the published version of the manuscript.

Funding

This paper was funded by Konkuk University in 2019.

Institutional Review Board Statement

Not applicable.

Informed Consent Statement

Not applicable.

Data Availability Statement

Not applicable.

Conflicts of Interest

The authors declare no conflict of interest.

References

  1. Oke, T.R. Boundary Layer Climates; Routledge: London, UK, 2002. [Google Scholar]
  2. Landsberg, H.E. The Urban Climate; Academic Press: Cambridge, MA, USA, 1981. [Google Scholar]
  3. Oke, T.R. The Energetic Basis of the Urban Heat Island. Q. J. R. Meteorol. Soc. 1982, 108, 1–24. [Google Scholar] [CrossRef]
  4. Wong, N.H.; Yu, C. Study of Green Areas and Urban Heat Island in a Tropical City. Habitat Int. 2005, 29, 547–558. [Google Scholar] [CrossRef]
  5. Solecki, W.D.; Rosenzweig, C.; Parshall, L.; Pope, G.; Clark, M.; Cox, J.; Wiencke, M. Mitigation of the Heat Island Effect in Urban New Jersey. Glob. Environ. Change Part B Environ. Hazards 2005, 6, 39–49. [Google Scholar] [CrossRef]
  6. Gang, J.-E.; Kim, Y.-K.; Lim, Y.-K. Meteorological Characteristics Associated with the Lasting of a Nocturnal High Temperature Day in Summer, Seoul. Asia-Pac. J. Atmos. Sci. 2005, 41, 681–695. [Google Scholar]
  7. Choi, G. Patterns of Strong Heat Waves within the Seoul Metropolitan Area and Its Impacts on Elderly Mortality Based on the Last 100 Year Observations. J. Korean Geogr. Soc. 2010, 45, 573–591. [Google Scholar]
  8. Lee, J.-A.; Jung, D.-Y.; Chon, J.-H.; Lee, S.-M.; Song, Y.-B. An Evaluation of Human Thermal Comfort and Improvement of Thermal Environment by Spatial Structure. J. Korean Inst. Landsc. Archit. 2010, 38, 12–20. [Google Scholar]
  9. Jeong, J.; Chung, M.H. The Planning of Micro-Climate Control by Complex Types. J. Korea Inst. Ecol. Archit. Environ.-Vol 2017, 17, 49–54. [Google Scholar] [CrossRef]
  10. Kwon, Y.J.; Lee, D.K.; Ahn, S. Urban Street Planting Scenarios Simulation for Micro-Scale Urban Heat Island Effect Mitigation in Seoul. J. Environ. Impact Assess. 2019, 28, 23–34. [Google Scholar]
  11. Ga, Y.C. How Do Paving and Planting Affect Microclimate Conditions and Thermal Comfort in High-Density Apartment Complexes? Master’s Thesis, Hongik University, Seoul, Korea, 2019. [Google Scholar]
  12. KIm, E.; Kim, H. Improving Thermal Environment and Thermal Comfort by Modifying Paving and Planting of a Covered Parking Lot - Focusing on MansuPublic Parking Lot in Namdong-Gu, Incheon. Urban Des. Inst. Korea 2020, 21, 117–131. [Google Scholar] [CrossRef]
  13. Kim, J.; Lee, S.Y.; Kang, J. Temperature Reduction Effects of Rooftop Garden Arrangements: A Case Study of Seoul National University. Sustainability 2020, 12, 6032. [Google Scholar] [CrossRef]
  14. Morakinyo, T.E.; Dahanayake, K.K.C.; Ng, E.; Chow, C.L. Temperature and Cooling Demand Reduction by Green-Roof Types in Different Climates and Urban Densities: A Co-Simulation Parametric Study. Energy Build. 2017, 145, 226–237. [Google Scholar] [CrossRef]
  15. Brown, R.D.; Gillespie, T.J. Microclimatic Landscape Design: Creating Thermal Comfort and Energy Efficiency; Wiley: New York, NY, USA, 1995. [Google Scholar]
  16. Lee, H.-Y. An Application of NOAA AVHRR Thermal Data to the Study of Urban Heat Islands. Atmos. Environ. Part B Urban Atmosphere 1993, 27, 1–13. [Google Scholar] [CrossRef]
  17. Givoni, B. Climate Considerations in Building and Urban Design; Wiley: New York, NY, USA, 1998. [Google Scholar]
  18. Jo, H.-K.; Ahn, T.-W. Impacts of Three-Dimensional Land Cover on Urban Air Temperatures. J. Korean Inst. Landsc. Archit. 2009, 37, 54–60. [Google Scholar]
  19. Jo, H.-K.; Ahn, T.-W. Exploring Relationships between Urban Tree Plantings and Microclimate Amelioration. J. Korean Inst. Landsc. Archit. 2006, 34, 70–75. [Google Scholar]
  20. Shashua-Bar, L.; Hoffman, M.E.; Tzamir, Y. Integrated Thermal Effects of Generic Built Forms and Vegetation on the UCL Microclimate. Build. Environ. 2006, 41, 343–354. [Google Scholar] [CrossRef]
  21. Armson, D.; Stringer, P.; Ennos, A.R. The Effect of Tree Shade and Grass on Surface and Globe Temperatures in an Urban Area. Urban For. Urban Green. 2012, 11, 245–255. [Google Scholar] [CrossRef]
  22. Kong, F.; Yan, W.; Zheng, G.; Yin, H.; Cavan, G.; Zhan, W.; Zhang, N.; Cheng, L. Retrieval of Three-Dimensional Tree Canopy and Shade Using Terrestrial Laser Scanning (TLS) Data to Analyze the Cooling Effect of Vegetation. Agric. For. Meteorol. 2016, 217, 22–34. [Google Scholar] [CrossRef]
  23. Krayenhoff, E.S.; Christen, A.; Martilli, A.; Oke, T.R. A Multi-Layer Radiation Model for Urban Neighbourhoods with Trees. Bound.-Layer Meteorol. 2014, 151, 139–178. [Google Scholar] [CrossRef]
  24. Park, C.-Y.; Lee, D.-K.; Kwon, E.-G.; Her, M.-J. Green-Infra Strategies for Mitigating Urban Heat Island. Korea Soc. Environ. Restor. Reveg. Technol. 2017, 20, 67–81. [Google Scholar]
  25. Lee, L.S.; Jim, C.Y. Urban Woodland on Intensive Green Roof Improved Outdoor Thermal Comfort in Subtropical Summer. Int. J. Biometeorol. 2019, 63, 895–909. [Google Scholar] [CrossRef]
  26. Ha, J.-H.; Lee, S.-K.; Park, C.Y. The Temporal Effects of Physical Environmental Characteristics on Urban Air Temperature—Focused on Sky View Factor(SVF). Korea Urban Manag. Assoc. 2015, 217–248. [Google Scholar]
  27. Walmsley, A. Greenways: Multiplying and Diversifying in the 21st Century. Landsc. Urban Plan. 2006, 76, 252–290. [Google Scholar] [CrossRef]
  28. Jo, S.-H. Building and Designing Urban Green Infrastructure through Landscaping; Public Officials Benefit Association: Seoul, Korea, 2010; pp. 12–16. [Google Scholar]
  29. Balany, F.; Ng, A.W.; Muttil, N.; Muthukumaran, S.; Wong, M.S. Green Infrastructure as an Urban Heat Island Mitigation Strategy—a Review. Water 2020, 12, 3577. [Google Scholar] [CrossRef]
  30. Lau, K.K.-L.; Chung, S.C.; Ren, C. Outdoor Thermal Comfort in Different Urban Settings of Sub-Tropical High-Density Cities: An Approach of Adopting Local Climate Zone (LCZ) Classification. Build. Environ. 2019, 154, 227–238. [Google Scholar] [CrossRef]
  31. Santamouris, M. Cooling the Cities–a Review of Reflective and Green Roof Mitigation Technologies to Fight Heat Island and Improve Comfort in Urban Environments. Sol. Energy 2014, 103, 682–703. [Google Scholar] [CrossRef]
  32. Dunnett, N.; Kingsbury, N. Planting Green Roofs and Living Walls; Timber press Portland: Portland, OR, USA, 2008. [Google Scholar]
  33. Hoffman, L. Green Roofs: Ecological Design and Construction; Schiffer Pub Limited: Atglen, PA, USA, 2005. [Google Scholar]
  34. Berndtsson, J.C. Green Roof Performance towards Management of Runoff Water Quantity and Quality: A Review. Ecol. Eng. 2010, 36, 351–360. [Google Scholar] [CrossRef]
  35. Getter, K.L.; Rowe, D.B.; Robertson, G.P.; Cregg, B.M.; Andresen, J.A. Carbon Sequestration Potential of Extensive Green Roofs. Environ. Sci. Technol. 2009, 43, 7564–7570. [Google Scholar] [CrossRef]
  36. Niu, H.; Clark, C.; Zhou, J.; Adriaens, P. Scaling of Economic Benefits from Green Roof Implementation in Washington, DC. Environ. Sci. Technol. 2010, 44, 4302–4308. [Google Scholar] [CrossRef]
  37. Brenneisen, S. Space for Urban Wildlife: Designing Green Roofs as Habitats in Switzerland. Urban Habitats 2006, 4, 27–36. [Google Scholar]
  38. Fioretti, R.; Palla, A.; Lanza, L.G.; Principi, P. Green Roof Energy and Water Related Performance in the Mediterranean Climate. Build. Environ. 2010, 45, 1890–1904. [Google Scholar] [CrossRef]
  39. Lee, L.S.H.; Jim, C.Y. Thermal-Cooling Performance of Subtropical Green Roof with Deep Substrate and Woodland Vegetation. Ecol. Eng. 2018, 119, 8–18. [Google Scholar] [CrossRef]
  40. Lee, L.S.H.; Jim, C.Y. Thermal-Irradiance Behaviours of Subtropical Intensive Green Roof in Winter and Landscape-Soil Design Implications. Energy Build. 2020, 209, 109692. [Google Scholar] [CrossRef]
  41. Wong, N.H.; Chen, Y.; Ong, C.L.; Sia, A. Investigation of Thermal Benefits of Rooftop Garden in the Tropical Environment. Build. Environ. 2003, 38, 261–270. [Google Scholar] [CrossRef]
  42. Yan, B. The Research of Ecological and Economic Benefits for Green Roof. In Proceedings of the Applied Mechanics and Materials; Trans Tech Publ: Stafa-Zurich, Switzerland, 2011; pp. 2763–2766. [Google Scholar]
  43. Getter, K.L.; Rowe, D.B.; Andresen, J.A.; Wichman, I.S. Seasonal Heat Flux Properties of an Extensive Green Roof in a Midwestern US Climate. Energy Build. 2011, 43, 3548–3557. [Google Scholar] [CrossRef]
  44. Guo, C. Research on the Impact of Sedum Lineare Planted Roof on the Indoor and Outdoor Thermal Environment in Guangzhou; University of South China University of Technology Press Guangzhou: Guangzhou, China, 2008. [Google Scholar]
  45. Zhao, D.; Xue, W. Power Conservation Effects from Light-Weighted Roof Greening. Chin. J. Shanghai Agric. 2008, 24, 99–101. [Google Scholar]
  46. Lee, L.S.; Cheung, P.K.; Fung, C.K.; Jim, C.Y. Improving Street Walkability: Biometeorological Assessment of Artificial-Partial Shade Structures in Summer Sunny Conditions. Int. J. Biometeorol. 2020, 64, 547–560. [Google Scholar] [CrossRef]
  47. Wu, J.-D.; Lee, H.-H.; Yoon, S.-H. An Analysis on Micro-Climate Characteristic of Apartments in Beijing, China Using ENVI-Met Simulation. J. Archit. Inst. Korea Struct. Constr. 2019, 35, 169–176. [Google Scholar]
  48. Choi, H.-J. Thermal Comfort Evaluation Using the Envi-Met: Micro Climate Model. Korean Inst. Archit. Sustain. Environ. Build. Syst. 2016, 10, 416–427. [Google Scholar]
  49. Herath, H.; Halwatura, R.U.; Jayasinghe, G.Y. Evaluation of Green Infrastructure Effects on Tropical Sri Lankan Urban Context as an Urban Heat Island Adaptation Strategy. Urban For. Urban Green. 2018, 29, 212–222. [Google Scholar] [CrossRef]
  50. S-MAP. Available online: https://smap.seoul.go.kr (accessed on 14 January 2022).
  51. Hamada, S.; Ohta, T. Seasonal Variations in the Cooling Effect of Urban Green Areas on Surrounding Urban Areas. Urban For. Urban Green. 2010, 9, 15–24. [Google Scholar] [CrossRef]
  52. Huang, J.-M.; Chen, L.-C. A Numerical Study on Mitigation Strategies of Urban Heat Islands in a Tropical Megacity: A Case Study in Kaohsiung City, Taiwan. Sustainability 2020, 12, 3952. [Google Scholar] [CrossRef]
  53. KIm, J.-H. Simulated Thermal Comfort during the Hottest Season in Low-Rise Dense Urbanized Area by Applying Urban Greening Units. Ph.D. Thesis, Seoul University, Seoul, Korea, 2020. [Google Scholar]
  54. The Meteorological Administration. Available online: https://www.weather.go.kr/w/index.do (accessed on 14 January 2022).
  55. Ministry of Land, Infrastructure and Transport. Available online: http://www.molit.go.kr/portal.do (accessed on 9 February 2022).
  56. Matzarakis, A.; Mayer, H. Investigations of Urban Climate’s Thermal Component in Freiburg, Germany. Available online: https://d1wqtxts1xzle7.cloudfront.net/42812709/Albuq_Freiburg1-with-cover-page-v2.pdf?Expires=1644805243&Signature=QUpZv7zeRaa1mtg1BOqy9fwFXSLP6M6bjpkWArULaBWUIqH20GVYQXjlZPufFqbtLf-G9idca7AIgV3nKd0iaB3~ZKpOJTG8YEJyIXIoSMLE50tZT0ZnHNxfZwLVMQwD670eOBRoNnbaIW51zBGMnEEIwEQB~KxWqv5JcP3JbuNtIGbM4N2wt4MggOK0~AoOzNJUGjwUHAlLYDnCo6b53kc4vsbaud343gyHCaxNSZiSvxdqYf8PhRSFyG9CEIE0Chrxj9LJ~DaEQ~DkzZMo3IqdaIpHlQGMqnL13l1fvUIq9SurOH5pVkoVJWyrOBtSUAM0aHeVgSrYoctTLa1Mxw__&Key-Pair-Id=APKAJLOHF5GGSLRBV4ZA (accessed on 14 January 2022).
Figure 1. Study site.
Sustainability 14 02146 g001
Figure 2. Work flow of 3D modeling using Rhino 6, Grasshopper, and simulation using ENVI-met 5.0.
Sustainability 14 02146 g002
Figure 3. Model data for the site using ENVI-space: (a) 2D modeling; (b) 3D modeling.
Sustainability 14 02146 g003
Figure 4. Green roof scenario settings.
Sustainability 14 02146 g004
Figure 5. Sky view factor (SVF) ratios for each urban type. Closed area (1), semi-open area (2), open area (3). (a) Analysis of the SVF using ENVI-met. SVF ratios of the (b) closed, (c) semi-open, and (d) open urban types.
Sustainability 14 02146 g005aSustainability 14 02146 g005b
Figure 6. Distribution of the simulated air temperature results for thermal environments in which green roofs were not created (S0). (a) Closed urban area; (b) semi-open area; (c) open area.
Sustainability 14 02146 g006
Figure 7. Distribution of the simulated wind speed results for thermal environments in which green roofs were not created (S0). (a) Closed urban area; (b) semi-open area; (c) open area.
Sustainability 14 02146 g007
Figure 8. Distribution of the simulated predicted mean vote results for thermal environments in which green roofs were not created (S0). (a) Closed urban area; (b) semi-open area; (c) open area.
Sustainability 14 02146 g008
Figure 9. Distribution of the (a) air temperature, (b) wind speed, and (c) PMV results for Scenario 4.
Sustainability 14 02146 g009
Figure 10. Distribution of the (a) air temperature, (b) wind speed, and (c) PMV results for S8.
Sustainability 14 02146 g010
Figure 11. Distribution of the (a) air temperature, (b) wind speed, and (c) PMV results for S4 and S6.
Sustainability 14 02146 g011
Table 1. Surface material settings.
BuildingsLakesRoadsParking LotsSidewalkOpen SpacesGreen Spaces
MaterialsConcreteWaterAsphaltConcreteAsphaltSoil2D Plant
Code0100C10000WW0100ST0100PG0100AR010000-
Albedo-0.000.200.500.500.200-
Emissivity
(%)
0.900.000.900.900.900.98-
Specific Heat
( kcal / g × )
840.000.00-----
Table 2. Building type and spatial characteristic classifications.
Build TypeX, YAverage SVF (%)Average
Building Height (m)
Land Cover
1Closed(22,50), (32,40)0.628.2Asphalt
2Semi-open(9,29), (19,19)0.732.6Asphalt/Grass
3Open(23,27), (29,21)0.928.0Asphalt/Grass
Table 3. Details of the greenery considered in the constructed green roof scenarios.
TypeGrassShrubsTrees
NameGrass avg. densityHedge densityTree density
Code0100XX0100H40000BS
Leaf typeGrassDeciduousDeciduous
Albedo0.200.200.20
Plant height (m)0.254.0020.0
Table 4. PMV as indicator for thermal perception and stage of thermal stress.
PMVThermal
Perception
Stage of Thermal Stress
−3.5
−2.5
−1.5
0.5
1.5
2.5
3.5
Very coldExtreme cold stress
ColdGreat cold stress
CoolModerate cold stress
Slightly coolSlight cold stress
ComfortableNo thermal stress
Slightly warmSlight heat stress
WarmModerate heat stress
HotGreat heat stress
Very hotExtreme heat stress
Table 5. Air temperature (°C) distribution for each scenario in the closed urban area.
S1S2S3S4S5S6S7S8S9S10
Median32.32032.32032.32031.31932.32031.31932.22732.32032.32032.320
Max32.45832.45832.45832.45832.45832.45833.35932.45832.45832.458
Min32.12032.12032.12032.11932.12032.11933.04532.12032.12032.120
Table 6. Wind speed (m/s) distribution for each scenario in the closed urban area.
S1S2S3S4S5S6S7S8S9S10
Median5.8235.8235.8235.8235.8235.8235.7965.8235.8235.823
Max8.1418.1418.1418.1438.1418.1438.1178.1418.1438.141
Min0.1590.1590.1590.1060.1590.1600.1580.1590.1600.159
Table 7. PMV distribution for each scenario in the closed urban area.
S1S2S3S4S5S6S7S8S9S10
Median1.8241.8241.8241.8321.8241.8242.1991.8241.8241.824
Max1.8851.8851.8851.8851.8851.8852.2621.8851.8851.885
Min1.3431.3431.3431.5071.3441.3441.6891.3431.3441.343
Table 8. Air temperature (°C) distribution for each scenario in the semi-open area.
S1S2S3S4S5S6S7S8S9S10
Median32.08532.08532.08532.08632.08532.08632.08632.08332.08632.085
Max32.20432.30532.20432.20532.20432.20533.08732.20232.20532.204
Min31.97031.97031.97031.97231.97031.97232.85631.96831.97231.970
Table 9. Wind speed (m/s) distribution for each scenario in the semi-open area.
S1S2S3S4S5S6S7S8S9S10
Median2.0662.0662.0662.0962.0662.0962.0602.0672.0962.101
Max6.5316.5316.5316.5566.5316.5566.5186.5316.5566.531
Min0.0280.0280.0280.0180.0280.0180.0190.0280.0180.028
Table 10. PMV distribution for each scenario in the semi-open area.
S1S2S3S4S5S6S7S8S9S10
Median1.6501.6521.6501.6501.6651.6652.0291.6501.6651.650
Max1.8011.8011.8011.8011.8021.8022.1741.8001.8021.801
Min0.9910.9900.9910.9910.9920.9921.3160.9890.9920.991
Table 11. Air temperature (°C) distribution for each scenario in the open area.
S1S2S3S4S5S6S7S8S9S10
Median32.32432.32432.32432.32032.32432.32033.20632.32432.32432.324
Max32.40532.40532.40532.40332.40532.40333.29232.40532.40532.405
Min32.21832.21832.21832.21232.21832.21233.10532.21832.21732.218
Table 12. Wind speed (m/s) distribution for each scenario in the open area.
S1S2S3S4S5S6S7S8S9S10
Median1.9211.9211.9211.9241.9211.9241.9061.9211.9241.921
Max3.5183.5193.5183.5323.5183.5323.5123.5193.5323.518
Min0.0010.0010.0010.0010.0010.0010.0010.0100.0010.001
Table 13. PMV distribution for each scenario in the open area.
S1S2S3S4S5S6S7S8S9S10
Median1.6061.6061.6061.6031.6061.6032.1991.6061.6061.606
Max1.7621.7621.7621.7621.7631.7632.2621.7621.7631.762
Min1.0231.0231.0231.0221.0241.0221.6891.0231.0241.023
Table 14. Maximum thermal environment reduction effect as a comparison between S0 and each significant scenario.
AreaThermal EnvironmentS0–S4S0–S6S0–S7S0–S8
ClosedAir temperature (°C)0.002-−0.899-
Wind speed (m/s)−0.002-0.024-
PMV0.005-−0.372-
Semi-openAir temperature (°C)--−0.7830.002
Wind speed (m/s)--0.0130
PMV--−0.3730.001
OpenAir temperature (°C)0.0020.002−0.887-
Wind speed (m/s)−0.012−0.0120.008-
PMV0−0.001−0.5-
Table 15. Average values of each thermal characteristic by type of urban space.
Land CoverAverage SVF
(%)
Green Roof Type
(%)
Air Temperature
(°C)
Wind Speed
(m/s)
PMV
CloseAsphalt0.6Grass: Trees = 70:3031.3195.8231.832
Semi-openAsphalt/Green0.7Shrubs: Grass = 50:5032.0832.0671.650
OpenAsphalt/Green0.9Grass: Trees = 70:30 or 30:7032.3201.9241.603
Publisher’s Note: MDPI stays neutral with regard to jurisdictional claims in published maps and institutional affiliations.

