Article

Coastal Vulnerability Assessment: A Case Study of the Nigerian Coastline

1
Department of Chemistry, Covenant University, Ota 112212, Nigeria
2
Surveying and Geoinformatics Department, Bells University of Technology, Ota 112212, Nigeria
*
Author to whom correspondence should be addressed.
Sustainability 2022, 14(4), 2097; https://doi.org/10.3390/su14042097
Submission received: 24 October 2021 / Revised: 29 December 2021 / Accepted: 30 December 2021 / Published: 12 February 2022
(This article belongs to the Topic Climate Change and Environmental Sustainability)

Abstract

:
Coastal regions are one of the essential spots on the earth as they are hosts to various important ecosystems, natural resources and the increasing population. Based on their proximity to the seas, they are mainly affected by sea-level rise, which is one of the adverse effects of climate change. This has resulted in associated hazards, such as beach erosion, flooding, coastal inundation, habitat destruction, saltwater intrusion into ground water aquifers and ecosystem imbalance. This study quantifies and classifies the vulnerability of the Nigerian coastline to these threats using the analytical hierarchical approach. This involved calculating the coastal vulnerability index (CVI) employing physical and geomorphological variables, and socioeconomic indicators that characterized the coastline vulnerability. The Nigerian coast was divided into seventeen (17) segments based on geomorphic units. The different vulnerability variables were assigned ranks ranging from 1 to 5, with 5 indicating the highest and 1 indicating the lowest vulnerabilities. The geomorphological and physical parameters include coastal slope, bathymetry, geomorphology, wave height, mean tidal range, shoreline change rate and relative sea-level rise, while the socioeconomic parameters include population, cultural heritage, land use/land cover and road network. The calculated CVI values (Saaty method) ranged from 11.25 to 41.66 with a median value of 23.60. Based on Gornitz approach, the calculated measures ranged between 3.51–4.77 and 3.08–5.00 for PVI and SoVI, respectively. However, the aggregated coastal vulnerability index computed using this approach ranged from 3.29 to 4.70. The results obtained from both approaches showed that 59–65% of the entire Nigerian coastline is under moderate to high vulnerability to sea-level rise. Data indicted how the coastal populations are highly vulnerable to both physical–geomorphological and socioeconomic stressors. Coastal vulnerability maps, highlighting the physical–geomorphological and socioeconomic vulnerability status of Nigerian coastline were also generated. The information from this study will assist coastal planners in identifying vulnerable segments in the study area and subsequently aid decisions that would mitigate the predicted impacts in the region.

1. Introduction

The coast serves as an interface for three major natural systems on the earth’s surface (i.e., the atmosphere, land, and hydrosphere) and provides several ecosystem services that are currently stressed due to several natural and anthropogenic processes such as climate change [1]. The increasing population that inhabits coastal regions also exacerbates these processes, leading to phenomena like rising sea levels, increased storms and other related events [2,3]. In 1990, about 1.3 billion people, about 23% of the world’s population, inhabited the coastal regions globally [4]. However, the number of coastal inhabitants has increased over the years, as about 40% of the world’s population now lives within 100 kilometers of the coast and over half a billion people presently live in urban settlements with low-lying coastlines [5].
Coastal vulnerability assessment centers on understanding how climate change will influence coastal communities and the ecosystem services they provide. These services may include natural resources and man-made infrastructure [6]. According to [7], coastal vulnerability results because of the complex interactions involving several natural and anthropogenic coastal processes [8] summarizes the natural processes to include geology and geomorphology, activities of waves and currents, sea-level changes, tectonics, and storms. The anthropogenic impacts include disruption of hydrological cycles through the construction of buildings along beaches, coastal structures such as harbors, beach protecting structures and jetties, mining of beach sand, and destruction of protective dune systems [7]. These factors contribute to the increased vulnerability of the coastline to sea-level rise, which is worsened by climate change. Some studies have integrated social and physical vulnerability to depict the relationship between human and the environment [9], while other studies focus on information that considers only biophysical vulnerability. However, studies that incorporate the biophysical and socioeconomic vulnerabilities have been on the increase in recent times. Some of the major socioeconomic factors considered in some write-ups are beliefs and customs, population size, inadequate resources, limited political power [10]. The mutual interaction of both aspects of vulnerabilities helps to create adequate adaptation policies for sustainability. These methodologies have been widely applied for academic and management purposes [11]. To achieve a widespread knowledge of vulnerability, it is necessary to integrate the physical and social aspects. This helps to provide a true picture of the effect of any hazard on the people [12]. An important approach for efficient coastal zone management involves the identification of regions that are vulnerable to sea-level rise [13].
In Nigeria, the coastline is home to cities such as Lagos, a city with an estimated population of about 20 million residents and the major economic hub of Nigeria, and Port Harcourt, a state capital located in the Niger Delta region, home of the oil and gas sector in Nigeria [14,15]. The coastline is low-lying [16], and it is endowed with a vulnerable mangrove system, which has depleted over time due to anthropogenic activities such as crude oil exploration, use of wood as fuel, timber, fishing, sand mining, etc. [17]. Lack of government policies that protect these vital ecosystems has contributed enormously to its destruction.
There are various studies on coastal climate impacts in Nigeria [14,18,19,20,21]. However, the present study quantitatively assesses and classifies the degree of vulnerability of the entire coastline of Nigeria, as past studies were carried out on regional basis. The continuous growth and development in coastal regions require that vulnerability assessments be carried out to aid informed decision-making and coastal planning against the impacts of increased sea levels.

2. Methodology and Study Area
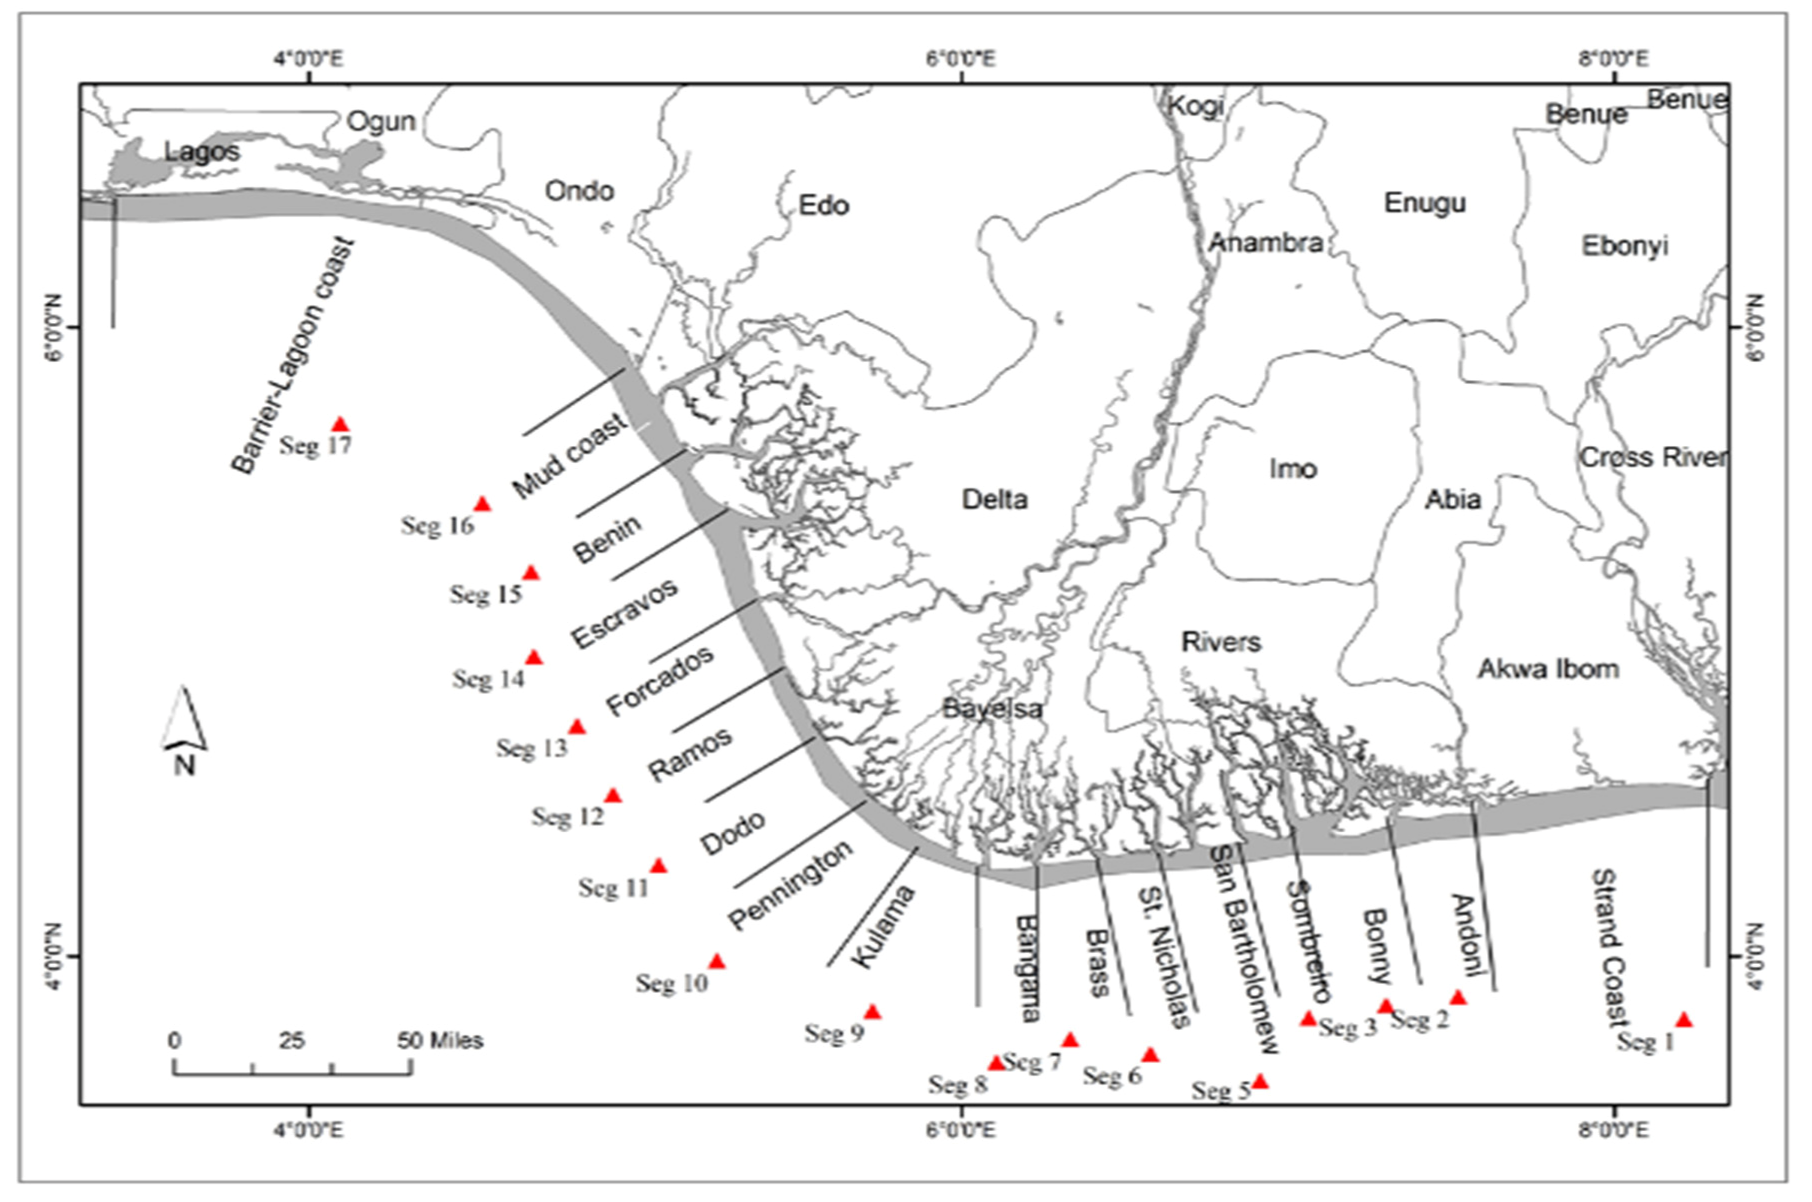
2.1. Study Area

The Nigerian shoreline lies in the Gulf of Guinea along the West coast of Africa [22]. It lies on the west coast of Africa between latitude 4°10′ to 6°20′ N and longitude 2°45′ to 8°32′ E, extending from the Seme border in Badagry to Ikang in Cross River State (from West to East) and gently descending into the Atlantic Ocean [15]. It is approximately 853 km long, cutting across nine out of its thirty-six states, with a vast expanse located in the Niger Delta [23]. These are the Barrier–lagoon coastal complex, the Mahin transgressive mud coast, the arcuate delta, and the Strand coast [15]. The coastline zones were divided into seventeen (17) segments (as shown in Figure 1) across the geomorphic units along the coast bordering the equatorial Atlantic Ocean and the individual vulnerability variables were designated respective rank or number ranging from 1 to 5, such that 5 and 1 indicated the highest and lowest vulnerabilities, respectively. The coastal vulnerability rankings used in this study are shown in Table 1.

2.2. Analytical Hierarchical Approach and Coastal Vulnerability Assessment

The coastal vulnerability index is a widely acceptable method that incorporates both the external environmental stressors and inherent adaptability approaches in assessing physical and socioeconomic vulnerabilities of coastal environmental ecosystems [24,25,26,27]. Many formulae and methods have been developed by researchers for computing coastal vulnerability index [28,29,30]. One of the multiple approaches is the analytical hierarchical process (AHP) which was proposed by [31] to estimate the required weighting factors, using the normalized principal Eigenvector called the priority vector. In this method, the identified measures or variables are paired and contrasted against one another and the priority relative weights, while it considers the subjective and objective variables in a comparison matrix.
In this study, seven physical geomorphological variables, namely, coastal geomorphology, slope, shoreline change rate, bathymetry (elevation), wave height, sea-level rise and mean tidal range, are considered for computing the physical vulnerability index (PVI) (Table 2). The socioeconomic index (SoVI) parameters used in this study are population, cultural heritage, land use/ land cover and road network. Therefore, using the PVI and SoVI attributes, the analytical hierarchical process (AHP) was computed.
The aggregated coastal vulnerability index (CVI) was subsequently computed, and the indices were utilized to explain the relative vulnerability of each segment along the coastal shoreline. According to the AHP protocol, the initial step is to make a paired comparison for all physical geomorphological and socioeconomic variables investigated as potential factors influencing vulnerability into a comparison matrix, based on assigned ranks and the intensity of importance. According to [31], each vulnerability variable is ranked and evaluated against other factors by allocating a relative predominant scale value between 1 and 9 in a manner that the highest ratio corresponds to 9. In this study, the comparison matrixes were created for the physical–geomorphological and socioeconomic variables, which subsequently led to the computation of the normalized Eigenvector of the matrix, also termed the priority vector (Table 2 and Table 3). This shows the relative weights among the variables compared in the matrix. However, the principal Eigenvalue could be computed using the sum of products between the variables of the Eigenvector and the sum of columns of the reciprocal matrix. According to [31], for the consistency of reciprocal matrix, the largest Eigenvalue is equivalent to the size of the comparison matrix. Thus, the consistency index, which indicates consistency or the degree of deviation, is computed using Equation (1) below:
CI = λ max n n 1
where λ max is the principal Eigenvalue of the matrix and n is the size of the comparison matrix.
However, to determine the matrix’s consistency as well as ensure that the comparison matrix obtained is unbiased, a consistency ratio (CR) is calculated using the expression in Equation (2). The consistency ratio, which indicates the ratio between the consistency index and the random consistency index should be less than 0.1 when calculated.
CR = CI RI
The appropriate consistency index known as the random consistency index (RI), as reported by [31] is shown in Table 3 below:
The computed consistency ratios for the socioeconomic, and physical and geomorphological measures are presented in Table 4.
The estimations of the average entities of each column are calculated and these values are utilized as weights in calculating the physical vulnerability index (PVI) and the socioeconomic vulnerability index (SoVI) through the analytical hierarchical process. However, each summation of the row-wise values in the computed comparison matrix results in respective relative variable weights. Although several approaches are available for the calculation of PVI and SoVI, in this study we adopted the Gornitz’s formula which expresses the weighted sum of each parameter’s vulnerability ranking. Therefore, the corresponding indexes (PVI and SoVI) were calculated as follows using Equations (3) and (4) [27]:
PVI = P 1 W 1 + P 2 W 2 + P 3 W 3 + P 4 W 4 + +   P 7 W 7
S o VI = S 1 W 1 + S 2 W 2 + S 3 W 3 + S 4 W 4
where Pi is the i variable of physical vulnerability index, Si is the i variable of socioeconomic vulnerability index, and Wi is the i relative weight value associated with either the physical or socioeconomic vulnerability variable. Moreover, the relative weight of each variable is designated following the AHP protocol [25,31,32,33,34,35].
The aggregated coastal vulnerability index (CVI), is calculated using Equation (5) below if the physical–geomorphological and socioeconomic measures possess the same approximated contributions to coastal vulnerability.
CVI = PVI + S o VI 2
Another formula (Equation (6)) often used for calculating CVI as proposed by [36] considers CVI based on the number of ranked vulnerability score of each variable, xi, as:
CVI = x 1 × x 2 × x 3 × x 4 × x n n
In line with this CVI approach, physical and socioeconomic coastal factors are estimated, examined and contrasted with the ranges of values associated with each variable. This comparison permits the ranking of physical factors that indicate each category of the degree of vulnerability. The considered measures or variables are categorized into exposure: E, sensitivity: S and resilience: R, and could be mathematically expressed as Equation (7) [37]:
CVI = E × S R
The vulnerability factors are those intrinsic characteristics of the environment or ecosystem that set such a factor for a probably negative effect; they depict what is presented as threats and stressors [38]. These factors are classified as exposure variables. On the other hand, sensitivity factors are the attributes of the exposed environmental system that impact the degree of hazards [39]. The resilience of an ecosystem suggests the capacity to adjust and adapt or utilize the effects of vulnerability as an open door for the future. Technically put, resilience factors allow the ecosystem parameters to adapt to and diminish the conceivable effects of the disaster on the vulnerable inhabitants of those ecosystems [18]. The exposure and sensitivity factors are known to enhance the vulnerability of environmental systems, while the resilience variables facilitate the exposed environments to resist and decrease the vulnerability to stressor impacts. However, the methods used in the present study does not consider the resilience variables in calculating the CVI. For [29], even though CVI can be communicated as a total of the boundaries, the CVI registered as a result of boundaries has the potential of expounding the scope of qualities. Besides, Diez et al. [40] recommended that the CVI as the entirety of differentially weighted factors speak to the natural changeability all the more fittingly. In the current examination, PVI and SoVI have been determined using the two techniques and it is discovered that the strategy for summation appropriately communicates the conditions in this locale.
The methodologies employed in this study to obtain the weighted averages are unique in relation to the techniques used earlier in similar vulnerability assessment. For example, [41] got the differential loads for the boundaries by duplicating the weakness rank qualities and discretionary increasing factors dependent on the general centrality of the five factors considered. They have positioned geomorphology and slant as boundaries more significant than others (shoreline change, SWH, tidal range), thereby giving them the most elevated load of four, consequently offering two to shoreline change and leaving no loads to flowing extent and SWH. Ref. [34] employed a GIS-based appropriateness evaluation for Laoshan locale where they use AHP as a technique to determine loads. Similarly, in this current investigation, loads for the different boundaries have been determined with the use of a logical progressive cycle. This is on the grounds that, although in relative terms, one specific boundary may have more centrality than the other, giving outright loads is dependent on the caution of the examiners profoundly subverting the individual commitment of every factor. For example, beach front slope and geomorphology are frequently viewed as important parameters on account of vulnerability to the sea-level rise.

3. Results and Discussion

Table 5 presents the eight identified coastal variables and the ranking of the vulnerability index variables.

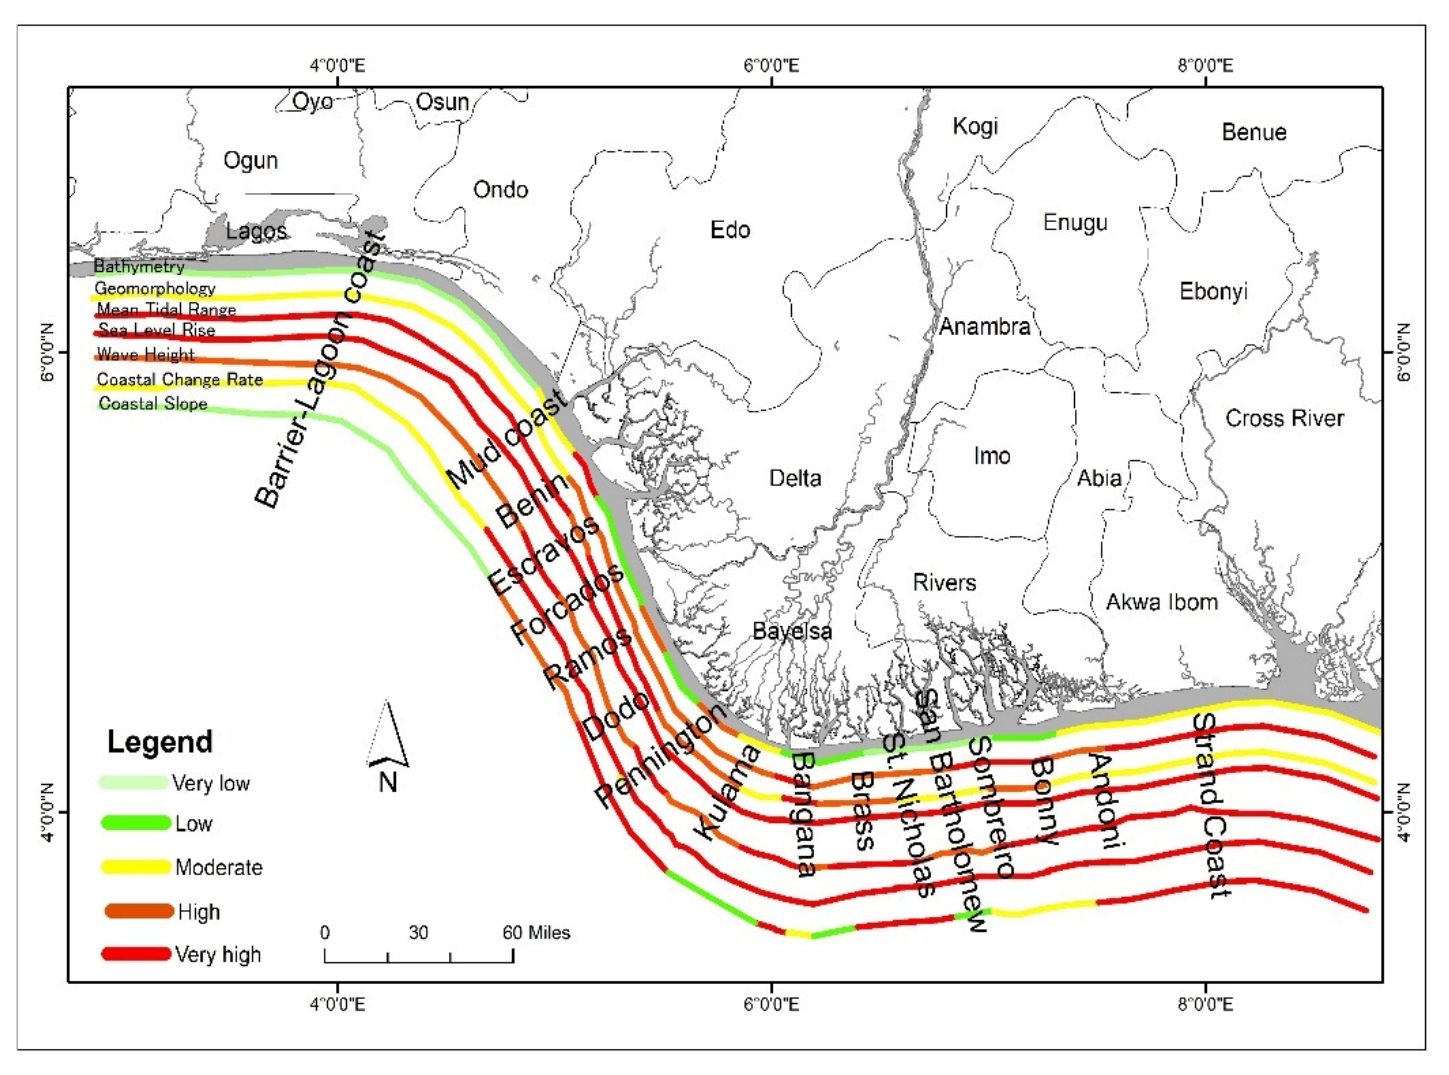
3.1. Physical Factors

3.1.1. Coastal Slope

The nearshore or coastal slope could be defined as the steepness or cross-shore gradient of the subaqueous profile, or the ratio of the gradient of two points on the nearshore zone perpendicular to the shoreline [32,42]. It is a relevant coastal variable which influences the morphological, hydrodynamic and coastal processes such as the rate of sedimentation, sediment size distribution, wave characteristics, flooding, loss of land and inundation of low-lying plains [32,42,43]. Consequently, on a precarious coast, the outcome of ocean level ascent would be irrelevant, as opposed to a gently slanting coast, where any sea-level rise would immerse huge amount of land [41]. Besides, the depth shows the profundity from the coast towards the vast sea -and consequently, it may be utilized to gauge near-shore gradient value of a coastal zone.
In this study, the merged dataset with the Open Street Maps (OSM) coastline and elevation data from the Nigerian Institute of Oceanography and Marine Research Database were used to compute the coastal slope. The slope values calculated were incorporated into the ArcGIS to classify the entire Nigerian coastal units. The coastal slopes for the 17 segments were ranked using indexes ranging from 1 to 5, where a higher rank had the least vulnerability. The gradations of ranking were <0.2%, 0.2–0.4%, 0.4–0.6%, 0.6–0.8%, and >1% for very high, high, moderate, low and very low, respectively.
In the Barrier–lagoon coast to the Mud coast in the southwest coastline of the Atlantic Ocean, the slope varied from 0.6% to >1.0%. The Escravos (SEG14) up to San Bartholomew (SEG5) through to the farthest eastern Strand coast (SEG1) flank appeared to have a slope that ranged from 0.2% to 0.4% except the transects at Pennington (SEG10), Brass (SEG7) and Sombreiro (SEG4) with coastal slope that ranged between 0.8% and 0.6% (Figure 2, Table 5). This implies that about 65% of the segments along the coastline were in the moderate to very high vulnerability ranking, while the Barrier–lagoon coast, Mud coast and the Benin coast were classed within the low to very low vulnerability. Most of the segments had flatter slopes with intertwined mud coast, estuaries, lagoons, rivers and peninsulas dotted across the coastline. The Barrier–lagoon coast consists mainly of steeper-sloped beaches of medium grained, moderately well-sorted sand. Generally, this coastal zone is reported to have limited mangroves and a known high energy coastline with a low mean tidal range of 1.1 m [43]. This means that the Barrier–lagoon coast (SEG17) is microtidal. However, the presence of mangroves and narrower beaches with gentle slopes in the Strand coast (SEG1) up to St. Nicholas (SEG6) are pointers to a mesotidal coastal region with moderate to very high vulnerability.

3.1.2. Coastal Geomorphology

Coastal morphology is influenced by tectonic and structural characteristics, the composition of the coastal rock, and depositional and erosive processes. It plays a relevant role in mitigating the shore’s response to the rise in sea level, as it exerts relative erodibility and extent of coastal resistance to changes in landform characteristics [28,32]. Geomorphology studies offer relevant knowledge on characteristics that are particularly vulnerable to the present environmental hazards and are increasingly sensitive to potential future climate variability. However, coastal geomorphology is the product of predominant geomorphic mechanisms that have been induced to achieve the existing morphology [44,45]. Based on the detailed geomorphological map of the Atlantic coastline (Figure 2) prepared using USGS Landsat imagery, the major landforms of the region include mud coast, lagoons, creeks, rivers, coastal plain, peninsular, sand beaches, flood plain, islands, tidal flats, estuaries and mangroves. The southwest coastline is classified basically into two zones based on geomorphology, beach type, ecology and the ecosystem services that the coastline offers [46]. It stretches for about 350 km and covers 6185 km2 of land.
Geomorphologically, the southwest coastline consists of the barrier–lagoon coast system which stretches for 250 km from the Benin/Nigeria border, east to the western frontier of the transgressive mud coastline; and the Mahin transgressive mud coast that covers for 75 km and ends at the mouth of the Benin River on the northwestern side of the Niger Delta. Intertwined meandering creeks are located along the coastline, significantly dividing parts of the coast into marshy islands. Also, four large lagoonal systems are located in the southwestern flank of the Atlantic coastline, and these are Lekki, Yewa, Lagos and Ologe Lagoons. A combined surface area of 649 km2 is covered by Lekki and Lagos Lagoons, while about 15 km2 and 12 km2 are covered by Yewa and Ologe Lagoons, respectively [45]. Furthermore, peninsulas are dominant geomorphological features along the coastline. Among these, the Lekki Peninsula and the Mahin Peninsula are popular. The Mahin Peninsula is approximately 54.25 km long, from Ode-Omi village in the east to Mahin forest, while the Lekki Peninsula is approximately 75 km long, extending from Victoria Island in the west to Refuge Island in the east, with about 10 km wide on the average. Based on geomorphology, the type of beach and the occurrence of natural vegetation, the 853 km long coastline of Nigeria, a nation on the eastern edge of West Africa, can be divided into 4 large geographic units: barrier island coast, mud coast, Niger Delta coast and the strand coast [15,22,24,44,47,48,49].
The graphical presentation of vulnerability rankings based on the coastal geomorphology of the Atlantic Ocean coastline in Nigeria is as shown in Figure 2. From the results, the barrier–lagoon and Mud coasts segments are moderately vulnerable to climate change impacts in respect with the predominant mud coast, lagoons, peninsular, sand beaches and estuaries ecosystems that are found in these coasts. On the other hand, the Delta and Strand coasts are expected to see high to very high vulnerability from geomorphological standpoint.

3.1.3. Shoreline Change Rate

The interface between land and sea is the shoreline. For the quality of life along the coast, safe beaches and shorelines are important because they provide storm defenses and essential environments for many species of plants and animals. Shoreline change rate is due to changes in coastal processes, which are largely regulated by ocean wave characteristics, near-shore mixing dynamics, sedimentation rates and beach characteristics. The shoreline is defined as the physical interface between land and sea, according to [50]. Responsive habitats that offer different resources and have ecological importance are coastlines/shorelines. Owing to the complex and dynamic nature of water levels at the coastal boundaries, shoreline locations are constantly altered due to cross-shore and inland sediment flow in the littoral zone. In other words, changes in shoreline are potentially attributed to the movement of ocean waves that are essential for shoreline sediment transport in the near shore zone [32,51,52,53].
Accreting coastlines are perceived to be less vulnerable with regard to coastal vulnerability, since they result in introducing land areas when heading into the shore. On the other hand, because of the resulting depletion of natural and man-made wealth associated with them, eroding coastlines are considered highly fragile. The slope of the coast offers an understanding of the coast’s vulnerability to flooding and the rate of shoreline erodibility [43]. The extent of change in sea level would flood vast areas of land; however, the effect of sea-level rise would be negligible on a steep coast [51,52]. Urbanization, sand mining, industrialization and land reclamation have been identified as the major anthropogenic factors making the coastlines to be under the threats of erosion [45]. According to [44], eroding coastlines of the present study area are constantly influenced by oil exploration and exploitation activities, harbor development and construction of coastal defense. Coastal erosion is a natural occurrence along the coast of Nigeria and crosses a few 10s of m/y at some locations [54]. The extreme sea wave conditions, poor coastal plain topography, fragile sedimentation processes, the presence of underwater submarine canyons and gullies, and accelerated increase in sea level are natural factors responsible for intense change in shoreline of the Nigerian coastlines [44].
The Digital Shoreline Analysis System (DSAS) v5.0, a computer software for calculating historical shoreline change or the rate of change in multiple coastline position over time was used in evaluating the shoreline change of the study area. For this study, the rate of shoreline changes during the 29 years (1986–2015) period was analyzed. In view of the rate of shoreline change considered as a physical and geomorphological variable along the coast, the vulnerability classification is applied to different coastal segments of the Atlantic coastlines (SEG1–16) according to the ranges given in Table 5 of the adopted ranking scheme. Going by this scheme, the coastal segments along the coast are ranked from one to five (very low–very high), as shown in Table 5 and Figure 2.
The shoreline changes were categorized into 5 with the very low, low, moderate, high and very high vulnerability rankings, taking >2.0 m/year, 1.0–2.0 m/year, −1.0 and 1.0 m/year, −1.0 and −2.0 m/year, and <2.0 m/year change rate, respectively. Furthermore, the positive and negative values denote accretion and erosion susceptibility along the investigated coastline. In this study, the shoreline change rate with the study period ranged <−2.0 to 1.0 m/year, and this variability was consistent from the southwestern flank of the Atlantic coastline to the eastern end of the Strand coast. This means that the coastline segments were in the very high to moderate vulnerability categories. It was observed that erosion is more pronounced in most segments of the shoreline based on the results except in SEG16 and 17 (Barrier–lagoon and Mud coasts) where shoreline accretion was more significant. Over the period investigated, anthropogenic impacts along the coastline appear to have intensified erosion processes, and the prevalent accretion patterns observed could be attributed to localized near-shore bathymetry, low wave current velocity and tidal wave height along those segments. Similar erosion and accretion patterns along the investigated shoreline have been reported [20,55,56,57]. More accretion than eroding segments have been reported along the Barrier–lagoon coast of Lagos [55]. Settlements and communities situated along the other segments, especially the Forcados, Escravos, Ramos Rivers, Brass, Bonny up to the farthest end of the Strand coast, are considerably vulnerable and would experience episodic effects of coastal erosion and associated climate change impacts.

3.1.4. Sea-Level Change

According to [58,59], two major factors can induce sea-level changes - one is global (mean sea-level change) while the other is regional (mean sea-level change) (extreme sea-level changes). The increase in sea level is thus a significant phenomenon involving global and regional dynamics that exacerbate coastal vulnerability caused by climate change along every coast [9]. The increase in sea level has a direct correlation with coastal inundation, and it can make a given coastal section highly susceptible to flooding and saltwater intrusion along with the coastal slope, contributing to near shore area deterioration.
The thermal expansion of sea water and land ice melting contribute to sea-level rise [59]. Aside from constituting a significant threat to coastal marine ecosystems, rising sea levels substantiate much evidence of anthropogenic climate change. The increase in global atmospheric temperature induces an increase in seawater temperature and the resulting melting of ice, leading to an increase in global sea level [60,61,62]. Global experiments on sea-level rise have been carried out widely in the last two decades owing to the availability of monthly mean sea level data by a permanent service for mean sea level [63]. There are many means of deriving data for the computation of sea-level change, including retrieving from satellites and direct measurements. In this study, the sea level measurements were sourced from the Nigerian Institute of Oceanography and Marine Research Database for the period covering 1986 – 2015. The assigned ranking value for coastal sea level vulnerability varied between 1 and 5 (very low = 1, low = 2, moderate = 3, high = 4, and very high = 5) (Table 5).
In this study, the sea-level rise (SLR) vulnerability was categorized into very high (>3.2 mm/year), high (2.4–3.2 mm/year), moderate (1.6–2.4 mm/year), low (0.8–1.6 mm/year) and very low (<0.8 mm/year). The SLR recorded shows that much of the coastline is low-lying with considerably high to very high vulnerability with an average sea-level rise of 2.1 mm/year (Figure 2). Using the Bruun model, a study has suggested that the Nigerian coast is low-lying with about 1 to 3 m increase in sea level with the Strand coast projected to experience most recession in coastline than other regions [63]. A similar vulnerability assessment associated with sea-level rise at the Badagry coastline found that large segments of the coastline are vulnerable to sea-level rise, shoreline recession and coastal flooding [64]. This means that much of the Barrier, Mud, Delta, and Strand coast might be inundated and eroded by ocean water due to receding shoreline with rising sea level. Sea level rise is linked to coastal inundation, and when combined with unprecedented change in the coastal slope of a region could cause any given coastal segment to be extremely susceptible to erosion, seawater intrusion into freshwater ecosystems, loss of biodiversity, resulting in massive damage to coastal shoreline and disruption of livelihoods of dwellers [25,64,65].

3.1.5. Tidal Range

Strong coastal erosion episodes and enhanced sedimentation are usually associated with high tidal ranges [25,27,44]. Furthermore, it has been reported that macro-tidal coastlines (>4 m) could be more vulnerable than coasts with smaller tidal ranges. The tidal range along the Strand coast has been reported to vary between 2 and 3 m (i.e., it is a mesotidal coastline), while the high energy Barrier–lagoon coast is characteristically marked by low mean tidal range of 1.1 (i.e., it is microtidal) [43]. In general, the Nigeria’s coast has a high level of wave activity. The wave’s dynamics is more characteristically stable and consistent due to the generally low mean tidal range (varying from 1.1 m in the west (Lagos) to about 3 m at the Cross River Estuary at the eastern end of the coastline). The dominant south–southwest winds that have a long ocean sweep tend to produce big ripple of waves. In this study, the mean tidal vulnerability rankings were as follows: very low (>4.0), low (3.0–4.0 m), moderate (2.0–3.0 m), high (1.0–2.0 m) and very high (<1.0 m). Tidal range data from the Oceanography and Marine Research database for the period covering 1986–2015 were used for this study.
To comprehend the vulnerability along the four geomorphic units of the Atlantic coastline with regard to storm surge incidents with rising tides, the mean tidal ranges were considered. If the tidal range is low (microtidal), the seawater levels can be typically confined to the high waterline for most worst-case scenario, and therefore the occurrence of a particular storm surge and rising tide is often probable. Therefore, this will make the coastline highly vulnerable. Whenever the tidal range is significant (mesotidal), the seawater level will be smaller than the high or current waterline, throughout most of the tidal cycle, and the aggregate impact could result in a reduced coastal vulnerability. The Barrier–lagoon and Mud coasts were typically regions of very high vulnerability (Table 5), while the Delta and Strand coast segments were mostly regions where the combined impact of rising tides and storm surges from the Atlantic seawater could have lower (moderate to high) vulnerability (Figure 2). The estimated tidal range for the Delta and Strand coasts in this study varied between 1.6 and 3.2 m (i.e., these are mesotidal coasts). These findings are consistent with the previous reports by [44,64]. According to [44], the Delta/Strand coastline is mesotidal with a marked tidal range that ranges from 2 to 3 m.

3.1.6. Wave Height

Significant wave height (SWH) is an important physical variable for assessing the vulnerability of coastlines. The average of the maximum one-third (33%) of the waves that occur in a given time is described as significant wave height [32]. In general, SWH is used as an alternative to wave energy and is considered as an essential tool for studying shore-line vulnerability. In addition, by the presented model, wave energy is explicitly proportional to the square of wave height (Equation (8)):
E = 1 8 ρ g H 2
where E is energy density, H is wave height, ρ is water density, and g is the acceleration due to gravity.
A rise in wave height creates an increase in wave energy, resulting in increased erosion and floods along the coast. This could lead to the loss of farmlands and coastal habitats. Coastlines that have high wave heights are also known to be more vulnerable than those that are exposed to low wave heights. For a period covering 29 years (1986–2015), a 3rd generation numerical wind-wave model MIKE 21 Spectral Wave (SW) was employed to simulate the hourly wave activity in the study area, which attempts to model and calculate the size of wind-generated waves and swell by resolving the wave action equation. Inputs of diurnal wind speed and directions from the ocean–atmosphere-coupled model, the Regional Climate Model (RCM) of the Coordinated Regional Climate Downscaling Experiment was used. The input data was subjected to a spatial resolution of 0.5° × 0.5° with a temporal resolution of 6 h in Nigeria. The SW model was calibrated based on wave-rider buoy observations made over 10 years (2005–2015) along the Atlantic coastline by the Nigerian Institute for Oceanography and Marine Research (NIOMR).
The wave height ranking in this study was categorized in <0.6 m, 0.6–1.2 m, 1.2–1.8 m, 1.8–2.4 m and >2.4 m for very low, low, moderate, high, and very high vulnerability indexes, respectively. Notably, the wave height values in the Strand and Mud coasts segments were ranked as coastline with very high vulnerability, while the Delta (SEG2 – 15) and Barrier–lagoon (SEG17) coasts recorded high to very high vulnerability (Figure 2). This implies that these coastlines are mainly subjected to wave heights that ranged between 1.8 m and 2.4 m during storm surges and high seawater tidal times.

3.1.7. Bathymetry

Bathymetry refers to the method and classification of determining the depth of bodies of water. It represents the depth from the coast to the open sea and therefore can be used to determine the coastal near-shore gradient. The coastal bathymetric measurements used in the present study were obtained from the Nigerian Institute of Oceanography and Marine Research Database and were used for the classification of the vulnerability of the Barrier–lagoon, Mud, Delta and Strand coastlines. The average bathymetry below the mean tidal range of about 1.0 m was considered to be extremely prone to sea-level rise and storm surges, and therefore, very highly vulnerable. In this study, the coastal vulnerability index ranking due to bathymetric measurements was divided into five categories: very low (>6.0 m), low (6.0–5.0 m), moderate (5.0–4.0 m), high (4.0–3.0 m), very high (<2.0 m) (Table 5). In general, elevations above 4.0 m were considered as relatively less vulnerable to flood inundation, while any segment elevation below 2.0 m was associated with high vulnerability.
Figure 2 presents the vulnerability index of the mean coastal bathymetric data for the Barrier–lagoon, Mud, Delta and Strand coasts. The bathymetry of the Strand coast (SEG1), Andoni (SEG2), Kulama (SEG9) and Mud coast (SEG16) were between 4.0 and 5.0 m, and therefore could be referred to as areas with moderate vulnerability. Other segments including the Barrier–lagoon coast data that were greater than 5.0 m and hence had beaches that were categorized in the low to very low vulnerability range.

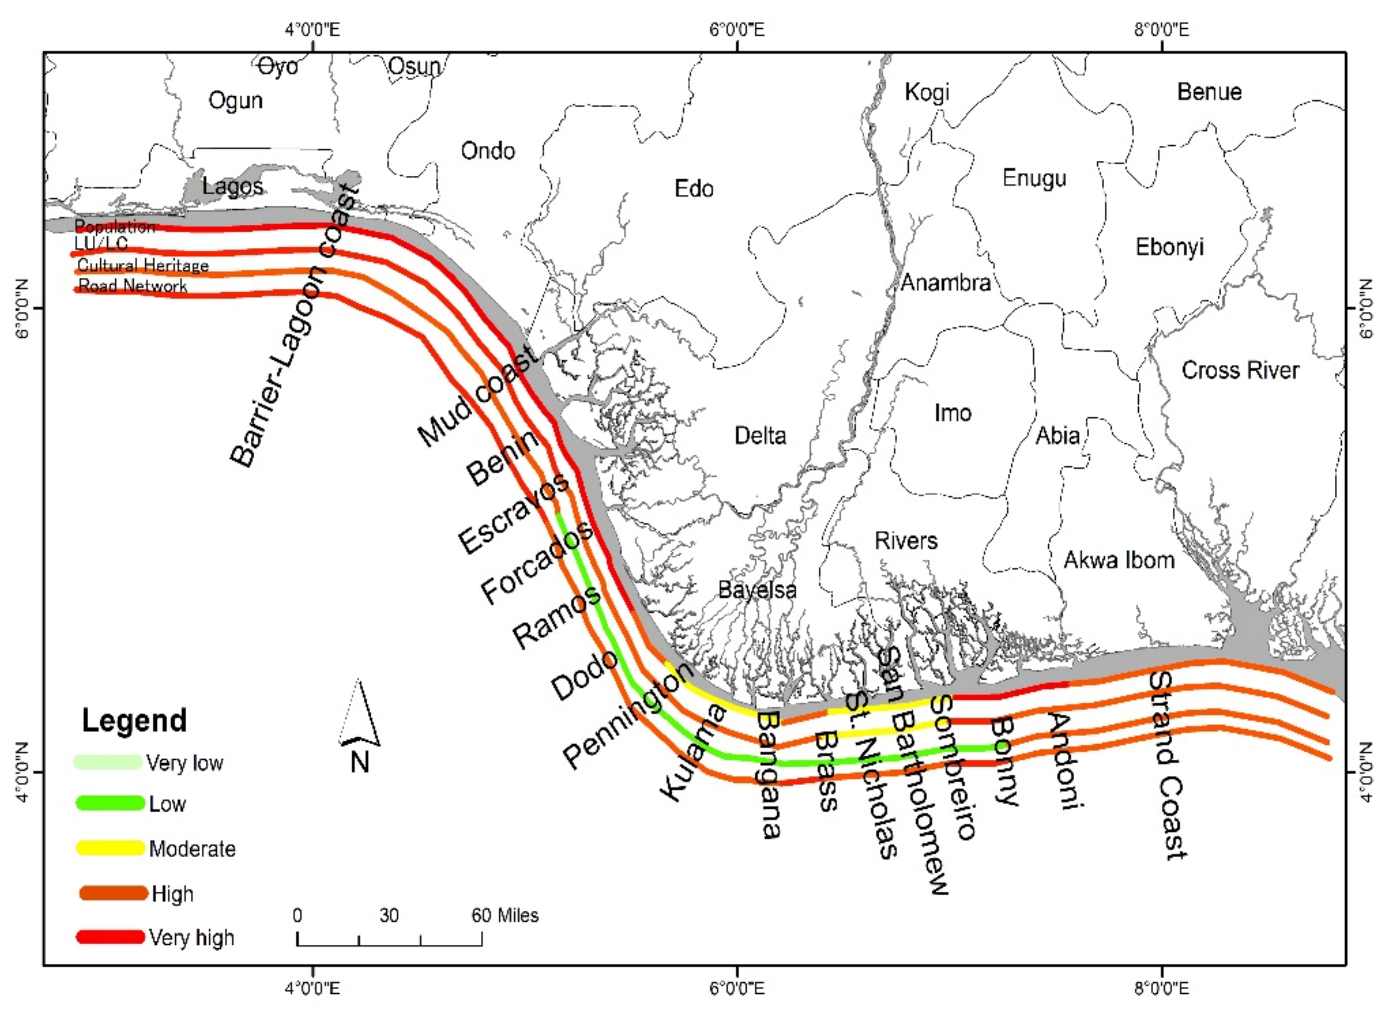
3.2. Socioeconomic Measures

3.2.1. Population

According to Worldometer, the population of Nigeria was 181 million in 2015. The estimated population of the Nigerians living along the Atlantic coastline is about 12% of the total population of the country [24]. This means that about 22 million people are estimated to live along the study area and adjoining regions. With about 22% of the Country’s population living in coastal areas, the Atlantic coastline in Nigeria is home to a significant number of inhabitants and many thriving economic activities [66,67].
An extensive stretch of sandy beaches, barrier islands, lagoons, estuaries, mud beaches, creeks and a deltaic ecosystem occupy the Nigerian coastline [67]. The core commercial activities include oil exploitation, shipping, telecommunications, defense, and tourism. Other economic activities of the region include fishing, textile production and agriculture. The coastal areas consist of low-lying sandy coast with a large expanse of scattered farmlands, mangrove swamp, riparian forest, palm plantation, wetlands, and constructed/developed areas. In this study, 5 vulnerability indexes were developed, considering the total population within the range 0.5–2.5 million inhabitants (Table 5) with a rank order as indicated: very low = 1, low = 2, moderate = 3, high = 4, and very high = 5. The Barrier–lagoon and Mud coasts, Ramos (SEG12) up to Benin (SEG16), Andoni (SEG2), Bonny (SEG3) are regions of the Atlantic coastline that are associated with very high vulnerabilities, whereas Brass (SEG7) and Dodo (SEG11) were categorized as segments with high vulnerabilities. All other segments were in the moderate vulnerability rankings (Figure 3).

3.2.2. Cultural Heritage (Tourist Locations)

The six coastal states in Nigeria are home to several ancient cultural sites found in multiple communities. Coastal destinations along the Nigerian Atlantic coastline offer recreational activities including fishing, sunbathing, swimming, boating and water sports. In Nigeria, coastal tourism is possible owing to the availability of unique sea–land interface that offers attractive tourism resources such as sandy beaches, water, scenic mangrove plantations, sacred waterways, holy forests, streams, rich cultural sites, recreational parks and historical sites including slave ports, sanctuaries and a range of cultural and spiritual events taking place along the coastal beaches. The vulnerability of rising sea levels and coastal flashfloods have the potentials to impact on coastal tourist locations [67,68].
In this study, there was a low to high vulnerability index ranking due to the impact associated with sea-level rise and inundation of cultural sites along the coastline, depending on the lack or existence of tourist attractions. However, to ensure consistency, there was low and very high vulnerability associated with the absence and presence of tourist locations on a scale of 1 – 5 (Table 5). The Strand, Mud and Barrier–lagoon coasts, Andoni (SEG2) and Benin (SEG15) have reasonable numbers of natural tourists’ spots and artificially constructed sites, and hence are associated with considerably high vulnerabilities (Figure 3). On the other hand, other segments particularly regions found within the Delta coast have relatively low presence of cultural heritage sites, and therefore are low vulnerable segments.

3.2.3. Land Use/Land Cover

Land use/cover change is regarded as the most important human-mediated environmental disruption in recent decades. Through their impact on biodiversity, carbon cycle, solar radiation and relative humidity budgets, greenhouse gas emissions, productivity, survivability, and a diverse variety of social, economic and ecological processes, land use and cover change coupled with soil pollution are influenced by the same set of physicochemical and implicit factors essential to ecological change and management [69,70,71]. The land use/cover changes of the coastline were evaluated from LandSat Imagery, a moderate spatial resolution (30 m) imagery which provides information about detailed human-scale land cover regions including cropland, plantations, cropland/pasture, agriculture with forest, primary forest, primary grassland, and non-vegetated/sparsely vegetated lands.
In this study, five classifications were used to rank the coastal vulnerability indexes, namely, very low (barren land), low (vegetated land or open uncultivated land), moderate (agriculture/fallow land), high (heavily cultivated land) and very high (urban/ecological reserved lands). The vegetation within the Delta coast segments (SEG2–SEG15) and parts of the Benin coastline is abundant and diverse, while mangrove forests are predominantly found along the coastline of the Cross River Estuary. Besides, the beach ridges in the Strand coasts are covered in lush rain forest shrubs and trees, while the creeks, estuaries and rivers are dominated by a mangrove swamp vegetation. The Barrier–lagoon, Mud coasts and the Benin segment have relatively developed, cultivated and urban lands, and very few forested areas. The high-density presence and proliferation of industrial activities along the Barrier–lagoon coast (SEG17) has resulted in the development of a large number of commercial structures, oil exploitation activities, human settlements, and constructed road networks. Therefore, the Barrier–lagoon and Mud coasts as well as the Benin area are associated with very high vulnerability ranking, while segments 7–14 have high vulnerability value (Figure 3).
On the other hand, the Strand coast (SEG1) and Delta coast (SEG2–14) indicated moderate to high vulnerabilities. In a similar report, [55] had noted drastic changes in land use and land cover along the Barrier–lagoon coastline. The report further highlighted the decline in vegetation especially coconut trees and mangroves along the coastline between 1984 and 2016, which were attributed to rapid industrialization and urbanization. Ref. [56] also reported a surge in anthropogenic practices that could have serious impacts on the geomorphology of Lagos coastline. According to the study, the built-up area along the Barrier–lagoon coast accounts for approximately 25.97% of the total coastal length. It was followed by dispersed cultivation, which accounts for approximately 20.09% of the total length of the coast. However, most of the existing dispersed cultivation, mangrove swamp, mine extraction sites and wetlands have been acquired for building construction purposes, including the planned Badagry Greenfield Port complex [56]. These land use/land cover changes are expected to put excessive pressure on coastal biodiversity, shoreline length, coastal slope and in general, result in the alterations of the coast morphological dynamics. Depending on the impact of rising tides and shoreline ocean currents, alterations in coastal geomorphological dynamics may increase the rate of coastal erosion and accretion.

3.2.4. Road Networks

The nearness of the coast to road networks and many other services could potentially influence the severity posed by coastal floods to the shorelines. In this assessment, major highway routes greater than 4 m wide were characterized from Google Earth and the severity of the potential risks to the coastlines were reported. The closest major roads with about 250 m of buffer zones were noted to have a very high vulnerability to natural hazards, climate impacts and rise in sea level. The least-particularly susceptible and low vulnerability scenarios were associated with buffer zones between 2 and 1.5 km, respectively. The barrier zones along the coastline were developed using the ArcGIS. In general, the coastal vulnerability index was ranked from very low, low, moderate, high to very high for buffer zones 2 km, 1.5 km, 1 km, 500 m and 250 m distance from the road networks, respectively.
A road network that is very near to the coastline is capable of being inundated easily, thereby posing serious dangers to the coastal population. This implies that in cases of flash floods, the inhabitants may find it difficult to evacuate, indicating a high vulnerability. On the other hand, the road network located away from the coastline is capable of not being easily inundated and may not pose serious dangers to the coastal population. In this study, the Barrier–lagoon coast (SEG17), Mud coast (SEG16) and Benin area (SEG15), Brass (SEG7) and Bonny (SEG3) are associated with a very high vulnerability, while other segments were classified as areas with a high vulnerability (Figure 3).

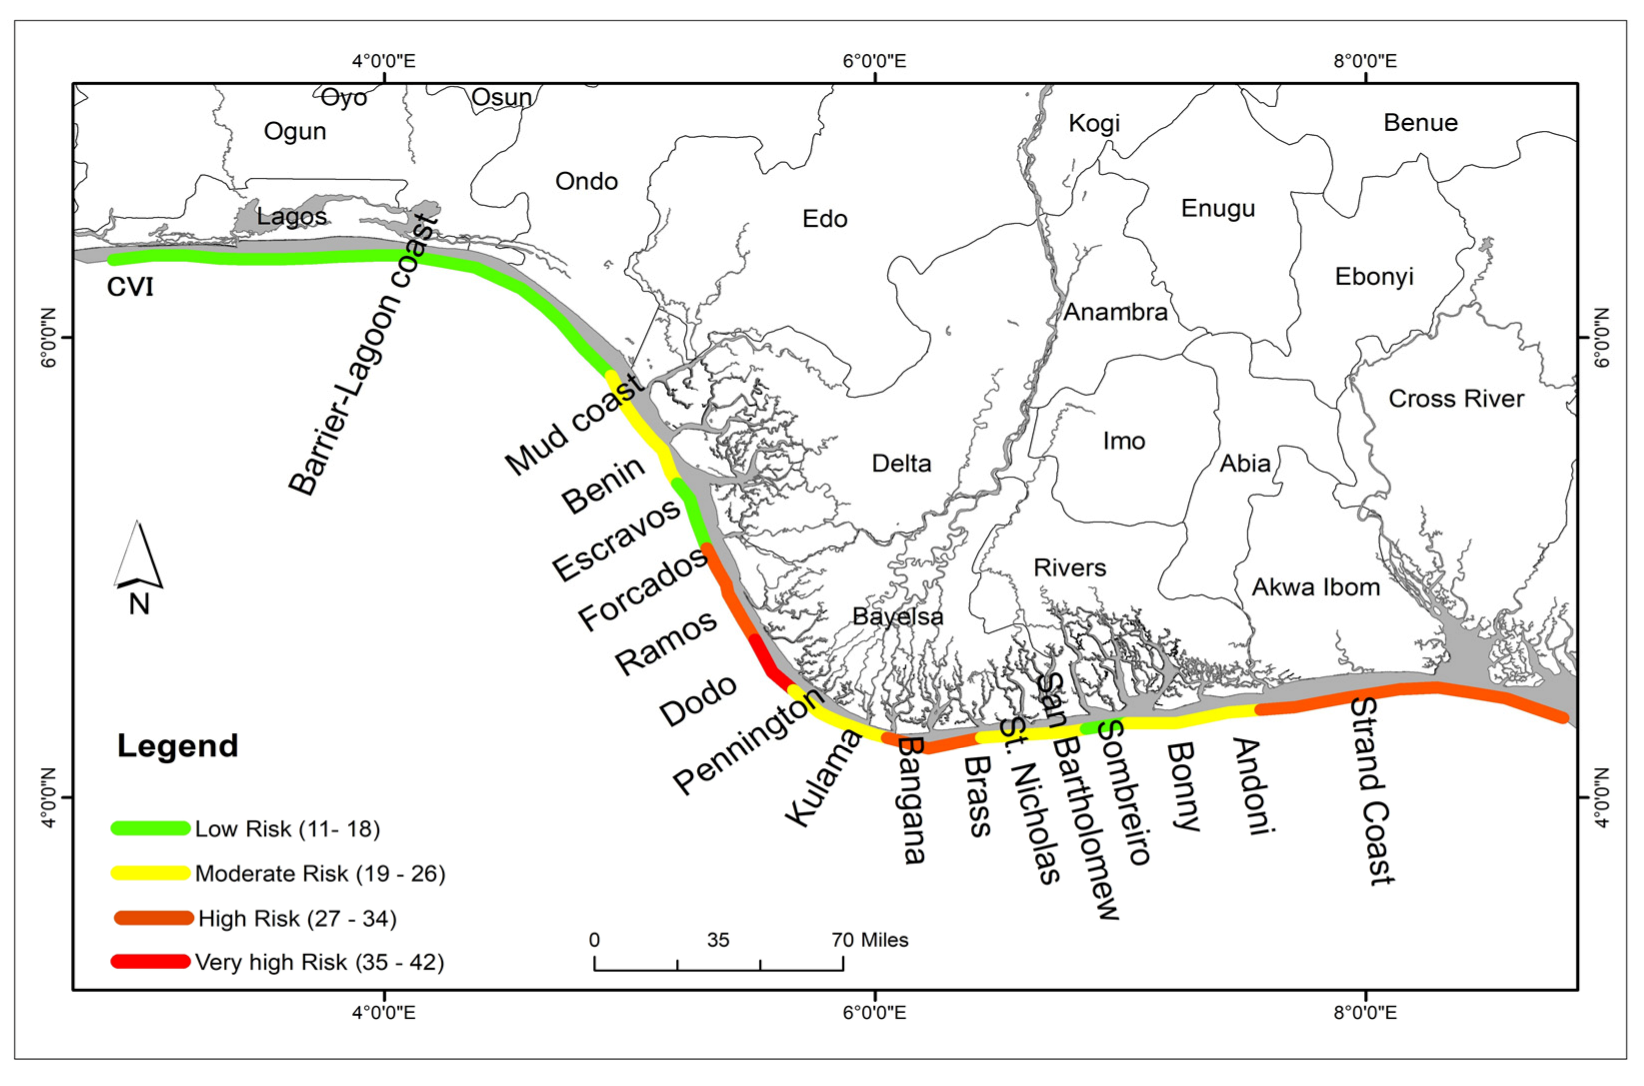
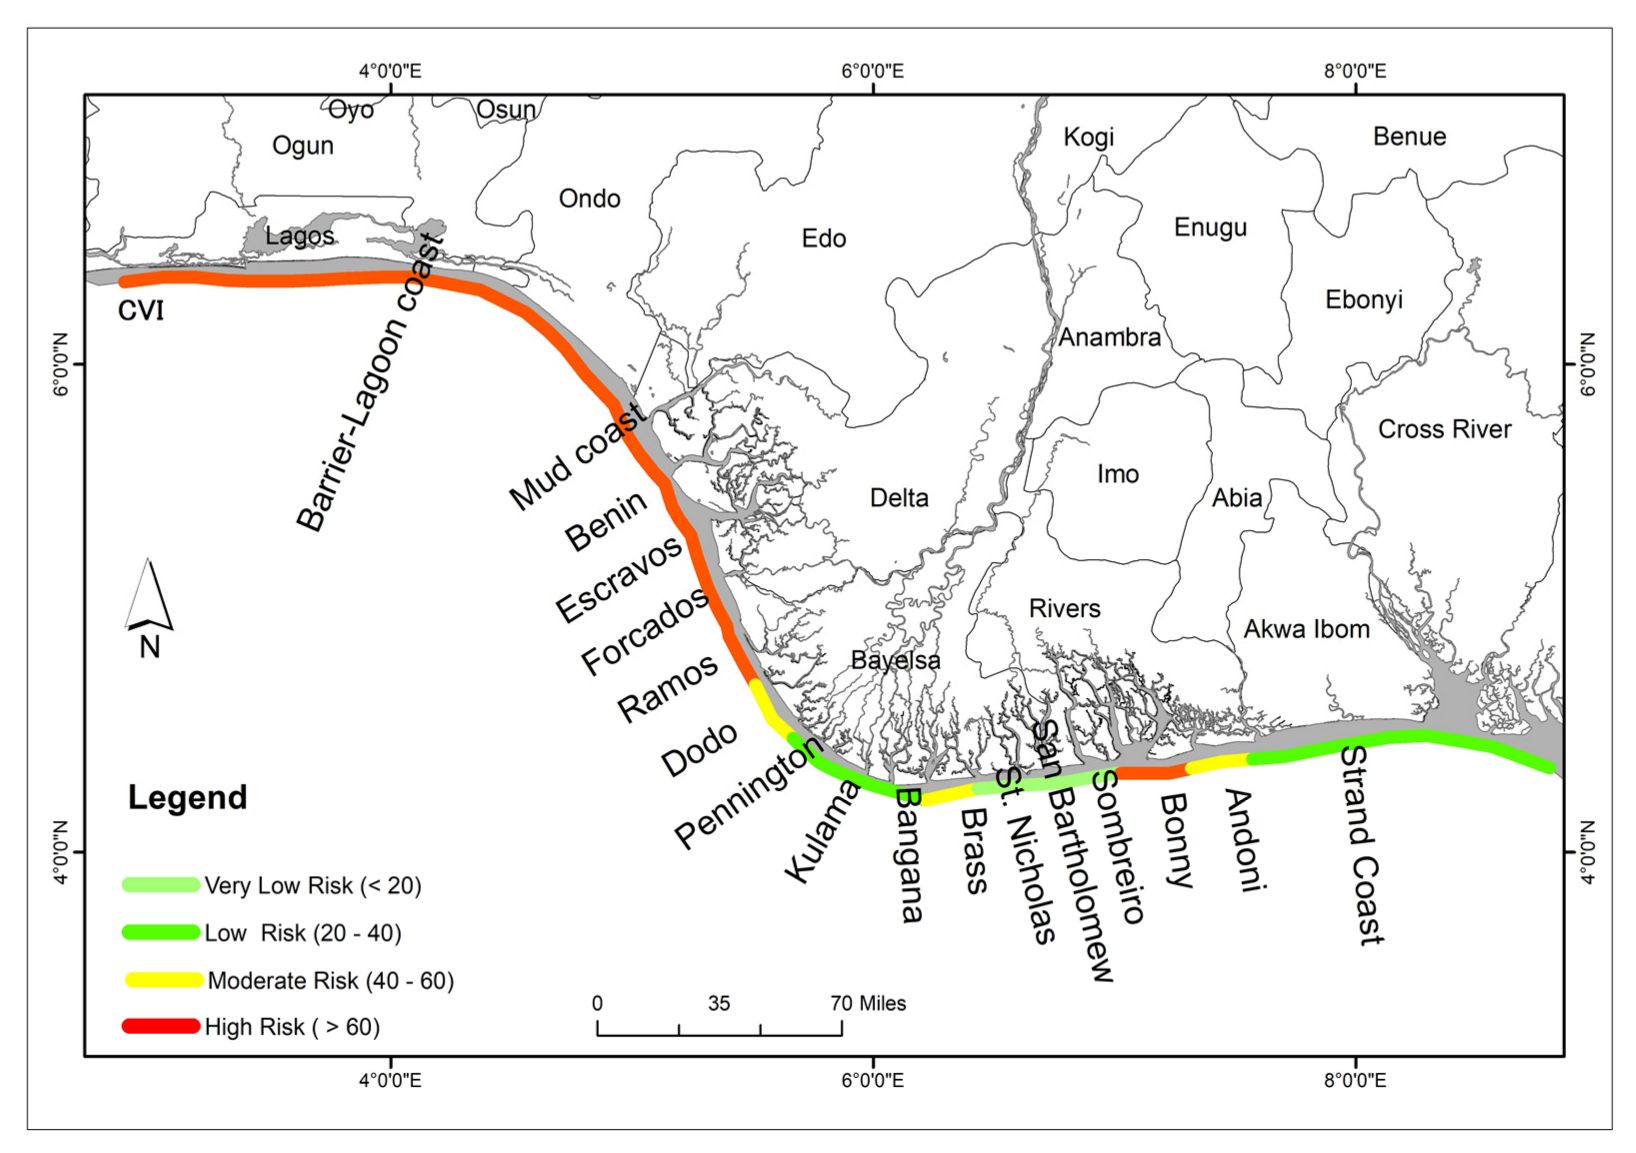
3.3. Evaluation of Calculated Coastal Vulnerability Indexes

In this study, two methods were used to compute and assess the coastal vulnerability along the Nigerian coastline. These methods provide a more accurate assessment of the coastal vulnerability since they take into account both the physical and socioeconomic variables, equitably. The physical and geomorphological measures are the causative variables that govern the intensity and scope of coastal extreme events, whilst the socioeconomic components characterize the associated environmental impacts. Based on Saaty method, the calculated CVI for the Nigerian coastline using physical and geomorphological variables and socioeconomic measures, the vulnerabilities ranged between 11 and 42, with the mean CVI value estimated as 23.60 (Table 5). Therefore, in this study, we divided the overall CVI value range (11 to 42) into four equal parts, each depicting a distinct vulnerability of the Nigerian coast to climate change induced sea-level rise [40]. The coastal vulnerability map for the Nigerian coastline is developed by categorizing the distinct 17 geographical segments into four vulnerability ranks, with the lower range of CVI values indicating low risk, followed by moderate risk, high risk, and lastly the upper range of values indicating a very high risk coastal vulnerability. The graphical representation of the derived vulnerability values and the CVI rankings is shown in Figure 4.
According to this ranking, 6% of the coastline is characterized under very high vulnerability, 29% as high vulnerability, 41% as moderate vulnerability, and 24% as low vulnerability. Based on these categorizations, it means that an aggregated 65% of the 853 km long of Nigerian coastline stretching from the farthest eastern Strand coast to the Mahin transgressive mud coast through the Arcuate Delta coast are under moderate to high risk. On the other hand, the Barrier–lagoon coast is characterized as a low vulnerability segment. A more significant part of this mesotidal coastal stretch is dotted with low-lying gentle slopes with intertwined mud coast, mangrove swamp, creeks, rivers, mudflats, coastal plain, narrower sand beaches, flood plain, and estuaries. Most segments of the coastline are presently experiencing worsening coastal erosion exacerbated by anthropogenic stressors such as industrialization, oil exploration and exploitation activities, urbanization and land reclamation, harbor development, construction of coastal defense, and sand mining. Furthermore, these segments are known to be a high energy coastline with a low mean tidal range of 1.1 m and might potentially be subjected to continuous flooding and coastal erosion, resulting in an accelerated rise in sea level in the future years. Based on the recent IPCC Climate Report’s projection of a 1.0 m rise in sea level [72], the coastline and adjacent lands with the built environment covering approximately 606 km2 would be prone to severe coastal erosion and flooding, resulting in inundation of farmlands and residences and displacement of coastal dwelling fishing communities. Given that some coastline segments feature highly vulnerable coastal slopes, there is a high probability that enhanced severe storms will impact a more expansive area away from the coastline than is currently the case due to the projected extreme rise in sea level.
Additionally, the Gornitz CVI method’s estimation approach was also considered using the calculated physical and geomorphological variables (PVI) and socioeconomic (SoVI) indexes based on the relative weight of each variable following the AHP protocol [25,28], as presented in Table 6 and Table 7.
The calculated measures ranged between 3.51–4.77 and 3.08–5.00 for PVI and SoVI, respectively. However, the aggregated coastal vulnerability index computed using this approach ranged from 3.29 (SEG4) to 4.70 (SEG14) (Figure 5). Furthermore, the CVI values were categorized into percentiles as proposed by Doukakis [73]. The vulnerability ranks were as follows: 1 (very low risk) for values less than the 20th percentile, 2 (low risk) for values between the 20th and 40th percentiles, 3 (moderate risk) for values between the 40th and 60th percentiles, and 4 (high risk) for values greater than the 60th percentile. According to this method, significant segments (59%) of the Nigerian coastline from the Strand coast to the Barrier–lagoon coastal complex, through the Mahin transgressive mud coast, and arcuate Delta are characterized as under moderate to high vulnerability (Figure 5). More so, based on this categorization, 41% of the shoreline is under the high vulnerability, 18% of the coastline is under moderate vulnerability, 23% as low vulnerability, and 18% as very low vulnerability. Given this risk classification, a large part of the Nigerian coastline might see continual flooding and saltwater intrusion of freshwater ecosystems and agricultural farmlands in the coming years due to an accelerated rise in sea level. This might result in the submergence of natural vegetation and communal dwellings, causing economic losses and forced migration of coastal fishing populations.
In summary, the methodological approaches used in this work to estimate coastal vulnerability are simple, transparent, structured, and reliable, allowing for the breakdown of the analytical processes into hierarchical units and levels. The structured approach included developing an index-based weighting method using well-defined socioeconomic, physical and geomorphological measures, assigning vulnerability scores to coastal segments in relation to input variables, and deriving the overall score of the coastal vulnerability index for each segment using both the vulnerability score related to input variables and associated weights. Moreover, the CVI approaches used in this study indicated how vulnerable the coastal populations are to both physical–geomorphological and socioeconomic stressors when both are considered simultaneously. Besides, the weighted average for the PVI and SoVI received equal weights since we looked at the overall impacts of climate change on the region’s coastal zones in relation to population and other socioeconomic considerations. The advantage of calculating the CVI through both approaches is that the methods allow for practical extrapolation of both indexes beyond the specified interval. Although both approaches offer comparable vulnerability assessments, the findings contribute significantly to identifying vulnerable segments of the Nigerian coastline, offering a unique data and information map for decision-makers responsible for coastal management and planning in areas vulnerable to sea-level rise.

4. Conclusions

Climate change and its accompanying effects, including rising sea levels, flooding, changing precipitation patterns, and increased storm intensity in coastal areas, demand immediate attention owing to the environmental threats they pose. This study presents a comprehensive coastal vulnerability assessment that will assist environmental managers in identifying the vulnerable segments of the investigated coastlines to aid in planning and decision making aimed at mitigating the impacts associated with climate change. The vulnerability of the Nigerian coastline was assessed using the analytical hierarchical process (AHP) that comprises the analyses of geomorphological, physical and socioeconomic metrics. The inclusion of socioeconomic parameter is important because these parameters are associated with humans, land use, transportation and cultural heritage; thus, it can prove to be essential in terms of the reaction of a particular segment to a natural disaster. The following conclusions were drawn from this study:
(a)
Coastal slope changes revealed that 65% of the coastline was ranked as moderate to highly vulnerable, whereas the Barrier–lagoon, Mud, and Benin coasts were rated as potentially low to very low vulnerability.
(b)
In terms of coastal geomorphology, the Barrier–lagoon and Mud coasts segments are moderately vulnerable to climate change impacts due to the predominance of lagoons, peninsulas, sand beaches, and estuaries along these coasts. Additionally, the Delta and Strand coasts are projected to be highly vulnerable to climate impacts.
(c)
Over the last few years, shoreline changes have revealed significant coastal accretion and erosion, exacerbated by anthropogenic activities. The intensive erosion processes and predominant accretion patterns observed could be linked to localized near-shore bathymetry, wave-current velocity, and tidal wave height. The coastline segments are susceptible to very high to moderate vulnerability.
(d)
The Barrier, Mud, Delta, and Strand coasts might be inundated and eroded by ocean water due to receding shoreline with rising sea level. The results of the assessment showed that the coastline is currently very vulnerable to sea-level rise and an accelerated increase in sea level in the coming years could lead to coastal erosion and an inundation of farmlands and residences, which could result to socioeconomic issues such as food crises, increased rural to urban migration, increased rate of diseases and poverty.
However, in order to avoid the consequences of anticipated coastline changes in view of the calculated vulnerabilities, especially accelerated rise in sea level, we recommend that proper strategies be put in place by relevant agencies to ensure preparedness to tackle the challenges. These strategies could include soft or hard protection measures. For instance, important infrastructure could be protected using multi-tiered terrace such as construction of canals and channels, seawalls, and dikes to protect houses and infrastructure. Effective measures also include preservation of wetlands as green buffer zones in the retreat of coastal development and the building of parks that can accommodate inundation. Other options include up-leveling the ground for new development and phased relocation of existing development. Lastly, the entire Nigerian coastline should be monitored regularly, and vulnerable coastal zones should be identified and evaluated for interventions.

Author Contributions

Conceptualization, M.O.O., A.B.W., G.O.O. and N.U.B.; data curation, M.O.O. and N.U.B.; formal analysis, N.U.B. and G.O.O.; investigation, M.O.O.; methodology, M.O.O., A.B.W. and N.U.B.; supervision, A.B.W. and N.U.B., visualization, G.O.O.; writing—original draft, M.O.O., A.B.W. and N.U.B.; writing—review and editing, M.O.O., A.B.W., G.O.O. and N.U.B. All authors have read and agreed to the published version of the manuscript.

Funding

The authors appreciate the Covenant University Centre for Research, Innovation and Discovery (CUCRID) for providing funding for the publication of this paper.

Institutional Review Board Statement

Not applicable.

Informed Consent Statement

Not applicable.

Data Availability Statement

The data presented in this study are available on request from the corresponding author. The data are not publicly available due to privacy restrictions.

Acknowledgments

The authors would like to express their gratitude to the reviewers and editor for their insightful comments and suggestions. The authors are grateful to staffers at the Nigerian Institute for Oceanography and Marine Research for providing the data for this work.

Conflicts of Interest

The authors declare no conflict of interest.

References

  1. Mahapatra, M.; Ratheesh, R.; Rajawat, A.S. Sea level rise and coastal vulnerability assessment: A review. Int. J. Geol. Earth Environ. Sci. 2013, 3, 67–80. [Google Scholar]
  2. He, Q.; Silliman, B.R. Climate Change, Human Impacts, and Coastal Ecosystems in the Anthropocene. Curr. Biol. 2019, 29, R1021–R1035. [Google Scholar] [CrossRef] [PubMed]
  3. Neumann, B.; Vafeidis, A.T.; Zimmermann, J.; Nicholls, R.J. Future coastal population growth and exposure to sea-level rise and coastal flooding—A global assessment. PLoS ONE 2015, 10, e0118571. [Google Scholar] [CrossRef] [Green Version]
  4. Pramanik, M.K.; Biswas, S.S.; Mondal, B.; Pal, R. Coastal vulnerability assessment of the predicted sea level rise in the coastal zone of Krishna–Godavari delta region, Andhra Pradesh, east coast of India. Environ. Dev. Sustain. 2016, 18, 1635–1655. [Google Scholar] [CrossRef]
  5. Barragán, J.M.; de Andrés, M. Analysis and trends of the world’s coastal cities and agglomerations. Ocean Coast. Manag. 2015, 114, 11–20. [Google Scholar] [CrossRef]
  6. United States Agency for International Development. Adapting to Coastal Climate Change: A Guidebook for Development Planners; United States Agency for International Development: Washington, DC, USA, 2009. Available online: http://www.usaid.gov/our_work/environment/climate/policies_prog/vulnerability.html (accessed on 29 December 2018).
  7. Mujabar, P.S.; Chandrasekar, N. Coastal erosion hazard and vulnerability assessment for southern coastal Tamil Nadu of India by using remote sensing and GIS. Nat. Hazards 2011, 69, 1295–1314. [Google Scholar] [CrossRef]
  8. Rani, N.N.V.S.; Satyanarayana, A.N.V.; Bhaskaran, P.K. Coastal vulnerability assessment studies over India: A review. Nat. Hazards 2015, 77, 405–428. [Google Scholar] [CrossRef]
  9. Kantamaneni, K.; Rani, N.S.; Rice, L.; Sur, K.; Thayaparan, M.; Kulatunga, U.; Rege, R.; Yenneti, K.; Campos, L.C. A Systematic Review of Coastal Vulnerability Assessment Studies along Andhra Pradesh, India: A Critical Evaluation of Data Gathering, Risk Levels and Mitigation Strategies. Water 2019, 11, 393. [Google Scholar] [CrossRef] [Green Version]
  10. Carrasco, A.; Ferreira, O.; Roelvink, D. Coastal lagoons and rising sea level: A review. Earth-Sci. Rev. 2016, 154, 356–368. [Google Scholar] [CrossRef] [Green Version]
  11. Nguyen, T.T.; Bonetti, J.; Rogers, K.; Woodroffe, C.D. Indicator-based assessment of climate-change impacts on coasts: A review of concepts, methodological approaches and vulnerability indices. Ocean Coast. Manag. 2016, 123, 18–43. [Google Scholar] [CrossRef] [Green Version]
  12. Bevacqua, A.; Yu, D.; Zhang, Y. Coastal vulnerability: Evolving concepts in understanding vulnerable people and places. Environ. Sci. Policy 2018, 82, 19–29. [Google Scholar] [CrossRef]
  13. Wang, S.; Wang, W.; Ji, M.; Chen, W.; Xu, S. Assessment of vulnerability to sea-level rise for China’s Coast. In Proceedings of the 2013 21st International Conference on Geoinformatics, Kaifeng, China, 20–22 June 2013; pp. 1–6. [Google Scholar] [CrossRef]
  14. Danladi, I.B.; Kore, B.M.; Gül, M. Vulnerability of the Nigerian coast: An insight into sea level rise owing to climate change and anthropogenic activities. J. Afr. Earth Sci. 2017, 134, 493–503. [Google Scholar] [CrossRef]
  15. Benson, N.U.; Fred-Ahmadu, O.H. Occurrence and distribution of microplastics-sorbed phthalic acid esters (PAEs) in coastal psammitic sediments of tropical Atlantic Ocean, Gulf of Guinea. Sci. Total Environ. 2020, 730, 139013. [Google Scholar] [CrossRef] [PubMed]
  16. IPCC. Climate Change 2013—The Physical Science Basis. Climate Change 2014: Synthesis Report. Contribution of Working Groups I, II and III to the Fifth Assessment Report of the Intergovernmental Panel on Climate Change; Sydowed, I., Ed.; Intergovernmental Panel on Climate Change: Geneva, Switzerland; Cambridge University Press: Cambridge, UK, 2014. [Google Scholar]
  17. Oloyede, M.O.; Benson, N.U.; Williams, A.B. Climate change and coastal vulnerability assessment methods: A review. IOP Conf. Series Earth Environ. Sci. 2021, 665, 012069. [Google Scholar] [CrossRef]
  18. Musa, Z.N.; Popescu, I.; Mynett, A. The Niger Delta’s vulnerability to river floods due to sea level rise. Nat. Hazards Earth Syst. Sci. 2014, 14, 3317–3329. [Google Scholar] [CrossRef] [Green Version]
  19. Ogoro, M.; Oyegun, C.U.; Lawal, O. Vulnerability of coastal communities in Niger Delta region to sea level rise. Quest J. Res. Environ. Earth Sci. 2016, 2, 1–8. [Google Scholar]
  20. Ojile, M.O.; Koulibaly, C.T.; Ibe, C. Comparative analysis of vulnerabilities of selected coastal communities and populations to climate change impacts and adaptation strategies in Nigeria and Senegal. In Proceedings of the IAIA17 Conference, 37th Annual Conference of the International Association for Impact Assessment, Montréal, QC, Canada, 4–7 April 2017. [Google Scholar]
  21. Oloyede, M.O.; Williams, A.B.; Benson, N.U. Simulated sea-level rise under future climate scenarios for the Atlantic Barrier-lagoon coast of Nigeria using SimCLIM. IOP Conf. Series Earth Environ. Sci. 2021, 665, 012068. [Google Scholar] [CrossRef]
  22. Fadahunsi, O.; Pe’eri, S.; Armstrong, A. Characterisation of the Nigerian Shoreline. Available online: https://www.hydrointernational.com/content/article/characterisation-of-the-Nigerian-shoreline (accessed on 21 September 2020).
  23. Adeaga, O. Morphology analysis of Niger Delta shoreline and estuaries for eco-tourism potentials. In The Land/Ocean Interactions in the Coastal Zone of West and Central Africa; Diop, S., Barusseau, J., Descamps, C., Eds.; Springer: Berlin/Heidelberg, Germany, 2014; pp. 108–118. [Google Scholar]
  24. French, G.T.; Awosika, L.F.; Ibe, C.E. Sea-level rise and Nigeria: Potential impacts and consequences. J. Coast. Res. 1995, 14, 224–242. [Google Scholar]
  25. Rajasree, B.R.; Deo, M.C. Assessment of Coastal Vulnerability Considering the Future Climate: A Case Study along the Central West Coast of India. J. Waterw. Port Coast. Ocean Eng. 2020, 146, 5019005. [Google Scholar] [CrossRef]
  26. Feindouno, S.; Guillaumont, P.; Simonet, C. The Physical Vulnerability to Climate Change Index: An Index to Be Used for International Policy. Ecol. Econ. 2020, 176, 106752. [Google Scholar] [CrossRef]
  27. Gornitz, V.; Daniels, R.C.; White, T.W.; Birdwell, K.R. The development of a coastal risk assessment database: Vulnerability to sea-level rise in the US Southeast. J. Coast. Res. 1994, 12, 327–338. [Google Scholar]
  28. Thieler, E.R.; Hammar-Klose, E.S. National Assessment of Coastal Vulnerability to Sea-Level Rise; U.S. Geological Survey Open-File Report 99-593; U.S. Geological Survey: Woods Hole, MA, USA, 1999.
  29. Gornitz, V. Global coastal hazards from future sea level rise. Palaeogeogr. Palaeoclim. Palaeoecol. 1991, 89, 379–398. [Google Scholar] [CrossRef]
  30. Cutter, S.; Ash, K.; Emrich, C.T. The geographies of community disaster resilience. Glob. Environ. Chang. 2014, 29, 65–77. [Google Scholar] [CrossRef]
  31. Saaty, T.L. A scaling method for priorities in hierarchical structures. J. Math. Psychol. 1977, 15, 234–281. [Google Scholar] [CrossRef]
  32. Elkhateeb, W.A.; Zaghlol, G.M.; El-Garawani, I.M.; Ahmed, E.F.; Rateb, M.E.; Abdel Moneim, A.E. Ganoderma applanatum secondary metabolites induced apoptosis through different pathways: In vivo and in vitro anticancer studies. Biomed. Pharmacother. 2018, 101, 264–277. [Google Scholar] [CrossRef] [Green Version]
  33. Chang, H.-K.; Liou, J.-C.; Chen, W.-W. Protection Priority in the Coastal Environment Using a Hybrid AHP-TOPSIS Method on the Miaoli Coast, Taiwan. J. Coast. Res. 2012, 280, 369–374. [Google Scholar] [CrossRef]
  34. Ju, C.Y.; Jia, Y.G.; Shan, H.X.; Tang, C.W.; Ma, W.J. GIS-based coastal area suitability assessment of geo-environmental factors in Laoshan district, Qingdao. Nat. Hazards Earth Syst. Sci. 2012, 12, 143–150. [Google Scholar] [CrossRef] [Green Version]
  35. Yin, J.; Yin, Z.; Wang, J.; Xu, S. National assessment of coastal vulnerability to sea-level rise for the Chinese coast. J. Coast. Conserv. 2012, 16, 123–133. [Google Scholar] [CrossRef]
  36. Gornitz, V.M.; White, T.W.; Cushman, R.M. Vulnerability of the U.S to Future Sea Level Rise; Rep. No. CONF-910780-1; Oak Ridge National Laboratory: Oak Ridge, TN, USA, 1991.
  37. Dinh, Q.; Balica, S.; Popescu, I.; Jonoski, A. Climate change impact on flood hazard, vulnerability and risk of the Long Xuyen Quadrangle in the Mekong Delta. Int. J. River Basin Manag. 2012, 10, 103–120. [Google Scholar] [CrossRef]
  38. Cutter, S.L.; Barnes, L.; Berry, M.; Burton, C.; Evans, E.; Tate, E.; Webb, J. A place-based model for understanding community resilience to natural disasters. Glob. Environ. Chang. 2008, 18, 598–606. [Google Scholar] [CrossRef]
  39. Birkmann, J. Risk and vulnerability indicators at different scales: Applicability, usefulness and policy implications. Environ. Hazards 2007, 7, 20–31. [Google Scholar] [CrossRef]
  40. Diez, P.G.; Perillo, G.M.E.; Piccolo, M.C. Vulnerability to Sea-Level Rise on the Coast of the Buenos Aires Province. J. Coast. Res. 2007, 231, 119–126. [Google Scholar] [CrossRef]
  41. Rao, Y.R.; Hawley, N.; Charlton, M.N.; Schertzer, W.M. Physical processes and hypoxia in the central basin of Lake Erie. Limnol. Oceanogr. 2008, 53, 2007–2020. [Google Scholar] [CrossRef] [Green Version]
  42. Athanasiou, P.; van Dongeren, A.; Giardino, A.; Vousdoukas, M.; Gaytan-Aguilar, S.; Ranasinghe, R. Global distribution of nearshore slopes with implications for coastal retreat. Earth Syst. Sci. Data 2019, 11, 1515–1529. [Google Scholar] [CrossRef] [Green Version]
  43. Thieler, E.R. National Assessment of Coastal Vulnerability to Future Sea-Level Rise. 2000. Available online: https://www.usgs.gov/centers/whcmsc/science/national-assessment-coastal-vulnerability-sea-level-rise (accessed on 23 October 2021).
  44. Ibe, A.C. Nigeria. In Artificial Structures and Shorelines; Walker, H.F., Ed.; Kluwer Academic Publishers: Dordrecht, The Netherlands, 1988; pp. 287–294. [Google Scholar]
  45. Kumar, T.S.; Mahendra, R.S.; Nayak, S.; Radhakrishnan, K.; Sahu, K.C. Coastal Vulnerability Assessment for Orissa State, East Coast of India. J. Coast. Res. 2010, 263, 523–534. [Google Scholar] [CrossRef]
  46. Badru, G.; Odunuga, S.; Omojola, A.; Oladipo, E. Shoreline change analysis in parts of the Barrier-lagoon and Mud sections of Nigeria coast. J. Extreme Events 2017, 4, 1850004. [Google Scholar] [CrossRef]
  47. Zabbey, N.; Giadom, F.D.; Babatunde, B.B. Nigerian Coastal Environments. In World Seas: An Environmental Evaluation, 2nd ed.; Sheppard, C., Ed.; Academic Press: London, UK, 2018; pp. 835–854. [Google Scholar] [CrossRef]
  48. Benson, N.U. National Priorities for Implementing Adaptation to Climate in Nigeria. IOC-UNESCO Workshop Series for Adaptation to Climate Change in Africa; IOC-UNESCO: Paris, France, 2010; p. 20. [Google Scholar]
  49. Awosika, L.F.; Folorunsho, R. Climate change and impact on the coastal environment of Nigeria. In Sustainable Environmental Management in Nigeria; Ivbijaro, M.F., Akintola, F., Okechukwu, R.U., Eds.; Mattivi Production: Ibadan, Nigeria, 2006; p. 465. [Google Scholar]
  50. Dolan, R.; Fenster, M.S.; Holme, S.J. Temporal Analysis of Shoreline Recession and Accretion. J. Coast. Res. 1991, 7, 723–744. [Google Scholar]
  51. Mani Murali, M.R.; Ankita, M.; Vethamony, P. A new insight to vulnerability of Central Odisha coast, India using analytical hierarchical process (AHP) based approach. J. Coast. Conserv. 2018, 22, 799–819. [Google Scholar] [CrossRef]
  52. Abuodha, P.; Woodroffe, C.D. Assessing vulnerability of coasts to climate change: A review of approaches and their application to the Australian coast. In GIS for the Coastal Zone: A Selection of Papers from Coast GIS 2006; Bruce, E., Puotinen, M., Furness, R.A., Eds.; Australian National Centre for Ocean Resources and Security University of Wollongong: Wollongong, Australia, 2006; p. 458. [Google Scholar]
  53. Boak, E.H.; Turner, I. Shoreline Definition and Detection: A Review. J. Coast. Res. 2005, 214, 688–703. [Google Scholar] [CrossRef] [Green Version]
  54. Ibe, A.C.; Antia, E. Preliminary Assessment of the Impact of Erosion along the Nigerian Shoreline. 1983. Available online: https://aquadocs.org/handle/1834/1206 (accessed on 23 October 2021).
  55. Akinluyi, F.O.; Adebola, A.O.; Adeseko, A.A. Assessment of Shoreline and Associated Landuse/Land cover Changes along Part of Lagos Coastline, Nigeria. Contemp. Trends Geosci. 2018, 7, 59–70. [Google Scholar] [CrossRef]
  56. Odunuga, S.; Ajijola, A.; Patience, A.; Delima, T.; Akpan, A. Geomorphic mapping and human activities along the southwestern Nigeria coastline. In Proceedings of the HP1, IAHS-IAPSO-IASPEI Assembly, Gothenburg, Sweden, 1 July 2013; IAHS Publ.: Gothenburg, Sweden, 2013; p. 358. [Google Scholar]
  57. Awosika, L.F.; Ibe, C.E.; Adekoya, A.; Balogun, A. Monitoring of the 1990/91 Beach Replenishment Project at the Bar Beach, Lagos; Federal Ministry of Works and Housing: Lagos, Nigeria, 1991.
  58. Unnikrishnan, A.; Shankar, D. Are sea-level-rise trends along the coasts of the north Indian Ocean consistent with global estimates? Glob. Planet. Chang. 2007, 57, 301–307. [Google Scholar] [CrossRef]
  59. IPCC. Summary for Policymakers. In Climate Change: The Physical Science Basis; Solomon, S., Qin, D., Manning, M., Chen, Z., Marquis, M., Averyt, K.B., Tignor, M., Miller, H.L., Eds.; Contribution of Working Group I to the Fourth Assessment Report of the Intergovernmental Panel on Climate Change; Cambridge University Press: New York, NY, USA, 2007; p. 996. [Google Scholar]
  60. Benson, N. Climate change, effects. In Encyclopedia of Global Warming and Climate Change; Philander, S., Ed.; SAGE Publications, Inc.: Thousand Oaks, CA, USA, 2008; pp. 210–215. [Google Scholar]
  61. Benson, N. Global warming. In Encyclopedia of Global Warming and Climate Change; Philander, S., Ed.; SAGE Publications, Inc.: Thousand Oaks, CA, USA, 2008; pp. 457–461. [Google Scholar]
  62. Woodworth, P.L.; Player, R. The permanent service for mean sea level: An update to the 21st century. J. Coast. Res. 2003, 19, 287–295. [Google Scholar]
  63. Popoola, O.O. Vulnerability of the Nigerian coast to Inundation consequent on sea level rise. J. Eng. Environ. Stud. 2015, 5, 25–38. [Google Scholar]
  64. Badru, G.; Odunuga, S.; Amaeshi, L.L.N. Vulnerability to sea level rise of Badagry coastline, Lagos, Nigeria. Adv. Sci. Technol. 2012, 6, 91–106. [Google Scholar]
  65. Penland, S.; Connor, P.F.; Beall, A.; Fearnley, S.; Williams, S.J. Changes in Louisiana’s shoreline: 1855–2002. J. Coast. Res. 2005, 44, S3–S7. [Google Scholar]
  66. Centre for Environment and Development in Africa. Coastal Profile of Nigeria. In Federal Environmental Protection Agency; Center for Environment and Development in Africa: Abuja, Nigeria, 1997. [Google Scholar]
  67. Obinwanne, C.O.; Okpoko, P.U. Comparative assessment of coastal tourism potentials of selected areas in Rivers State, Nigeria. Int. J. Sci. Technol. Res. 2015, 4, 262–269. [Google Scholar]
  68. Markovic, M.; Salta, A.; Skkaricie, Z.; Trumbric, I. Sustainable Coastal Tourism: An intergrated Planning and Management Approach; United Nation Environmental Programme (UNEP): Milan, France, 2009. [Google Scholar]
  69. Ademiluyi, I.A.; Okude, A.S.; Akanni, C.O. An appraisal of land use and landcover mapping in Nigeria. Afr. J. Agric. Res. 2008, 3, 581–586. [Google Scholar]
  70. Fasona, M.J.; Omojola, A.S. Climate Change, Human Security and Communal Clashes in Nigeria. In Proceedings of the International Workshop on Human Security and Climate Change, Asker, Norway, 21–23 June 2007. [Google Scholar]
  71. Verburg, P.H.; Veldkamp, W.S.A.; Espaldon, R.L.V.; Mastura, S.S.A. Modeling the spatial dynamics of regional landuse: The CLUE-S Model. Environ. Manag. 2002, 30, 301–405. [Google Scholar] [CrossRef]
  72. IPCC. Intergovernmental Panel on Climate Change (IPCC) Report. 2021. Available online: https://www.ipcc.ch/2021/08/09/ar6-wg1-20210809-pr/ (accessed on 10 December 2021).
  73. Doukakis, E. Coastal vulnerability and risk parameters. Eur. Water 2005, 11, 3–7. [Google Scholar]
Figure 1. Map of the Nigerian coastline showing the investigated segments.
Sustainability 14 02097 g001
Figure 2. Graphical representation of vulnerability rankings for physical and geomorphological measures along the Atlantic coastline.
Sustainability 14 02097 g002
Figure 3. Graphical representation of vulnerability for socioeconomic measures along the Atlantic coastline.
Sustainability 14 02097 g003
Figure 4. Graphical representation of coastal vulnerability index rankings.
Sustainability 14 02097 g004
Figure 5. Coastal vulnerability index map.
Sustainability 14 02097 g005
Table 1. Coastal vulnerability rankings.
Coastal Vulnerability Index
Type of ParameterVariableVery Low = 1Low = 2Moderate = 3High = 4Very High = 5
Socioeconomic measuresPopulation (Million)500,000 T
< 1
1–1.5 1.5–2.0 2–2.5 >2.5
Land use/land coverBarren land Vegetated land or open uncultivated landAgriculture/fallow landHeavily cultivated landUrban/ecological reserved lands
Road network (distance from shoreline)2 km buffer1.5 km buffer1 km buffer500 m buffer250 m buffer
Cultural heritage (tourist locations)N/AAbsent N/APresentN/A
Physical and geomorphological measuresCoastal slope (%)>1.00.8–0.6 0.6–0.4 0.4–0.2 <0.2
Coastal geomorphologyRocky coastIndented coast/Medium cliffDunes/estuaries/creeks/
lagoons/ponds
Mangroves, Coarse unconsolidated mudflats, coarse sandflatsDelta, floodplains, barrier beaches, Fine unconsolidated psammitic sediment, mudflats.
Shoreline change rate (m/year)>2.01.0–2.0 −1.0 and 1.0 −1.0 and −2.0 <−2.0
Bathymetry (elevation) (m)>6.06.0–5.05.0–4.04.0–3.0<2.0
Wave height (m)<0.60.6–1.2 1.2–1.8 1.8–2.4>2.4
Sea level rise (mm/year)<0.80.8–1.6 1.6–2.4 2.4–3.2 >3.2
Mean tidal range>4.03.0–4.02.0–3.01.0–2.0<1.0
Table 2. Sources of socioeconomic, physical and geomorphological data used.
Socioeconomic Measures
ParameterSourceDuration
PopulationWorldometer https://www.worldometers.info/world-population/nigeria-population/ (accessed on 10 December 2021) National Population Commission2010–2019
Land use/land coverLandSat Imagery and ArcGIS
Road network (distance from shoreline)Geographic Information System (GIS)NA
Cultural heritage (tourist locations)Geographic Information System (GIS)NA
Physical and geomorphological measures
Coastal slopeSRTM 90m DEM Version 4 and multi-spectral satellite imagery
http://srtm.csi.cgiar.org/ (accessed on 10 December 2021)
NA
Coastal geomorphologyNigerian Institute of Oceanography and Marine Research Database; Sexton & Murday (1994)
Shoreline change rate Digital Shoreline Analysis System (DSAS) v5.0
https://www.usgs.gov/centers/whcmsc/science/digital-shoreline-analysis-system-dsas (accessed on 10 December 2021); Nigerian Institute of Oceanography and Marine Research Database
1986–2015
Bathymetry (elevation) Nigerian Institute of Oceanography and Marine Research Database1986–2015
Wave height (m)MIKE 21 SW + RCM + NIOMR Database2005–2015
Sea level rise (mm/year)Nigerian Institute of Oceanography and Marine Research Database1986–2015
Mean tidal rangeNigerian Institute of Oceanography and Marine Research Database1986–2015
Table 3. Random consistency index for n sample size.
N123456 78910
RI000.580.901.121.241.321.411.451.49
Table 4. Evaluation of consistency ratio (CR) for physical–geomorphological and socioeconomic measures.
VariablePhysical and Geomorphological MeasuresSocioeconomic Measures
λ max 8.094.55
N74
CI0.180.18
RI1.320.90
CR0.130.20
Table 5. CVI of the various geophysical and socioeconomic parameters.
ParameterSEG 1SEG 2SEG 3SEG 4SEG 5SEG 6SEG 7SEG 8SEG 9SEG 10SEG 11SEG 12SEG 13SEG 14SEG 15SEG 16SEG 17
Population45533343334555555
Land use/land cover44533344444445555
Road network (distance from shoreline)44544454444445555
Cultural heritage (tourist locations)44333333333334443
Coastal slope43324423424442111
Coastal geomorphology54554445444444333
Shoreline change rate 55555555555555333
Bathymetry (elevation) 33211122342425312
Wave height (m)55445545544544544
Sea level rise (mm/year)55555555555555555
Mean tidal range33433445344554555
SoVI88.949.685.195.197.746.006.006.006.927.747.7411.1811.1811.185.199.68
PVI56.6943.9241.4020.7033.8030.2351.7550.7042.7642.7675.5947.8047.8121.9511.3333.8016.04
CVI32.3426.4325.5412.9419.5018.9928.8728.3524.3824.8441.6627.7729.4916.5611.2519.5012.86
Table 6. Physical Vulnerability Index of the various physical and geomorphological parameters.
ParameterSEG 1SEG 2SEG 3SEG 4SEG 5SEG 6SEG 7SEG 8SEG 9SEG 10SEG 11SEG 12SEG 13SEG 14SEG 15SEG 16SEG 17
Coastal slope0.0920.0690.0690.0460.0920.0920.0460.0690.0920.0460.0920.0920.0920.0460.0230.0230.023
Coastal geomorphology0.2650.2120.2650.2650.2120.2120.2120.2120.2120.2120.2120.2120.2120.2120.1590.1590.159
Shoreline change rate 0.4440.4440.4440.4440.4440.4440.4440.4440.4440.4440.4440.4440.4440.4440.2670.2670.266
Bathymetry (elevation) 0.4490.4490.2990.1490.1490.1490.1490.2990.4490.5990.2990.5990.2990.7480.4490.1490.299
Wave height (m)0.1600.1600.1280.1280.1600.1600.1280.1600.1600.1280.1280.1600.1280.1280.1600.1280.128
Sea level rise (mm/year)1.2881.2881.2881.2881.2881.2881.2881.2881.2881.2881.2881.2881.2881.2881.2881.2880.129
Mean tidal range1.1861.1861.5821.1861.1861.5811.5811.9771.1861.5811.5811.9771.9771.5811.9771.9771.977
PVI3.8863.8104.0773.5093.5343.9294.0004.5043.8334.3004.0474.7744.4424.4504.3243.9924.142
Table 7. Socioeconomic Vulnerability Index of the various socioeconomic parameters.
ParameterSEG 1SEG 2SEG 3SEG 4SEG 5SEG 6SEG 7SEG 8SEG 9SEG 10SEG 11SEG 12SEG 13SEG 14SEG 15SEG 16SEG 17
Population2.5283.1603.1601.8961.8961.8962.5281.8961.8961.8962.5283.1603.1603.1603.1603.1603.160
Land use/land cover0.9740.9741.2180.7300.7300.7300.9740.9740.9740.9740.9740.9740.9741.2181.2181.2181.217
Road network (distance from shoreline)0.3250.3250.4060.3250.3250.3250.4060.4060.3250.3250.3250.3250.3250.4060.4060.4060.410
Cultural heritage (tourist locations)0.1720.1720.1290.1290.1290.1290.1290.1290.1290.1290.1290.1290.1290.1720.1720.1720.215
SoVI4.0004.6324.9133.0813.0813.0814.0383.3243.3253.3253.9574.5894.5894.9574.9574.9575.00
Publisher’s Note: MDPI stays neutral with regard to jurisdictional claims in published maps and institutional affiliations.

