Abstract
The main goal of this study was to measure the impact of the environmental, social, and governance (ESG) sustainability score and value added to companies’ market capitalization. Therefore, financial and sustainable performance were measured in a sample of 5557 companies divided into 9 economic sectors of activity from 78 countries and 6 regions (Americas: 2144; Asia: 1770; Europe: 1232; Oceania: 311; Africa: 90; United Kingdom: 10). The analyzed sample consisted of publicly traded companies ranked by market capitalization (from small-cap to large-cap), for which the ESG score was measured in the analyzed period: the financial year was 2019, before the advent of the COVID-19 pandemic. Using two methods (multiple linear regression and complementary quantile regression), we found a direct link between the ESG score and value added variables and market capitalization, with distinct impacts at the economic sector level for ESG score and relatively constant impact for value added.
1. Introduction
The environmental (E), social (S), and (corporate) governance (G) indicators, or ESG, are non-financial factors that have become increasingly important and popular among investors. Studying ESG is a part of investment portfolio analysis that helps to identify opportunities and potential risks. Moreover, the indicator helps investors interested in sustainable investments to avoid investing in companies subject to financial risk due to environmental practices and controversial business practices. Although reporting an ESG indicator is not mandatory in annual companies’ statements, it is popular enough that more and more companies are reporting their progress in terms of corporate sustainability. Furthermore, institutions such as the Global Reporting Initiative (GRI) and the Sustainable Accounting Standards Board (SASB) help companies in defining, standardizing, and implementing these ESG factors.
The objective of the ESG indicator is to highlight the fact that beyond ethical concerns, these practices also lead to superior company performance. However, ESG substantially limits the options of investors because there are companies that perform well in terms of stock market price but act against the practices supported by the ESG framework.
The purpose of the current paper was to analyze the impact of sustainability and financial performance on market capitalization. The sample consisted of 5557 publicly listed companies; these companies were grouped into nine economic sectors of activity according to The Refinitiv Business Classification (TRBC) criteria and ordered based on their market capitalization value (from small-cap to large-cap; end of the financial year 2019). Sustainability was measured through the non-financial indicator ESG score (as developed by Refinitiv); the financial performance was based on value added (VA) computed from the companies’ consolidated financial statements and the values for the stock market capitalization were provided by Refinitiv.
This study aimed to (1) measure the impact of sustainability and financial performance on companies’ value and (2) analyze the intensity of the impact considering the economic sectors’ particularities.
The authors of previous studies have analyzed the impact of sustainability and financial performance on companies’ value, and mixed results have been obtained (as presented within the literature review). The current paper’s main contribution to the existing sustainable business performance literature is an analysis of the impact of the ESG score (as a measure of sustainability) on market capitalization. Secondly, by considering the value added measure of financial performance, we show how a company creates and distributes the value created (financial surplus) to stakeholders (such as shareholders, employees, customers, government, and local communities). Thirdly, in addition to previous research, the authors of this study considered a sample from all geographical areas divided into economic sectors of activity. Fourthly, we aimed to analyze whether the impact of the two variables (ESG score and value added) varied depending not only on the sector of activity but also on the quantile in which the company was placed, with the quantiles being established according to market value (from small-cap to large-cap).
This paper is structured as follows. Section 2 is a review of the literature on market capitalization as a measure of a company’s value and the factors that have an impact on it. Section 3 presents the used research methodology. The results are discussed in Section 4, and the paper concludes with Section 5 by highlighting the most important findings, limitations, main implications, and future research directions of this study.
2. Literature Review
2.1. Market Capitalization—A Company’s Value Metric
Establishing the value of a company is a topical issue for both practitioners and academics. Depending on the reason for the company’s evaluation, there are various approaches at hand: income-based approach, company-assets-based approach, comparative approach, and stochastic approach. Alongside establishing the value of a company, which constitutes the final step, it is important to also study the factors that influence it, as this can lead to the ability to accordingly maximize the company’s value. The value of a company is influenced by its financial performance, its tangible assets, and non-financial factors, such as its reputation and image. In recent decades, there has been an increased emphasis on corporate social responsibility by developing indicators to quantify the degree/level of corporate social responsibility (e.g., technology and human resource development, health and safety, and corruption). If companies choose to share some of their profits with community outreach programs, opting for sustainable business and community development, then investors should also develop investment behavior based on socially responsible investments (SRIs). Recently, a new research direction regarding the study of investor behavior in correlation with the principles of responsible investments has developed. As a guide for socially responsible investments, the ESG indicator has been created to guide investors when deciding to invest in companies that have sustainable practices that target both financial goals and ethical issues [1]. By applying the principles of ESG investing, an investor can track and avoid investing in companies whose operations are harmful to the environment and health, as well as other unethical practices. If its principles are integrated into portfolio theory, ESG has the potential to become an important factor that influences investments in firms’ stocks [2]. With this idea as a starting point, this paper was aimed to investigate whether ESG is a factor that has an impact on a company’s value.
The value of a company can be determined from different perspectives, with different objectives, and by using different calculation methodologies that could generate different values, such as enterprise value (EV), market capitalization (MC), Tobin’s Q, and book value (BV). A study by Morgan Stanley–Dean Witter Research identified that the most used methods of valuing companies are price-to-earnings ratio (PER), enterprise value/earnings before interest, taxes, depreciation, amortization (EV/EBITDA), enterprise value to EBITDA growth (EV/EG), discounted cash flow (DCF), and price-to-book value (P/BV) [3].
The authors of this paper considered the value of a company to be given by market capitalization for the following rationale: if investors guide their investments in company shares by applying ESG investing principles, then the impact of investment decisions influences the market price of shares and, consequently, a company’s market capitalization. In both the literature and practical approaches, market capitalization is considered to be a metric for establishing the value of a company from a market perspective. Market capitalization is a metric that, in the opinion of some authors, “gives a clear picture of a company’s value” [4] and “is a measure of the value of a publicly traded company” [5]. This way of measuring the value of a company from a market perspective converged with the objective of our study to analyze the impact of sustainability and financial performance on market capitalization.
2.2. Factors Affecting the Company’s Value
In addition to financial factors, such as assets owned by a company, that influence its value, a series of studies have also analyzed the influence of other categories, namely the non-financial factors, that could exert an influence on the value of a company.
A study conducted on 400 companies from 10 different sectors of activity over 4 years identified the main financial and non-financial factors that significantly contributed to value creation in companies, namely [6]:
- Financial factors, such as market value and book value.
- Non-financial factors, such as human rights, product quality policy, compensation, benefits for employees, anti-discrimination practices, training for employees, and leadership ethics. In addition to these non-financial factors, another study by Tjahjadi identified that executive leadership and business strategy may be significant non-financial factors that influence a company’s performance and value [7].
Dang et al. [8] studied a sample of 214 companies using enterprise value (EV) and Tobin’s Q as company value methods, and they concluded that financial factors, such as return on assets (ROA), return on equity (ROE), and the size of a company, have a favorable and significant influence on EV and Tobin’s Q. Moreover, the capital structure was found to have a negative influence on EV and Tobin’s Q, but revenue growth had no influence. Based on these results, the authors recommended EV as a more favorable way of measuring company value than Tobin’s Q [8].
Other studies have reported that alongside financial leverage, earnings before interest, taxes, depreciation, and amortization (EBITDA) are financial factors that influence investment decisions and can, therefore, influence the market value of a company [9].
The authors of several studies explicitly analyzed the factors that influence a company’s market capitalization, a metric that we chose in this study as a way to measure the value of a public company. A study [10] conducted on all listed companies on the Amman Stock Exchange from 1978 to 2019 revealed that:
- Number of transactions, earnings per share (EPS), dividend yield ratio, and price per earnings (P/E) had significant impacts on market capitalization.
- Turnover ratio and price/book value (P/BV) had no impact on market capitalization.
Another study [11] conducted on 307 Italian listed companies during 2008–2017 identified that there was a “positive relationship between market capitalization and price/earnings ratio, operating income/turnover per share and working capital per share” and a “negative relationship between market capitalization and ROE, ROA and earnings yield”.
In addition to the abovementioned endogenous factors, market capitalization is also influenced by exogenous factors, such as GDP growth rate [12].
Value added (VA) is a financial factor that influences a company’s profitability, and this factor “can well quantitatively reflect the social responsibility of enterprises to various stakeholders” [13], so it can influence the value of a company in terms of its attractiveness for present and potential shareholders [14]. Value added is a particularly important factor for a company and stakeholders because “value added can … be considered an appropriate indicator of the economic as well as the social role of a company within society” [15,16].
Corporate social responsibility (CSR) is an intensively studied non-financial factor of company value, but related results have not converged towards the same conclusions [17,18]. Some studies have shown that companies that have improved their CSR scores have also seen increases in their value [19], but other analyses have shown that investing in CSR is not beneficial to short-term profitability but may increase a company’s long-term value [20].
The more frequent use of ESG among companies and the blooming idea of integrating the ESG factor in sustainable investment decisions have led to studies that have analyzed the association between ESG performance and company value. Such studies will certainly increase in number in the coming years, given that regulation of ESG investment practices is desired and currently taking shape at the European Union level [21].
As companies place more and more importance on improving and publishing their ESG scores, they also change their perspective on value creation and aim to create sustainable, long-term value for shareholders and stakeholders [22,23]. Companies adopting ESG practice are pursuing not short-term profitability but the creation of long-term value not only for shareholders but also for stakeholders. On the one hand, long-term value creation is significantly influenced by a company’s financial performance and even more by non-financial factors, such as reputation, operating capabilities, management, transparency, employee satisfaction, stakeholders’ engagement, and customer value [24]. On the other hand, short-term investments to increase ESG scores correlate with lower dividend distribution rates, thus affecting shareholder returns [25].
For now, the role of the ESG score is still controversial [26,27], and an analysis of existing studies showed that the link between ESG and company value is uncertain [28] because it is influenced by how a company’s value is measured and the fact that ESG investing practices among investors are still in their infancy. However, a study of 350 listed UK companies demonstrated a direct link between ESG (both in total ESG score and its components) and company value measured with Tobin’s Q [29]. For emerging economies, it was identified that the publication of ESG ratings leads to increases in Tobin’s Q rates [30], but another study conducted on 412 German companies could not validate the existence of any link between ESG and Tobin’s Q [31].
Transparency and the publication of ESG performance reports influence a company’s short-term profitability, and investments in increasing the ESG performance have been proven to favorably influence the long-term financial performance of a company—in some cases even leading to an increase in the return on capital employed indicator (ROCE) [32]. These types of effects can guide an investor’s behavior in building their equity portfolio depending on his/her short (speculative), medium, or long-term strategic orientation [33]. The conclusions of these studies cannot be generalized, as shown by the following example: a study conducted on 1640 international companies from six different activity sectors showed that ESG disclosure adversely affected the company value measured with Tobin’s Q; ESG components were reported to increase company value at high scores or ratings and to decrease company value at low scores or ratings [34].
Giese et al. [35] studied whether there were causal relationships between ESG score and systematic risk, non-systematic company risk, and company value. Their analysis showed that companies that increased their ESG score registered (1) decreases in the systematic risk compared to companies that registered decreased or unchanged ESG scores; (2) decreases in the beta coefficient, the cost of capital, and (consequently) better company valuations; (3) improvements of (i.e., decreases in) the specific, non-systematic company risk.
To draw more relevant conclusions about the impact of ESG on a company’s value, a series of studies analyzed the relationships between ESG score and company performance and company value by separately analyzing the components of the ESG score and their impacts. The authors of other studies separately approached companies according to their geographical distribution. In this regard, a study conducted on 73 companies in the tourism industry from Asia, Europe, and the USA identified that the environmental component of the ESG score had a positive but small influence on Asian companies, a positive and high influence on European companies, and a negative and high influence on U.S. companies. After researching the international banking sector, it was found that the environmental and governance components of the ESG score favorably influenced the value of banks measured with Tobin’s Q and that there was a negative and significant link between the social component and the bank value. These results changed if the studied sample was divided into banks operating in developed and emerging countries. Thus, for developed countries’ banks, only corporate governance performance has a positive and significant influence on Tobin’s Q, and the other two components of ESG do not exert any influence [36]. Consequently, no general accepted conclusion can be drawn regarding the influence of the ESG score and its components on the market value of companies [37]. On a similar note, another study of U.S. S&P 500-listed companies showed that the environmental component of the ESG score adversely affected return on assets (ROA) and return on equity (ROE) but favorably influenced Tobin’s Q, the social component of the ESG score negatively influenced ROA and ROE but favorably influenced Tobin’s Q, and the governance component of the ESG score positively influenced ROA and Tobin’s Q but negatively influenced ROE [38]; as such, all components of the ESG score were found to favorably influence Tobin’s Q, which can be used as an indicator to measure the value of a company. However, another similar study conducted on U.S. S&P 500 companies over 15 years presented opposite results: the link between the ESG score and company value also measured with Tobin’s Q was insignificant, improvements of the ESG score did not determine increases in the company value, and the connection between the ESG score and company value was not influenced by the type of activities carried out by the company (e.g., ethical or controversial activities) [39]. In their study, Atan and co-authors identified that [40]:
- There was no significant link between the ESG score, both in total and between its components, and the financial performance of a company measured with ROE and the value of the company measured with Tobin’s Q.
- There was a direct and significant link between the overall ESG score and the cost of capital measured by the weighted average cost of capital (WACC), but the relationships between the individual components of ESG and WACC were insignificant.
Research directions on the impact of the ESG score have been diversified to obtain the most reliable results. For instance, an analysis of the impact of negative news related to the ESG score on company value surprisingly revealed that negative news exerted a significant and favorable influence on company value based on market value, though a significant and negative influence on company value was calculated with accounting methods [41]. Another research direction is the identification of the potential direct impact of the ESG score on investors through the function of maximizing the utility of investments. Investors who incorporate ESG performance when building their stock portfolios have higher utility than those who do not [42]. According to the results of this study, those investors will orient their investments in stocks of high-performing companies from both the financial and ESG score perspectives. This aspect could influence the market capitalization of companies, an aspect that we intended to analyze in this paper. Deng and Cheng’s study [43] revealed that high ESG scores favorably influenced the stock market performance of a company measured by earnings per share (EPS). Based on this idea, the ESG score has become increasingly recognized by companies as an important intangible asset. A meta-analysis of 2200 studies on the link between ESG and corporate financial performance concluded that “90% of studies found a non-negative ESG–corporate financial performance relationship” [44].
However, some studies have found that good ESG scores correlate with higher returns on the shares of respective companies, with a lower risk for companies with good credit ratings [45,46,47]. Sassen and co-authors conducted a study of 8752 European companies and identified that companies that increased their ESG scores had the potential to increase their company value, the vector showing that the impact of ESG on company risk tended to decrease at high ESG values [48].
To obtain more conclusive results compared to previous studies, we chose to use market capitalization to measure company value because it is more sensitive than previously used metrics to investors’ choices guided by the performance of the ESG score. Studies that have used Tobin’s Q as a measure of company value have generally not yielded definite results. To deeply analyze this link between company value and ESG on the one hand and VA on the other hand, we chose to divide the sample by economic sectors of activity and by quantiles.
3. Materials and Methods
3.1. Data and Sampling
In constructing the model for measuring the impact of ESG and the financial performance of the company on the market capitalization, we considered the following variables: market capitalization (MC), ESG score, and value added (VA).
The selected variables were calculated for the 2019 financial year to eliminate the outbreak of the COVID-19 pandemic as a possible influencing factor in our analysis.
The MC calculation of Thomson Reuters Refinitiv Eikon uses the total number of shares issued and held by internal and external shareholders, as well as the shares available for trading on the secondary capital market (free float shares) multiplied by the last closing price, according to the equation below [49].
Market capitalization, or simply market cap, measures a company’s total market value based on the total number of outstanding shares and the current market price. The number of outstanding shares refers to shares held by all the company’s shareholders. The market cap allows investors and analysts to classify companies into large-cap (10 billion USD or more), mid-cap (between 2 and 10 billion USD), and small-cap (between 300 million and 2 billion USD) companies. Additionally, this classification reveals the growth rate and risk for companies. Mega and large-cap companies have historically shown a slower growth rate but lower risk in comparison to micro and nano-cap companies that have the potential to grow at higher rates.
Although the market cap is an easy-to-use metric to evaluate companies, showing their true values as perceived by the overall market, the metric cannot be used to precisely indicate a company’s health, stability, and wealth.
Some analysts and most of the uninitiated can misinterpret the price of a share as an accurate description of a company’s worth and/or financial stability. Companies with high share prices are seen as more financially stable, and those with lower share prices are seen as undervalued and investment opportunities. A company’s effective value is not indicated by the share price, which instead shows the value as it is recognized by the capital market [49,50].
The ESG score used in the analysis was calculated and provided by Thomson Reuters Eikon Refinitiv; it ranged from 0 (weakest) to 100 (best). Furthermore, the score was divided into four groups according to its position relative to the three quartiles (each quartile representing the level of recorded performance), as shown in Table 1.

Table 1.
ESG score.
VA represents the financial surplus formed at the company level, from which the stakeholders (employees, government, shareholders, etc.) will be remunerated. Additionally, VA shows the real contribution of a company, namely the wealth created through the work of its employees and the contribution of the company itself. This indicator must have a positive value and be as high as possible to satisfy all stakeholders. It can be calculated as the difference between the trade margin plus the production for the year and the intermediate consumption of goods and services from third parties or as the difference between total revenue and cost of goods sold; see equations below [51].
where CM = commercial margin; EP = exercise production; and IC = intermediary consumption by third parties.
Equation (3) and the financial statements of the companies from the financial year 2019 (retrieved from the Thomson Reuters Refinitiv Eikon platform) were used for VA calculation in this study.
VA represents the wealth created by a company as an effect of the efficient use of its potential over the value of consumption of production factors from third parties, and it is one of the most important indicators to reflect the economic and financial performance of a company [52].
Based on VA, the true dimension of a company’s activity can be appreciated, as it is the expression of its role in the economic environment. Moreover, from the aspect of the contractual relations between a company and its partners, VA can be defined as the sum of the monetary accumulation that serves to remunerate the direct and indirect participants (namely stakeholders) in the activity of the company, as follows [53]:
- Employees are remunerated with salaries, material aids, profit participation, allowances, employer’s contribution for social health insurance, contributions to the unemployment fund, and other social debts.
- Government remunerated through taxes, fees, assimilated payments, and income tax.
- Creditors (borrowed capital) remunerated with interest and commissions, including leasing companies.
- Shareholders remunerated with dividends.
- Other stakeholders remunerated with compensations, donations, and assigned assets.
- The company itself is remunerated with self-financing: retained earnings, depreciation, and provisional expenses.
As a result, we analyzed the impact of ESG score and value added on market capitalization (see Figure 1).
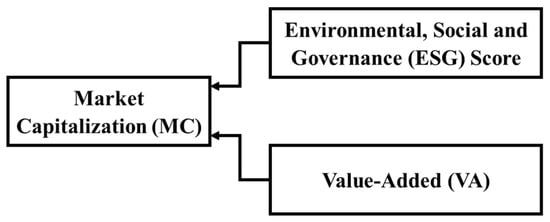
Figure 1.
Representation of the variables whose impact on a company’s market capitalization was measured. Source: Authors’ representation.
The chosen sample consisted of companies that were classified by economic sectors to determine the impact of the analyzed variables on the market cap at the general and sector levels. Both academics and practitioners use several methodologies to classify companies by sectors and industries, such as The Global Industry Classification Standard (GICS) developed by the financial company Morgan Stanley Capital International (MSCI) in collaboration with the rating agency Standard & Poor’s [54], The Industry Classification Benchmark (ICB) developed by Dow Jones & Company and the Financial Times Stock Exchange in London [55], and The Refinitiv Business Classification (TRBC) developed by the Canadian company Thomson Reuters Corporation. All three mentioned methodologies are recognized and used by analysts and investors to analyze and compare companies in various industries [56].
In our study, the sample of companies was classified according to the TRBC methodology in the following economic sectors: basic materials, consumer cyclicals, consumer non-cyclicals, energy, healthcare, industrials, real estate, technology, and utilities. The economic sectors that were not included in the analysis were academic and educational services, financials, government activity and institutions, and associations and organizations [57].
For consistency, the Thomson Reuters methodology was chosen because the data from the financial statements and the ESG score were also collected from the Thomson Reuters Refinitiv Eikon platform [58]. A more detailed representation of the sample can be found in Table 2.
Table 2.
ESG score and its components’ weights by sector.
The companies with missing data for any of the variables in the financial year 2019 were eliminated, so the sample consisted of 5557 companies from 78 countries and 6 regions (Americas: 2144; Asia: 1770; Europe: 1232; Oceania: 311; Africa: 90; United Kingdom: 10). The sectoral approach was based on The Refinitiv Business Classification.
3.2. Research Methodology
We started from the following hypotheses:
Hypotheses 1 (H1):
At the sample level, there is a direct relationship between ESG score and value added (independent variables) and market cap (dependent variable).
Hypotheses 2 (H2):
At the sector level, there is a direct relationship between ESG score and value added (independent variables) and market cap (dependent variable).
Hypotheses 3 (H3):
At the sample level, the intensity of the relationship between ESG score and value added (independent variables) and market cap (dependent variable) varies according to the market cap quantile level of the companies.
Hypotheses 4 (H4):
At the sector level, the intensity of the relationship between ESG score and value added (independent variables) and market cap (dependent variable) varies according to the market cap quantile level of the companies.
The quantile levels of market cap are denoted as Q1: 5%; Q2: 10%; Q3: 25%; Q4: 50%; Q5: 75%; Q6: 90%; and Q7: 95%.
Thus, the proposed model is a multiple linear regression model:
Considering the findings from the literature review, we expected the ESG score to have a direct link to the stock market cap. We also expected value added to have a direct and positive impact in terms of financial performance on the market cap, given previous research.
Researchers (especially in the social sciences) use linear models, which are characterized by straight lines. These models are solved with analysis of variance (ANOVA) and regression, which are basically identical statistical systems [59,60]. The mathematical representation of a linear model is [60,61]:
where dependent variable; intercept; the parameters or the slope coefficients of the independent variables; the explanatory or independent variables; and residual.
Starting from the formal equation of the linear model, there are simple linear regression functions or multiple regression functions. The simple regression function enables analysts and researchers to predict one variable (the outcome variable) based on the information known from another variable (the explanatory variable) [61]. The simple regression function is limited to the use of only two variables (continuous): the dependent and the independent variables. In contrast, as Greene [62] pointed out, the valuable purpose of the multiple regression function is its ability to spot the explanatory or independent effects of a group of variables on an outcome or dependent variable.
3.2.1. Assumptions of the Linear Regression Model
In social sciences, tests with idiosyncratic assumptions are commonly used as statistical procedures of the linear model. Statistical procedures (frequently tests based on the normal distribution) and assumptions are used to try to evaluate the quality of a model. According to Greene [62], Darlington and Hayes [63], and Field [60], linear models’ quality can be tested based on the following assumptions:
- Additivity and linearity: This first assumption considers the link between the dependent and independent variables and whether this relationship is accurately described by Equation (3). This assumption is important for a model because it shows if the scores of the independent variables are linearly related to the dependent ones. If the model has more than one independent variable, their combined effect properly describes their effects added together. Even if the other assumptions are valid, the model is invalid if this first assumption is not true because it fails to accurately model the described process.
- Normal distribution: This second assumption considers whether the errors (or the residuals of the regression) between the dependent and independent variable(s) are normally distributed. This assumption can be checked by using a histogram. Additionally, if the data are not normally distributed, a non-linear transformation (i.e., log-transformation) should fix this problem.
- Homoscedasticity/homogeneity of variance: This third assumption, also spelled homoskedasticity, states that there is equal variance in the conditional distributions of (predictable or dependent variable). In the case of minor violations of homoscedasticity (i.e., heteroscedasticity), this will not create much of a problem, but it is considered a violation of the assumptions for the linear regression model.
- Independence: This fourth assumption requires that the data are independent of the predictor or dependent variables.
As stated before, these assumptions validate the explanatory consistency of a model. Violated linearity simply indicates that a variable is not meaningful regarding what we are trying to estimate. The other assumptions of normality and homoscedasticity refer to the distributions of the errors in estimation, while independence refers to the fact that the errors in estimation are not correlated with each other.
According to Field [60], normality tests, such as the Kolmogorov–Smirnov and Shapiro–Wilk tests, tend to be inconclusive regarding the normality of large data series. In this case, the normality tests mattered little or not at all due to the central limit theorem that states that for large data series (it is widely accepted that a sample is large when it is >30), one can assume normality regardless of the shape of the data series. On smaller data series, one should be concerned with normality and apply the significance tests of normality. Additionally, if a data series is characterized by light or heavy-tailed distribution or by skew and kurtosis, the central limit theorem only applies if it is a large data series [60,64]. As a result, the assumption of normality should not be a problem when the data series is large enough, and normality tests are unnecessary.
The assumption of homoscedasticity in a linear regression model must be validated. Darlington and Hayes [63] suggested that the condition of homoscedasticity states that the residuals are equally variable conditioned on and if this condition is not met, the residuals in estimation are heteroscedastic. Depending on the form of the heteroscedasticity, this can reduce the accuracy and statistical power of a regression model. The same authors [61] claimed that if this assumption is softly or moderately infringed, these accuracy and statistic power reductions should not be a concern.
To test the heteroscedasticity of residuals (errors) in a regression model, researchers, such as Levene (1960); Goldfeld and Quandt (1965); Breusch–Pagan (1979); Downs and Rocke (1979); White (1980); Cohen, West, and Aiken (2003); and Darlington and Hayes (2017), have proposed tests.
By applying the Breusch–Pagan test in our study, we analyzed whether the variance of the residuals was constant at each level of the predictor variables. If this assumption of homoscedasticity was violated, heteroscedasticity was indicated; this means that the variance of the residuals differed at different levels of the predictor variables [62], thus over or underestimating the predicted values.
3.2.2. Linear Regression Model and Logarithmic Transformation
Among the assumptions of the linear regression model, the linear relationship between the outcome (dependent variable) and the predictor(s) (explanatory variable(s)) is important.
The logarithmic transformation of variables is a common solution when there is a non-linear relationship between dependent and explanatory variables, or if the variables are highly skewed, they can be logarithmically transformed to be more normally distributed. This will result in a “log-normal” distribution in which the logarithm is normally distributed [65]. Starting from the mathematical model of linear regression (5), we applied the logarithmic transformation of the variables in our study, resulting in the following model:
Formally, our model is as follows:
where MC = market capitalization.
3.2.3. Quantile Regression Model and Logarithmic Transformation
Quantile regression was introduced in 1978 by Koenker and Bassett, and it is focused on conditional quantile functions; the model expresses quantiles of the conditional distribution of the response variable as functions of observed covariates [66,67].
Additionally, Koenker and Hallock [66] reported the use of quantiles as a suitable choice for an optimization problem. The quantile regression model uses the median instead of the mean to minimize the sum of absolute residuals (errors). Standard regression with OLS (ordinary least squares) only models the conditional mean, but quantile regression models the conditional median quantiles. Moreover, some of the advantages of quantile regression are that it is well-suited to larger sets of data and robust to response outliers, but one of its disadvantages is that it requires more computational power than standard regression.
The quantile regression model solves a problem by minimizing the median absolute deviation. It is almost the same process as that of standard linear regression, but in quantile regression, the beta coefficients are functions with a reliance on quantiles. The quantiles can be expressed as follows [68]:
The conditional τ percentiles, τ ∈ (0;1)
Percentileτ (x,y) = xβτ
The τth quantile (τ ∈ (0;1)) of y is μτ such that
τ = P (y ≤ μτ) ≡ Fy (μτ)
As a result,
μτ ≡ Fy−1 (τ)
Then, the standard linear regression and quantile regression models can be compared, as shown below [69,70,71].
The standard linear regression finds the optimum by minimizing the mean square errors, as follows:
Following the structure of the standard linear regression model, the quantile level (τ) is modeled as follows:
The quantile regression model uses the following equation to minimize the median absolute deviation:
In this case, the check functions use “p” by assuming asymmetric weights to the error depending on the quantile and the overall sign of the residuals (errors). “p” takes the following form: , where u = errors of a single data point.
Following the structure of the standard linear regression model, we applied the logarithmic transformation of the variables in the case of the quantile regression model; the resulting model is:
where MC = market capitalization.
In our research, we performed and computed a quantile regression model, based on the abovementioned methodology, for 7 quantiles: Q1: 0.05 (5th percentile); Q2: 0.10 (10th percentile); Q3: 0.25 (25th percentile); Q4: 0.50 (50th percentile); Q5: 0.75 (75th percentile); Q6: 0.90 (90th percentile); and Q7: 0.95 (95th percentile). The quantile regression model performed on the 7 quantiles comprises the following equations:
By applying the abovementioned methodology (standard linear regression and quantile regression), we tried to understand if and how the dependent variables (ESG score and value added) impacted the predictor (market cap) at different levels. The quantiles represent market cap values: Q1 and Q2 (small-cap); Q3 and Q4 (mid-cap); and Q5, Q6, and Q7 (large-cap). Following logarithmic transformation, we can say that a 1% increase in β is associated with a percent change in Y.
4. Empirical Results and Discussions
We computed the data for the entire sample grouped into nine economic sectors. We tested the assumptions of the linear regression model with IBM-SPSS V.28.0 (IBM: Armonk, NY, USA), and the results are shown in Table 3. As our data sample was large and had extreme values for the analyzed variables, we decided to replace each value “n” of our variables with ln(n). This log transformation process helped us to normalize the data set.
Table 3.
Multiple linear regression results.
The histogram in Figure 2 shows that the data were normally distributed for the entire sample (5557). Figure 3 shows that there was linearity between the dependent variable (market cap) and each of the independent variables (ESG score and value added). Figure 4 shows that heteroscedasticity was present in the linear regression model at the sample level, as confirmed by the Breusch–Pagan test results of 0.0046 < 0.05 (rejecting the null hypothesis). The R-squared value for the entire sample (5557 companies) was 0.499, which indicates that 49.9% of the variation in the market cap could be explained by the ESG score and value added. Although the R-squared value was not high and the (standardized) regression coefficients of the ESG score (0.095) and value added (0.661) were positive and statistically significant (Sig. 0.000), it can be stated that there was a positive link between them and the dependent variable, market cap.

Figure 2.
Histogram for the entire sample (5557). Source: Authors’ representation.
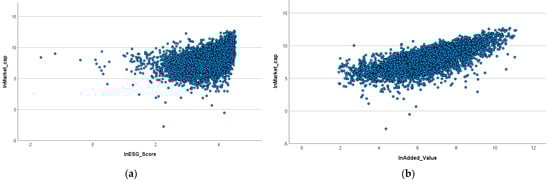
Figure 3.
Scatterplots of the entire sample (5557): (a) Scatterplot for market cap and ESG score; (b) scatterplot for market cap and value added. Source: Authors’ representation.
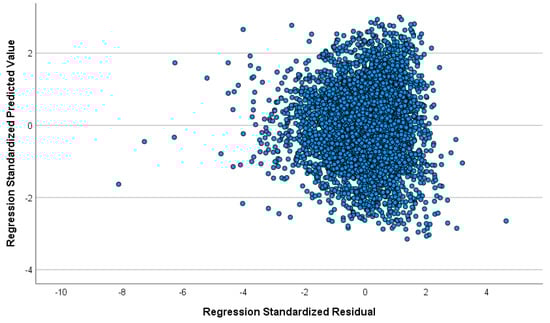
Figure 4.
Scatterplot for market cap and residuals of the entire sample (5557). Source: Authors’ representation.
The Durbin–Watson test result of 1.908 indicated that there was no serial correlation of errors (residuals). Values in the range between 1.5 and 2.5 were considered relatively normal, so the value of our model fit this interval.
Last but not least, the VIF and tolerance values of 1.212 and 0.825, respectively, showed that multicollinearity was not a concern in our model.
Following the same procedure, we also tested the assumptions of the linear regression model for the economic sectors of basic materials, consumer cyclicals, consumer non-cyclicals, energy, healthcare, industrials, real estate, technology, and utilities; the results are reported in the Supplementary Materials.
The results shown in Table 3 reveal that the R-squared had values between 0.465 for the utilities sector and 0.621 for the healthcare sector, indicating a variance in market cap that could be explained by the ESG score and value added in a proportion of 46.5% to 62.1%. However, for consumer cyclicals (Sig. 0.129), industrials (Sig. 0.053), and technology (Sig. 0.105), the ESG scores were not statistically significant, with p-values > 0.05. Value added proved to be statistically significant for all the analyzed sectors (Sig. 0.000 < 0.05).
The Durbin–Watson test for autocorrelation results were in the range between 1.5 and 2.5 for all the nine analyzed sectors; these values are considered normal and suggest no autocorrelation in the model.
VIF and tolerance values (shown in Table 3) indicated there was no multicollinearity in the model. In general, if VIF is >4 and tolerance <0.25, multicollinearity might have occurred [72].
Heteroscedasticity was tested, and the Breusch–Pagan test results (shown in Table 3) revealed that only for the three sectors of consumer cyclicals, industrials, and technology were the residuals (errors) the same across all values of the independent variables (ESG score and value added), and the model did not under or overestimate the predicted variable (market cap). For the other sectors of basic materials, consumer non-cyclicals, energy, healthcare, real estate, and utilities, heteroscedasticity was present in the model. As a result, the variance of errors was not the same across all the values of the independent variables and the predicted value could have been under or overestimated, especially in the case of extreme values.
Considering the fact that assumptions of the linear regression model were not met (i.e., homoscedasticity), we moved our attention to quantile regression, which is considered an extension of linear regression that can be used if the assumptions of linear regression are not met but also allowed us to estimate the median of various quantiles (or percentiles) and not the mean, as with linear regression [66], for a better understanding of the impact of ESG score and value added on market cap.
As mentioned in the methodology section, we computed the data in seven quantiles—Q1: 0.05 (5th percentile); Q2: 0.10 (10th percentile); Q3: 0.25 (25th percentile); Q4: 0.50 (50th percentile); Q5: 0.75 (75th percentile); Q6: 0.90 (90th percentile); and Q7: 0.95 (95th percentile)—for the entire sample and economic sectors. The quantile regression results for the seven quantiles for the entire sample (5557 companies) are shown in Table 4; in addition, Figure 5 is a graphical representation that complements the quantile regression results to aid understanding of the impact of ESG score and value added on market cap. The models of the quantile regressions for each economic sector can be found in Appendix A, and their corresponding graphical representations can be found in the Supplementary Materials.
Table 4.
Quantile regressions for the entire sample (5557 *).
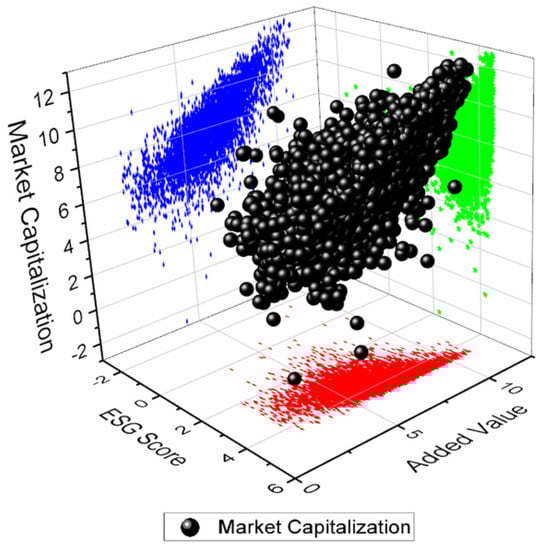
Figure 5.
Market cap evolution for the entire sample (5557). Source: Authors’ computation with OriginPro (OriginLab Corporation: Northampton, MA, USA).
At the sample level (5557 companies), the impact of the ESG score on quantile estimates of market cap decreased as the value of the ESG score increased. In contrast, the impact of value added on market cap quantile estimates increased as its values increased. To conclude, we can state that for higher quantile estimates of market cap, the impact of ESG score decreased while the impact of VA increased. Thus, the relationship between market cap and both predictors (ESG score and VA) was positive, the difference is in its intensity (decreasing for ESG for higher quantile estimates of market cap and increasing for VA for higher quantile estimates of market cap). In the case of high values of the market cap (Q7), the impact of the ESG score was insignificant (0.077); we found the greatest impact in the case of the low values of the market cap (Q1), where the ESG score had the greatest impact (0.620).
At the level of the economic sector, the impact of value added on the market cap was the same as in the case of the entire sample: it increased as the value of the market cap increased (see Appendix A). However, the impact of the ESG score presented some interesting particularities depending on the economic sector, as reported in Table 5.
Table 5.
ESG score coefficients by sector in quantiles.
Analyzing the quantile values from Table 5 regarding the impact of ESG score on market cap revealed the following:
- For the basic materials sector, at high values (large-cap), the ESG score had no impact (Q5, Q6, and Q7), and for low to medium values (small and mid-cap), the ESG score had moderate impact (Q1, Q2, Q3, and Q4), decreasing from one quantile to another.
- In the case of the consumer cyclicals sector, at low values (small-cap), the ESG score’s impact was moderate (Q1 and Q2); for medium values (mid-cap), the impact was low (Q3 and Q4), and for high values (large-cap), the impact was insignificant (Q5, Q6, and Q7). These results demonstrate that the ESG score did not have an impact on large-cap companies in the consumer cyclicals sector.
- For the consumer non-cyclicals sector, the impact of the ESG score was moderate (Q1 and Q2) at low values (small-cap) and low (Q3, Q4, Q5, Q6, and Q7) for medium and high values (mid-cap and large-cap).
- For the energy sector, the ESG score had a strong impact (Q1 and Q2) at low values (small-cap) and a low impact (Q3, Q4, Q5, Q6, and Q7) at medium and high values (mid and large-cap). We noticed the greatest direct and positive impact on the stock market cap in the energy sector.
- In the case of the healthcare sector, at low values (small-cap), the impact of the ESG score was strong (Q1 and Q2); at medium values (mid-cap), the impact was low (Q3 and Q4); and at high values (large-cap), the impact was insignificant (Q5, Q6, and Q7).
- In the case of the industrials sector, at low values (small-cap) and some medium values (mid-cap), the impact of the ESG score was moderate (Q1, Q2, and Q3); it was insignificant for the others (Q4, Q5, Q6, and Q7).
- At low, medium, and high values (small, mid, and large-cap), the impact of the ESG score was moderate for all quantiles of the real estate sector.
- For the technology sector, at medium and high values (mid and large-cap), the ESG score had a low but negative impact (Q4, Q5, Q6, and Q7), and at the lowest values (small-cap), it had an insignificant impact (Q1, Q2, and Q3).
- For the utilities sector, at low values (small-cap), the ESG score had a strong impact (Q1 and Q2); the impact decreased to moderate, low, and insignificant (Q3, Q4, Q5, Q6, and Q7) as the values increased (mid-cap and large-cap).
The results from quantile regression revealed that value added had the same impact regardless of sector: it increased as the values (small, mid, and large-cap) of the market cap increased. In contrast, the ESG score had a moderate and high (positive) impact on lower and medium values of market cap and a low (positive) impact for high values of market cap for most sectors except for technology, where the impact (even low impact) was negative for medium and high market cap values.
We also analyzed whether there were mean differences between the coefficients of the independent variables (ESG score and value added) from the quantile regression model between sample and sectors, as well as at the sectoral level. In this regard, we have applied several paired samples t-tests on the regression coefficients for the seven quantile models both between all sectors and between every sector and the whole sample. See Table 6, Table 7 and Table 8.
Table 6.
ESG score and value added coefficients, mean differences between samples and sectoral models.
Table 7.
ESG score coefficients and mean differences between sectoral models.
Table 8.
Value added coefficients and mean differences between sectoral models.
The results from Table 6 show no significant mean differences between the sample and sectoral models’ coefficients of ESG score and value added (values highlighted in grey; Sig. > 0.05), except for consumer cyclicals, energy, and consumer non-cyclicals sectors in the case of value added. This means that the ESG score and value added had similar impacts on the market cap in the sectoral and sample models.
The results from Table 7 show no significant mean differences between some sectoral models’ coefficients of the ESG score, for those sectors with values highlighted in grey (Sig. > 0.05), and for the other sectors, the ESG score had a higher impact on market cap.
The results from Table 8 show no significant mean differences between some sectoral models’ coefficients of the ESG score, for those sectors with values highlighted in grey (Sig. > 0.05), and for the other sectors, the ESG score had a higher impact on market cap.
5. Conclusions
Although there have been many previous studies on the relationship between ESG and company value, a generally accepted conclusion cannot be deduced from them. This is why the present study was conducted considering a large sample of 5557 companies from 9 different sectors of activity with global geographical distribution from 78 countries and 6 regions (Americas: 2144; Asia: 1770; Europe: 1232; Oceania: 311; Africa: 90; and United Kingdom: 10) according to the criterion of market capitalization. The methodology used in this study differed from that of previous studies in the variables considered for the company’s value and financial performance. In previous studies, Tobin’s Q was used to measure company value with uncertain results, so market capitalization was used in this study as a measure of company value. In terms of financial performance, a comprehensive indicator was chosen from the perspective of value creation and redistribution to stakeholders, namely value added. The variable common with other studies is the ESG as a non-financial indicator that could influence company value. Secondly, to obtain more conclusive results, two methods, linear regression and quantile regression, were applied to both the entire sample and to each sector of activity, this being a novel element compared to previous studies.
A definite result of this study that confirms previous studies’ results is the fact that value added was found to have a direct, positive, and significant influence on market cap for both the entire sample and all sectors (tested in hypotheses H1 and H2). Regarding the impact of ESG on company value at the level of the entire sample, the results of the present research converged with the results of previous studies [26,27,44] in showing a direct relationship of low and non-negative intensity. The sectoral and quantile approach registered certain specificities tested in hypotheses H2, H3, and H4.
This article’s main findings are as follows. Firstly, we found that ESG score and value added had impacts on the market cap of the analyzed companies (5557), which confirmed our first hypothesis (H1: At the sample level, there is a direct relationship between the ESG score and value added (independent variables) and market cap (dependent variable)) though was limited by the fact that the initial regression model was not validated due to heteroscedasticity. Secondly, the ESG score’s impact on market cap at the sector level was mixed, with three out of nine sectors showing no significant impact of the ESG score. For the other six sectors, there the ESG score had an impact, but the regression models could not be validated due to heteroscedasticity. Value added presented a significant impact at the level of all analyzed economic sectors, which partially confirmed the second hypothesis (H2: At the sector level, there is a direct relationship between the ESG score and value added (independent variables) and market cap (dependent variable)). Thirdly, at both the sample and sector levels, the impacts of ESG score and value added on the companies’ market capitalization differed according to the estimated quantile level of market cap, thus confirming the third and fourth hypotheses (H3: At the sample level, the intensity of the relationship between ESG score and value added (independent variables) and market cap (dependent variable) varies according to the market cap quantile level of the companies; H4: At the sector level, the intensity of the relationship between ESG score and value added (independent variables), and market cap (dependent variable) varies according to the market cap quantile level of the companies).
The results from the quantile regression showed that value added had a constant impact (high and positive) across all economic sectors of activity from small to large-cap companies, and, similarly to the impact of the ESG score, on market capitalization decreased at high values of market cap. The intensity of impact for value added was direct and increasing and for the ESG score was direct, decreasing, and in some cases insignificant on stock market capitalization.
However, what stands out are the impact of the ESG score on different values of market capitalization based on quantiles (from Q1 (small-cap) to Q7 (large-cap)) and the differences between sectors of activity. A high impact of the ESG score in the energy and utilities sectors for small-cap companies compared to low or no impacts in other sectors can be explained by several factors, such as compliance requirements and government regulations, which are stricter than in other sectors. Additionally, increases in energy consumption, the need for renewable energy, and pressure from shareholders oriented toward eco-investments have allowed the energy and utilities sectors to lead in terms of sustainable practices and to accordingly change their operations. Furthermore, these sectors managed to take advantage of the use of technology, facilitating the more efficient monitoring of processes. One of the most important findings was that renewable energy providers made their operation costs lower while the demand for green energy grew at a fast pace. Compared to traditional power plants, the lower cost of renewable energy comes from the lack of cost for raw materials (e.g., sun, water, and wind). When regulations become stricter in the other sectors of activity and operators begin to realize the long-term incentives of sustainable business practices, we might notice a higher impact of ESG. For now, eco-investors and regulatory scrutiny have caused the energy and utilities sectors to lead in terms of sustainability.
This study had some limitations, including the consideration of a single point in time as a period of analysis. The impact of ESG, being a relatively new concept that is still being developed as a tool for sustainability measurement, on companies over longer periods should be studied. Value added is a basic indicator of financial performance that shows the value created at the company level, which comprises not only the value created for shareholders but also all parties involved, namely stakeholders being bounded to companies for longer periods and reasons of greater need.
Despite issues caused by data availability and the short analysis period, this paper also generated relevant conclusions based on a large sample containing a variety of public traded companies, from small, mid, and up to large-cap companies. In addition, other factors, e.g., the ongoing COVID-19 pandemic crisis, could influence how companies perceive environmental, social, and governance issues, as well as the link between ESG and market capitalization of the companies. However, the results from our research contribute to a better understanding of how ESG (as an indicator of sustainability performance) and value added (as an indicator of financial performance) impact the market cap (company value) of companies from nine international sectors of activity (basic materials, consumer cyclicals, consumer non-cyclicals, energy, healthcare, industrials, real estate, technology, and utilities). The results of our paper can be of interest to both academics and practitioners (e.g., analysts) because it enriches the work already done in this direction, and second because ESG as a concept is growing into the mainstream. These results also provide critical insight into the differences between the impacts of these factors at different levels of market capitalization (small, mid, and large-cap). This research, conducted on 5557 companies from six regions (Americas: 2144; Asia: 1770; Europe: 1232; Oceania: 311; Africa: 90; and United Kingdom: 10), emphasizes that levels of market capitalization and sectoral characteristics prevail over regional peculiarities.
Still, the results have created the premises for future research. Building a sustainable future is a current and important concern in the governmental agenda. This means a fundamental change of the current business landscape, and analysis on sustainable business practices and performance management systems should be researched to achieve this goal. As the ESG becomes a standardized tool for measuring sustainability, allowing access to comparable historical data, it would be useful to extend the study to a longitudinal analysis.
Supplementary Materials
The following supporting information can be downloaded at: https://www.mdpi.com/article/10.3390/su14042069/s1: Figure S1. Histogram for basic materials sector (681); Figure S2. Scatterplots for basic materials sector (681): (a) Scatterplot of market cap and ESG score; (b) Scatterplot of market cap and value added; Figure S3. Scatterplot of market cap and residuals for basic materials sector (681); Figure S4. Market cap evolution for basic materials sector (681); Figure S5. Histogram for consumer cyclicals sector (1011); Figure S6. Scatterplots for consumer cyclicals sector (1011): (a) Scatterplot of market cap and ESG score; (b) scatterplot of market cap and value added; Figure S7. Scatterplot of market cap and residuals for consumer cyclicals sector (1011); Figure S8. Market cap evolution for consumer cyclicals sector (1011); Figure S9. Histogram for consumer non-cyclicals sector (526); Figure S10. Scatterplots for consumer non-cyclicals sector (526): (a) Scatterplot of market cap and ESG score; (b) scatterplot of market cap and value added; Figure S11. Scatterplot of market cap and residuals for consumer non-cyclicals sector (526); Figure S12. Market cap evolution for consumer non-cyclicals sector (526); Figure S13. Histogram for energy sector (388); Figure S14. Scatterplots for energy sector (388): (a) Scatterplot of market cap and ESG score; (b) scatterplot of market cap and value added; Figure S15. Scatterplot of market cap and residuals for energy sector (388); Figure S16. Market cap evolution for energy sector (388); Figure S17. Histogram for healthcare sector (645); Figure S18. Scatterplots for healthcare sector (645): (a) Scatterplot of market cap and ESG score; (b) scatterplot of market cap and value added; Figure S19. Scatterplot of market cap and residuals for healthcare sector (645); Figure S20. Market cap evolution for healthcare sector (645); Figure S21. Histogram for industrials sector (1100); Figure S22. Scatterplots for industrials sector (1100): (a) Scatterplot of market cap and ESG score; (b) scatterplot of market cap and value added; Figure S23. Scatterplot of market cap and residuals for industrials sector (1100); Figure S24. Market cap evolution for industrials sector (1100); Figure S25. Histogram for real estate sector (573); Figure S26. Scatterplots for real estate sector (573): (a) Scatterplot of market cap and ESG score; (b) scatterplot of market cap and value added; Figure S27. Scatterplot of market cap and residuals for real estate sector (573); Figure S28. Market cap evolution of real estate sector (573); Figure S29. Histogram for technology sector (348); Figure S30. Scatterplots for technology sector (348): (a) Scatterplot of market cap and ESG score; (b) scatterplot of market cap and value added; Figure S31. Scatterplot of market cap and residuals for technology sector (348); Figure S32. Market cap evolution of technology sector (348); Figure S33. Histogram for utilities sector (285); Figure S34. Scatterplots for utilities sector (285): (a) Scatterplot of market cap and ESG score; (b) scatterplot of market cap and value added; Figure S35. Scatterplot of market cap and residuals for utilities sector (285); Figure S36. Market cap evolution of utilities sector (285).
Author Contributions
Conceptualization, R.-A.Ș., D.M.M. and M.Ț.; methodology, R.-A.Ș. and M.Ț.; software, R.-A.Ș. and M.Ț.; validation, R.-A.Ș., D.M.M. and M.Ț.; formal analysis, M.Ț.; investigation, D.M.M.; resources, R.-A.Ș.; data curation, R.-A.Ș. and M.Ț.; writing—original draft preparation, R.-A.Ș. and D.M.M.; writing—review and editing, R.-A.Ș., D.M.M. and M.Ț.; visualization, R.-A.Ș.; supervision, D.M.M. and M.Ț.; project administration, R.-A.Ș.; funding acquisition, R.-A.Ș. All authors have read and agreed to the published version of the manuscript.
Funding
This research was funded by the Lucian Blaga University of Sibiu and Hasso Plattner Foundation research grants LBUS-IRG-2021-07.
Institutional Review Board Statement
Not applicable.
Informed Consent Statement
Not applicable.
Data Availability Statement
Data that support the findings of this study are available from Thomson Reuters Eikon (Refinitiv: London, UK). Restrictions apply to the availability of these data, which were used under license for this study. Data are available at https://emea1.apps.cp.thomsonreuters.com/web/Apps/Corp?app=true&s=JNJ&st=RIC (accessed on 12 July 2021) with the permission of Thomson Reuters Eikon.
Acknowledgments
Project financed by the Lucian Blaga University of Sibiu and Hasso Plattner Foundation research grants LBUS-IRG-2021-07.
Conflicts of Interest
The authors declare no conflict of interest. The funders had no role in the design of the study; in the collection, analyses, or interpretation of data; in the writing of the manuscript, or in the decision to publish the results.
Appendix A. Quantile Regressions
The appendix contains tables with the quantile regression results.
Table A1.
Quantile regressions: basic materials sector (681 *).
Table A1.
Quantile regressions: basic materials sector (681 *).
| Quantiles | Quantile Regression Equations |
|---|---|
| Q1 | |
| Q2 | |
| Q3 | |
| Q4 | |
| Q5 | |
| Q6 | |
| Q7 |
* No. of companies, X1 = ESG score; X2 = Value added, Source: Authors’ computation with IBM-SPSS.
Table A2.
Quantile regressions: consumer cyclicals sector (1011 *).
Table A2.
Quantile regressions: consumer cyclicals sector (1011 *).
| Quantiles | Quantile Regression Equations |
|---|---|
| Q1 | |
| Q2 | |
| Q3 | |
| Q4 | |
| Q5 | |
| Q6 | |
| Q7 |
* No. of companies, X1 = ESG score; X2 = Value added, Source: Authors’ computation with IBM-SPSS.
Table A3.
Quantile regressions: consumer non-cyclicals (526 *).
Table A3.
Quantile regressions: consumer non-cyclicals (526 *).
| Quantiles | Quantile Regression Equations |
|---|---|
| Q1 | |
| Q2 | |
| Q3 | |
| Q4 | |
| Q5 | |
| Q6 | |
| Q7 |
* No. of companies, X1 = ESG score; X2 = Value added, Source: Authors’ computation with IBM-SPSS.
Table A4.
Quantile regressions: energy sector (388 *).
Table A4.
Quantile regressions: energy sector (388 *).
| Quantiles | Quantile Regression Equations |
|---|---|
| Q1 | |
| Q2 | |
| Q3 | |
| Q4 | |
| Q5 | |
| Q6 | |
| Q7 |
* No. of companies, X1 = ESG score; X2 = Value added, Source: Authors’ computation with IBM-SPSS.
Table A5.
Quantile regressions: healthcare sector (645 *).
Table A5.
Quantile regressions: healthcare sector (645 *).
| Quantiles | Quantile Regression Equations |
|---|---|
| Q1 | |
| Q2 | |
| Q3 | |
| Q4 | |
| Q5 | |
| Q6 | |
| Q7 |
* No. of companies, X1 = ESG score; X2 = Value added, Source: Authors’ computation with IBM-SPSS.
Table A6.
Quantile regressions: industrials sector (1100 *).
Table A6.
Quantile regressions: industrials sector (1100 *).
| Quantiles | Quantile Regression Equations |
|---|---|
| Q1 | |
| Q2 | |
| Q3 | |
| Q4 | |
| Q5 | |
| Q6 | |
| Q7 |
* No. of companies, X1 = ESG score; X2 = Value added, Source: Authors’ computation with IBM-SPSS.
Table A7.
Quantile regressions: real estate sector (573 *).
Table A7.
Quantile regressions: real estate sector (573 *).
| Quantiles | Quantile Regression Equations |
|---|---|
| Q1 | |
| Q2 | |
| Q3 | |
| Q4 | |
| Q5 | |
| Q6 | |
| Q7 |
* No. of companies, X1 = ESG score; X2 = Value added, Source: Authors’ computation with IBM-SPSS.
Table A8.
Quantile regressions: technology sector (348 *).
Table A8.
Quantile regressions: technology sector (348 *).
| Quantiles | Quantile Regression Equations |
|---|---|
| Q1 | |
| Q2 | |
| Q3 | |
| Q4 | |
| Q5 | |
| Q6 | |
| Q7 |
* No. of companies, X1 = ESG score; X2 = Value added, Source: Authors’ computation with IBM-SPSS.
Table A9.
Quantile regressions: utilities sector (285 *).
Table A9.
Quantile regressions: utilities sector (285 *).
| Quantiles | Quantile Regression Equations |
|---|---|
| Q1 | |
| Q2 | |
| Q3 | |
| Q4 | |
| Q5 | |
| Q6 | |
| Q7 |
* No. of companies, X1 = ESG score; X2 = Value added, Source: Authors’ computation with IBM-SPSS.
References
- Bradley, B. ESG Investing for Dummies; John Wiley & Sons: Hoboken, NJ, USA, 2021. [Google Scholar]
- Hill, J. Environmental, Social, and Governance (ESG) Investing: A Balanced Analysis of the Theory and Practice of a Sustainable Portfolio; Academic Press: Cambridge, MA, USA, 2020. [Google Scholar]
- Fernandez, P. Valuation Using Multiples. How Do Analysts Reach Their Conclusions; IESE Business School: Barcelona, Spain, 2001; Volume 1, pp. 1–13. [Google Scholar]
- Kumar, M.P.; Kumara, N.M. Market capitalization: Pre and post COVID-19 analysis. Mater. Today Proc. 2021, 37, 2553–2557. [Google Scholar] [CrossRef]
- Ewing, B.T.; Thompson, M.A. The role of reserves and production in the market capitalization of oil and gas companies. Energy Policy 2016, 98, 576–581. [Google Scholar] [CrossRef]
- Diana, G. Repeated measures analysis on determinant factors of enterprise value. Procedia Econ. Financ. 2015, 32, 338–344. [Google Scholar] [CrossRef][Green Version]
- Tjahjadi, B. Factors affecting the enterprise performance. J. Econ. Bus. Account. Ventur. 2011, 14. [Google Scholar] [CrossRef]
- Dang, H.N.; Vu, V.T.T.; Ngo, T.X.; Hoang, H.T.V. Study the impact of growth, firm size, capital structure, and profitability on enterprise value: Evidence of enterprises in Vietnam. J. Corp. Account. Financ. 2019, 30, 144–160. [Google Scholar] [CrossRef]
- Landi, G.; Sciarelli, M. Towards a more ethical market: The impact of ESG rating on corporate financial performance. Soc. Responsib. J. 2019, 15, 11–27. [Google Scholar] [CrossRef]
- Al-Afeef, M.A.M. Factors affecting market capitalization: A practical study ase 1978–2019. Int. J. Sci. Technol. Res. 2020, 9, 7049–7053. [Google Scholar]
- Pavone, P. Market capitalization and financial variables: Evidence from Italian listed companies. Int. J. Acad. Res. Bus. Soc. Sci. 2019, 9, 1356–1371. [Google Scholar] [CrossRef]
- Mohammadi, A.; Shirazi, A.M.; Abbasi, A.; Akhlaghpour, S. Scenario planning of factors affecting market capitalization of Tehran stock exchange using system dynamics approach. J. Financ. Manag. Perspect. 2019, 26, 33–68. [Google Scholar]
- Zhu, W.; Wang, J. The relative relationship between employees income rate and enterprise value based on value added. Metal. Int. 2013, 18, 49. [Google Scholar]
- Walters, D.; Halliday, M.; Glaser, S. Added value, enterprise value and competitive advantage. Manag. Decis. 2002, 40, 823–833. [Google Scholar] [CrossRef]
- Signori, S.; San-Jose, L.; Retolaza, J.; Rusconi, G. Stakeholder value creation: Comparing ESG and value added in European companies. Sustainability 2021, 13, 1392. [Google Scholar] [CrossRef]
- Lorenc, S.; Kustra, A. Distributing Enterprise Value to Stakeholders in the Range of Sustainable Development on the Basis of the Energy Industry in Poland. Sustainability 2021, 13, 2130. [Google Scholar] [CrossRef]
- Galant, A.; Cadez, S. Corporate social responsibility and financial performance relationship: A review of measurement approaches. Econ. Res.-Ekon. Istraživanja 2017, 30, 676–693. [Google Scholar] [CrossRef]
- Lan, T.; Chen, Y.; Li, H.; Guo, L.; Huang, J. From driver to enabler: The moderating effect of corporate social responsibility on firm performance. Econ. Res.-Ekon. Istraživanja 2021, 34, 2240–2262. [Google Scholar] [CrossRef]
- Zhang, Y.; Cui, M. The impact of Corporate Social Responsibility on the enterprise value of China’s listed coal enterprises. Extr. Ind. Soc. 2020, 7, 138–145. [Google Scholar] [CrossRef]
- Liu, X.; Zhang, C. Corporate governance, social responsibility information disclosure, and enterprise value in China. J. Clean. Prod. 2017, 142, 1075–1084. [Google Scholar] [CrossRef]
- Schramade, W. Integrating ESG into valuation models and investment decisions: The value-driver adjustment approach. J. Sustain. Financ. Invest. 2016, 6, 95–111. [Google Scholar] [CrossRef]
- Taliento, M.; Favino, C.; Netti, A. Impact of environmental, social, and governance information on economic performance: Evidence of a corporate ‘sustainability advantage’ from Europe. Sustainability 2019, 11, 1738. [Google Scholar] [CrossRef]
- Wibbens, P.D.; Siggelkow, N. Introducing LIVA to measure long-term firm performance. Strateg. Manag. J. 2020, 41, 867–890. [Google Scholar] [CrossRef]
- Zumente, I.; Bistrova, J. ESG Importance for Long-Term Shareholder Value Creation: Literature vs. Practice. J. Open Innov. Technol. Mark. Complex. 2021, 7, 127. [Google Scholar] [CrossRef]
- Niccolò, N.; Battisti, E.; Papa, A.; Miglietta, N. Shareholder value and dividend policy: The role of ESG strategies. In Proceedings of the 2020 IEEE International Conference on Technology Management, Operations and Decisions (ICTMOD), Marrakech, Morocco, 24–27 November 2020; IEEE: Piscataway, NJ, USA, 2020. [Google Scholar]
- Cornell, B.; Shapiro, A.C. Corporate stakeholders, corporate valuation and ESG. Eur. Financ. Manag. 2021, 27, 196–207. [Google Scholar] [CrossRef]
- La Torre, M.; Mango, F.; Cafaro, A.; Leo, S. Does the esg index affect stock return? Evidence from the eurostoxx50. Sustainability 2020, 12, 6387. [Google Scholar] [CrossRef]
- Sung Kim, W.; Oh, S. Corporate social responsibility, business groups and financial performance: A study of listed Indian firms. Econ. Res.-Ekon. Istraživanja 2019, 32, 1777–1793. [Google Scholar]
- Li, Y.; Gong, M.; Zhang, X.-Y.; Koh, L. The impact of environmental, social, and governance disclosure on firm value: The role of CEO power. Br. Account. Rev. 2018, 50, 60–75. [Google Scholar] [CrossRef]
- Wong, W.C.; Batten, J.A.; Mohamed-Arshad, S.B.; Nordin, S.; Adzis, A.A. Does ESG certification add firm value? Financ. Res. Lett. 2021, 39, 101593. [Google Scholar] [CrossRef]
- Velte, P. Does ESG performance have an impact on financial performance? Evidence from Germany. J. Glob. Responsib. 2017, 8, 169–178. [Google Scholar] [CrossRef]
- Zhao, C.; Guo, Y.; Yuan, J.; Wu, M.; Li, D.; Zhou, Y.; Kang, J. ESG and corporate financial performance: Empirical evidence from China’s listed power generation companies. Sustainability 2018, 10, 2607. [Google Scholar] [CrossRef]
- Yoo, S.; Managi, S. Disclosure or action: Evaluating ESG behavior towards financial performance. Financ. Res. Lett. 2021, 44, 102108. [Google Scholar] [CrossRef]
- Fatemi, A.; Glaum, M.; Kaiser, S. ESG performance and firm value: The moderating role of disclosure. Glob. Financ. J. 2018, 38, 45–64. [Google Scholar] [CrossRef]
- Giese, G.; Lee, L.-E.; Melas, D.; Nagy, Z.; Nishikawa, L. Foundations of ESG investing: How ESG affects equity valuation, risk, and performance. J. Portf. Manag. 2019, 45, 69–83. [Google Scholar] [CrossRef]
- Miralles-Quirós, M.M.; Miralles-Quirós, J.L.; Hernández, J.R. ESG performance and shareholder value creation in the banking industry: International differences. Sustainability 2019, 11, 1404. [Google Scholar] [CrossRef]
- Ionescu, G.H.; Firoiu, D.; Pirvu, R.; Vilag, R.D. The impact of ESG factors on market value of companies from travel and tourism industry. Technol. Econ. Dev. Econ. 2019, 25, 820–849. [Google Scholar] [CrossRef]
- Alareeni, B.A.; Hamdan, A. ESG impact on performance of US S&P 500-listed firms. Corp. Gov. Int. J. Bus. Soc. 2020, 20, 1409–1428. [Google Scholar]
- Eriksson, J.; Asgodom, D. Perspectives of ESG Performance–A Study of ESG Performance Effect on Firm Value in the US; Lund University Libraries: Lund, Sweden, 2019. [Google Scholar]
- Atan, R.; Alam, M.M.; Said, J.; Zamri, M. The impacts of environmental, social, and governance factors on firm performance: Panel study of Malaysian companies. Manag. Environ. Qual. Int. J. 2018, 29, 182–194. [Google Scholar] [CrossRef]
- Aouadi, A.; Marsat, S. Do ESG controversies matter for firm value? Evidence from international data. J. Bus. Ethics 2018, 151, 1027–1047. [Google Scholar] [CrossRef]
- Ahmed, M.F.; Gao, Y.; Satchell, S. Modeling demand for ESG. Eur. J. Financ. 2021, 27, 1669–1683. [Google Scholar] [CrossRef]
- Deng, X.; Cheng, X. Can ESG Indices Improve the Enterprises’ Stock Market Performance?—An Empirical Study from China. Sustainability 2019, 11, 4765. [Google Scholar] [CrossRef]
- Friede, G.; Busch, T.; Bassen, A. ESG and financial performance: Aggregated evidence from more than 2000 empirical studies. J. Sustain. Financ. Invest. 2015, 5, 210–233. [Google Scholar] [CrossRef]
- Hassel, L.; Semenova, N. The Added Value of Environmental, Social and Governance Performance and Sustainable and Responsible Investment on Company and Portfolio Levels: What Can We Learn from Research. In CSR and Beyond: A Nordic Perspective; Midttun, A., Ed.; Cappelen Damm AS: Oslo, Norway, 2013; pp. 137–164. [Google Scholar]
- Koller, T.; Nuttall, R.; Henisz, W. Five Ways that ESG Creates Value. 2019. The McKinsey Quarterly. Available online: https://www.mckinsey.com/business-functions/strategy-and-corporate-finance/our-insights/five-ways-that-esg-creates-value (accessed on 10 August 2021).
- Kim, S.; Li, Z.F. Understanding the Impact of ESG Practices in Corporate Finance. Sustainability 2021, 13, 3746. [Google Scholar] [CrossRef]
- Sassen, R.; Hinze, A.-K.; Hardeck, I. Impact of ESG factors on firm risk in Europe. J. Bus. Econ. 2016, 86, 867–904. [Google Scholar] [CrossRef]
- Seth, A. Market Capitalization Defined. 18 August 2021. Investopedia. Available online: https://www.investopedia.com/investing/market-capitalization-defined/ (accessed on 10 August 2021).
- CFI. Market Capitalization. 2021. Corporate Finance Institute. Available online: https://corporatefinanceinstitute.com/resources/knowledge/finance/what-is-market-capitalization/#:~:text=What%20is%20Market%20Capitalization%3F,on%20a%20company's%20financial%20statements (accessed on 10 August 2021).
- CECCAR. Analiza Contului de Profit și Pierdere. CECCAR Business Magazine. 13–26 August 2019. Available online: https://www.ceccarbusinessmagazine.ro/analiza-contului-de-profit-si-pierdere-a5190/ (accessed on 18 October 2021).
- Muntean, M.; Solomon, D.C. Analiza Economico-Financiara Aprofundata; Editura Alma Mater: Bacau, Romania, 2015. (In Romanian) [Google Scholar]
- Mironiuc, M. Analiză Economico-Financiară. Performanţă, Poziţie Financiară, Risc; UAIC: Iași, Romania, 2009. (In Romanian) [Google Scholar]
- The Global Industry Classification Standard. 2021. MSCI. Available online: https://www.msci.com/our-solutions/indexes/gics (accessed on 7 July 2021).
- FTSE Russell. Industry Classification Benchmark (ICB). 2021. FTSE Russell. Available online: https://www.ftserussell.com/data/industry-classification-benchmark-icb (accessed on 5 July 2021).
- Hawkins, K. GICS vs. ICB Stock Classification: What’s the Difference? 5 April 2021. Investopedia. Available online: https://www.investopedia.com/articles/stocks/08/global-industry-classification-industrial-classification-benchmark.asp (accessed on 5 April 2021).
- Refinitiv. The Refinitiv Business Classification. 2021. Refinitiv. Available online: https://www.refinitiv.com/content/dam/marketing/en_us/documents/quick-reference-guides/trbc-business-classification-quick-guide.pdf (accessed on 5 July 2021).
- Refinitiv. An Overview of Environmental, Social and Corporate Governance—ESG. 2021. Refinitiv. Available online: https://www.refinitiv.com/en/financial-data/company-data/esg-data (accessed on 5 July 2021).
- Cohen, J. Multiple regression as a general data-analytic system. Psychol. Bull. 1968, 70, 426. [Google Scholar] [CrossRef]
- Field, A. Discovering Statistics Using IBM SPSS Statistics, 5th ed.; Sage: Thousand Oaks, CA, USA, 2018. [Google Scholar]
- Hayes, A.F. Introduction to Mediation, Moderation, and Conditional Process Analysis: A Regression-Based Approach; Guilford Publications: New York, NY, USA, 2017. [Google Scholar]
- Greene, W.H. Econometric Analysis; Pearson Education India: Delhi, India, 2003. [Google Scholar]
- Darlington, R.B.; Hayes, A.F. Regression Analysis and Linear Models; Guilford: New York, NY, USA, 2017. [Google Scholar]
- Wilcox, R.R. The Normal Curve and Outlier Detection, in Fundamentals of Modern Statistical Methods; Springer: Berlin/Heidelberg, Germany, 2010; pp. 29–45. [Google Scholar]
- Benoit, K. Linear Regression Models with Logarithmic Transformations; London School of Economics: London, UK, 2011; Volume 22, pp. 23–36. [Google Scholar]
- Koenker, R.; Hallock, K.F. Quantile regression. J. Econ. Perspect. 2001, 15, 143–156. [Google Scholar] [CrossRef]
- Rodriguez, R.N.; Yao, Y. Five things you should know about quantile regression. In Proceedings of the SAS Global Forum 2017 Conference, Orlando, FL, USA, 2–5 April 2017. [Google Scholar]
- Koenker, R.; Bassett, G., Jr. Regression quantiles. Econom. J. Econom. Soc. 1978, 46, 33–50. [Google Scholar] [CrossRef]
- Koenker, R. Quantile Regression; Cambridge University Press: New York, NY, USA, 2005. [Google Scholar]
- Hao, L.; Naiman, D.Q. Quantile Regression; Sage Publications: London, UK, 2007. [Google Scholar]
- Dye, S. Quantile Regression. Towards Data Science. 12 February 2020. Available online: https://towardsdatascience.com/quantile-regression-ff2343c4a03 (accessed on 15 August 2021).
- CFI. Variance Inflation Factor (VIF). 2021. Corporate Finance Institute. Available online: https://corporatefinanceinstitute.com/resources/knowledge/other/variance-inflation-factor-vif/ (accessed on 21 October 2021).
Publisher’s Note: MDPI stays neutral with regard to jurisdictional claims in published maps and institutional affiliations. |
© 2022 by the authors. Licensee MDPI, Basel, Switzerland. This article is an open access article distributed under the terms and conditions of the Creative Commons Attribution (CC BY) license (https://creativecommons.org/licenses/by/4.0/).