
BIM-Based Green Hospital Building Performance Pre-Evaluation: A Case Study


Abstract
:1. Introduction
2. Literature Review
3. Materials and Methods
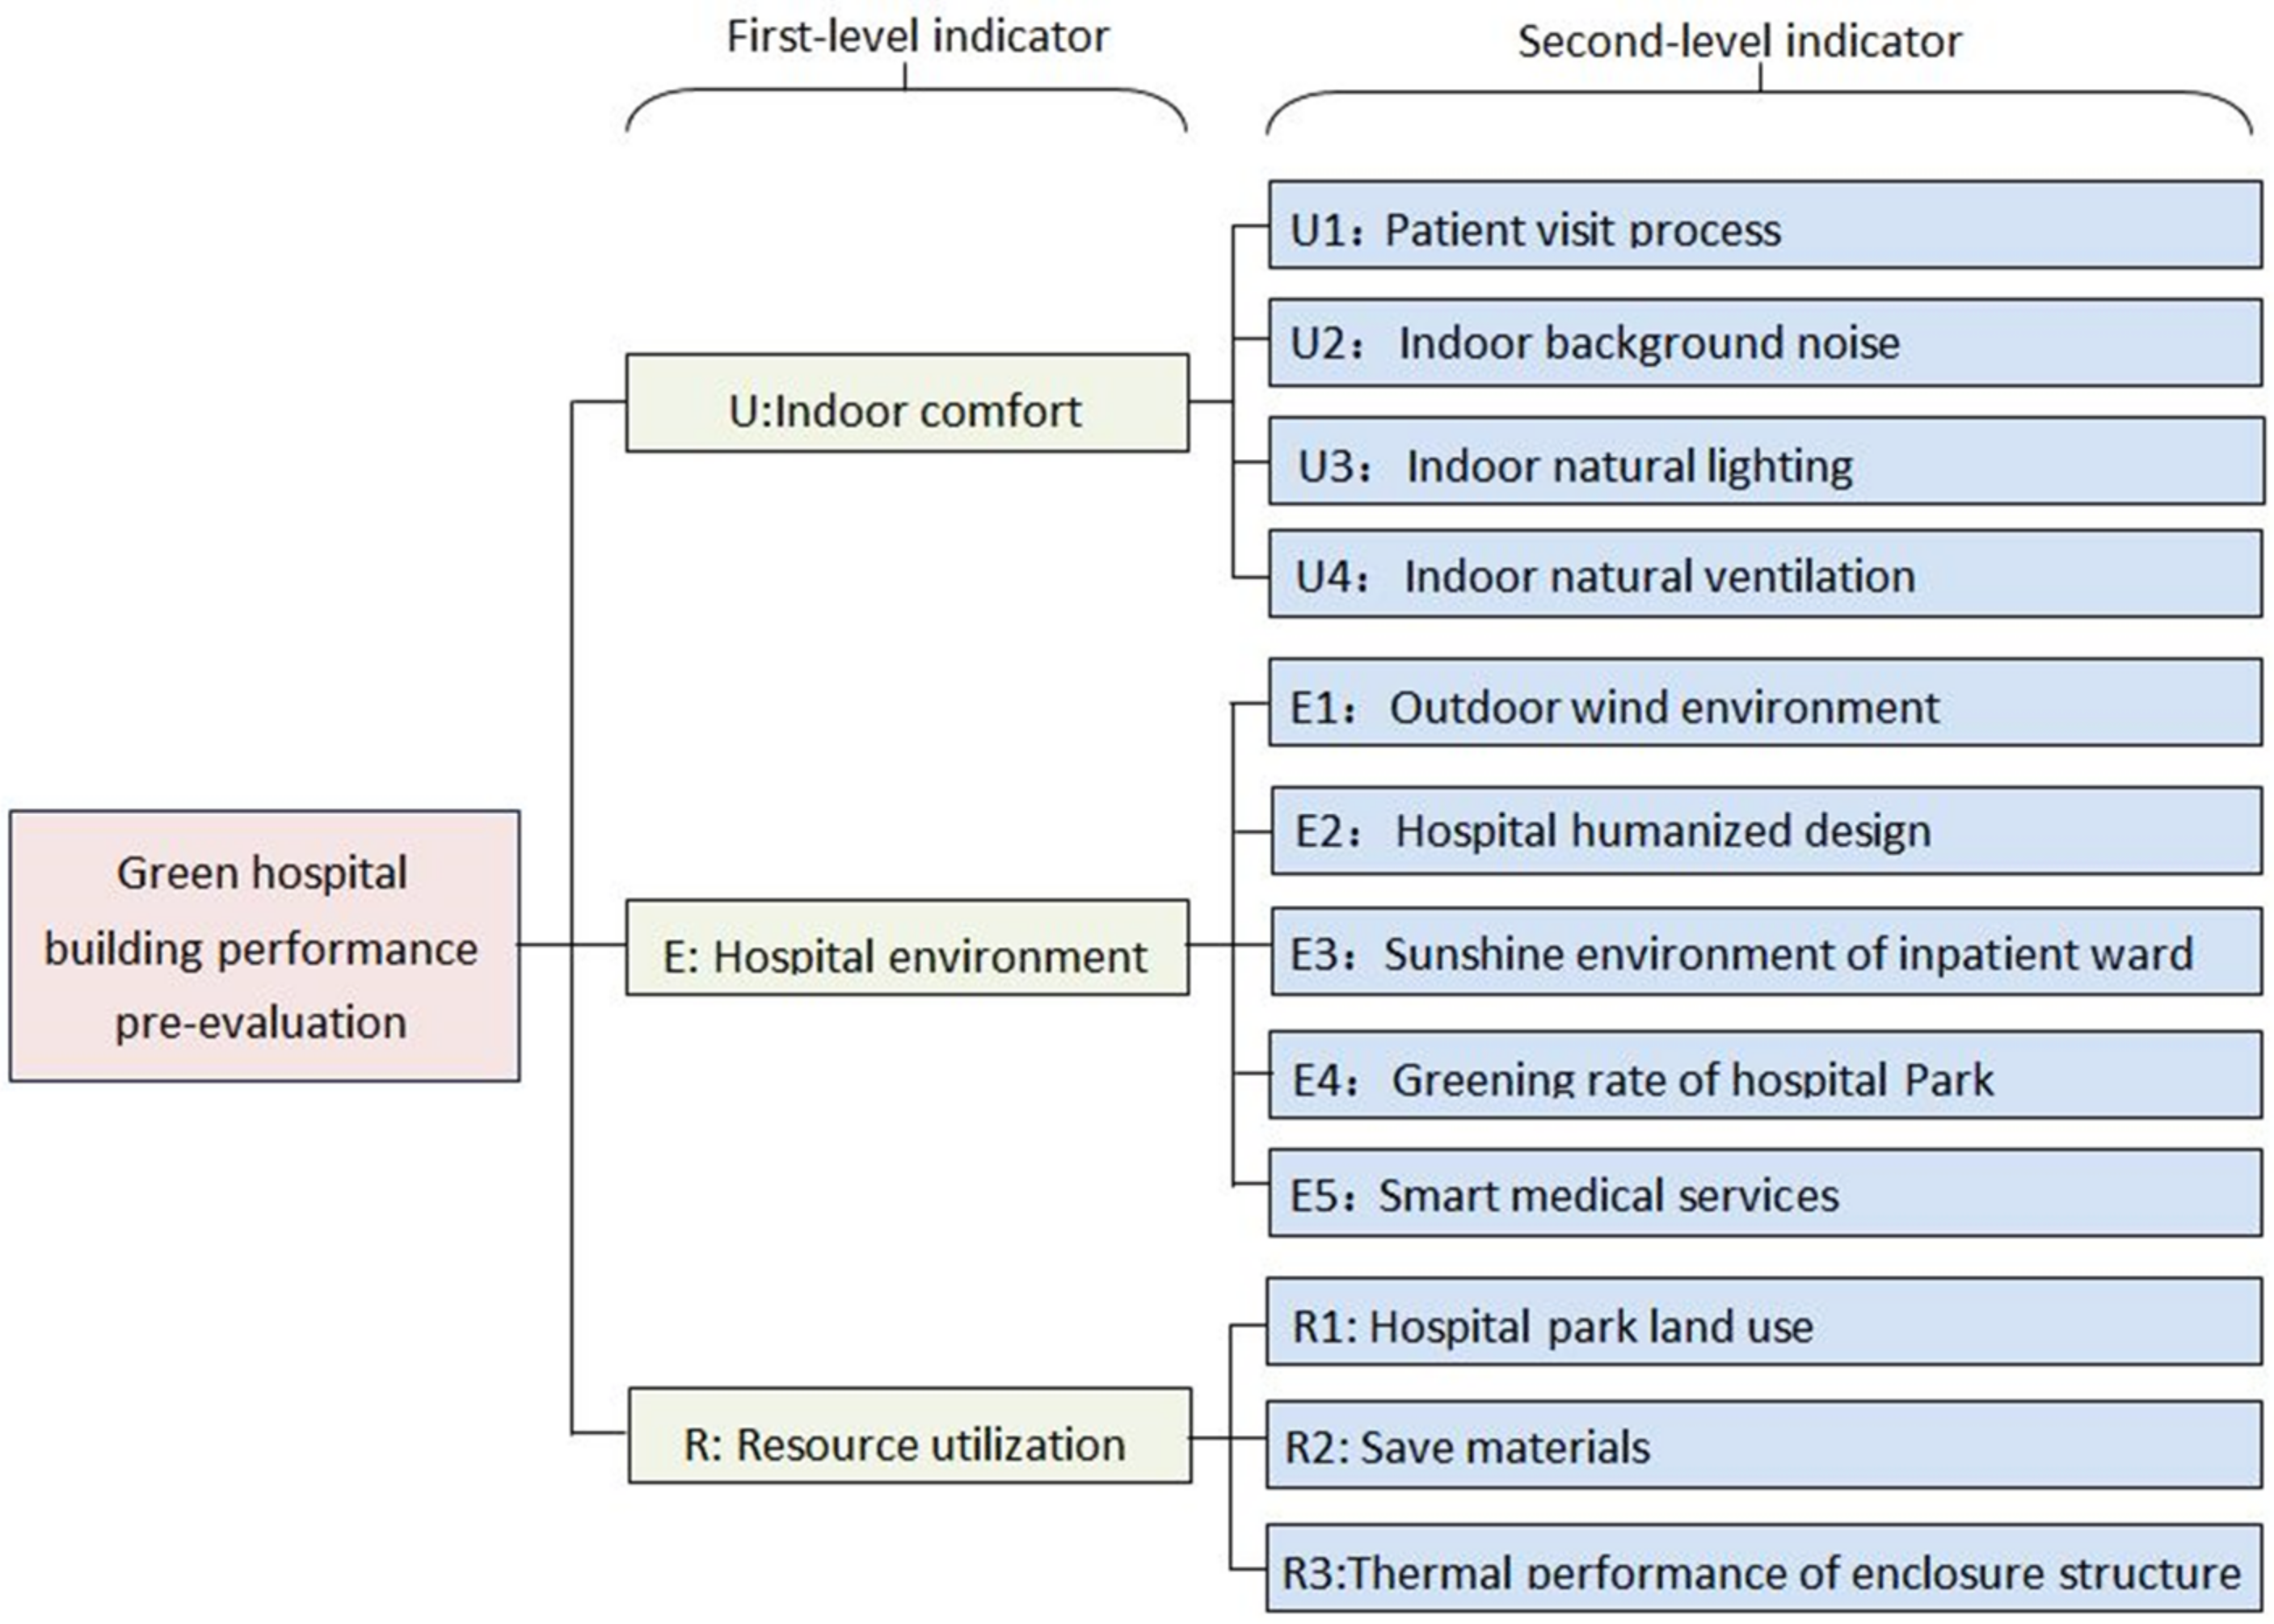
3.1. Performance Pre-Evaluation System Construction

| First-Level Indicator | Second-Level Indicator | Description | References | Weight | ||
|---|---|---|---|---|---|---|
| Subjective | Objective | Comprehensive | ||||
| U: Indoor comfort | U1: Patient visit process | Patients in the hospital registration, consultation, medicine and a series of medical services. | Sun [41], Giao [42], Zhou [43], Mazaheri Habibi [44], Wang [45]. | 0.2348 | 0.1337 | 0.1523 |
| U2: Indoor background noise | The envelope structure of the main functional space has good sound insulation performance and low indoor noise value. | Candas [21], Sadatsafavi [46], Nimlyat [47]. | 0.0899 | 0.1072 | 0.1040 | |
| U3: Indoor natural lighting | The indoor natural lighting of the main function space. | Jamshidi [48], Enache-Pommer [49], Candas [21], Sadatsafavi [46], Wood [50]. | 0.0198 | 0.0723 | 0.0626 | |
| U4: Indoor natural ventilation | Indoor ventilation of main functional space in the hospital building. | Enache-Pommer [49], Candas [21], Sadatsafavi [46], Wood [50]. | 0.0299 | 0.0814 | 0.0719 | |
| E: Hospital environment | E1: Outdoor wind environment | The wind environment of the outdoor space in different seasons should be conducive to walking and activities. | Wood [50], Buonomano [51]. | 0.0359 | 0.0344 | 0.0347 |
| E2: Hospital humanized design | Humanized design inside hospital building, outdoor rest place, privacy and eye-catching sign system. | Giao [42], Zhou [43], Jamshidi [48]. | 0.0494 | 0.0553 | 0.0542 | |
| E3: Sunshine environment of inpatient ward | Sunshine exposure in inpatient wards in different seasons. | Enache-Pommer [49], Sadatsafavi [46], Wood [50]. | 0.0858 | 0.0525 | 0.0586 | |
| E4: Greening rate of the hospital park | The greening situation in the hospital park can meet the ornamental and recuperative needs of inpatients and medical staff. | Jamshidi [48], Wood [50]. | 0.0291 | 0.0726 | 0.0646 | |
| E5: Smart medical services | Intelligent medical services and intelligent office systems. | Kim [52], Wang [45], Shen [53]. | 0.2348 | 0.0805 | 0.1088 | |
| R: Resource utilization | R1:Hospital parkland use | Hospital building land use. | Enache-Pommer [49], Candas [21]. | 0.1906 | 0.3102 | 0.0866 |
| R2: Save materials | The use of building materials in hospital architectural design. | Enache-Pommer [49], Candas [21], Wood [50]. | 0.0404 | 0.0993 | 0.0885 | |
| R3: Thermal performance of envelope structure | The thermal insulation performance of the envelope can achieve the purpose of energy saving. | Enache-Pommer [49], Buonomano [51]. | 0.1211 | 0.1114 | 0.1131 | |
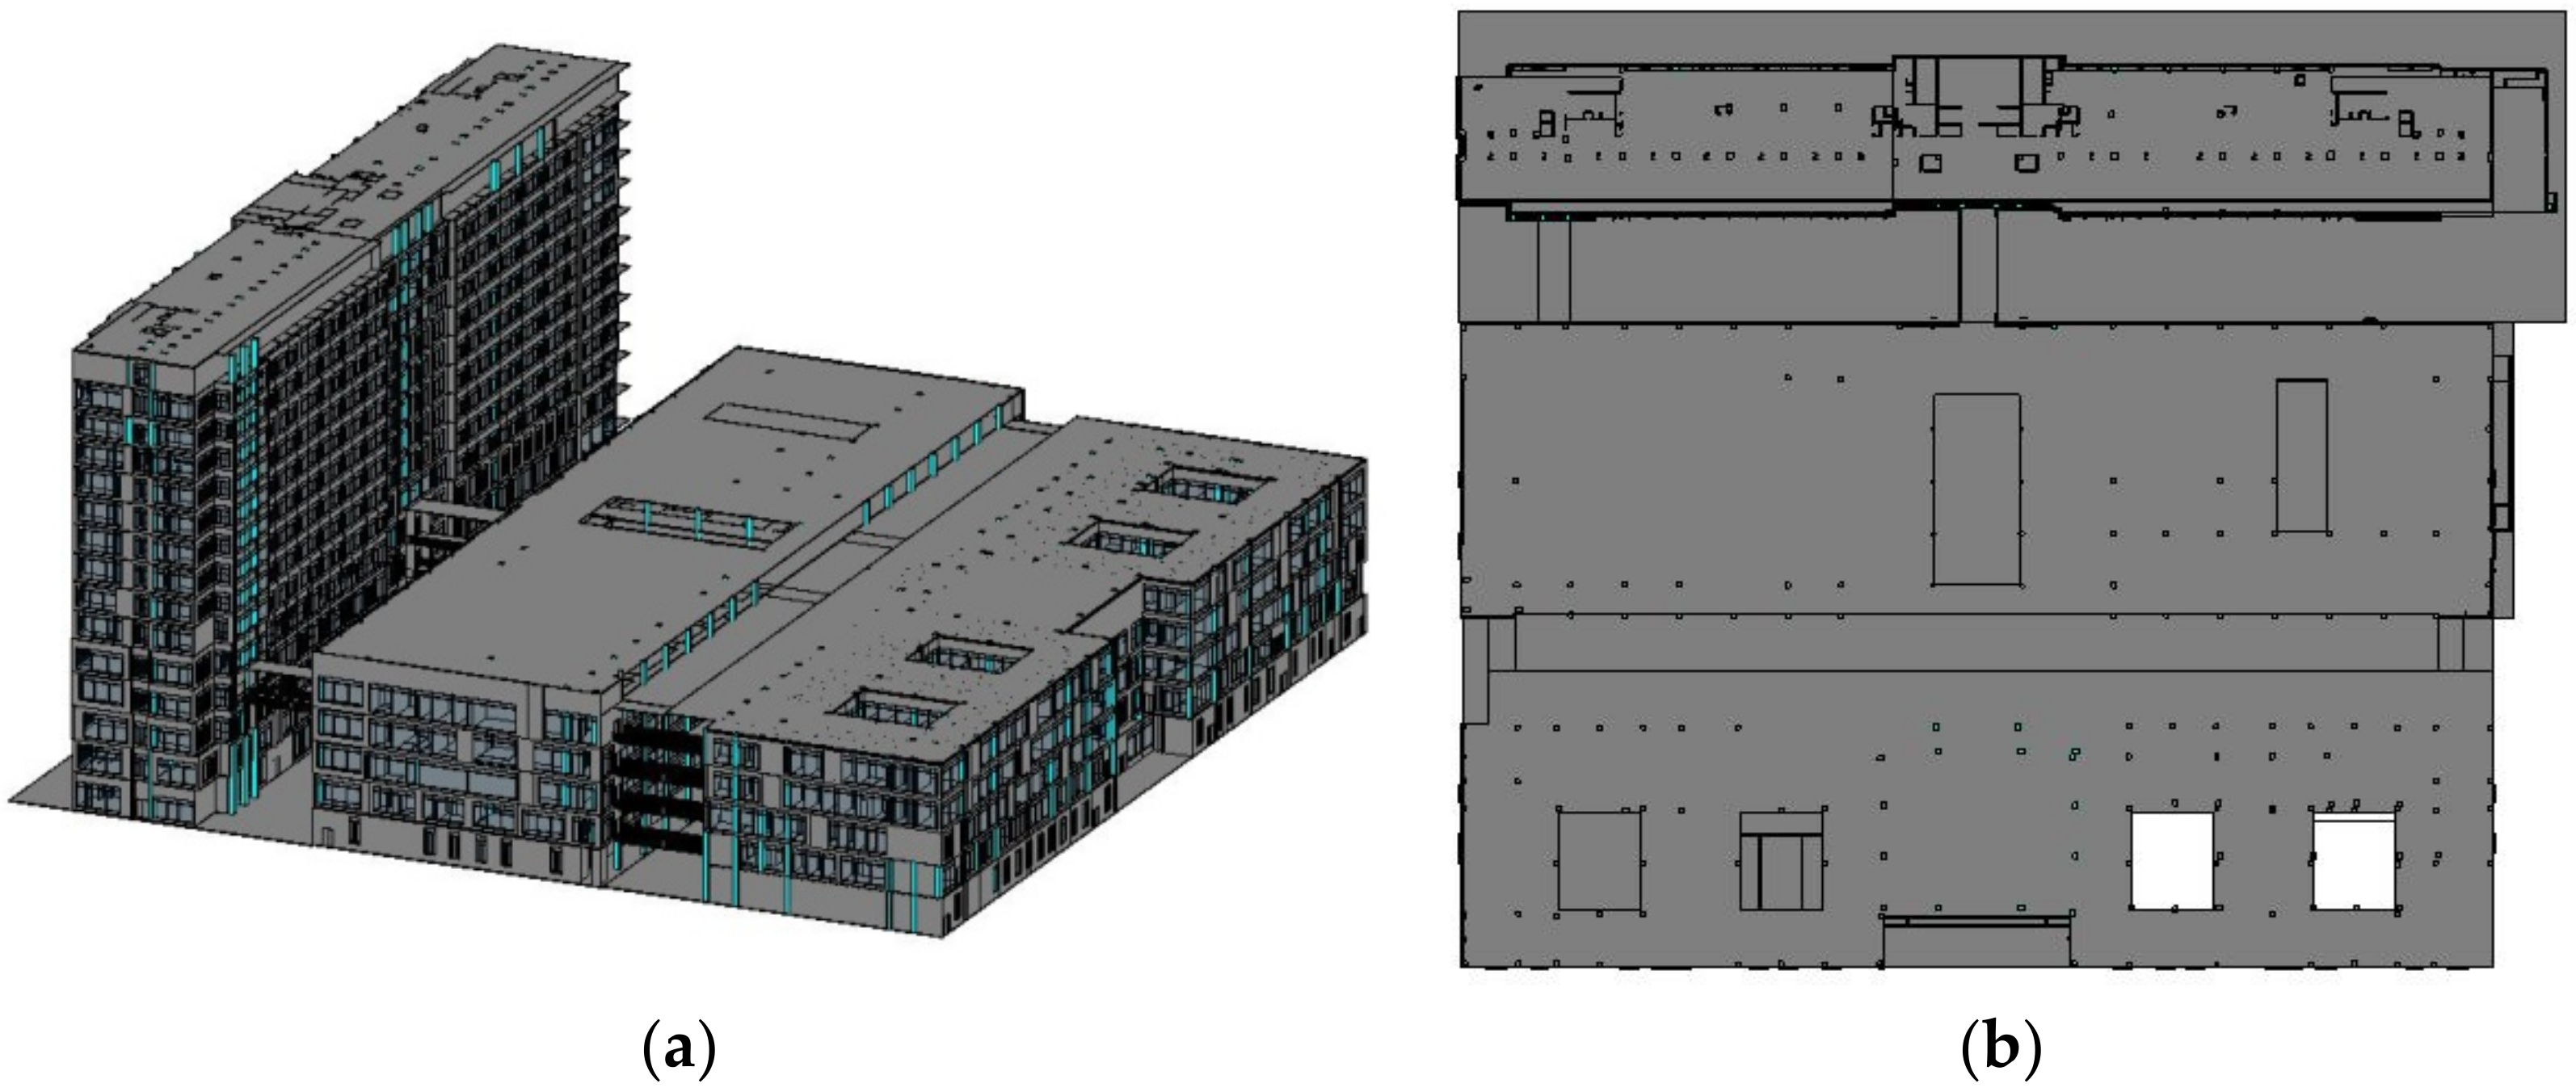
3.2. The BIM Model Construction
3.3. Green Hospital Building Performance Evaluation and Optimization
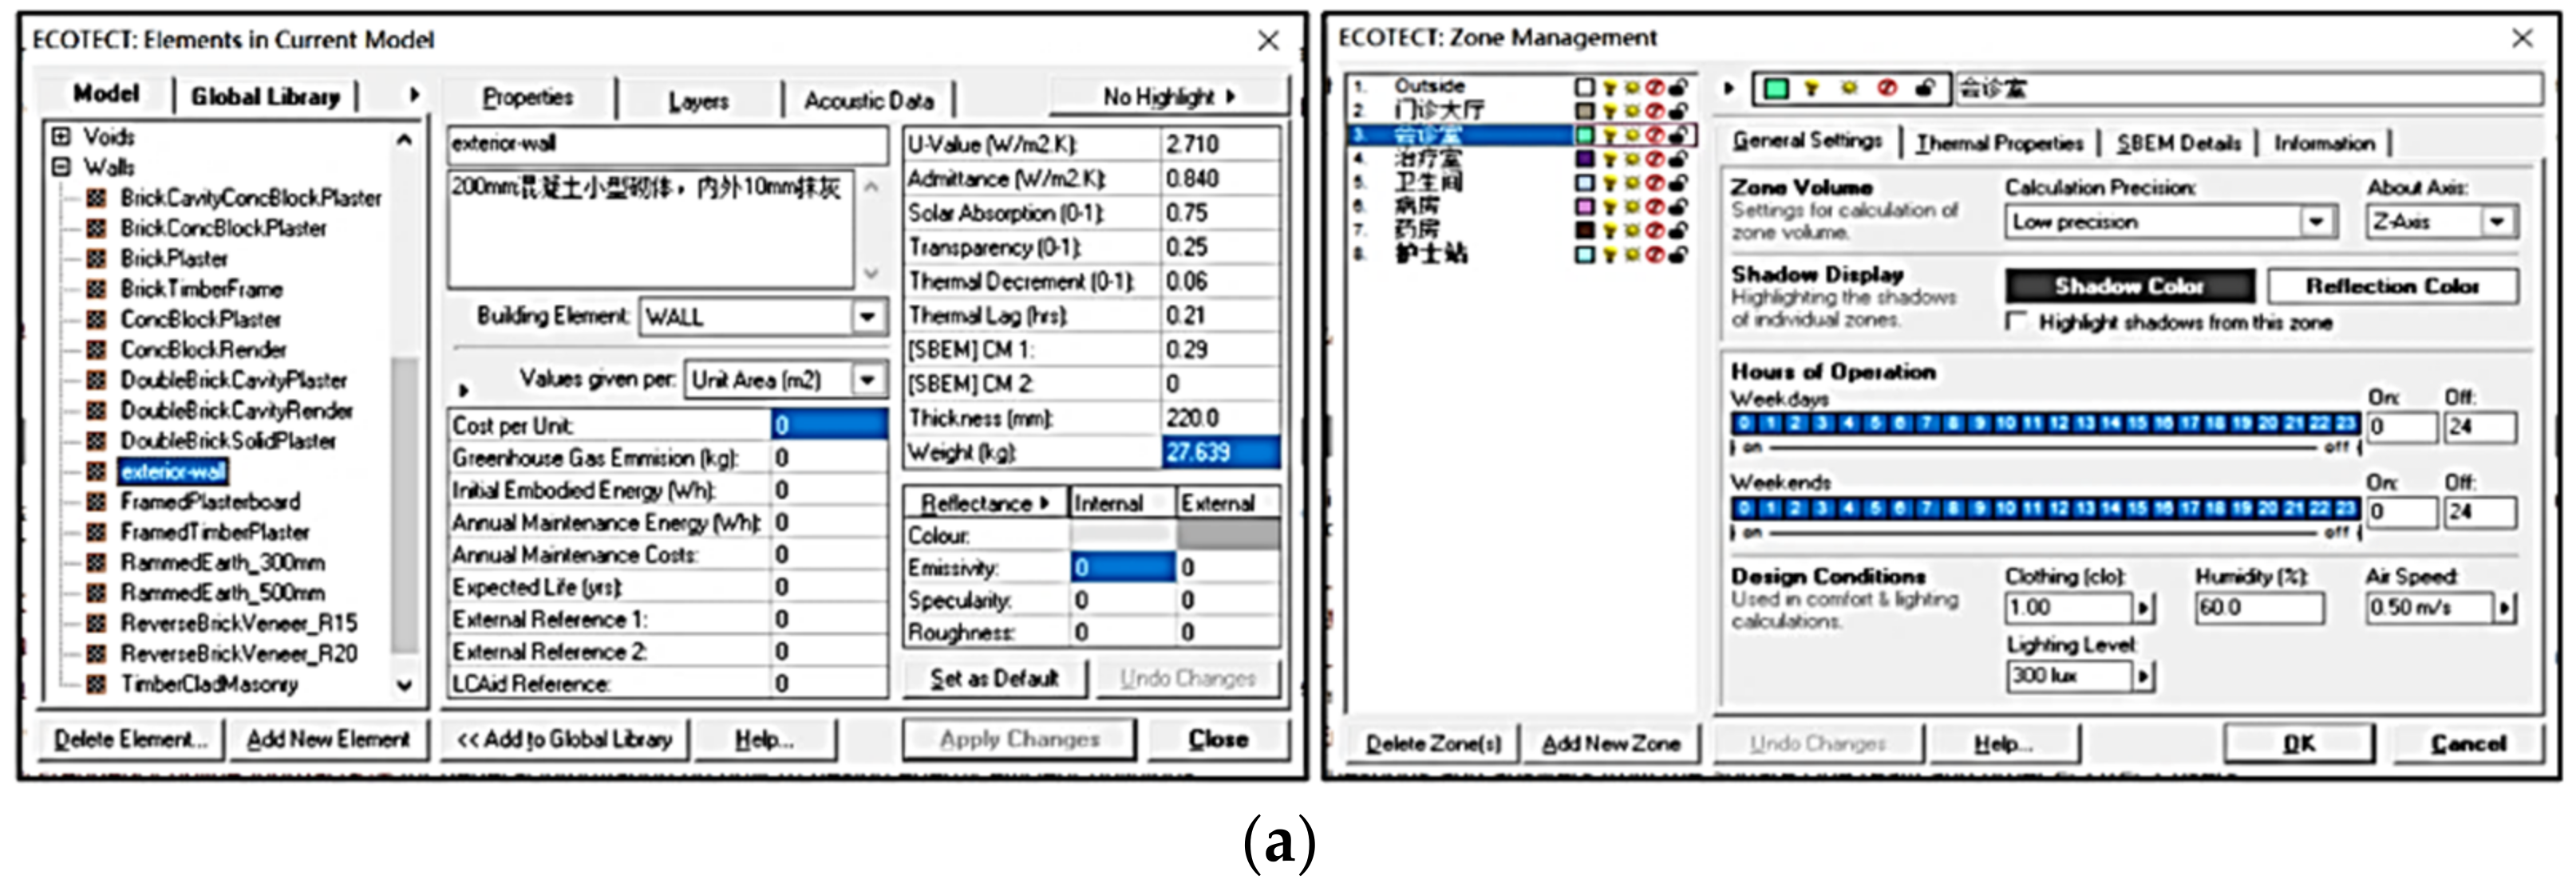
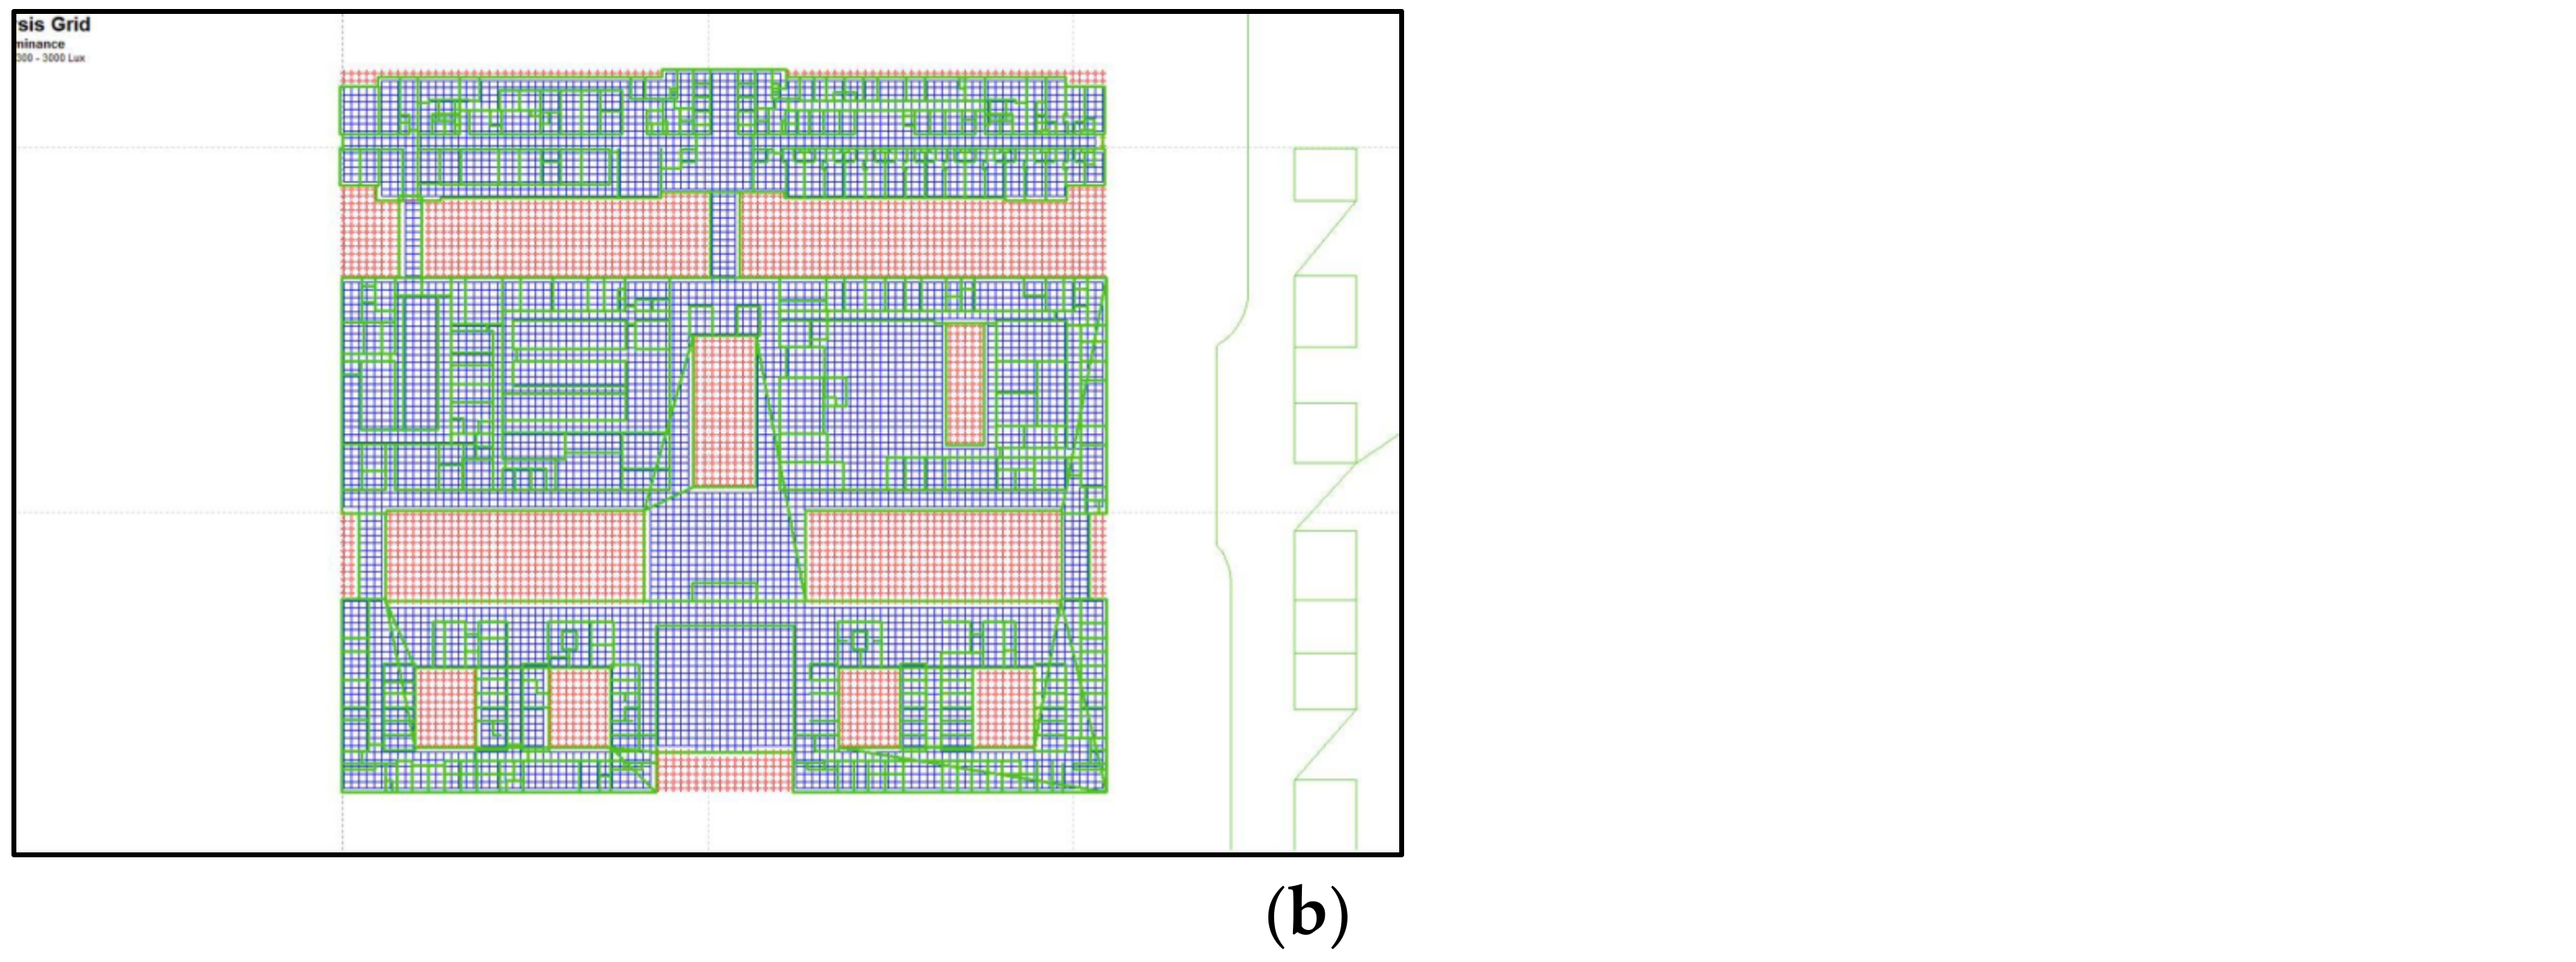
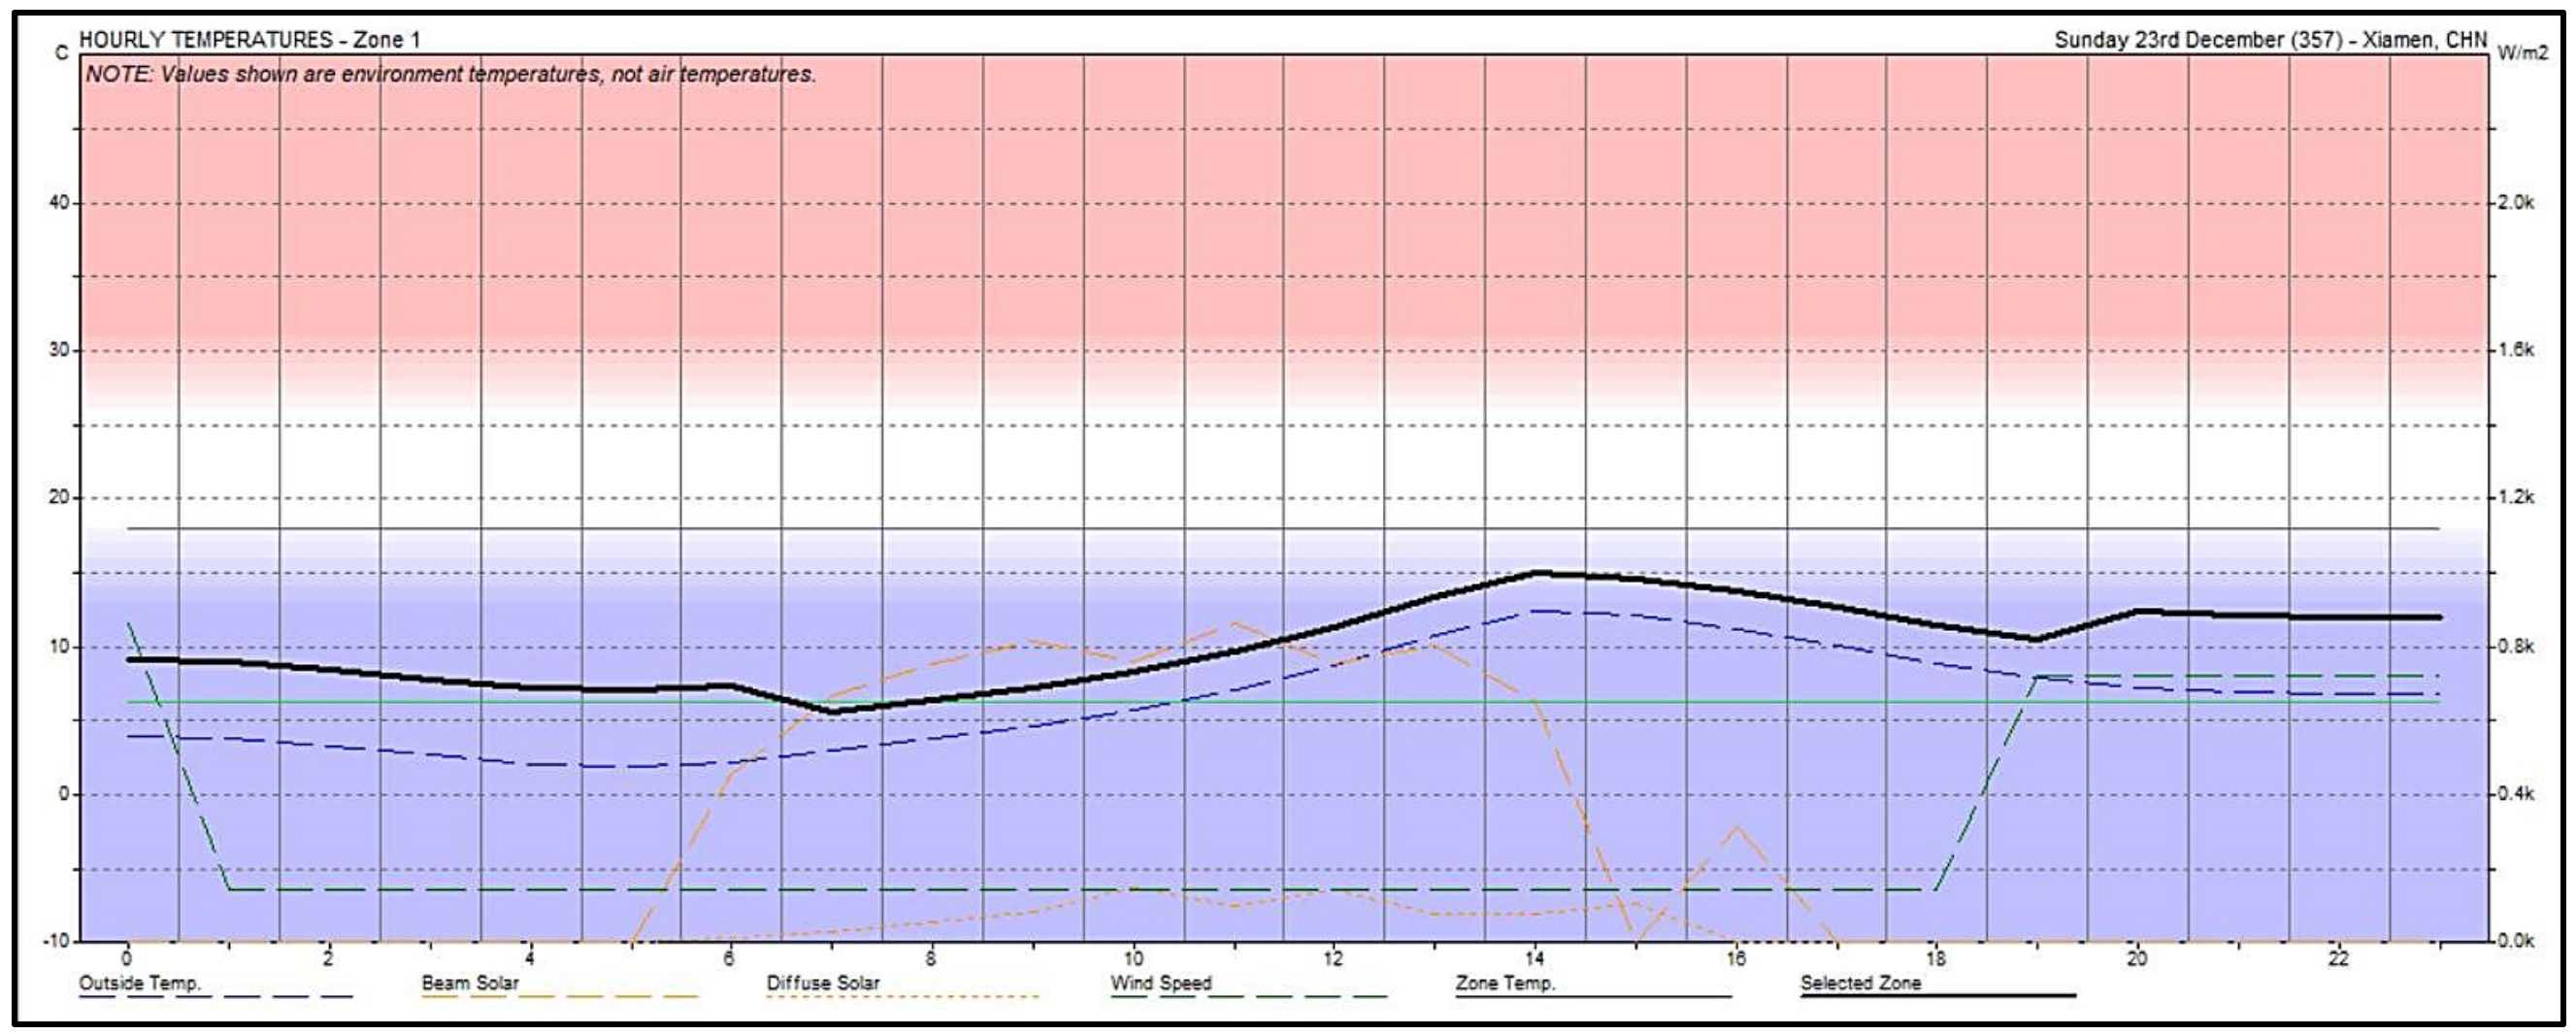
3.3.1. Performance Simulation
3.3.2. Performance Evaluation
- (1)
- The membership degree of secondary indicators determination
- (2)
- The membership degree of first-level indicators determination
- (3)
- Green grade determination
3.3.3. Performance Optimization Measures
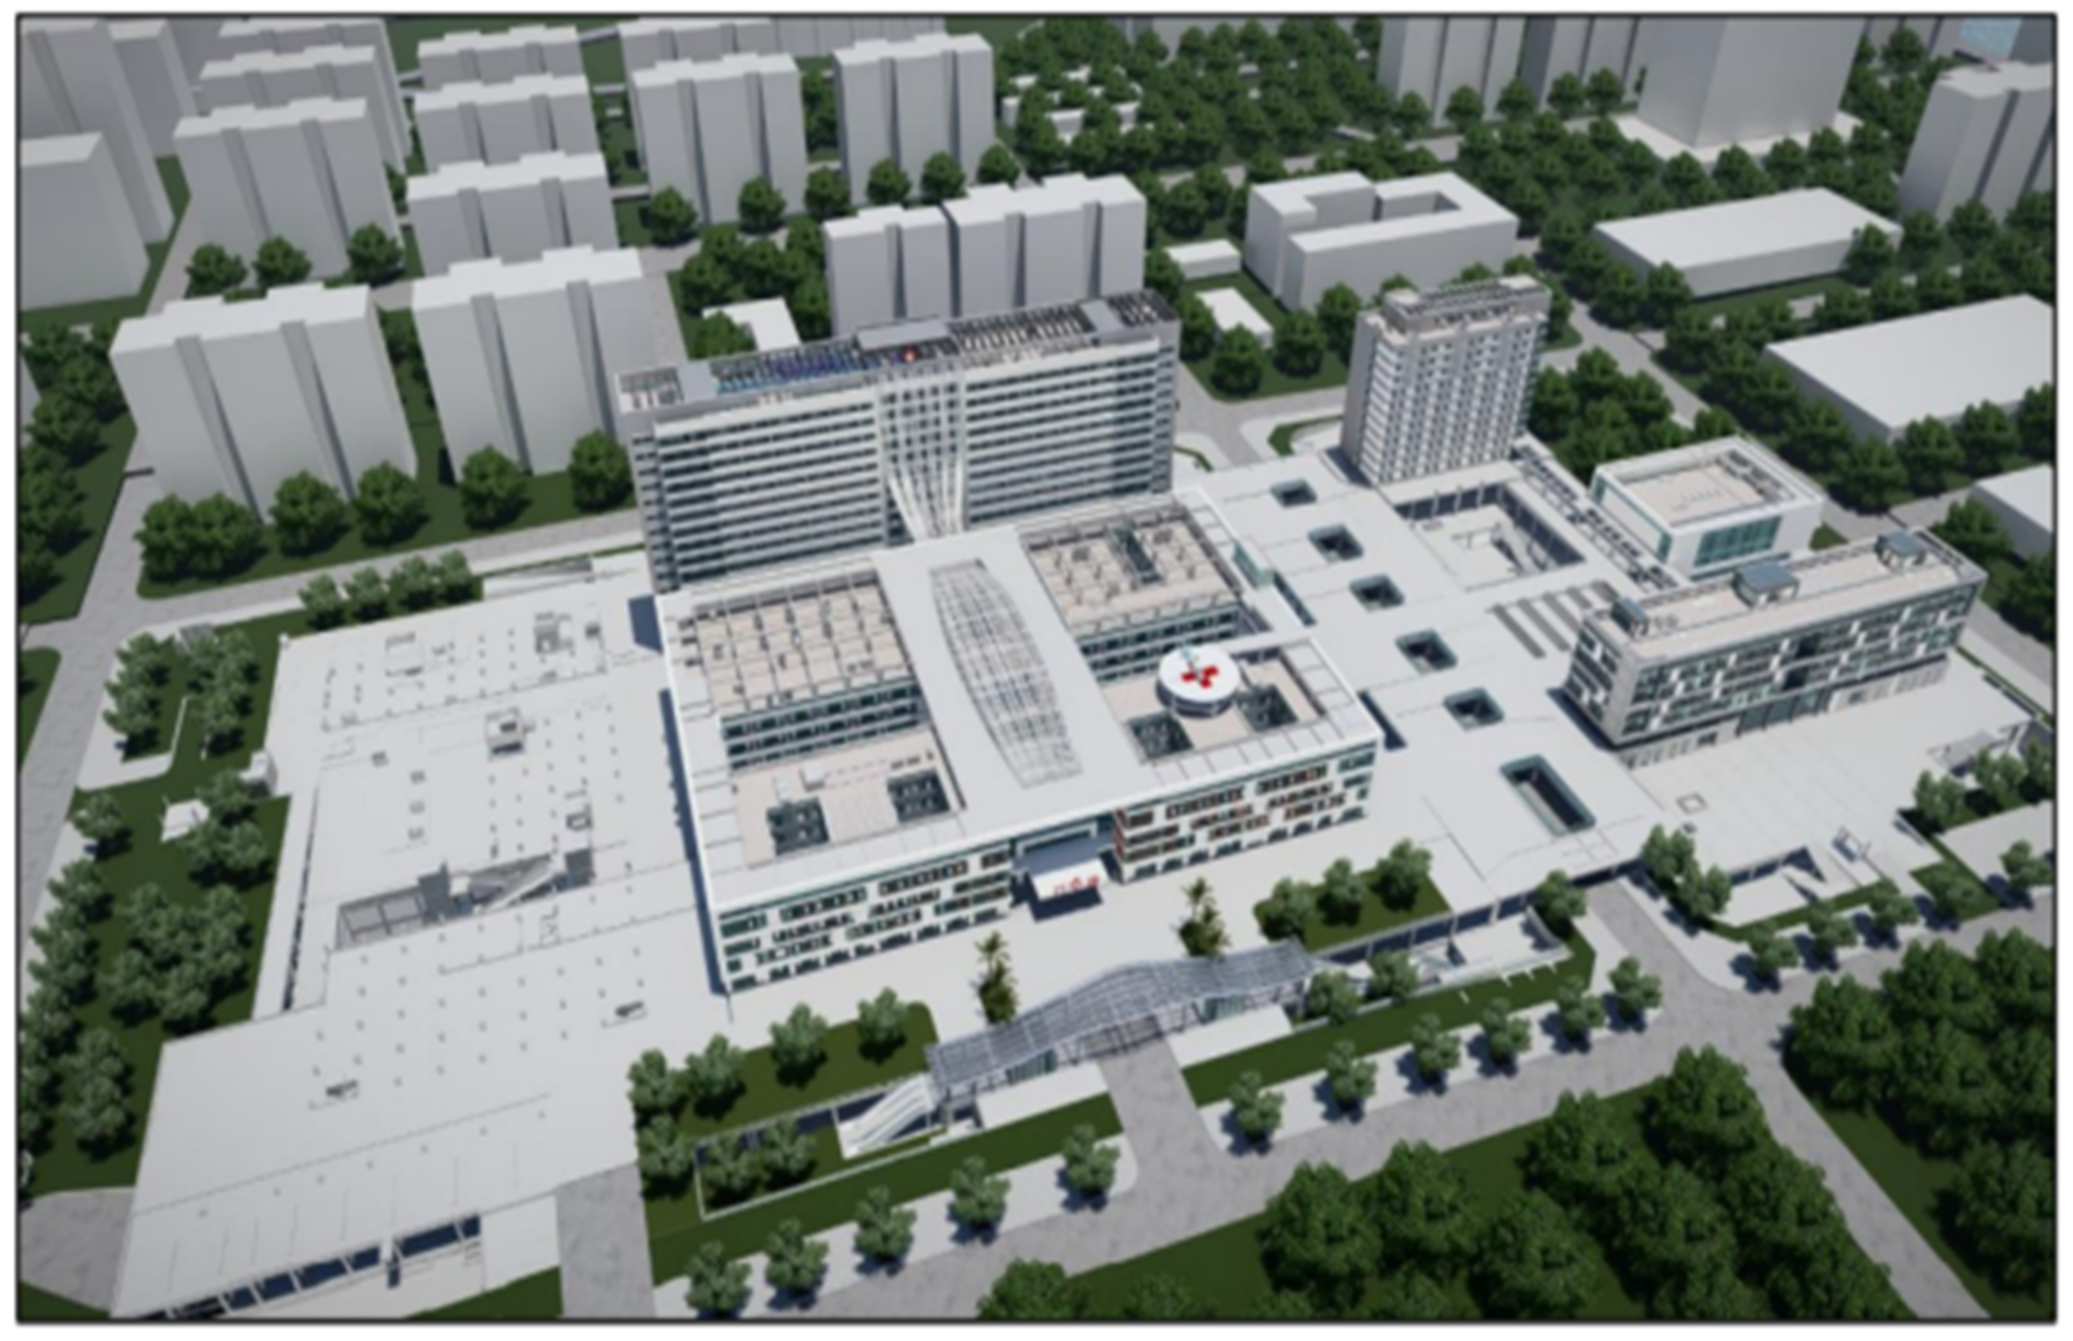
4. Case Study
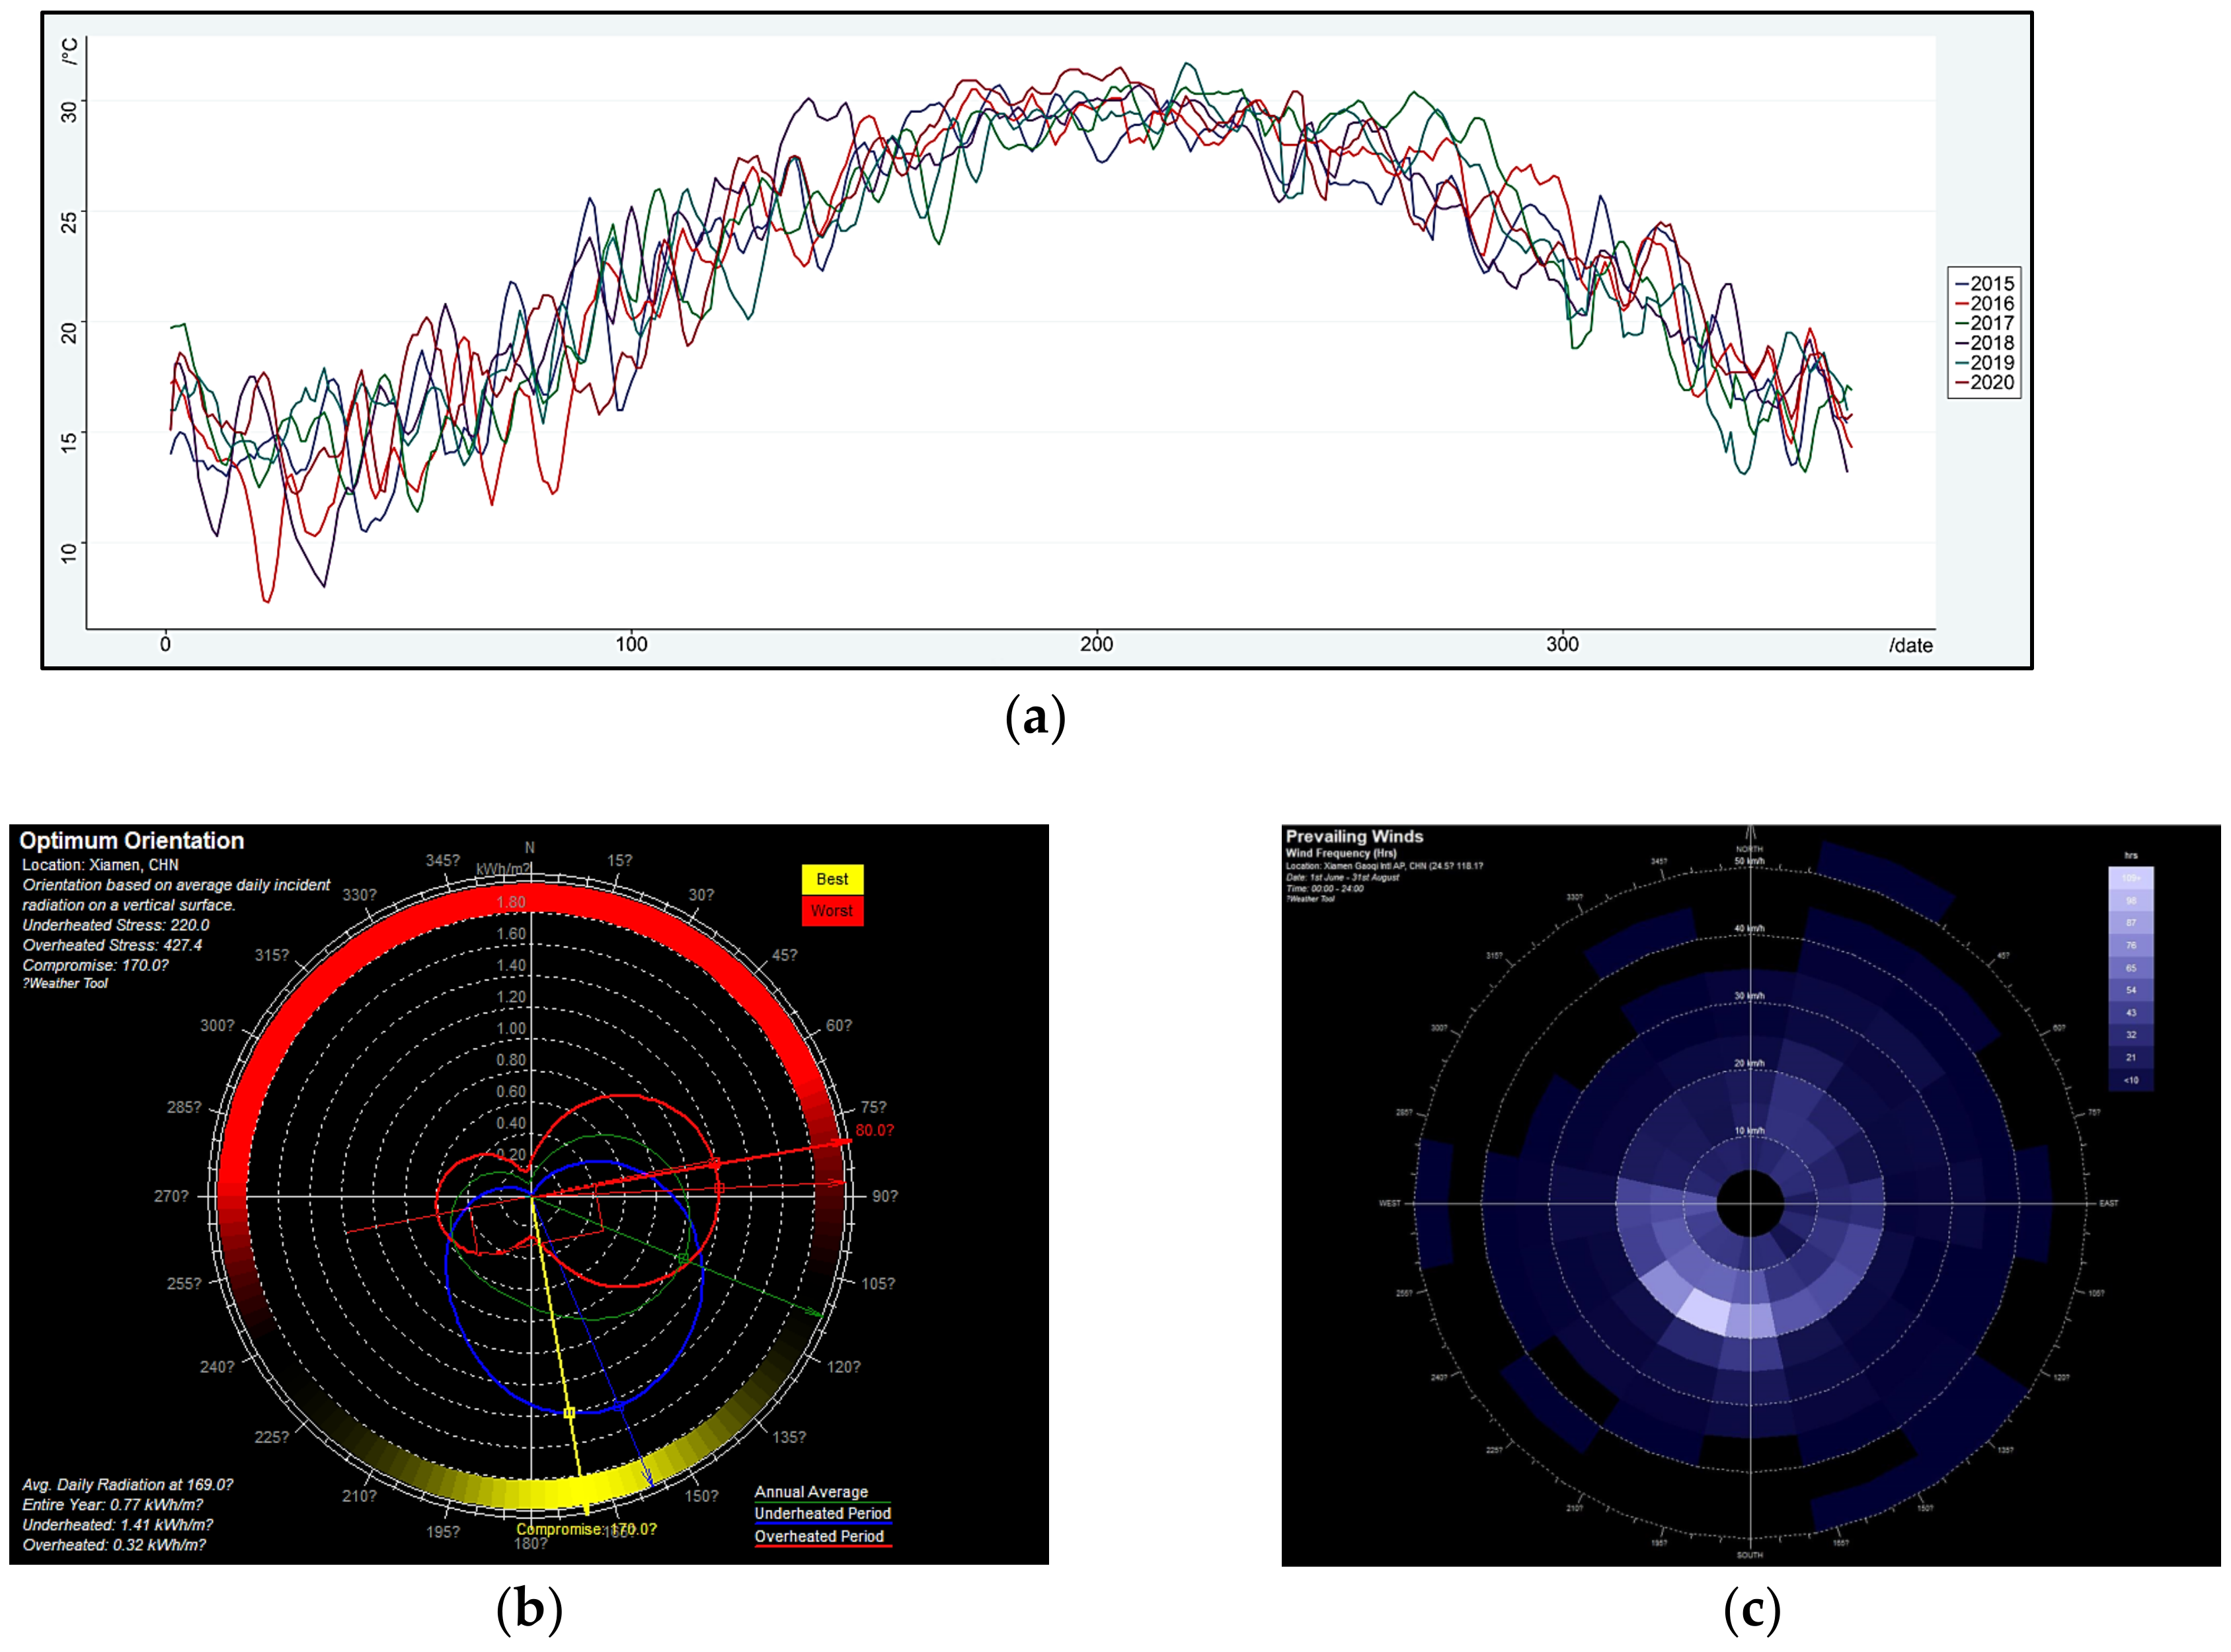
4.1. Case Background
4.2. Building Performance Simulation
4.3. Building Performance Evaluation
- (1)
- Project Score
- (2)
- Project green level
- (1)
- Five second-level indicators arrive at the 3-star standard, including U4, E2, E3, E4, R1 and the first-level indicator of E also meets the 3-star standard. The result demonstrates that the hospital has an excellent environment.
- (2)
- The second-level indicators are mostly the 2-star level. Among those indicators, E5’s degree is close to the 1-star and 2-star, for which their trends to 3-star is the worst. Therefore, it should be optimized and improved based on the calculation results of membership degrees.
- (3)
- U and R both reached the 2-star level, which is consistent with the comprehensive green level of the hospital. However, it can be observed that the index of indoor comfort has the worst tendency to develop to the 3-star level, which should be optimized and improved accordingly.
4.4. Building Performance Optimization
- (1)
- Improve the level of hospital intelligence
- (2)
- Reduce the opening area of the outer window
- (3)
- Improve the convenience of the medical treatment process
5. Discussion
6. Conclusions
Author Contributions
Funding
Institutional Review Board Statement
Informed Consent Statement
Data Availability Statement
Acknowledgments
Conflicts of Interest
Appendix A
| Item | Category | Frequency | Proportion |
|---|---|---|---|
| Employer | China Academy of Building Research | 7 | 33.33% |
| Hospital Infrastructure Department | 5 | 23.81% | |
| Architecture Design Institute | 9 | 42.86% | |
| Working hours (year) | <5 | 2 | 9.52% |
| 5–10 | 6 | 28.57% | |
| 10–15 | 8 | 38.10% | |
| 15–20 | 3 | 14.29% | |
| >20 | 3 | 14.29% | |
| Education background | Junior College | 3 | 14.29% |
| College | 9 | 42.86% | |
| Master | 7 | 33.33% | |
| Doctor | 2 | 9.52% | |
| Seniority | Primary | 5 | 23.81% |
| Intermediate | 13 | 61.90% | |
| Senior | 3 | 14.29% |
References
- Zhong, S.; Zhao, J.; Li, W.; Li, H.; Deng, S.; Li, Y.; Hussain, S.; Wang, X.; Zhu, J. Quantitative analysis of information interaction in building energy systems based on mutual information. Energy 2021, 214, 118867. [Google Scholar] [CrossRef]
- Liu, X.; Ding, Y.; Tang, H.; Xiao, F. A data mining-based framework for the identification of daily electricity usage patterns and anomaly detection in building electricity consumption data. Energy Build. 2021, 231, 110601. [Google Scholar] [CrossRef]
- Yazdani, M.; Kabirifar, K.; Frimpong, B.E.; Shariati, M.; Mirmozaffari, M.; Boskabadi, A. Improving construction and demolition waste collection service in an urban area using a simheuristic approach: A case study in Sydney, Australia. J. Clean. Prod. 2021, 280, 124138. [Google Scholar] [CrossRef]
- Energy Information Administration, Department of Energy. 2018 Commercial Buildings Energy Consumption Survey. Available online: www.eia.gov/consumption/commercial (accessed on 4 January 2022).
- Bharara, T.; Gur, R.; Duggal, S.D.; Jena, P.; Khatri, S.; Sharma, P. Green Hospital Initiative by a North Delhi Tertiary Care Hospital: Current Scenario and Future Prospects. J. Clin. Diagn. Res. 2018, 12, DC10–DC14. [Google Scholar] [CrossRef]
- Taseli, B.K.; Kilkis, B. Ecological sanitation, organic animal farm, and cogeneration: Closing the loop in achieving sustainable development—A concept study with on-site biogas fueled trigeneration retrofit in a 900-bed university hospital. Energy Build. 2016, 129, 102–119. [Google Scholar] [CrossRef]
- Ji, R.; Qu, S. Investigation and Evaluation of Energy Consumption Performance for Hospital Buildings in China. Sustainability 2019, 11, 1724. [Google Scholar] [CrossRef] [Green Version]
- Li, Y.; Pan, X.; Han, Y.; Taylor, J.E. Sustainable Healthcare Facilities: A Scoping Review. J. Constr. Eng. Manag. 2021, 147, 03121007. [Google Scholar] [CrossRef]
- Hossain, M.F. Green science: Advanced building design technology to mitigate energy and environment. Renew. Sustain. Energy Rev. 2018, 81, 3051–3060. [Google Scholar] [CrossRef]
- Chi, B.; Lu, W.; Ye, M.; Bao, Z.; Zhang, X. Construction waste minimization in green building: A comparative analysis of LEED-NC 2009 certified projects in the US and China. J. Clean. Prod. 2020, 256, 120749. [Google Scholar] [CrossRef]
- Keller, R.L.; Muir, K.; Roth, F.; Jattke, M.; Stucki, M. From bandages to buildings: Identifying the environmental hotspots of hospitals. J. Clean. Prod. 2021, 319, 128479. [Google Scholar] [CrossRef]
- Gomes, M.G.; Rodrigues, A.M.; Natividade, F. Thermal and energy performance of medical offices of a heritage hospital building. J. Build. Eng. 2021, 40, 102349. [Google Scholar] [CrossRef]
- Nimlyat, P.S.; Kandar, M.Z. Appraisal of indoor environmental quality (IEQ) in healthcare facilities: A literature review. Sustain. Cities Soc. 2015, 17, 61–68. [Google Scholar] [CrossRef]
- Nilashi, M.; Zakaria, R.; Ibrahim, O.; Majid, M.Z.A.; Mohamad Zin, R.; Chugtai, M.W.; Zainal Abidin, N.I.; Sahamir, S.R.; Aminu Yakubu, D. A knowledge-based expert system for assessing the performance level of green buildings. Knowl.-Based Syst. 2015, 86, 194–209. [Google Scholar] [CrossRef]
- Kim, S.; Osmond, P. Analyzing green building rating tools for healthcare buildings from the building user’s perspective. Indoor Built Environ. 2013, 23, 757–766. [Google Scholar] [CrossRef]
- Andrés, S.; Solar, P.d.; Peña, A.d.l.; Vivas, M.D. Implementation of BIM in Spanish construction industry = Implementación BIM en la industria española de la construcción. Build. Manag. 2017, 1, 1–8. [Google Scholar] [CrossRef] [Green Version]
- Jiang, S.; Wang, N.; Wu, J. Combining BIM and Ontology to Facilitate Intelligent Green Building Evaluation. J. Comput. Civ. Eng. 2018, 32, 04018039. [Google Scholar] [CrossRef]
- Mustaffa, N.K.; Mat Isa, C.M.; Che Ibrahim, C.K.I. Top-down bottom-up strategic green building development framework: Case studies in Malaysia. Build. Environ. 2021, 203, 108052. [Google Scholar] [CrossRef]
- Chen, L.; Chan, A.P.C.; Owusu, E.K.; Darko, A.; Gao, X. Critical success factors for green building promotion: A systematic review and meta-analysis. Build. Environ. 2022, 207, 108452. [Google Scholar] [CrossRef]
- Ryan-Fogarty, Y.; O’Regan, B.; Moles, R. Greening healthcare: Systematic implementation of environmental programmes in a university teaching hospital. J. Clean. Prod. 2016, 126, 248–259. [Google Scholar] [CrossRef] [Green Version]
- Candaş, A.B.; Tokdemir, O.B. A unified approach to evaluate green hospitals’ certification criteria. J. Constr. Eng. Manag. Innov. 2019, 2, 157–166. [Google Scholar] [CrossRef]
- Ferrari, S.; Zoghi, M.; Blázquez, T.; Dall’O’, G. New Level(s) framework: Assessing the affinity between the main international Green Building Rating Systems and the european scheme. Renew. Sustain. Energy Rev. 2022, 155, 111924. [Google Scholar] [CrossRef]
- Licina, D.; Langer, S. Indoor air quality investigation before and after relocation to WELL-certified office buildings. Build. Environ. 2021, 204, 108182. [Google Scholar] [CrossRef]
- Licina, D.; Yildirim, S. Occupant satisfaction with indoor environmental quality, sick building syndrome (SBS) symptoms and self-reported productivity before and after relocation into WELL-certified office buildings. Build. Environ. 2021, 204, 108183. [Google Scholar] [CrossRef]
- Chamseddine, A.; Alameddine, I.; Hatzopoulou, M.; El-Fadel, M. Seasonal variation of air quality in hospitals with indoor–outdoor correlations. Build. Environ. 2019, 148, 689–700. [Google Scholar] [CrossRef] [Green Version]
- Shi, Y.; Yan, Z.; Li, C.; Li, C. Energy consumption and building layouts of public hospital buildings: A survey of 30 buildings in the cold region of China. Sustain. Cities Soc. 2021, 74, 103247. [Google Scholar] [CrossRef]
- Alzoubi, H.H.; Attia, A.S. Assessment of the acoustical standards in patient care units in Jordanian National Hospitals in light of the international criteria: Case of King Abdullah University Hospital. Alex. Eng. J. 2019, 58, 1205–1213. [Google Scholar] [CrossRef]
- Leccese, F.; Montagnani, C.; Iaia, S.; Rocca, M.; Salvadori, G. Quality of Lighting in Hospital Environments: A Wide Survey Through in Situ Measurements. J. Light Vis. Environ. 2017, 40, 52–65. [Google Scholar] [CrossRef] [Green Version]
- Si, B.; Wang, J.; Yao, X.; Shi, X.; Jin, X.; Zhou, X. Multi-objective optimization design of a complex building based on an artificial neural network and performance evaluation of algorithms. Adv. Eng. Inform. 2019, 40, 93–109. [Google Scholar] [CrossRef]
- Liu, Q.; Ren, J. Research on the building energy efficiency design strategy of Chinese universities based on green performance analysis. Energy Build. 2020, 224, 110242. [Google Scholar] [CrossRef]
- Jia, M.; Srinivasan, R. Building Performance Evaluation Using Coupled Simulation of EnergyPlus™ and an Occupant Behavior Model. Sustainability 2020, 12, 4086. [Google Scholar] [CrossRef]
- Gerrish, T.; Ruikar, K.; Cook, M.; Johnson, M.; Phillip, M.; Lowry, C. BIM application to building energy performance visualization and management: Challenges and potential. Energy Build. 2017, 144, 218–228. [Google Scholar] [CrossRef] [Green Version]
- Zhuang, D.; Zhang, X.; Lu, Y.; Wang, C.; Jin, X.; Zhou, X.; Shi, X. A performance data integrated BIM framework for building life-cycle energy efficiency and environmental optimization design. Autom. Constr. 2021, 127, 103712. [Google Scholar] [CrossRef]
- Ansah, M.K.; Chen, X.; Yang, H.; Lu, L.; Lam, P.T.I. Developing an automated BIM-based life cycle assessment approach for modularly designed high-rise buildings. Environ. Impact Assess. Rev. 2021, 90, 106618. [Google Scholar] [CrossRef]
- Guo, K.; Li, Q.; Zhang, L.; Wu, X. BIM-based green building evaluation and optimization: A case study. J. Clean. Prod. 2021, 320, 128824. [Google Scholar] [CrossRef]
- Zhou, Z.-y.; Kizil, M.; Chen, Z.-w.; Chen, J.-h. A new approach for selecting best development face ventilation mode based on G1-coefficient of variation method. J. Cent. South Univ. 2018, 25, 2462–2471. [Google Scholar] [CrossRef]
- Liu, J.; Li, Y.; Lu, Y.; Yan, S. Study on coupling optimization model of node enterprises for energy storage-involved photovoltaic value chain in China. Energy Rep. 2020, 6, 69–81. [Google Scholar] [CrossRef]
- Zhong, C.; Yang, Q.; Liang, J.; Ma, H. Fuzzy comprehensive evaluation with AHP and entropy methods and health risk assessment of groundwater in Yinchuan Basin, northwest China. Environ. Res. 2022, 204, 111956. [Google Scholar] [CrossRef]
- Yin, Y.; Zhang, Y. Environmental Pollution Evaluation of Urban Rail Transit Construction Based on Entropy Weight Method. Nat. Environ. Pollut. Technol. 2021, 20, 819–824. [Google Scholar] [CrossRef]
- Jin, M.; Zhang, J.; Cui, S.; Kang, M.; Xiao, Y.; Xiang, R.; Yan, Z. Research on comprehensive evaluation of data link based on G1 method and entropy weight method. J. Phys. Conf. Ser. 2021, 1820, 012115. [Google Scholar] [CrossRef]
- Sun, J.; Hu, G.; Ma, J.; Chen, Y.; Wu, L.; Liu, Q.; Hu, J.; Livoti, C.; Jiang, Y.; Liu, Y. Consumer satisfaction with tertiary healthcare in China: Findings from the 2015 China National Patient Survey. Int. J. Qual. Health Care 2017, 29, 213–221. [Google Scholar] [CrossRef] [Green Version]
- Giao, H.N.K.; Thy, N.T.A.; Vuong, B.N.; Kiet, T.V.; Lien, L.T.P. Outpatient Satisfaction at Private General Hospitals in Ho Chi Minh City, Vietnam. J. Asian Financ. Econ. Bus. 2020, 7, 323–334. [Google Scholar] [CrossRef]
- Zhou, F.; Xu, C.; Sun, Y.; Meng, X. Influencing Factors of Outpatients’ Satisfaction in China a Cross-Sectional Study of 16 Public Tertiary Hospitals. Patient Prefer. Adherence 2021, 15, 1243–1258. [Google Scholar] [CrossRef]
- Mazaheri Habibi, M.R.; Abadi, F.M.; Tabesh, H.; Vakili-Arki, H.; Abu-Hanna, A.; Eslami, S. Evaluation of patient satisfaction of the status of appointment scheduling systems in outpatient clinics: Identifying patients’ needs. J. Adv. Pharm. Technol. Res. 2018, 9, 51–55. [Google Scholar] [CrossRef]
- Wang, N.; Xu, H.; Song, X.; Lun, Z. Doctor Visiting Process Based on Information Technology. In Proceedings of the 2019 3rd International Conference on Data Science and Business Analytics (ICDSBA), Istanbul, Turkey, 11–12 October 2019; pp. 225–226. [Google Scholar]
- Sadatsafavi, H.; Walewski, J.; Taborn, M. Patient experience with hospital care—Comparison of a sample of green hospitals and non-green hospitals. J. Green Build. 2015, 10, 169–185. [Google Scholar] [CrossRef]
- Nimlyat, P.S. Indoor environmental quality performance and occupants’ satisfaction [IEQPOS] as assessment criteria for green healthcare building rating. Build. Environ. 2018, 144, 598–610. [Google Scholar] [CrossRef]
- Jamshidi, S.; Parker, J.S.; Hashemi, S. The effects of environmental factors on the patient outcomes in hospital environments: A review of literature. Front. Archit. Res. 2020, 9, 249–263. [Google Scholar] [CrossRef]
- Enache-Pommer, E.; Horman, M.J.; Messner, J.I.; Riley, D. A Unified Process Approach to Healthcare Project Delivery: Synergies between Greening Strategies, Lean Principles and BIM. In Proceedings of the Construction Research Congress 2010, Banff, AB, Canada, 8–10 May 2010. [Google Scholar]
- Wood, L.C.; Wang, C.; Abdul-Rahman, H.; Abdul-Nasir, N.S.J. Green Hospital Design: Integrating Quality Function Deployment and End-user Demands. J. Clean. Prod. 2016, 112, 903–913. [Google Scholar] [CrossRef] [Green Version]
- Buonomano, A.; Calise, F.; Ferruzzi, G.; Palombo, A. Dynamic energy performance analysis: Case study for energy efficiency retrofits of hospital buildings. Energy 2014, 78, 555–572. [Google Scholar] [CrossRef]
- Kim, E.; Yoo, S.; Hee, H.; Park, H.; Kim, G.; Ha, S. Patient satisfaction in a context-aware hospital guidance system. Stud. Health Technol. Inf. 2012, 180, 1177–1179. [Google Scholar] [CrossRef]
- Shen, J.; Zhang, J.; He, Q.; Pan, H.; Wu, Z.; Nie, L.; Zhang, H.; Liu, S.; Sun, Y.; Du, Y.; et al. “Without the need for a second visit” initiative improves patient satisfaction with updated services of outpatient clinics in China. BMC Health Serv. Res. 2021, 21, 267. [Google Scholar] [CrossRef]
- Shi, Z.; Lv, K. Green highway evaluation based on Big Data GIS and BIM technology. Arab. J. Geosci. 2021, 14, 1022. [Google Scholar] [CrossRef]
- Cao, Y.; Bian, Y. Improving the ecological environmental performance to achieve carbon neutrality: The application of DPSIR-Improved matter-element extension cloud model. J. Environ. Manag. 2021, 293, 112887. [Google Scholar] [CrossRef]
- Dong, J.; Wang, D.; Liu, D.; Ainiwaer, P.; Nie, L. Operation Health Assessment of Power Market Based on Improved Matter-Element Extension Cloud Model. Sustainability 2019, 11, 5470. [Google Scholar] [CrossRef] [Green Version]
- Wang, Y.; Zhang, X.; Wu, Y. Eutrophication Assessment Based on the Cloud Matter Element Model. Int. J. Environ. Res. Public Health 2020, 17, 334. [Google Scholar] [CrossRef] [Green Version]


| First-Level Indicator | Second-Level Indicator | Indicator Assignment Mode | Indicator Output |
|---|---|---|---|
| U: Indoor comfort | U1: Patient visit process | BIM visualization—Revit roaming | 3D animation and text information |
| U2: Indoor background noise | BIM family type-wall and outside window family type parameters | Design parameters and text information | |
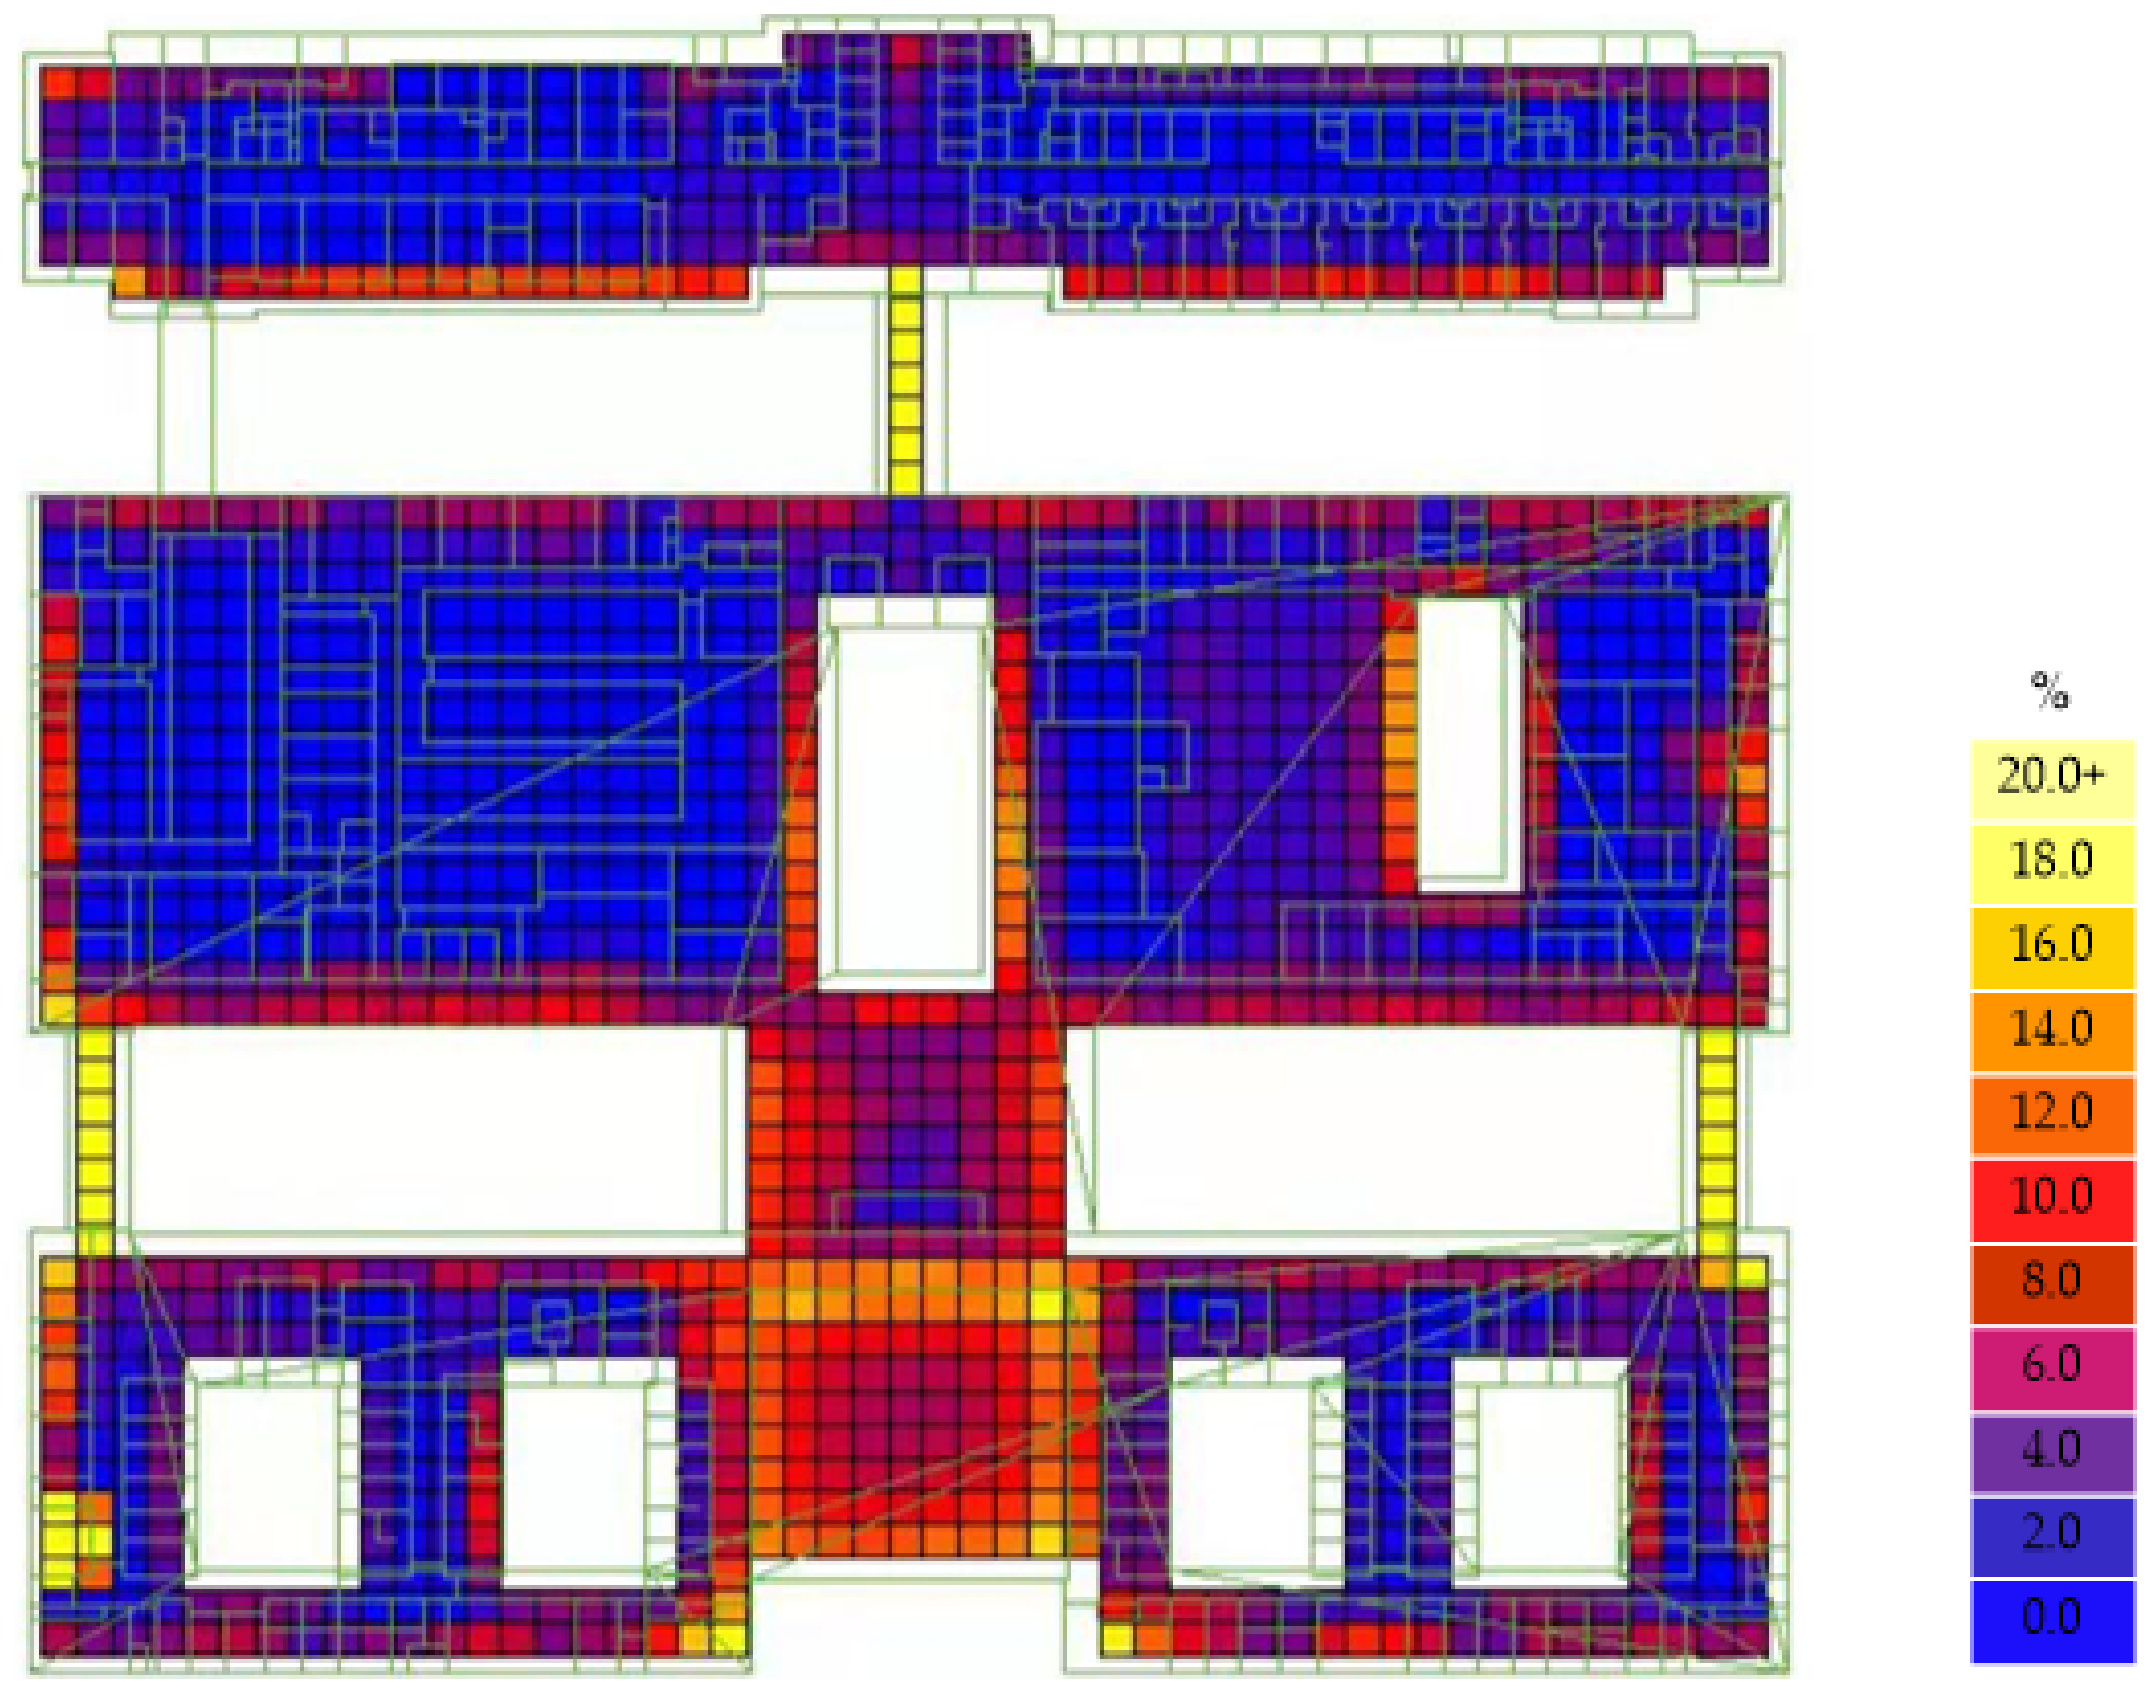
| U3: Indoor natural lighting | Autodesk Ecotect Analysis building performance simulation | Daylight factor and daylight compliance rate | |
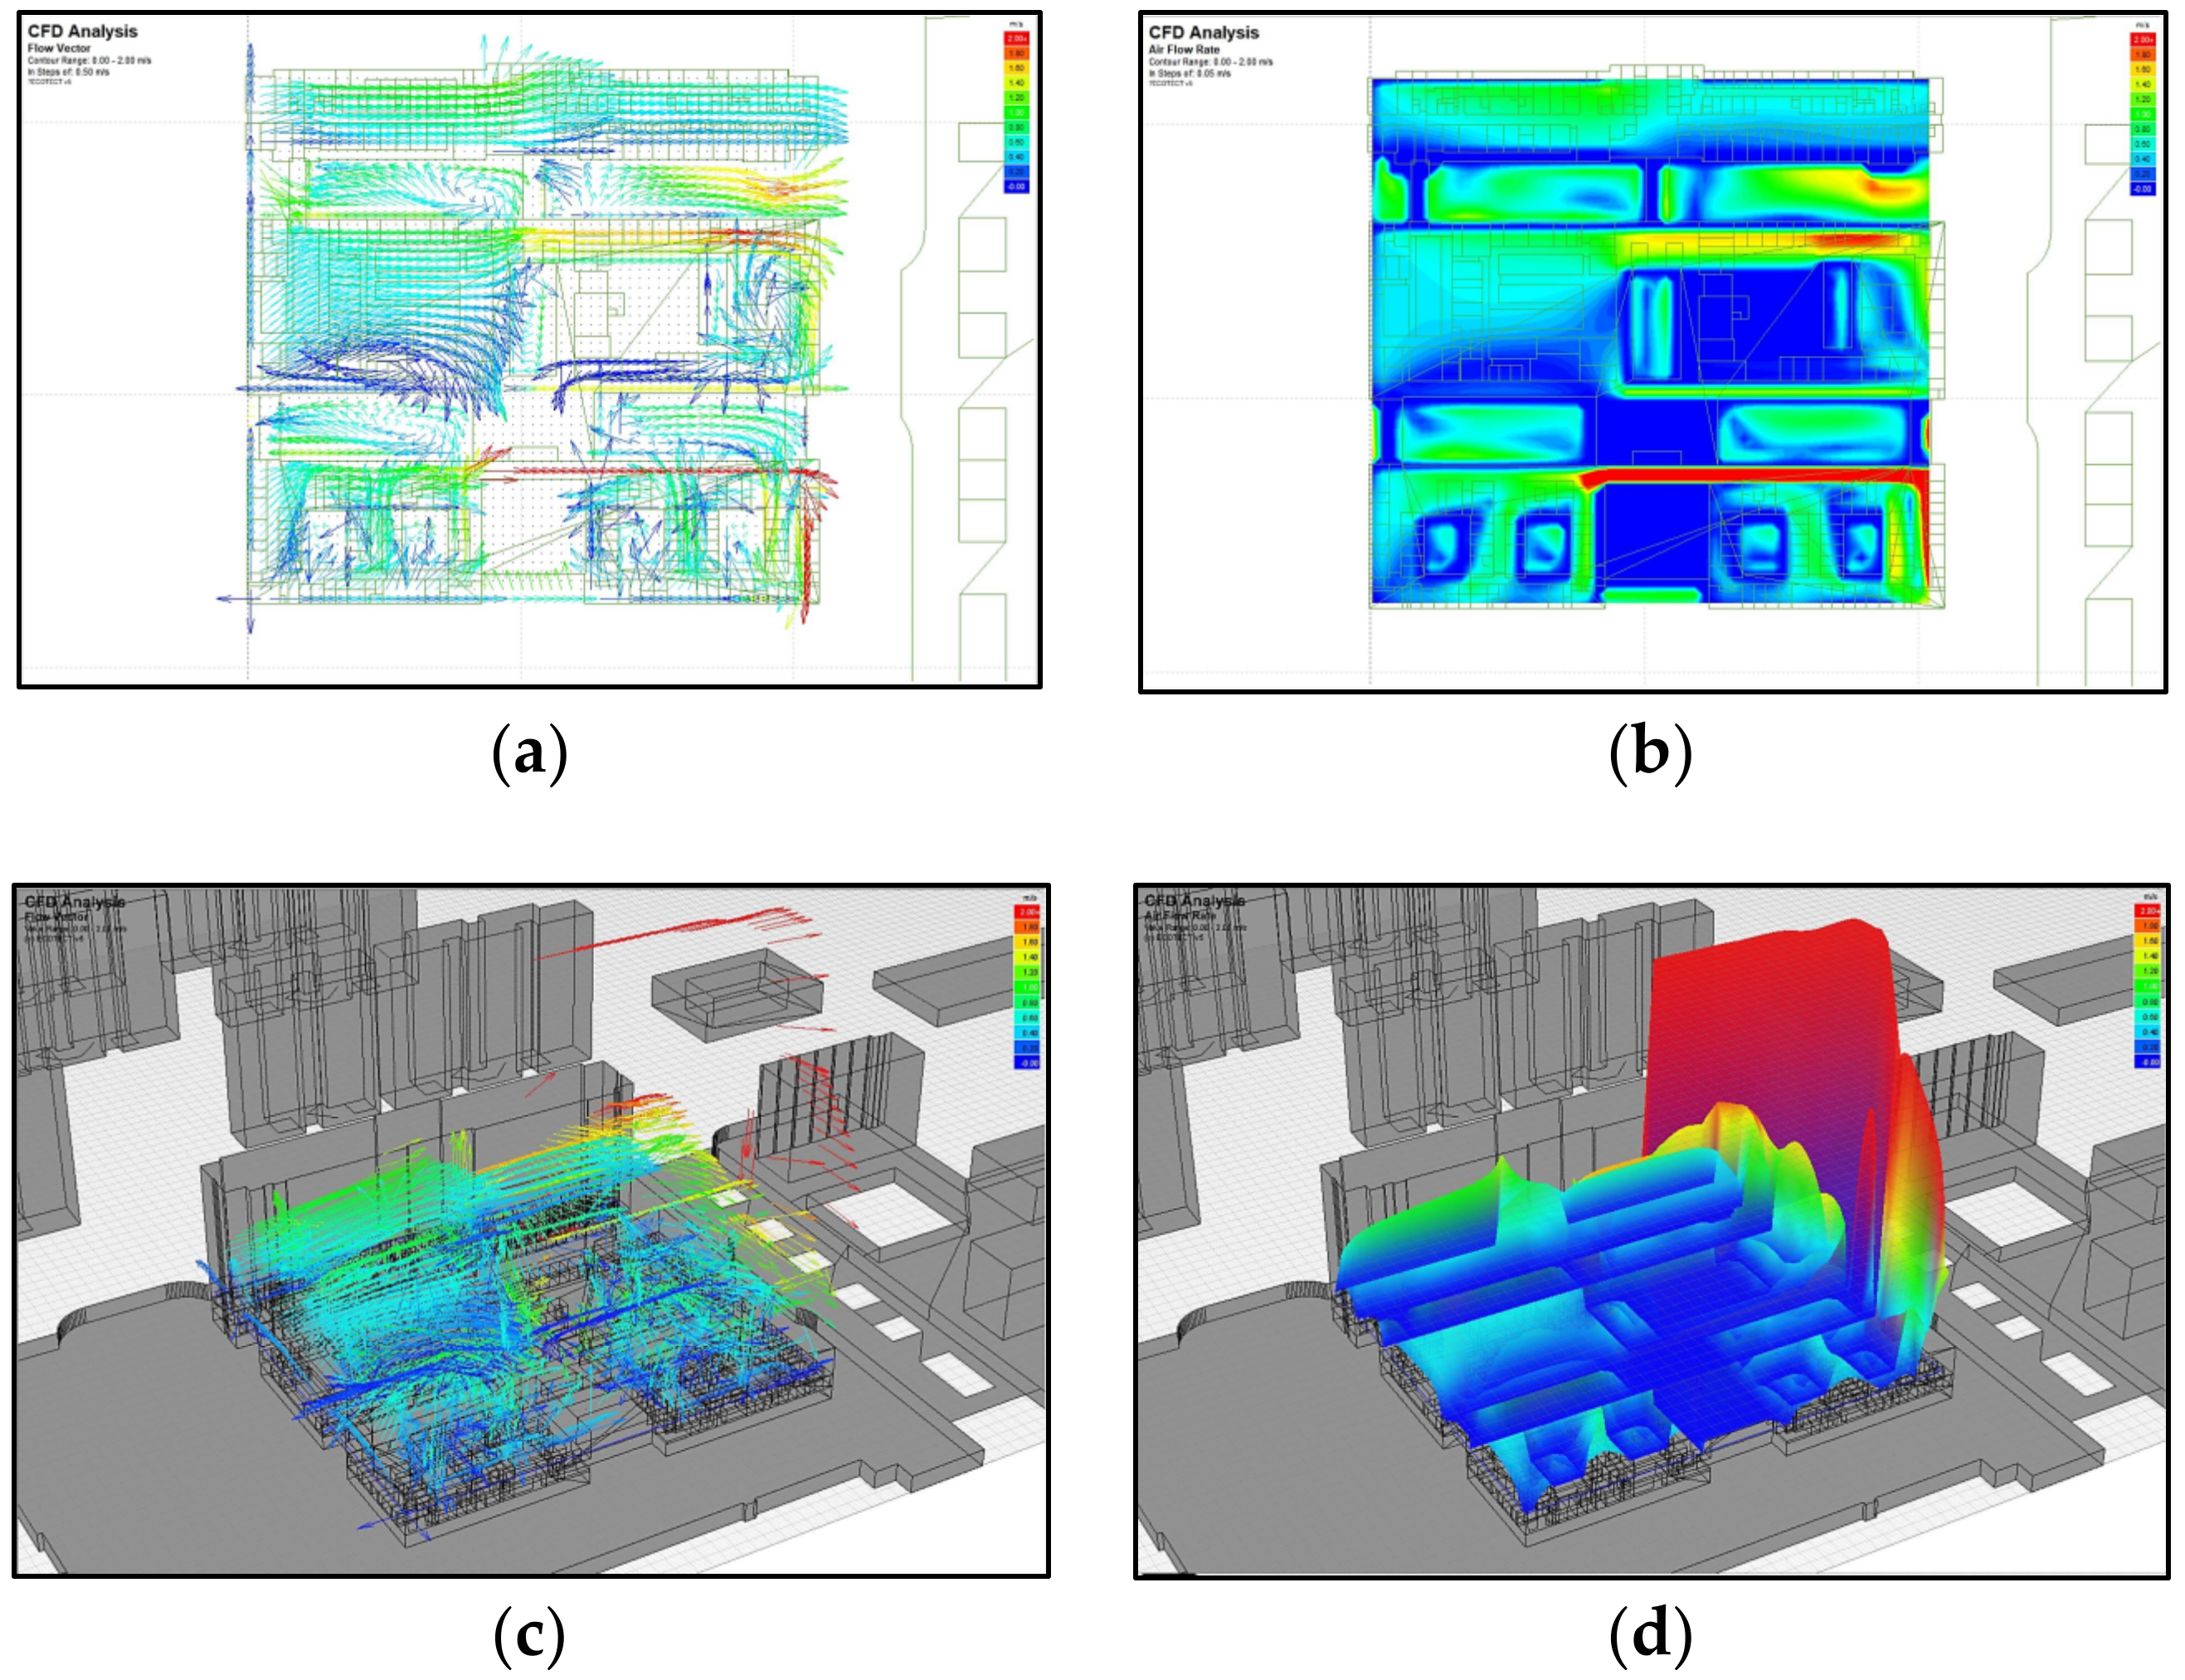
| U4: Indoor natural ventilation | Autodesk Ecotect Analysis building performance simulation | Indoor air flow vector and rate | |
| E: Hospital environment | E1: Outdoor wind environment | Autodesk Ecotect Analysis building performance simulation | Outdoor airflow vector and rate |
| E2: Hospital humanized design | Revit list-BIM visualization | Design parameters and text information | |
| E3: Sunshine environment in inpatient wards | Autodesk Ecotect Analysis building performance simulation | Sunlight hours and sunlight compliance rate | |
| E4: Greening rate of the hospital park | Revit list-area and volume calculations | The area ratio | |
| E5: Smart medical services | Revit equipment list-BIM visualization | Equipment list and text information | |
| R: Resource utilization | R1: Hospital parkland use | Revit list-area and volume calculations | The area ratio |
| R2: Save materials | Revit material list-define family type parameters | Material list and text information | |
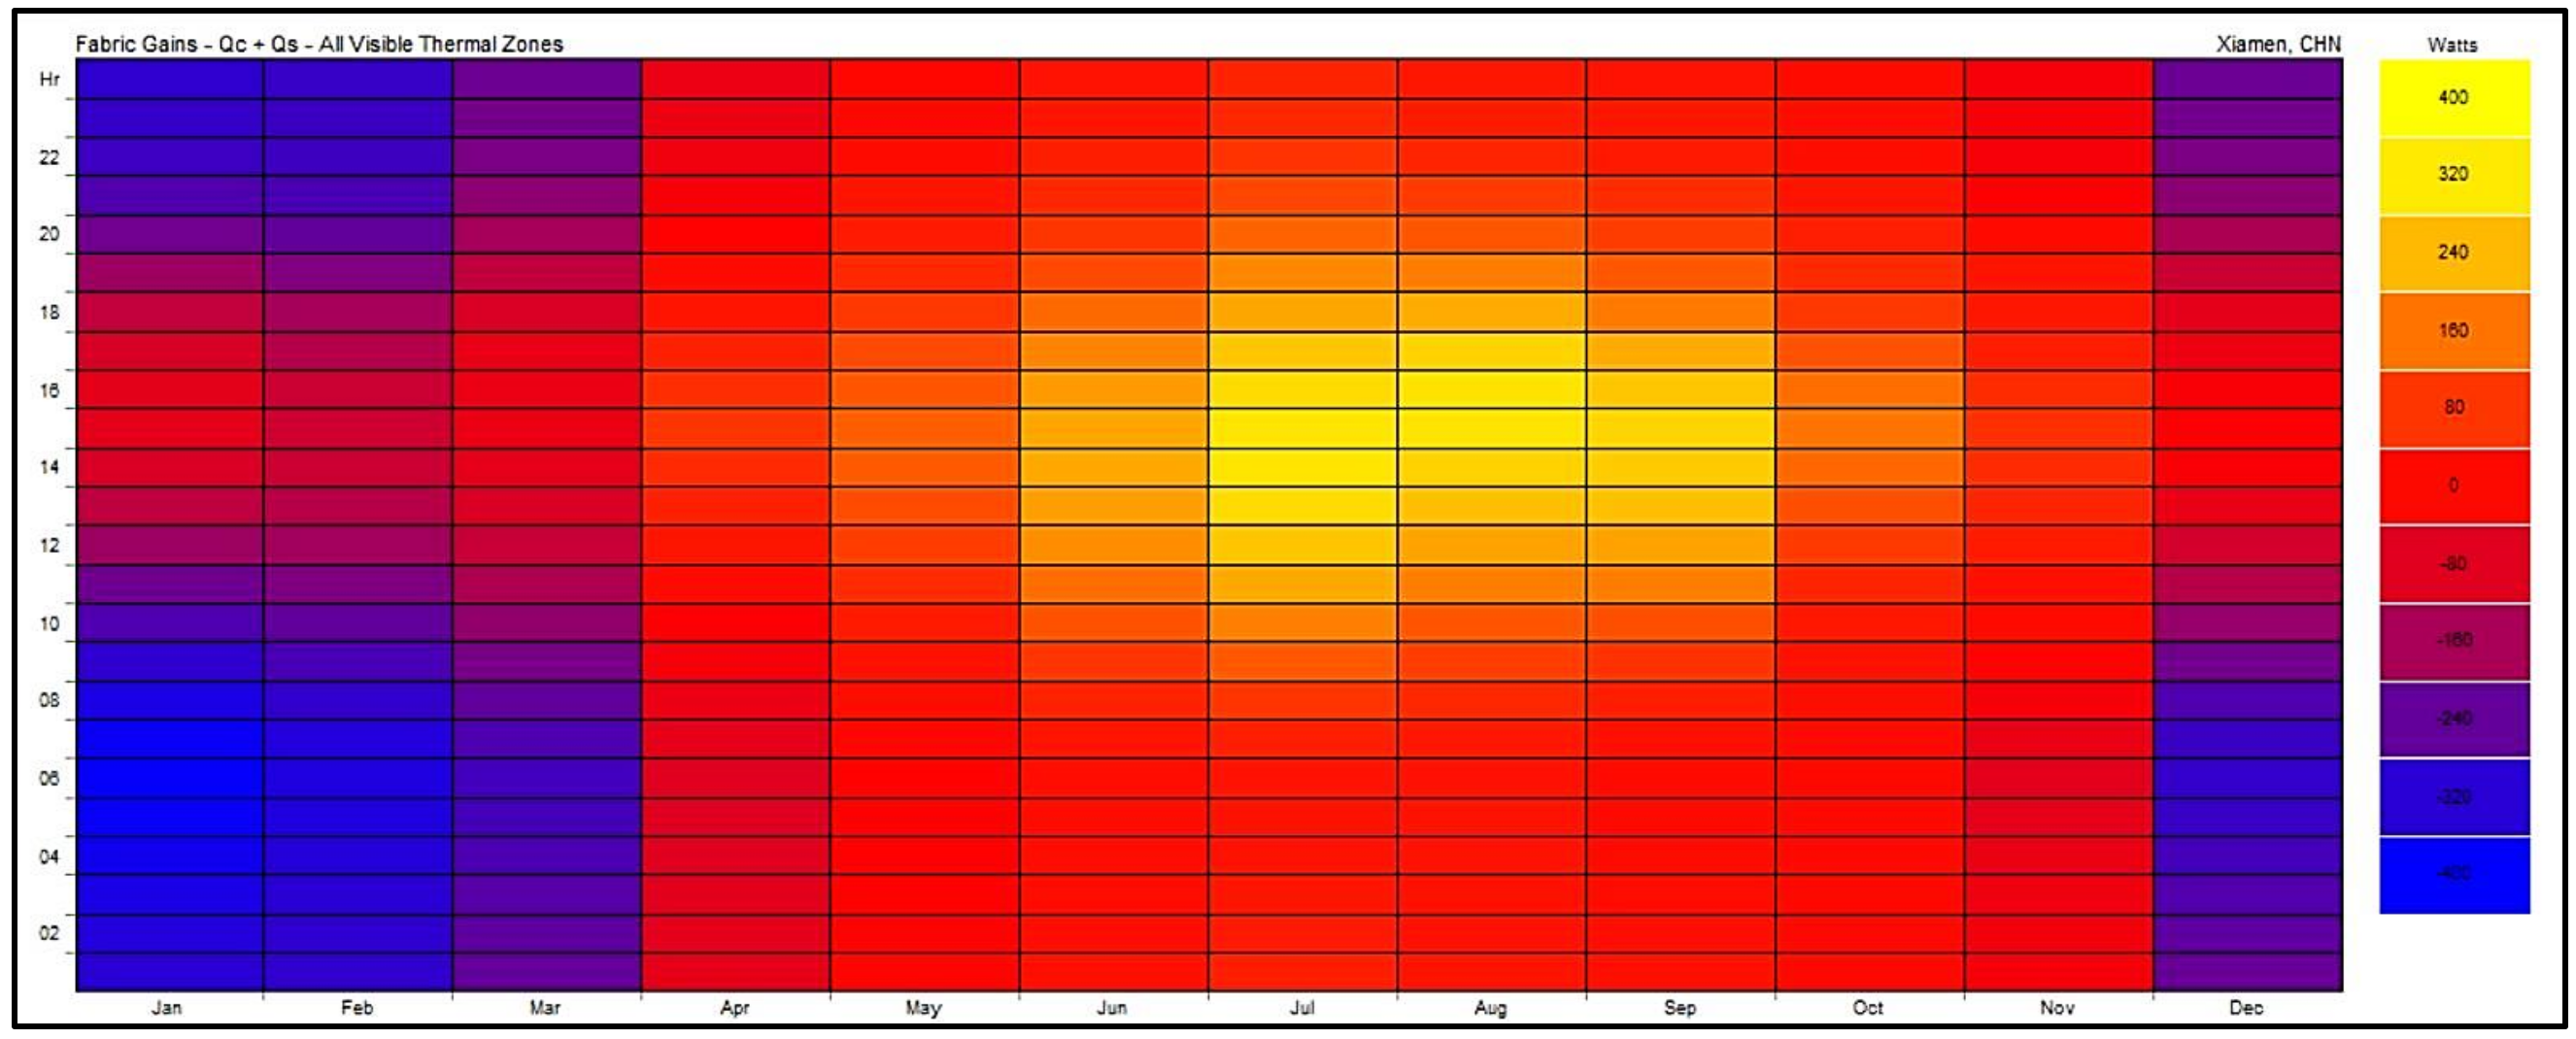
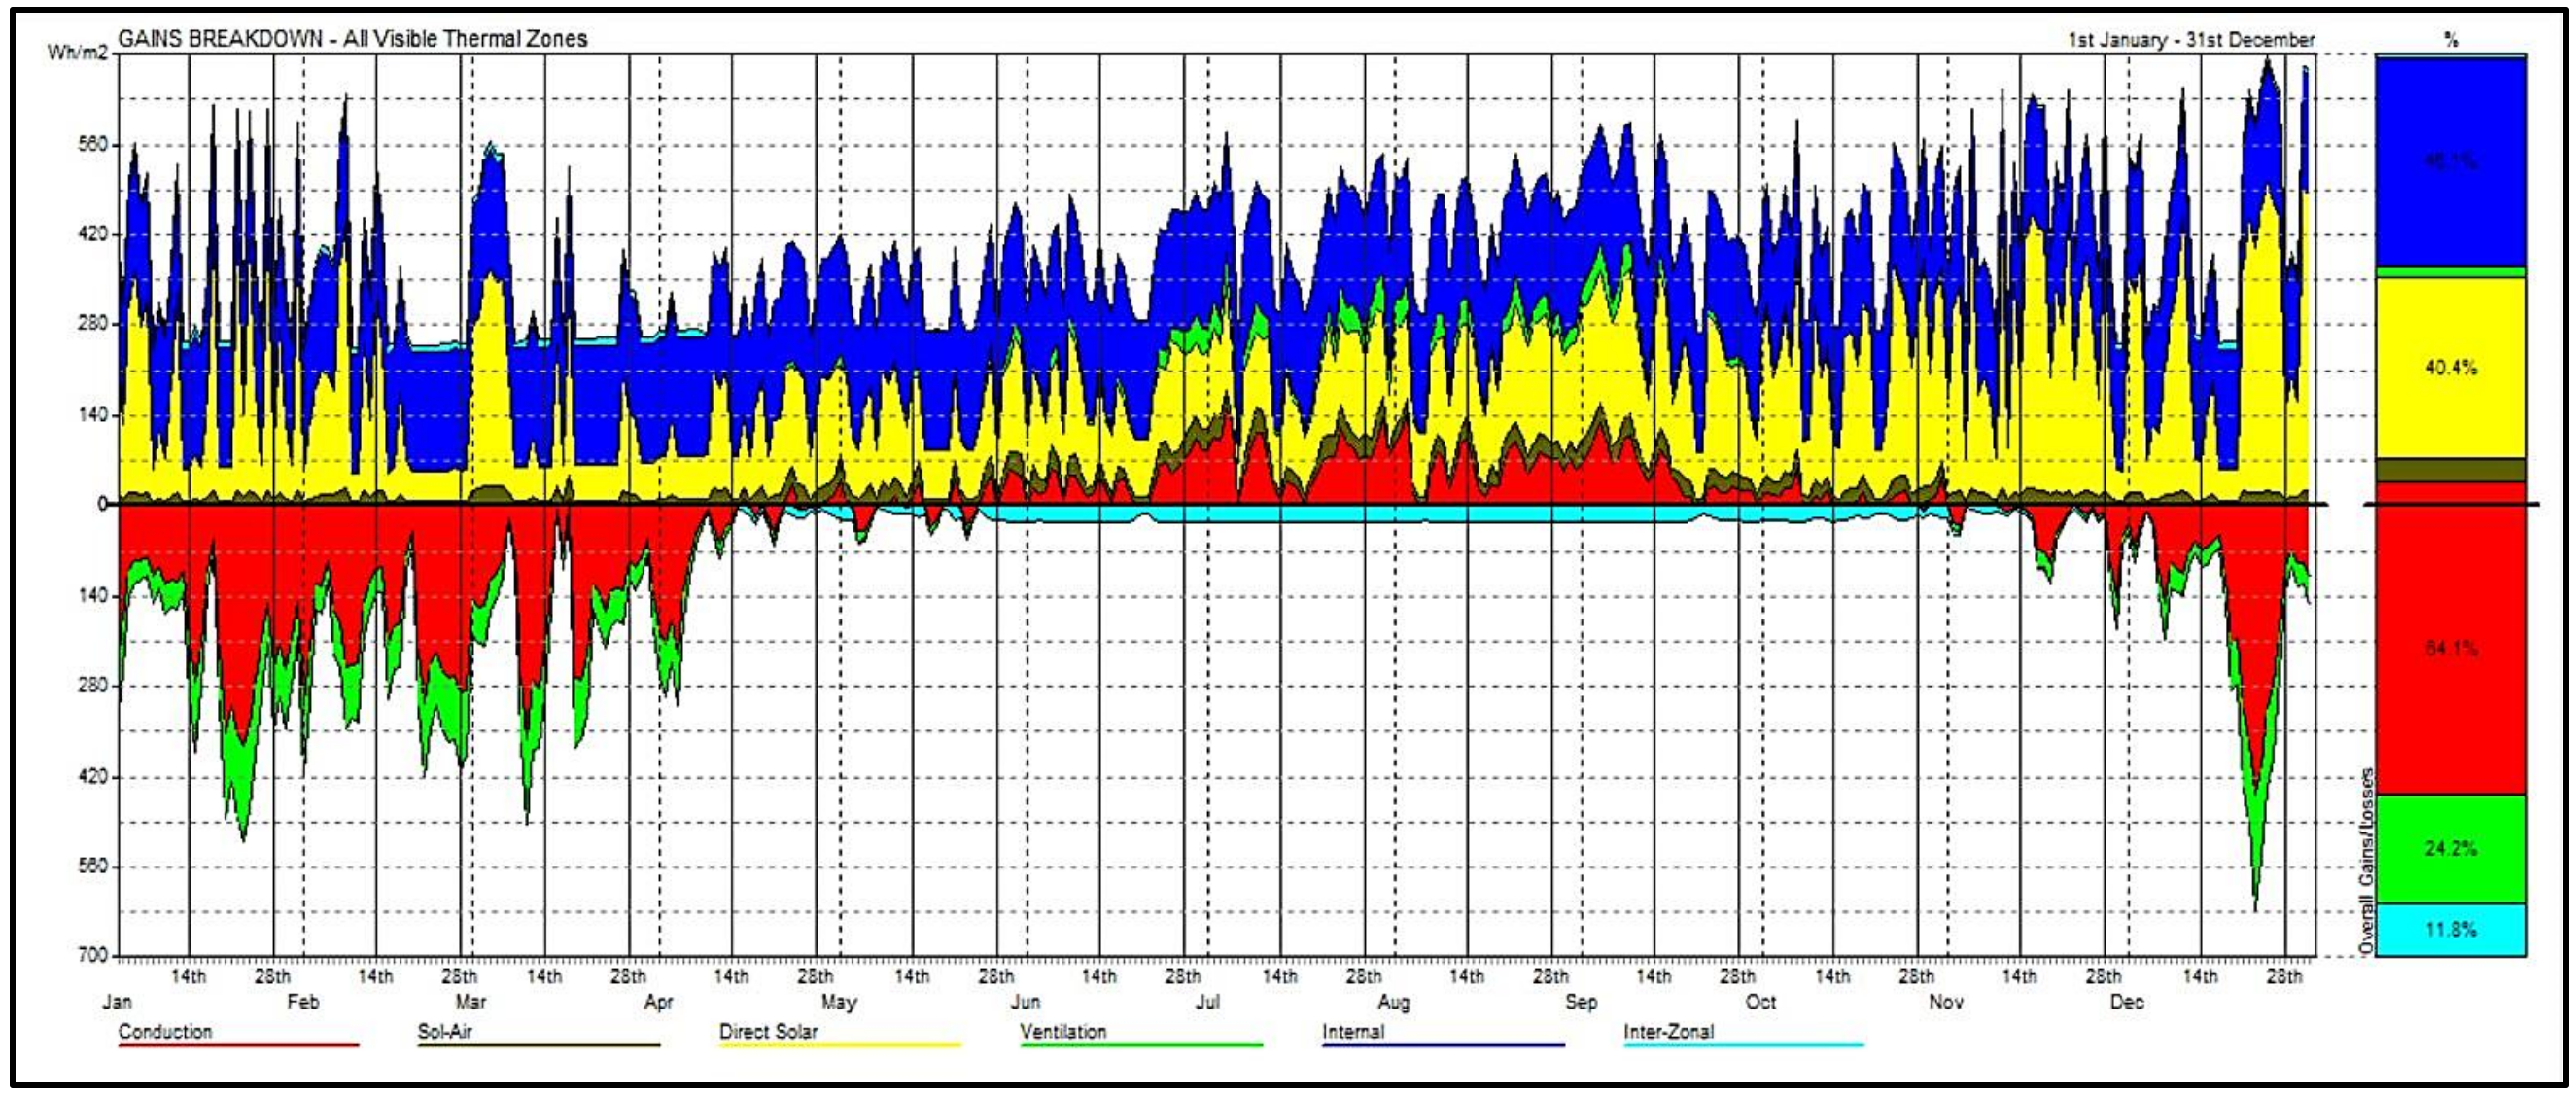
| R3: Thermal performance of envelope structure | Autodesk Ecotect Analysis building performance simulation | Fabric gains and design parameters |
| Total | Score Classification | ||||
|---|---|---|---|---|---|
| 120 | Basic level | First level | Second level | Third level | |
| Graded specific gravity | 40% | 50% | 62.5% | 80% | |
| Range of grades | [48,60] | [60,75] | [75,95] | [95,120] | |
| Structure | Thickness (mm) | Thermal Conductivity Coefficient (W/m·k) | Thermal Storage Coefficient (W/m·k2) | Thermal Resistance (m·k2/W) | Thermal Inertia Index | |
|---|---|---|---|---|---|---|
| roof | Fine aggregate concrete | 40 | 1.74 | 17.20 | 0.023 | 0.395 |
| Composite mortar | 10 | 0.87 | 10.75 | 0.011 | 0.124 | |
| Extruded polystyrene plate | 35 | 0.03 | 0.31 | 0.972 | 0.365 | |
| Cement mortar | 20 | 0.93 | 11.37 | 0.022 | 0.245 | |
| Lightweight aggregate concrete pouring and tamping | 30 | 0.98 | 11.10 | 0.034 | 0.374 | |
| Reinforced concrete | 120 | 1.74 | 17.20 | 0.069 | 1.186 | |
| Sum of layers | 255 | 1.131 | 2.689 | |||
| The solar radiation absorption coefficient of the outer surface | 0.50 | |||||
| Thermal transfer coefficient | 0.78 | |||||
| Outer wall | Cement mortar | 15 | 0.93 | 11.37 | 0.016 | 0.183 |
| Sintered gangue porous brick | 200 | 0.40 | 5.55 | 0.50 | 2.775 | |
| Thermal insulation mortar | 10 | 0.07 | 1.20 | 0.143 | 0.171 | |
| Anti-crack Mortar | 5 | 0.93 | 11.37 | 0.005 | 0.061 | |
| Sum of layers | 230 | 0.664 | 3.191 | |||
| The solar radiation absorption coefficient of the outer surface | 0.12 | |||||
| Thermal transfer coefficient | 1.21 | |||||
| Evaluation Standard | Description | Project Case | Score |
|---|---|---|---|
| U1 | The department layout is reasonable and the treatment process is a sample; information network is used to improve the convenience of the treatment process. | Informationization registration services are provided, and the departments are relatively easy to reach. | 6 |
| U2 | Hospitals require a high-quality indoor background noise environment to meet the current national standards. | The sound insulation performance of the component meets the high current national standard, and the impact performance of the floor meets the low standard. | 7 |
| U3 | The daylight factor of main functional rooms in hospitals conforms to the current national standard <GB/T 50033-2013>. | The daylight compliance rate of the ward building, outpatient building and medical building is 99%, 85% and 60%, respectively. | 6 |
| U4 | Indoor ventilation airflow organization is reasonable, and the airflow rate should be kept 0–1.4 m/s to ensure comfort. | The indoor airflow rate is 0–1.4 m/s, and the airflow vector is reasonable. | 10 |
| Second-Level Indicator | Degree of Membership | Green Rating | ||||
|---|---|---|---|---|---|---|
| Basic Level | First Level | Second Level | Third Level | |||
| U1: Patient visit process | 0 | 0.1052 | 0.9726 | 0.0346 | Second level | |
| U2: Indoor background noise | 0 | 0.0091 | 0.7785 | 0.0346 | Second level | |
| U3: Indoor natural lighting | 0 | 0.1052 | 0.9726 | 0.0346 | Second level | |
| U4: Indoor natural ventilation | 0 | 0 | 0.0019 | 0.4989 | Third level | |
| E1: Outdoor wind environment | 0 | 0.0091 | 0.7785 | 0.0346 | Second level | |
| E2: Hospital humanized design | 0 | 0 | 0.2561 | 0.7786 | Third level | |
| E3: Sunshine environment in inpatient wards | 0 | 0 | 0.0346 | 0.9726 | Third level | |
| E4: Greening rate of the hospital park | 0 | 0 | 0.0019 | 0.4989 | Third level | |
| E5: Smart medical services | 0.019 | 0.4988 | 0.4989 | 0.1088 | Second level | |
| R1: Hospital parkland use | 0 | 0 | 0.0019 | 0.4989 | Third level | |
| R2: Save materials | 0 | 0.1052 | 0.9726 | 0.0346 | Second level | |
| R3: Thermal performance of envelope structure | 0 | 0.0091 | 0.7785 | 0.0346 | Second level | |
| First-level indicator | max Kj(R) | |||||
| Indoor comfort | 0 | 0.0236 | 0.2901 | 0.0469 | 0.2901 | Second level |
| Hospital environment | 0 | 0.0546 | 0.0973 | 0.1347 | 0.1347 | Third level |
| Resource utilization | 0 | 0.0103 | 0.1743 | 0.0502 | 0.1743 | Second level |
| Project Green Grade | 0 | 0.0297 | 0.1949 | 0.0760 | 0.1949 | Second level |
Publisher’s Note: MDPI stays neutral with regard to jurisdictional claims in published maps and institutional affiliations. |
© 2022 by the authors. Licensee MDPI, Basel, Switzerland. This article is an open access article distributed under the terms and conditions of the Creative Commons Attribution (CC BY) license (https://creativecommons.org/licenses/by/4.0/).
Share and Cite
Zhan, Z.; Xu, W.; Xu, L.; Qi, X.; Song, W.; Wang, C.; Huang, Z. BIM-Based Green Hospital Building Performance Pre-Evaluation: A Case Study. Sustainability 2022, 14, 2066. https://doi.org/10.3390/su14042066
Zhan Z, Xu W, Xu L, Qi X, Song W, Wang C, Huang Z. BIM-Based Green Hospital Building Performance Pre-Evaluation: A Case Study. Sustainability. 2022; 14(4):2066. https://doi.org/10.3390/su14042066
Chicago/Turabian StyleZhan, Zhaoxi, Wenna Xu, Lin Xu, Xinyue Qi, Wenjie Song, Chen Wang, and Ziye Huang. 2022. "BIM-Based Green Hospital Building Performance Pre-Evaluation: A Case Study" Sustainability 14, no. 4: 2066. https://doi.org/10.3390/su14042066
APA StyleZhan, Z., Xu, W., Xu, L., Qi, X., Song, W., Wang, C., & Huang, Z. (2022). BIM-Based Green Hospital Building Performance Pre-Evaluation: A Case Study. Sustainability, 14(4), 2066. https://doi.org/10.3390/su14042066