Abstract
This work aims to assess how regional innovation systems support research and innovation smart specialization strategies (RIS3) in coal intensive regions. Although many authors have analyzed energy transition paths for the European coal regions, no study has assessed how the network properties of their innovation systems are aligned with the priorities identified in their RIS3. This work fills this gap, relying on social network analysis (SNA) to assess innovation systems’ underlying networks, considering the active role of their nodes, thus, contributing to the innovation systems literature in the areas of modelling, simulation and performance evaluation. Within this work, regional innovation systems are modelled as research networks. These networks are promoted by the consortia funded by the European H2020 program. The assessment of the topology and properties of these networks enables the evaluation of the functioning of the innovation system, its technological strengths, as well as the key players involved. Based on these results, the characteristics of the innovation systems are compared to the priorities established by the RIS3. Three Spanish coal intensive regions (Aragón, Asturias and Castilla y León) are considered as use cases in this study. The obtained results indicate that, in some cases, the technological strengths of the regional innovation systems are not considered in the identification of the RIS3 priorities, while some RIS3 priorities are not supported by the innovation system. Considering these results, this paper proposes recommendations for regional and European policymakers, as well as for participants in the European research programs.
Highlights
- The EU finance collaborative research to support the fulfillment of social, competitiveness and climate goals.
- The EU regions have put in place smart specialization strategies (RIS3), identifying their priorities.
- The EU funded innovation projects and related consortia construct innovation systems at a regional level, developing networks of projects and partners.
- The properties of the innovation systems’ underlying networks are related to the consecution of the RIS3 priorities.
- The networks’ properties can be assessed by means of social network analysis, obtaining network cohesion and node centrality metrics.
- There is a misalignment between the innovation systems’ properties and the RIS3 priorities.
- The innovation system networks assessment can be a fundamental tool for policymakers and participants to reach greater results.
1. Introduction
1.1. Overall Approach
The concept of regional smart specialization has become central for European policies related to innovation, growth and sustainable development since 2013 [1], when the European Commission started the process for developing regional research and innovation smart specialization strategies (RIS3). For the regions that are not major innovation players, RIS3 aligned policies are crucial to promote innovation in those sectors or technological domains that may provide them with a competitive advantage [2]. This is the case of the European coal regions in transition, which are facing the challenge of shifting towards a low carbon economy, and which may significantly benefit from a well designed and implemented RIS3 [3]. While most of the related literature focuses on the deployment of other energy technologies [4,5,6] or in the evaluation of the social impacts—especially in the employment—of the energy transition in these regions [7,8], there is a gap in addressing how the innovation systems promoted in the coal in transition regions contribute to their RIS3 implementation, as well as in evaluating how the RIS3 designs consider the existing innovation systems.
The research and innovation collaborative projects funded by the European Union under the Horizon 2020 program (H2020) contribute to the creation of innovation systems [9,10]. Although H2020 looks for transnational collaboration, it has been established by previous authors that this program is particularly interesting for evaluating the role of regional innovation networks [11]. Previous studies have assessed how actors and institutions interact in the energy transition process from a regional innovation system perspective, drawing conclusions mainly from semistructured, qualitative interviews [12]. Nevertheless, although different authors have pointed out the relevance of studying innovation systems’ network properties [13,14,15,16], the properties of the regional innovation systems’ underlying networks promoted by H2020 in the European coal regions in transition have not been characterized, neither has their contribution to the RIS3 implementation been assessed.
This study addresses the correspondence between the H2020 regional innovation networks’ properties and the RIS3 priorities. For this purpose, and considering that H2020 projects promote innovation systems that can be studied relying on the properties of their underlying networks of partners and projects, the authors propose the following research questions:
- How do innovation systems contribute to the deployment of the RIS3 priorities in the coal in transition regions?
- How are the Innovation Systems for the RIS3 design in the coal in transition regions considered?
The novelty of this work remains the assessment of the support of regional innovation systems to the RIS3, considering the regional research networks’ topology and properties. The assessment of these networks provides information about the innovation system’s functioning, its technological strengths, as well as the key players involved. These results are then compared to the RIS3 priorities, to identify synergies and misalignments.
For addressing the research questions, the use case of the three Spanish coal regions in transition (Aragón, Asturias and Castilla y León) has been considered. Thus, the networks of projects and partners within each region are constructed relying on the H2020 participation data from the period 2013–2020. The consideration of the entities’ characteristics (type and role in the project), as well as the thematic area of the projects, allows the consideration of the nodes as active players within the network. Therefore, conclusions may be drawn regarding the degree of contribution of the H2020 promoted innovation systems to each RIS3 priority, as well as about innovation systems’ strengths not yet considered in the RIS3 priorities.
Regarding the instrumental and operational framework, this study relies on social network analysis (SNA). SNA has been proven as a powerful tool, previously used by different authors to assess sustainability aspects [17,18,19], as well as collaboration and projects’ relationships [20,21]. Taking into account that the H2020 program funds projects that are developed by consortia composed by at least three entities, this study analyzes the two underlying networks behind the innovation system: (1) the network of projects, in which projects that share partners are linked and (2) the network of entities, in which entities that cooperate in the same project are connected. These networks can be geographically restricted to the entities and projects nestled in a region and, thus, can enable the study of the relationships between the different types of entities within the region (industry, university, research centers, etc.), as well as the main research fields and technologies tackled by the projects developed in the region. The assessment of these networks enables the evaluation of the competitiveness increase of the regional industries, as well as the framework in which knowledge transfer and exchange is facilitated, or enabled [22,23].
The main characteristics of the regional innovation systems are assessed following a twofold approach: (1) the study of the regional networks as a whole and single system, and (2) the analysis of the contribution and role of the networks’ nodes, considering them as active members of the system. A better understanding of the regional innovation system is enabled by this twofold approach, at system—and actor—level [24], thus enabling the assessment of how the regional innovation systems’ characteristics are considered in the RIS3 design.
This paper is organized as follows: Section 2 presents the research model, providing the conceptual framework and the literature review related to regional innovation systems and smart specialization strategies, emphasizing the coal in transition regions’ particularities. The materials and methods used in the study are detailed in Section 3, providing the data used for developing the empirical study; thus, a summary of the coal regions’ characteristics, their RIS3 and the data used for constructing the regional networks underlying the innovation systems is provided. The results of the study are presented in Section 4, explaining the correlation between the network and nodes’ properties and the RIS3. Finally, Section 5 provides a discussion of the obtained results and the final conclusions of the study.
1.2. Smart Specialisation Strategies: The European RIS3
The definition of smart specialization strategies (S3) has been recently set as “the strategic approach to plan for regional economic development directed at economic diversification, supported by technological, practice, and evidence-based innovations, using a bottom-up approach” [1,25,26]. In this context, the European Commission requested that regional authorities across Europe design their research and innovation smart specialization strategies (RIS3) to achieve more efficient use of the European Structural Investment Funds and the H2020 Funds [27,28]. Each RIS3 represents the transformation agenda in which the regional innovation priorities, challenges and needs are identified and tackled, to build a competitive advantage by developing and matching research and innovation’s own strengths to business needs, to address emerging opportunities and market developments in a coherent manner.
1.3. Regional Innovation Systems
The S3 approach is linked with the regional innovation systems field [2], which is receiving increasing attention from the energy transitions research area [29,30]. In this context, the promotion of regional innovation systems enables the support of RIS3 implementation, and is considered a key factor for successfully shifting towards a low carbon economy in the coal regions in transition.
Regional innovation systems may be assessed by means of the properties of the research networks resulting from H2020 program within these regions [31]. Within this approach, the funded H2020 consortia develop, on the one hand, networks of partners—in which those entities collaborating in the same project are linked—and, on the other hand, networks of projects—in which those projects sharing partners are connected. Social network analysis has recently emerged as a powerful technique to evaluate innovation systems, which has the unexploited potential to study the consistency between smart specialization policies and innovation systems [32].
1.4. Coal Regions in Transition
Previous authors [33,34,35,36,37] have established that the transition towards a low carbon economy may have pernicious effects at regional and local levels, particularly, in coal-reliant regions. To mitigate the social consequences of the low carbon transition and to ensure a just transition, the European Commission launched the European Coal Regions in Transition Initiative.
Theoretical frameworks related to energy transitions, including coal intensive regions, integrate the concept of innovation systems [38,39,40] as a key influence for a successful process. In this respect, innovation systems related research has evaluated how institutional impulses have contributed to the development of innovation systems by means of characterizing the research networks promoted by the research funding programs. Nevertheless, the particular case of the coal in transition regions and, especially, how the innovation systems in these regions have been developed compared to the RIS3 agendas, has not been addressed.
The European Commission identifies the coal in transition regions in Europe as the most carbon intensive, or with the most people working in fossil fuels. Although coal mining and using regions are easily identified attending to the location of mines and coal power plants, the European Commission accepts [41] that the concept of carbon intensive regions has not yet been defined and would require further work. Nevertheless, the European Commission has already identified the 31 regions in the European Union that compose the Coal Regions in Transition Platform, in which the three considered in this work participate.
2. Materials and Methods
2.1. Research Design
To answer the research questions, the regional innovation systems’ network properties (topology, cohesion, centrality) are firstly assessed and, then, the obtained results are compared to the RIS3 priorities established at each coal in transition region. Within this section, the research design is presented considering the following approach. Firstly, to provide the minimum context of the situation and challenges of each region, this section presents the main social, economic and innovation activity data of the three regions considered in the study.
Then, the two main sources of data considered in this study are presented. From one perspective, the three regional research and innovation smart specialization strategies (RIS3) are used to collect the priorities from each region. From the other perspective, the data from the projects and consortia funded under the Horizon 2020 program are the basis for the analysis of the innovation systems’ underlying networks.
In addition to the data considered, this section presents the methods used for their analysis. While the RIS3 strategies are examined by means of a comparative analysis, the H2020 participation data are analyzed relying on social network analysis (SNA). For this purpose, once the underlying networks of the innovation systems are constructed, two different approaches are considered: firstly, the networks are studied from the point of view of the connections between the partners (networks of partners) and from the point of view of the links between the projects (technological trajectories). Secondly, the innovation systems are assessed considering the network as a whole (the cohesion proprieties of the network) and, in addition, evaluating the role played by each node (the centrality metrics of the nodes). For this last purpose, the SNA is performed taking into account the intrinsic characteristics of the nodes: for an entity, its geographical location, the type of activity performed and if it has acted as a coordinator, while, for a project, the research area tackled, broken down by the pillar, programme and subprogramme within H2020, within which it has been funded.
Finally, the results obtained from the comparative analysis of the three RIS3, together with the ones coming from the innovation systems’ underlying networks SNA, are contrasted to answer the proposed research questions.
2.2. Socioeconomic and Innovation Data of the Three Spanish Coal Regions
In order to give the minimum context of each Spanish coal region, Table 1 and Table 2 present the basic information related to region size, economic activity and innovation development [42].

Table 1.
Gross domestic product, population and surface of the three regions and Spain.
Table 2.
Research activity in economic terms and in human resources dedication of the three regions and Spain.
The Aragón region includes 2.8% of the Spanish population; nevertheless, it represents 3.1% of the national gross domestic product (GDP), with the greatest GDP per capita of the three regions (EUR 28,993), even higher than the national average (EUR 26,438). In addition, Aragón holds a large territory, with 9.43% of the total Spanish surface. In terms of innovation, the number of researchers is in line with the national rate, while the internal expenditure is significantly lower, representing only 2.3% of the total national internal expenditure. The internal expenditure per GDP in the region accounts for 0.88%, significantly lower than the national rate of 1.19%. The number of researchers per population is the highest of the three regions and coincides with the national average (0.3%).
Asturias is the smallest region of the three Spanish coal regions in terms of population and surface, with both being 2.1% of the total national. Nevertheless, its GDP share of the national total accounts only for 1.9%, and the GDP per capita is below the national value (EUR 23,455 compared to EUR 26,438). This weak position also appears in terms of research expenditure, which represents only 1.3% of the total national and constitutes 0.79% of internal expenditure per GDP, also significantly lower than the national rate of 1.19%. The number of researchers is also the smallest of the three, 0.23% of the total population; with the R&D expenditure per researcher also being the smallest one, EUR 81,972 compared to the EUR 106,664 of the national average.
Castilla y León is the largest region in terms of GDP and population, accounting for 4.7% and 5% of the total national, respectively, and with a large surface that represents 18.63% of the Spanish total. Nevertheless, the GDP per capita is below the national average, at EUR 24,758 compared to the national, EUR 26,438. Castilla y León stands out for its high internal expenditure in research, which represents 1.29% of its total GDP, above the national average (1.19%). The number of researchers is slightly below the average national rate (0.27% compared to 0.3%), which increases the total research expenditure per researcher up to EUR 118 517, which is clearly above the ones of Aragón (EUR 83,907) and Asturias (EUR 81,972), as well as the national average (EUR 106,664).
Although coal production was stopped in Spain by 31 December 2018, this milestone happened after a decreasing period. The total extraction of coal in Spain diminished from 8434 kt in 2010 to 2407 kt in 2018. From the total coal produced in Spain in 2018, 55.4% came from Aragón, 30.3% from Castilla y León and 14.3% from Asturias. Meanwhile, the employment associated with coal extraction decreased in Spain from 45,212 jobs in 2012 to 1253 in 2018, all based on the three Spanish regions considered in this study [43].
2.3. Smart Specialization Strategies: Data Analysis of the Three Spanish Coal Regions
The priorities identified in the RIS3 by each of the three Spanish coal regions are presented in Table 3, Table 4 and Table 5, including the priority name and its description. As a first conclusion, there are great differences between the scope of the proposed priorities, especially considering the level of detail and specificity. Thus, in some cases, within one priority, many technologies, sectors, applications or aspects are considered in its description. While Aragón and Asturias identify and describe more clearly their 9 and 5 priorities, respectively, Castilla y León provides a long description of its 6 priorities, integrating different and, in some cases, disconnected aspects. This disparity of criteria complicates the process of finding synergies or common priorities.
Table 3.
Aragón priorities identified in the RIS3.
Table 4.
Asturias priorities identified in the RIS3.
Table 5.
Castilla y León priorities identified in the RIS3.
Despite the different scopes considered in each region, there are some common priorities that are related to four main areas: energy, resource efficiency, health and agri-food.
In the energy field, Aragón is interested in the integration of energy systems (smart grids, energy storage and hydrogen and fuel cells); Asturias includes a more holistic approach, also including energy generation, and Castilla y León emphasizes the demand side, targeting energy efficiency, smart cities and energy management technologies.
Considering the resource sfficiency area, Aragón identifies water and materials efficiency as priorities, proposing a circular economy approach. Asturias, in addition to water cycle management, is interested in resource efficiency in the process industry (mainly steel). Castilla y León also proposes sustainability in the process industry and water management as key priorities.
Health is a priority for the three regions. Aragón emphasizes attention to the dispersed and ageing population, thus tackling demographic change. Asturias also considers its ageing population, also including biomedicine, as a relevant field. Castilla y León, in addition to the previous areas, identifies cancer research and innovative medicines as important fields.
Agri-food is widely considered in Aragón, including agricultural, food and forestry sectors. In Asturias, the special mention of biotechnologies for dairy industries is considered, while, in Castilla y León, food security, together with agriculture, aquaculture and forestry, are identified as priorities.
Finally, there are some enabling technologies, such as new materials or ICT, that are widely considered in the three regions.
Regarding the current low transition paths in the three regions, the Spanish government proposed an Urgent Action Plan in 2020 [44], addressing the coal regions to promote new activities and employment. This plan aims to compensate for the vulnerabilities created after the coal sector’s closing and promotes low carbon transition paths. This plan provides funding, regulatory and administrative support for the deployment of new renewable energy capacity, as well as for industrial and research projects, together with social initiatives targeting the affected citizens. At the moment of the publication of this paper, the process is still open, having completed the diagnosis phase and being about to start identifying investments and projects to promote low carbon transition paths. Once the diagnosis has been completed and made public [45], the regions will benefit from their participation in the Just Transition Platform, for identifying the most promising low carbon transition paths.
2.4. Participation in Horizon2020 Program: Spanish Coal Regions’ Participation Data Analysis
For developing this study, data corresponding to the Horizon 2020 Research program coming from the European Commission database (https://data.europa.eu/data/datasets/cordish2020projects?locale=es, accessed on 19 October 2020) are used. The entities based on the three regions are identified relying on their postal code, as included in their addresses.
Table 6 present the entities participating in H2020 based on the three Spanish coal regions, categorized by their activity type and by their role within the consortium. Five different activity types are considered: private companies, in which large, small and medium enterprises are considered; research centers, including technology centers and public research institutes; higher education establishments, in which universities are considered; public bodies, in which local and regional authorities are included; and, finally, other entities, in which associations, among others, are included. Regarding the role played in the projects, those entities that have coordinated at least one project have been categorized as coordinators, while those that have never acted as coordinators are considered as participants.
Table 6.
Entities participating in each region distributed by activity type and role.
A total of 325 entities from the three regions are participating in H2020, 131 from Aragón, 68 from Asturias and 126 from Castilla y León. Private companies represent 70% of the participants, with this proportion being higher in Aragón (75%) and in Asturias (78%) compared to Castilla y León (62%). Research centers represent 11% of the participants, with a higher share in Castilla y León (14%) than in Aragón (10%) and Asturias (9%). Public bodies constitute, on average, 7% of the participants, with only 3% in Asturias compared to Aragón (7%) and Castilla y León (9%).
In coordination terms, 35% of all the entities have played the coordination role at least once. This proportion is higher in Aragón (40%) and lower in Castilla y León (31%). Private companies are more prone to take the coordinator role, constituting 77% of all the coordination, on average.
Table 7 presents the number of participations of each entity type to quantify their activity, split into participations as a coordinator or as a participant. The 325 entities from the three regions account for 1016 participations, so, on average, each participating entity is involved in 3.13 projects. Nevertheless, this parameter of recurrence varies between regions, reaching 3.40 in Aragón, 3.13 in Castilla y León and 2.59 in Asturias. Therefore, it can be seen how the recurrence ratio in Asturias is 21% below the average of Aragón and Castilla y León. Considering the entity types, 89% of the participations come from three main actors: private companies (40%), research centers (28%) and higher education establishments (21%). In the three regions, the higher recurrence ratio appears in higher education establishments as, on average, each entity participates 24.22 times. They are followed by research centers, which reach 7.65, with high variability between Aragón (11.31) and Asturias (3.67). Finally, companies present a recurrence rate of 1.79 on average, varying from 1.68 in Castilla to 1.72 in Aragón and 2.06 in Asturias.
Table 7.
Number of participations in each region distributed by activity type and role.
The 1016 participations of the 325 entities from the three Spanish coal regions take place in 799 H2020 projects. There are 6 projects on which entities from the three regions collaborate, 4 in which entities from Aragón and Asturias participate together, 19 including entities from Aragón and Castilla y León and 15 with entities from Asturias and Castilla y León. It is relevant that Aragón and Castilla y León are collaborating on 10 projects within the Energy Programme under the Societal Challenges Pillar.
Table 8 presents how these 799 projects cover the different Pillars and Programmes of H2020 and identifies the regions from which there are participating entities. Those projects involving participants from more than one region are included in all those regions. Within the Excellent Science Pillar, the participation is concentrated in the Marie Curie Actions, with 123 projects. In the Industrial Leadership Pillar, 201 out of the 223 projects take place in the Leadership in Enabling and Industrial Technologies. The Science for Society Pillar is covered mainly by Aragón, with 4 out of the 5 projects. The Societal Challenges Pillar includes the highest number of projects, 402, which represent 50.3% of the total. The programs related to the energy and agri-food sectors account for the highest number of projects within this pillar: 129 and 95 projects, respectively, with Aragón being particularly active in both of them, especially in energy, with 79 projects.
Table 8.
Number of projects in which entities from Aragón, Castilla y León and Asturias are present, disaggregated by Pillar and Programme.
2.5. Innovation Systems Network Construction
The participation of the entities from the three Spanish coal regions in Horizon 2020 is studied from the innovation system perspective. For this purpose, the networks of entities and projects fostered by the consortia funded by the European Commission within the Horizon 2020 program are constructed, considering the links between entities cooperating in the same project, as well as the connections between projects sharing common entities. An affiliation matrix, in which entities are assigned to projects, enables the construction of a 2-mode network. From this 2-mode network, two 1-mode networks are constructed, one in which entities participating in the same project are connected and one in which projects sharing common partners are linked. Figure 1 presents a graphic example of these 2-mode and 1-mode networks. This constitutes the first analysis perspective, in which how the entities are collaborating is assessed through the network of entities, and how the projects are connected is assessed in the network of projects.
Figure 1.
Example of the 1-mode networks (entities network and projects network) that are deducted from the 2-mode network (entities to projects network).
The second perspective considered in this analysis evaluates the innovation system with a double approach: The first one assesses the network as an innovation system, neglecting the role played by its nodes, thus evaluating how the innovation system as a whole is capable of transmitting information. This first assessment, at the network level, is based on the cohesion metrics, which evaluate the network in its entirely. The second assessment is developed from a node-based perspective, evaluating how each individual node contributes to the network functioning, thus assuming the active role of the nodes.
2.6. Network Cohesion and Node Centrality Metrics
The topological, cohesion and centrality characteristics of the regional innovation systems are assessed through a nominalist approach, which enables the construction of the graphs of projects and entities. To build the graphs, an affiliation matrix is constructed, linking entities to projects. Then, attributes are assigned to the nodes, following a methodology usually applied in similar research works [46]. The software UCINET has been employed to perform the SNA (Borgatti, S.P., Everett, M.G. and Freeman, L.C. 2002. Ucinet 6 for Windows: Software for Social Network Analysis. Harvard, MA: Analytic Technologies).
A twofold perspective is used in the analysis: (1) a system approach, in which the cohesion of the network and functioning characteristics of the regional innovation systems are assessed as a whole and (2) a node level approach, in which the role and contribution of each node is measured in terms of its embeddedness in the system, relying on centrality metrics.
The cohesion metrics used in this work to assess the underlying networks of the regional innovation systems are the following:
- Average degree: average degree of all nodes. This represents the network activity.
- Average distance: average distance between all reachable pairs of nodes, with the distance between two connected nodes being the length of the shortest path, calculated as the number of edges that it contains. This represents the level of compactness or dispersion of the network.
- Diameter: longest length of the shortest paths of all the reachable nodes. This represents the network extent.
- Density: total number of existing ties divided by the total number of possible ties. For weighted networks, such as the ones analyzed in this work, this is the total of all values divided by the number of possible ties.
- Components: number of sets of connected nodes that are not linked to the rest of the network. This represents the number of nonconnected subnetworks.
- Average tie strength between groups: average of the weighted connections of the links between nodes with different attributes. This represents the strength of the connection between different types of nodes within the network.
- H-Index: maximum number of nodes that have at least the same number of connections to other nodes. This represents the network cohesion, avoiding the effects of outliers.
The node level analysis, also known as dyadic analysis, assesses the network embeddedness of the nodes, providing the informational value of the nodes attending to its structural position in the network [47]. Furthermore, the node position and embeddedness provide differential access to information within innovation systems [48,49]. The following metrics are considered in this study:
- Degree: number of nodes to which a given one is connected. In the case of weighted networks, as in this work, this calculates the sum of the ties’ values. This represents the opportunities of a node to access the knowledge that is flowing through the network.
- Closeness: for a particular node, the average of the lengths of the shortest paths to every other node of the network. This represents how close a node is to all the other nodes.
- Eigenvector: influence of a node in the network. This represents a prestige rating, in which relative ratings are given to all nodes in the network, the connections to high-rating nodes contribute more to the score of the considered node than equal connections to low rating ones.
- Betweenness: number of times that a given node belongs to the shortest paths between two other nodes. This represents the control of a particular node over the knowledge flows between all the other nodes of the network.
3. Results
Within this section, the networks of entities and projects behind the European innovation systems fostered by H2020 are constructed and assessed, considering them as a whole system (network cohesion) and evaluating the individual role of the nodes (node centrality). Then, the relation of the H2020 thematic coverage with the RIS3 scientific domains, prioritized for each region, is presented.
3.1. Regional Networks of Entities: Cohesion and Centrality Metrics
The three networks, one for each Spanish coal region, including the entities exclusively based in this region, have been developed. Table 9 presents different cohesion metrics for the three networks.
Table 9.
Regional networks of entities: cohesion metrics.
The average degree of the entities from the Aragon network is significantly higher (1.115) than in Castilla y León (0.952) and Asturias (0.853). Thus, although the density (i.e., the number of edges divided by the maximum number possible) is higher in Asturias (0.013) than in Aragón (0.009) or in Castilla y León (0.008), this may be an effect of the lower number of participating entities. In this respect, looking to the connectedness ratio, while 13.4% of the entities from Aragón are connected, this metric is reduced in Asturias (6.2%), achieving 12.7% in Castilla y León. Nevertheless, attending to the closure ratio, which is 0.507 in Asturias, 0.138 in Aragón and 0.099 in Castilla y León, it can be seen that, in Asturias, transitivity in relational triads is higher—partners of a partner are also partners—, with the strongest cohesion among the connected entities. This is in line with the diameter (i.e., the length of the longest geodesic path) that is smaller (6) in Asturias, reaching 7 in Castilla y León and 8 in Aragón.
The role of the different types of entities, considering whether they are coordinators or partners, is assessed relying on the centrality metrics presented in Table 10. Although, in general, it can be seen how the coordinators have a prominent role within the networks, Asturias presents lower centrality rates for the coordinators in terms of degree and betweenness. While coordinators in Aragón rank 10.5 times more than participants in eigenvector and those in Castilla y León 7.75 times more, in Asturias, coordinators only rank 3.8 times more. It can be deducted that coordinators in Asturias are poorly integrated into the network compared with the other two regions.
Table 10.
Regional networks of entities: centrality measures disaggregated by the role played in the projects.
The centrality measures of the different entity types for the three regions are presented in Table 11. Higher education establishments have a prominent position within the networks from the four metrics’ perspective, being tractors of the innovation system. This prominent position may be a consequence of the large size of this type of institution, which acts as a knowledge hub. They are followed by research centers, public bodies, other types of entities and, finally, by private companies. It is important to note that, on average, private companies achieve the lowest centrality measures, with the smallest influence in the network. These low centrality measures of the private companies occur, to a larger extent, in Castilla y León, while in Asturias, the situation differs, as private companies hold a more equilibrated situation.
Table 11.
Regional networks of entities: average centrality measures disaggregated by the entity activity type.
3.1.1. Centrality Measures within the Regional Aragón Network of Entities
Regarding the individual entities, Table 12 presents those entities within the regional network of Aragón with the top ten values at three different indicators: degree, eigenvector and betweenness. A total of 19 entities are participating in these three top ten indexes. Two of them, the University of Zaragoza—the only public University in the region with a long tradition and a generalist scope—and Fundación CIRCE—a private nonprofit technology center focused on energy and sustainability—appear at the two first positions in the three indicators. The public research institute of the region (Instituto Tecnológico de Aragón, with a generalist scope) and the other private nonprofit technology center of the region (Fundación AITIIP, focused on plastics) appear at the third and fourth positions in degree and betweenness, respectively, not being present at the eigenvector top ten; thus having strong participation and serving as a link between other entities, but not having such a relevant position within the network. Then, there are five entities ranking in two of the three lists: one is a public research center focused on hydrogen technologies (Fundación para el Desarrollo de las Nuevas Tecnologías del Hidrógeno en Aragón), and the other four are private companies, two of them being spin-offs—one from Fundación AITIIP (TecnoPackaging) and the other from the University of Zaragoza (BEOnChip S.L.)—and the other two large companies. Finally, there are nine entities ranking in one of the indicators, two of them are public research institutes linked to the University of Zaragoza—one focused on health (Fundación Instituto de Investigación Sanitaria de Aragón) and one focused on logistics (Fundación Zaragoza Logistics Center)—,one is a public company from the regional government devoted to agriculture and environment (Sociedad Aragonesa de Gestion Agroambiental S.L.), one is the regional federation of businesses (Confederación de Empresarios de Aragón), three are spin-offs from the University of Zaragoza (Ebers Medical technology S.L. and Nanoscale Biomagnetics S.L. and Esciencia Eventos Científicos S.L.) and two are large companies—one devoted to household appliances (BSH Electrodomésticos España S.L.) and a winery (Bodegas Aragonesas S.A.).
Table 12.
Aragón regional network of entities: centrality metrics for the top 10 entities (degree, eigenvector and betweenness).
As a summary, considering the scope of the main players, those related to renewable energy, agri-food and circular economy may have a relevant contribution to the low carbon transition paths in Aragón.
In order to have a picture of the regional network of Aragón, Figure 2 presents the graphical representation of the network, including only those entities with a degree higher than one.
Figure 2.
Aragón regional network of entities: graphical representation showing only entities with a degree higher than 1.
Regarding the collaboration between companies in the Aragón region, Figure 3 presents those private companies with a degree higher than one. It can be observed how weak this network is, as well as the role played by the University and the research centers in the network integration.
Figure 3.
Aragón regional network of entities: graphical representation showing only private companies with a degree higher than 1.
3.1.2. Centrality Measures within the Asturias Regional Network of Entities
Regarding the Asturias network of entities, Table 13 presents those participants with the top ten values at degree, eigenvector and betweenness centrality measures. In the betweenness metric, only seven entities have a score higher than zero. A total of 14 entities are participating in these three top ten indexes. Six of them are ranked in the three metrics: the public university of the region (Universidad de Oviedo), one spin-off from this University devoted to spectroelectrochemical instruments (Metrohm Dropsens S.L., Oviedo, Spain), one company dedicated to big data and artificial intelligence (Tree Technolgy S.A., Madrid, Spain), a dairy company (Industrias Lácteas Asturianas S.A., Anleo, Spain) and the European Business and Innovation Centre from the region (Asociación Centro Europeo de Empresas e Innovación del Principado de Asturias). There are two companies participating in the two top ten lists of eigenvector and betweenness, so with prominent positions, even with a lower number of links: a company related to surgery equipment (MBA Incorporado S.L., Gijón, Spain) and the company Treelogic, from the same group as Tree Technology S.A. Finally, there are two large companies: one dedicated to steel production (Arcelor Mittal España S.A., Avilés, Spain) and one to digital transformation (Izertis S.A., Gijón, Spain), which is a spin-off of the Oviedo University devoted to new drugs for the oncology field (Entrechem S.L., Oviedo, Spain), a high-tetch SME devoted to microalgae (Neoalgae), the public development agency for the region (Instituto de Desarrollo Económico de Asturias), a public foundation devoted to foster research activities in the region, including the participation in Horizon 2020 (Fundación para el Fomento en Asturias de la Investigación Científica Aplicada y Tecnología) and, finally, the regional federation of businesses (Federación Asturiana de Empresarios).
Table 13.
Asturias regional network of entities: centrality metrics for the top 10 entities (degree, eigenvector and betweenness).
As a summary, considering the scope of the main players, those related to ocean, steel, agri-food and power electronics may have a relevant contribution to the low carbon transition paths in Asturias.
Figure 4 provides a graphical representation of the regional network in Asturias, including only those entities with a degree higher than one.
Figure 4.
Asturias regional network of entities, showing only entities with a degree higher than one.
In order to depict the collaboration between companies in Asturias, Figure 5 presents the network composed by those private companies with a degree higher than one. It shows a weak network similar to the Aragón one.
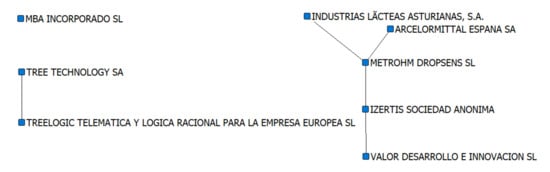
Figure 5.
Asturias regional network of entities, showing only private companies with a degree higher than one.
3.1.3. Centrality Measures within the Castilla y León Regional Network of Entities
The ten entities with the highest centrality metrics are presented in Table 14. There are four entities present at the three top ten ranks of centrality metrics (degree, eigenvector and betweenness): a horizontal private nonprofit technology center (Fundación CARTIF), two public generalist universities (Universidad de Burgos and Universidad de Valladolid) and the Municipality of Valladolid (Ayuntamiento de Valladolid). Then, there are five entities ranking in the degree and betweenness metrics: a public generalist university (Universidad de Salamanca), a private nonprofit research center focused on new materials (Fundación ICAMCYL), a private nonprofit multisector technology center (Instituto Tecnológico de Castilla y León), a cluster of construction entities (Agrupación Empresarial Innovadora para la Construcción Eficiente) and the Department of Environment of the Regional Government (Consejería de Fomento y Medioambiente). Finally, there are eight additional entities present within the highest centrality scores: a public national research center focused on human evolution (Centro Nacional de Investigación sobre la Evolución Humana), the public water authority of the Duero river (Confederación Hidrográfica del Duero), the public regional energy agency (Ente Público Regional de la Energía de Castilla y León), the public entity for businesses support (Instituto para la Cometitividad Empresarial de Castilla y León), a nonprofit energy consumers cooperative (Energética S. Coop.), a company devoted to disabled employability (Grupo Lince S.L.U., Valladolid, Spain), a company manufacturer of transparent photovoltaics glass for buildings (Onyx Solar Energy S.L., Ávila, Spain), and an IT company (Xeridia S.L., León, Spain).
Table 14.
Castilla y León regional network of entities: centrality metrics for the top 10 entities (degree, eigenvector and betweenness).
As a summary, considering the scope of the main players, those related to sustainable construction and renewable energy may have a relevant contribution to the low carbon transition paths in Castilla y León.
In order to provide a graphical representation of the regional network in Castilla y León, Figure 6 represents the links between the entities with a degree higher than one.
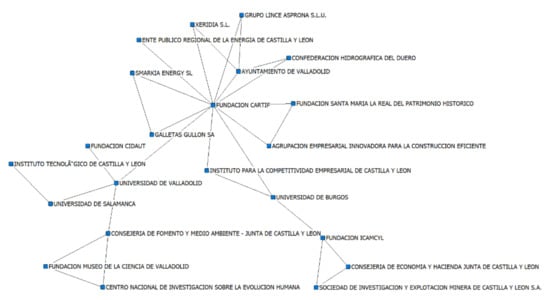
Figure 6.
Castilla y León regional network of entities, showing only entities with a degree higher than one.
Furthermore, in order to present the collaboration between companies, Figure 7 present the only relation between companies with a degree higher than one. This network is also weak, like in the other regions.
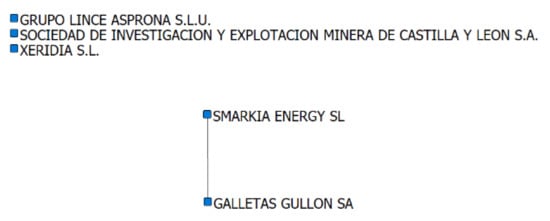
Figure 7.
Castilla y León regional network of entities, showing only private companies with a degree higher than one.
3.2. Network of Projects: Cohesion and Centrality Metrics
The network of projects developed in each region is evaluated, as the network of partners, from two perspectives. Firstly, it is assessed as a complete innovation system relying on cohesion metrics. In order to analyze the contribution of each research area to the overall innovation system, the density within each pillar, program and subprogram is calculated. Secondly, in order to assess the role of each project within the network, their centrality metrics are calculated and analyzed, also considering each pillar, program and subprogram.
In Table 15, the cohesion metrics of the network of projects from the three regions is presented. The Aragón region presents the more cohesive network, with significantly higher values in the average degree, H-index, density and closure metrics. These characteristics show that the different projects are well connected, enabling the knowledge exchange and the development of technological trajectories. In contrast, the Asturias region shows the weakest network, with reduced values at all the parameters, especially in average degree, H-index, density and connectedness. Castilla y León, although presenting a high connectedness value—80.8% of its projects are connected—shows reduced levels in the closure ratio, with a density similar to the Asturias one.
Table 15.
Aragón, Asturias and Castilla y León networks of projects: cohesion metrics.
Regarding the Aragón network, the density at each pillar, program and subprogram, as well as the centrality parameters of their projects, are calculated and presented in Table 16 (only those subprograms with at least 10 projects are included). The highest density appears at the Excellent Science Programme, as there are some consecutive crosscutting projects under the Future and Emerging Technology Programme that are developed by similar consortia, which highly increases the density. The stable participation of the same academic partners in this pillar clearly contributes to its high density and centrality metrics, which is a recurrent fact in the three regions.
Table 16.
Aragón projects network: cohesion (density) and centrality metrics (average degree, betweenness and eigenvector) by pillar, program and subprogram (for the subprograms, only those with more than 10 projects are included).
The Industrial Leadership and the Societal Challenge Pillars provide clearer information about the thematic research areas in which the regional innovation system is focused. In this respect, resource efficiency and energy arise as the most developed and cohesive research fields. In the area of resource efficiency, there is relevant participation in programs such as Resource Efficiency in the Process Industries (SPIRE), Sustainable supply of Raw materials (under the Climate Programme) and Bio-Based Industries (under the Food Programme). In the area of Energy, the Electricity Grid, Hydrogen and Fuel Cells, and Market Uptake of Energy Innovation are the most remarkable fields. Finally, the subprogram with the highest influence, measured in terms of eigenvector, is the Nanotechnologies, Advanced Materials, Biotechnology, and Advanced Manufacturing and Processing (NMBP).
In summary, Aragon presents its best technological trajectories within six research fields that are mainly related to energy and resource efficiency. In energy, the following three subprograms are included: Electricity grid, Hydrogen and Fuel Cells and market uptake of Energy. While in resource efficiency, the following three are identified: Resource Efficiency in Process Industries (SPIRE), Nanotechnologies, Advanced Materials, Biotechnology, and Advanced Manufacturing and Processing (NMBP) and Bio-Based Industries.
The metrics of the Asturias projects network are shown in Table 17. Similar to Aragón, the Excellence Science Pillar is the most cohesive one thanks to the large Future and Emerging Technologies projects in which the consortia are almost maintained. Regarding the Industrial Leadership and Societal Challenges Pillars, the most cohesive subprograms are Factories of the Future, followed by NMBP (Nanotechnologies, Advanced Materials, Biotechnology, and Advanced Manufacturing and Processing), SPIRE (Resource Efficiency in Process Industries), Low Carbon Electricity (under the Energy Programme) and Sustainable and healthy Agri-Food (under the Food Programme). In terms of influence, Factories of the Future shows the highest eigenvector. In addition, NMBP (Nanotechnologies, Advanced Materials, Biotechnology, and Advanced Manufacturing and Processing) has a high eigenvector value, followed by Low carbon electricity and Sustainable and Healthy Agri-Food.
Table 17.
Asturias projects network: cohesion (density) and centrality metrics (average degree, betweenness and eigenvector) by pillar, program and subprogram (for the subprograms, only those with more than 5 projects are included).
In summary, Asturias presents its best technological trajectories under the following five subprograms (1) Factories of the Future (FoF), (2) Nanotechnologies, Advanced Materials, Biotechnology, and Advanced Manufacturing and Processing (NMBP), (3) Resource Efficiency in Process Industries (SPIRE), (4) Low carbon electricity and (5) Sustainable and healthy agri-food.
Regarding the Castilla y León network, the high density of the Excellence Pillar is supported by, in addition to the Future and Emerging technology projects like in the other two regions, nine Research Infrastructures projects related to laser technologies, atmosphere, archaeological heritage and carbon capture and storage.
In terms of cohesion and influence, the most remarkable programs in which the best technological trajectories in Castilla y León appear are Leadership in Enabling and Industrial Technologies, Energy, Health and Transport. When the Subprogrammes are analysed, Energy Efficient Buildings (EeB), Factories of the Future (FoF), Information and Communication Technologies (ICT), Nanotechnologies, Advanced Materials, Biotechnology, and Advanced Manufacturing and Processing (NMBP) and Low carbon electricity are the most remarkable ones. Table 18 presents a summary of these metrics.
Table 18.
Castilla y León projects network: cohesion (density) and centrality metrics (average degree, betweenness and eigenvector) by pillar, program and subprogram (for the subprograms, only those with more than 10 projects are included).
4. Discussion
This paper analyses the regional innovation systems and their alignment with the priorities of the smart specialization strategies (RIS3) in the three Spanish coal regions. More precisely, this work analyzes how the regional innovation systems promoted by the H2020 program at a regional level support the consecution of the RIS3 priorities in the three Spanish coal in transition regions (Aragón, Asturias and Castilla y León). For this purpose, and in line with previous works [9,10], this study considers that these regional innovation systems are generated by the H2020 funded research projects and consortia and present underlying networks in which entities are linked by joint projects and projects linked by common partners. It is assumed that funding research consortia is the mechanism that the EU uses for the development of its research policy, which is creating a network of relationships between projects and partners, forming the regional innovation system.
First, our results show that institutional impulse plays a relevant role in the evolution of regional innovation systems. It is considered that the Institutional Impulse of the EU through the framework programs creates a network of relationships between actors that propitiates the exchange of knowledge and information, which, in line with previous research [50,51], is a crucial element for the innovation and technology development. Moreover, following similar works [52,53], the topological and structural characteristics of the regional innovation systems have been assessed. From our results, it can be concluded that, contrary to previous works [54,55], the centrality metrics provide information to consider the efficiency and efficacy of the regional innovation systems.
Second, regarding the first research question, how do regional innovation systems contribute to the deployment of the RIS3 priorities in the coal in transition regions, the application of SNA allowed the identification of the effectiveness of the innovation policies in the EU. Thus, as a first conclusion, in line with previous research [9,10], it is shown that the network centrality metrics enable the identification of the technological trajectories of the regional innovation systems. The results indicate that, in some cases, the technological strengths of the regional innovation systems are not considered in the RIS3 priorities, while some RIS3 priorities do not have support from the innovation system. In more detail, it is seen that the strategies from the three regions present big differences regarding its scope in terms of broadening and definition; however, energy and resource efficiency have been identified as the two priorities established by the three coal regions that are supported by their regional innovation systems. Moreover, the analysis of the centrality in the regional innovation systems enables the determination of the effectiveness of the institutional impulse [10,56], facilitating the prioritization of the technological trajectories depending on the European energy and sustainability policies. As an example, our results show that several priorities of the regional innovation systems, such as health, which is targeted in the three considered regions, are not supported by their innovation system. Therefore, our results demonstrate the existence of incongruences during the RIS3 definition of priorities, considering the existing innovation systems, which enlarges the evidence presented by previous authors who have already highlighted that existing regional capacities are frequently neglected in the implementation of smart specialization policies [57].
Third, regarding the second research question, how are the innovation systems for the RIS3 design in the coal in transition regions considered, our results corroborate those from previous works [10] that show the relevance of the innovation systems’ cohesion and connectivity properties for its effectiveness. Thus, regarding innovation system performance, regions with lower levels of innovation expenditure and a critical mass of researchers present the weakest innovation systems, with lower cohesion rates, which is in line with previous works [58,59,60] that established that public–private regional innovation networks do have a positive correlation to R&D investment and personnel. This also supports previous studies [11], in which the H2020 program was identified as particularly interesting for evaluating the role of regional innovation networks. Based on these findings, and aligned with the literature [9,10,53], it can be highlighted how the properties of the network of projects and the network of entities created by the consortia affect the efficiency of the regional innovation system. Moreover, the average number of participations per entity is positively related to the regional average degree in the regional network as well as with the proportion of regional entities connected among them (connectivity). Thus, bigger participants contribute to a better integrated regional innovation system; therefore, large participants are key players who act as intermediaries between communities and supra-regional networks, as has already been demonstrated by previous works [61,62].
Fourth, considering both the efficacy and efficiency of the regional innovation systems, the heterogeneity of the nodes, attending to its attributes, should be considered. In this line, according previous works [9], in our study we have considered the performance of innovation systems. Our results show that higher education establishments and research centers occupy a prominent position within the innovation system, as established in the literature [63,64,65], showing higher centrality metrics in the SNA analysis and acting as enablers of knowledge exchange and collaboration, thus supporting the execution of the regional research policy goals. In this sense, the authors have already highlighted the relevance of ensuring the diversity of the nodes, considering the relevance of technology transfer between universities and research centers and the companies [9]. Moreover, the high level of centrality of universities has been appointed as a requirement for the market transfer of the research and innovation results [66,67].
Finally, like any other, this study has limitations. The empirical work is focused on the H2020 projects. Thus, on the one hand, further research should analyze FP7, the predecessor of H2020, as well as Horizon Europe, its successor, to assess the progress of the energy R&D ecosystem in these regions. On the other hand, non-European areas, such as Africa or South America, in which there are not similar collaborative research funding programs, or in which the participation data are not available, cannot benefit easily from the methods used in this study. It should be also considered that innovation activities outside H2020 have not been considered in this study, thus neglecting its contribution to the innovation system functioning. Furthermore, as three coal in transition regions from the same country have been considered, further work may be required to enlarge the scope of this study considering other regional challenges and geographical contexts.
5. Conclusions
Our work proposes relevant theoretical and practical contributions. From the theoretical perspective, the first group of contributions extends the literature on regional innovation systems in terms of their modelling and effectiveness, particularly for the coal in transition regions [68,69,70]. Thus, from our conceptualization, the innovation system consists of diverse nodes, both in terms of typology and geographic dispersion, interacting to collaborate and share information and knowledge. This modelling allows us to consider the effectiveness of the innovation system in terms of this network structure and properties, which, relying on the potential of the social network analysis, allows us to determine the ability to achieve the objectives of the research and development policy. Therefore, we indicated the convenience of conceiving the regional innovation system as a network of relationships between entities and projects to understand how the effectiveness of this innovation system at the regional level is related to the node attributes as well as their position within the network. Moreover, the study revealed how the structural properties of the network vary in each research area, affecting the centrality and cohesion metrics, both in terms of knowledge transfer and collaboration within the region, at the different technological trajectories.
The second group of theoretical contributions is rooted in regional innovation systems. While the regional studies emphasize the regional characteristics of the concentration of highly specialized skills and knowledge, institutions, related businesses and clients in a particular region [71,72,73], our work extends the regional innovation systems literature by pointing out that the correct evaluation of the research policy must analyze the topology and structural properties of the innovation systems’ related networks in the region. First, the cohesion of the innovation systems allows an assessment of the viability of potential collaborations, transfer of information and knowledge, and geographic cohesion for the different technology and research fields. Second, the centrality metrics of the innovation system allow the evaluation of research policies in terms of competitiveness. Lastly, the connectivity of the network allows an analysis of the transversality between the different research programs as a way to promote synergistic effects between them.
This study has strong implications for management and research policymaking. First, the design of smart specialization strategies should focus on the strengths of the innovation systems existing in the region to avoid fragmentation, improving the collaboration between projects and entities and fostering transversal actions. Moreover, the involvement in these actions of the project coordinators, particularly universities and research centers, may be beneficial, as they are the most influential nodes of the network. Second, regional research policymakers may apply the proposed method and findings to their regions to evaluate the existing innovation system and consider it in the next generation of smart specialization strategies definition. European policymakers may consider these results to reshape the next FPs to foster the development of the smart specialization strategies of the European regions. In addition, regional and national policymakers may rely on this study to design regional support programs to facilitate the participation of their regional entities into European programs, to rely on their contribution to the promotion of regional innovation systems. Finally, individual participants may apply the results of this study to select their consortium partners to enhance their network position, thus improving their access to knowledge and research capabilities.
Regarding the case of the coal in transition regions, the consideration of the existing strengths and capacities, that in our empirical study have consistently been related to energy and resource efficiency, seems to be crucial for the effectiveness of the policy making. Furthermore, the prioritization of technology fields not supported by the innovation system, should be performed consciously and, in consequence, with the pertinent support mechanisms and institutional impulse to foster the evolution of the innovation systems towards these new priorities.
Furthermore, considering the EU decarbonization goals that particularly challenge some of its regions, the new Horizon Europe Programme that addresses the period 2021–2027, can consider the conclusions from this work to enhance the effectiveness of its institutional impulse. Moreover, the regional policies, and especially those related to the just transition in coal regions, can benefit from the analysis of the regional innovation systems to align their strategies for the upcoming RIS3.
Finally, the authors consider that, in this work, the regions have been considered as isolated innovation systems, but their connections and links with other innovation systems geographically located outside the regions should be studied in further research to determine their affection to the regional innovation systems performance. Furthermore, more empirical studies, targeting other regions, in other location, or presenting other challenges different from the coal transition, could be beneficial to enlarge the applicability of the obtained conclusions.
Author Contributions
E.C.-G.: conceptualization; data curation; funding acquisition; investigation; project administration; resources; writing—original draft; software. N.A.: conceptualization; formal analysis; investigation; methodology; supervision; validation; writing—review and editing. J.C.F.d.A.: conceptualization; formal analysis; investigation; methodology; supervision; validation; writing—review and editing. All authors have read and agreed to the published version of the manuscript.
Funding
This research was funded by the Spanish Ministry of Science and Innovation (CDTI—Industrial and Technological Development Centre of Spain) under the research Project ENERISLA (CER-20191002).
Institutional Review Board Statement
Not applicable.
Informed Consent Statement
Not applicable.
Data Availability Statement
Data available in a publicly accessible repository of the European Commission at CORDIS in the data.europa.eu site, particularly, in the following link: https://data.europa.eu/data/datasets/cordish2020projects?locale=en 19 October 2020.
Conflicts of Interest
The authors declare no conflict of interest.
References
- Polido, A.; Pires, S.M.; Rodrigues, C.; Teles, F. Sustainable development discourse in Smart Specialization Strategies. J. Clean. Prod. 2019, 240, 118224. [Google Scholar] [CrossRef]
- McCann, P.; Ortega-Argilés, R. Smart Specialization, Regional Growth and Applications to European Union Cohesion Policy. Reg. Stud. 2015, 49, 1291–1302. [Google Scholar] [CrossRef]
- Oei, P.-Y.; Hermann, H.; Herpich, P.; Holtemöller, O.; Lünenbürger, B.; Schult, C. Coal phase-out in Germany—Implications and policies for affected regions. Energy 2020, 196, 117004. [Google Scholar] [CrossRef]
- Ćetković, S.; Buzogány, A. Between markets, politics and path-dependence: Explaining the growth of solar and wind power in six Central and Eastern European countries. Energy Policy 2020, 139, 111325. [Google Scholar] [CrossRef]
- Raźniak, P.; Dorocki, S.; Rachwał, T.; Winiarczyk-Raźniak, A. The Role of the Energy Sector in the Command and Control Function of Cities in Conditions of Sustainability Transitions. Energies 2021, 14, 7579. [Google Scholar] [CrossRef]
- Raźniak, P.; Dorocki, S.; Rachwał, T.; Winiarczyk-Raźniak, A. Influence of Energy Sector Corporations on the Corporate Control Functions of Cities. Int. J. Energy Econ. Policy 2021, 11, 333–340. [Google Scholar] [CrossRef]
- Heinisch, K.; Holtemöller, O.; Schult, C. Power generation and structural change: Quantifying economic effects of the coal phase-out in Germany. Energy Econ. 2020, 95, 105008. [Google Scholar] [CrossRef]
- Brauers, H.; Oei, P.-Y. The political economy of coal in Poland: Drivers and barriers for a shift away from fossil fuels. Energy Policy 2020, 144, 111621. [Google Scholar] [CrossRef]
- De Arroyabe, J.C.F.; Schumann, M.; Sena, V.; Lucas, P. Understanding the network structure of agri-food FP7 projects: An approach to the effectiveness of innovation systems. Technol. Forecast. Soc. Chang. 2020, 162, 120372. [Google Scholar] [CrossRef]
- Calvo-Gallardo, E.; Arranz, N.; de Arroyabe, J.C.F. Analysis of the European energy innovation system: Contribution of the Framework Programmes to the EU policy objectives. J. Clean. Prod. 2021, 298, 126690. [Google Scholar] [CrossRef]
- Di Cagno, D.; Fabrizi, A.; Meliciani, V.; Wanzenböck, I. The impact of relational spillovers from joint research projects on knowledge creation across European regions. Technol. Forecast. Soc. Chang. 2016, 108, 83–94. [Google Scholar] [CrossRef]
- Mattes, J.; Huber, A.; Koehrsen, J. Energy transitions in small-scale regions—What we can learn from a regional innovation systems perspective. Energy Policy 2014, 78, 255–264. [Google Scholar] [CrossRef]
- Maruccia, Y.; Solazzo, G.; Del Vecchio, P.; Passiante, G. Evidence from Network Analysis application to Innovation Systems and Quintuple Helix. Technol. Forecast. Soc. Chang. 2020, 161, 120306. [Google Scholar] [CrossRef]
- Dehdarian, A.; Tucci, C.L. A complex network approach for analyzing early evolution of smart grid innovations in Europe. Appl. Energy 2021, 298, 117143. [Google Scholar] [CrossRef]
- Sena, V.; Arranz, N.; Lucas, P.; Park, H.W.; de Arroyabe, J.C.F. “Editorial: Big Data and Network Analysis in National Innovation Systems (NIS)”. Technol. Forecast. Soc. Chang. 2021, 168, 120790. [Google Scholar] [CrossRef]
- Llopis, O.; D’Este, P.; Díaz-Faes, A.A. Connecting others: Does a tertius iungens orientation shape the relationship between research networks and innovation? Res. Policy 2021, 50, 104175. [Google Scholar] [CrossRef]
- Falcone, P.M.; D’Alisa, G.; Germani, A.R.; Morone, P. When all seemed lost. A social network analysis of the waste-related environmental movement in Campania, Italy. Politi- Geogr. 2019, 77, 102114. [Google Scholar] [CrossRef] [Green Version]
- Falcone, P.M.; De Rosa, S.P. Use of fuzzy cognitive maps to develop policy strategies for the optimization of municipal waste management: A case study of the land of fires (Italy). Land Use Policy 2020, 96, 104680. [Google Scholar] [CrossRef]
- Yip, W.; To, S. Identification of stakeholder related barriers in sustainable manufacturing using Social Network Analysis. Sustain. Prod. Consum. 2021, 27, 1903–1917. [Google Scholar] [CrossRef]
- Morone, P.; Falcone, P.M.; Tartiu, V.E. Food waste valorisation: Assessing the effectiveness of collaborative research networks through the lenses of a COST action. J. Clean. Prod. 2019, 238, 117868. [Google Scholar] [CrossRef]
- Nunes, M.; Abreu, A.; Bagnjuk, J.; Tiedtke, J. Measuring project performance by applying social network analyses. Int. J. Innov. Stud. 2021, 5, 35–55. [Google Scholar] [CrossRef]
- Sá, E.S.; de Pinho, J.C.M.R. Effect of entrepreneurial framework conditions on R&D transfer to new and growing firms: The case of European Union innovation-driven countries. Technol. Forecast. Soc. Chang. 2019, 141, 47–58. [Google Scholar]
- De Juana-Espinosa, S.; Luján-Mora, S. Open government data portals in the European Union: Considerations, development, and expectations. Technol. Forecast. Soc. Chang. 2019, 149, 119769. [Google Scholar] [CrossRef] [Green Version]
- Mignon, I.; Bergek, A. System- and actor-level challenges for diffusion of renewable electricity technologies: An in-ternational comparison. J. Clean. Prod. 2016, 128, 105–115. [Google Scholar] [CrossRef]
- Asheim, B.T. Smart specialisation, innovation policy and regional innovation systems: What about new path development in less innovative regions? Innov. Eur. J. Soc. Sci. Res. 2019, 32, 8–25. [Google Scholar] [CrossRef]
- Trippl, M.; Zukauskaite, E.; Healy, A. Shaping smart specialization: The role of place-specific factors in advanced, intermediate and less-developed European regions. Reg. Stud. 2019, 54, 1328–1340. [Google Scholar] [CrossRef] [Green Version]
- Foray, D.; Goddard, J.; Goenaga Beldarrain, X.; Landabaso, M.; McCann, P.; Morgan, K.; Nauwelaers, C.; Ortega-Argiles, R. Guide to Research and Innovation Strategies for Smart Specialisations (RIS 3); EU Commission, Publications Office of the European Union, Regional Policy: Luxembourg, 2012. [Google Scholar]
- Cebolla, R.O.; Navas, C. Supporting hydrogen technologies deployment in EU regions and Member States: The Smart Specialisation Platform on Energy (S3PEnergy). Int. J. Hydrog. Energy 2019, 44, 19067–19079. [Google Scholar] [CrossRef]
- Truffer, B.; Coenen, L. Environmental Innovation and Sustainability Transitions in Regional Studies. Reg. Stud. 2012, 46, 1–21. [Google Scholar] [CrossRef]
- Heiligenberg, H.A.V.D.; Heimeriks, G.J.; Hekkert, M.P.; van Oort, F.G. A habitat for sustainability experiments: Success factors for innovations in their local and regional contexts. J. Clean. Prod. 2017, 169, 204–215. [Google Scholar] [CrossRef] [Green Version]
- Arnone, M.; Cavallaro, C. The Challenge of a Place-and Network-based Approach to Development in Italian Regions. Procedia—Soc. Behav. Sci. 2016, 223, 31–36. [Google Scholar] [CrossRef] [Green Version]
- Dahesh, M.B.; Tabarsa, G.; Zandieh, M.; Hamidizadeh, M. Reviewing the intellectual structure and evolution of the innovation systems approach: A social network analysis. Technol. Soc. 2020, 63, 101399. [Google Scholar] [CrossRef]
- Cha, J.M. A just transition for whom? Politics, contestation, and social identity in the disruption of coal in the Powder River Basin. Energy Res. Soc. Sci. 2020, 69, 101657. [Google Scholar] [CrossRef]
- Scott, M.; Powells, G. Towards a new social science research agenda for hydrogen transitions: Social practices, energy justice, and place attachment. Energy Res. Soc. Sci. 2019, 61, 101346. [Google Scholar] [CrossRef]
- Skoczkowski, T.; Bielecki, S.; Kochański, M.; Korczak, K. Climate-change induced uncertainties, risks and opportunities for the coal-based region of Silesia: Stakeholders’ perspectives. Environ. Innov. Societal Trans. 2020, 35, 460–481. [Google Scholar] [CrossRef]
- Spencer, T.; Colombier, M.; Sartor, O.; Garg, A.; Tiwari, V.; Burton, J.; Caetano, T.; Green, F.; Teng, F.; Wiseman, J. The 1.5 °C target and coal sector transition: At the limits of societal feasibility. Clim. Policy 2017, 18, 335–351. [Google Scholar] [CrossRef]
- Evans, G.; Phelan, L. Transition to a post-carbon society: Linking environmental justice and just transition discourses. Energy Policy 2016, 99, 329–339. [Google Scholar] [CrossRef]
- Cherp, A.; Vinichenko, V.; Jewell, J.; Brutschin, E.; Sovacool, B. Integrating techno-economic, socio-technical and political perspectives on national energy transitions: A meta-theoretical framework. Energy Res. Soc. Sci. 2018, 37, 175–190. [Google Scholar] [CrossRef]
- Markard, J.; Raven, R.; Truffer, B. Sustainability transitions: An emerging field of research and its prospects. Res. Policy 2012, 41, 955–967. [Google Scholar] [CrossRef]
- Fuenfschilling, L.; Truffer, B. The structuration of socio-technical regimes—Conceptual foundations from institutional theory. Res. Policy 2014, 43, 772–791. [Google Scholar] [CrossRef]
- Platform on Coal and Carbon-Intensive Regions. Terms of Reference. Available online: https://ec.europa.eu/energy/sites/default/files/crit_tor_fin.pdf (accessed on 4 January 2021).
- Instituto Nacional de Estadística. Data Corresponding to 2018. Available online: https://www.ine.es/dyngs/INEbase/listaoperaciones.htm (accessed on 10 December 2021).
- Estadística Minera de España. Plan Estadístico Nacional. Instituto Nacional de Estadística. 2010–2018. Available online: https://energia.gob.es/mineria/Estadistica/Paginas/Consulta.aspx (accessed on 10 December 2021).
- Estrategia de Transición Justa. Plan de Acción Urgente para Comarcas de Carbón y Centrales en Cierre; Instituto para la Transicion Justa; Ministerio para la Transición Ecológica y el Reto Demográfico: Madrid, Spain, 2020; ETJ: 665-20-016-5.
- Open Processes for the Establishment of Fair Transition Agreements in the Spanish Coal in Transition Regions. Available online: https://www.transicionjusta.gob.es/Convenios_transicion_justa/procesos_en_marcha-ides-idweb.asp (accessed on 10 December 2021).
- Wasserman, S.; Faust, K. Social Network Analysis: Methods and Applications; Cambridge University Press: Cambridge, UK, 1999. [Google Scholar]
- Gulati, R. Does familiarity breed trust? The implications of repeated ties for contractual choice in alliances. Acad. Manag. J. 1995, 38, 85–112. [Google Scholar]
- Arranz, N.; Arroyabe, M.F.; Schumann, M. The role of NPOs and international actors in the national innovation system: A network-based approach. Technol. Forecast. Soc. Chang. 2020, 159, 120183. [Google Scholar] [CrossRef]
- Grewal, R.; Lilien, G.L.; Mallapragada, G. Location, Location, Location: How Network Embeddedness Affects Project Success in Open Source Systems. Manag. Sci. 2006, 52, 1043–1056. [Google Scholar] [CrossRef]
- Enkel, E.; Gassmann, O.; Chesbrough, H. Open R&D and open innovation: Exploring the phenomenon. R&D Manag. 2009, 39, 311–316. [Google Scholar] [CrossRef]
- Huang, Q.; Liu, H.; Zhong, X. The impact of transactive memory systems on team performance. Inf. Technol. People 2013, 26, 191–212. [Google Scholar] [CrossRef]
- Kang, M.J.; Hwang, J. Structural dynamics of innovation networks funded by the European Union in the context of systemic innovation of the renewable energy sector. Energy Policy 2016, 96, 471–490. [Google Scholar] [CrossRef]
- Muñiz, A.S.G.; Cuervo, M.R.V. Exploring research networks in Information and Communication Technologies for energy efficiency: An empirical analysis of the 7th Framework Programme. J. Clean. Prod. 2018, 198, 1133–1143. [Google Scholar] [CrossRef]
- Hekkert, M.; Suurs, R.; Negro, S.; Kuhlmann, S.; Smits, R. Functions of innovation systems: A new approach for analysing technological change. Technol. Forecast. Soc. Chang. 2007, 74, 413–432. [Google Scholar] [CrossRef] [Green Version]
- Papaioannou, T.; Wield, D.; Chataway, J. Knowledge ecologies and ecosystems? An empirically grounded reflection on recent developments in innovation systems theory. In Proceedings of the 6th International Triple Helix Conference on University-Government-Industry Relations, Singapore, 16–17 May 2007. [Google Scholar]
- De Noni, I.; Ganzaroli, A.; Pilotti, L. Spawning exaptive opportunities in European regions: The missing link in the smart specialization framework. Res. Policy 2021, 50, 104265. [Google Scholar] [CrossRef]
- Radosevic, S. Assessing EU Smart Specialization Policy in a Comparative Perspective. In Advances in the Theory and Practice of Smart Specialization; Radosevic, S., Curaj, A., Gheorghiu, R., Andreescu, L., Wade, I., Eds.; Elsevier; Academic Press: Cambridge, MA, USA, 2017; pp. 1–36. [Google Scholar] [CrossRef]
- Min, S.; Kim, J.; Sawng, Y.-W. The effect of innovation network size and public R&D investment on regional innovation efficiency. Technol. Forecast. Soc. Chang. 2020, 155, 119998. [Google Scholar] [CrossRef]
- Jun, S.-P.; Lee, J.-S.; Lee, J. Method of improving the performance of public-private innovation networks by linking heterogeneous DBs: Prediction using ensemble and PPDM models. Technol. Forecast. Soc. Chang. 2020, 161, 120258. [Google Scholar] [CrossRef]
- Thomas, V.J.; Sharma, S.; Jain, S.K. Using patents and publications to assess R&D efficiency in the states of the USA. World Pat. Inf. 2011, 33, 4–10. [Google Scholar] [CrossRef]
- Richter, R.; Christmann, G.B. On the role of key players in rural social innovation processes. J. Rural Stud. 2021. [Google Scholar] [CrossRef]
- Cahoon, S.; Pateman, H.; Chen, S.-L. Regional port authorities: Leading players in innovation networks? J. Transp. Geogr. 2012, 27, 66–75. [Google Scholar] [CrossRef]
- Bukhari, E.; Dabic, M.; Shifrer, D.; Daim, T.; Meissner, D. Entrepreneurial university: The relationship between smart specialization innovation strategies and university-region collaboration. Technol. Soc. 2021, 65, 101560. [Google Scholar] [CrossRef]
- Sedlacek, S. The role of universities in fostering sustainable development at the regional level. J. Clean. Prod. 2013, 48, 74–84. [Google Scholar] [CrossRef]
- Bramwell, A.; Wolfe, D.A. Universities and regional economic development: The entrepreneurial University of Waterloo. Res. Policy 2008, 37, 1175–1187. [Google Scholar] [CrossRef]
- Kastrinos, N.; Weber, K.M. Sustainable development goals in the research and innovation policy of the European Union. Technol. Forecast. Soc. Chang. 2020, 157, 120056. [Google Scholar] [CrossRef]
- Jaekel, M.; Wallin, A.; Isomursu, M. Guiding Networked Innovation Projects Towards Commercial Success—a Case Study of an EU Innovation Programme with Implications for Targeted Open Innovation. J. Knowl. Econ. 2015, 6, 625–639. [Google Scholar] [CrossRef]
- Kashani, E.S.; Roshani, S. Evolution of innovation system literature: Intellectual bases and emerging trends. Technol. Forecast. Soc. Chang. 2019, 146, 68–80. [Google Scholar] [CrossRef]
- Kapetaniou, C.; Samdanis, M.; Lee, S.H. Innovation policies of Cyprus during the global economic crisis: Aligning financial institutions with National Innovation System. Technol. Forecast. Soc. Chang. 2018, 133, 29–40. [Google Scholar] [CrossRef]
- Lundvall, B.-Å. Innovation System Research and Policy Where It Came from and where It might Go; Globelics Working Paper Series 2007-01, Globelics—Global Network for Economics of Learning, Innovation, and Competence Building Systems; Aalborg University, Department of Business and Management: Aalborg, Denmark, 2007. [Google Scholar]
- Barrutia, J.M.; Echebarria, C.; Apaolaza-Ibáñez, V.; Hartmann, P. Informal and Formal Sources of Knowledge as Drivers of Regional Innovation: Digging a Little Further into Complexity. Environ. Plan. A: Econ. Space 2014, 46, 414–432. [Google Scholar] [CrossRef]
- Oerlemans, L.; Meeus, M. Do organizational and spatial proximity impact on firm performance? Reg. Stud. 2005, 39, 89–104. [Google Scholar] [CrossRef] [Green Version]
- Cooke, P.; Clifton, N.; Oleaga, M. Social capital, firm embeddedness and regional development. Reg. Stud. 2005, 39, 1065–1077. [Google Scholar] [CrossRef]
Publisher’s Note: MDPI stays neutral with regard to jurisdictional claims in published maps and institutional affiliations. |
© 2022 by the authors. Licensee MDPI, Basel, Switzerland. This article is an open access article distributed under the terms and conditions of the Creative Commons Attribution (CC BY) license (https://creativecommons.org/licenses/by/4.0/).