Article

Assessing Carbon Storage Potential of Forested Wetland Soils in Two Physiographic Provinces of Northern Virginia, USA

Department of Environmental Science and Policy, George Mason University, Fairfax, VA 22030, USA
*
Author to whom correspondence should be addressed.
Sustainability 2022, 14(4), 2048; https://doi.org/10.3390/su14042048
Submission received: 21 January 2022 / Revised: 5 February 2022 / Accepted: 8 February 2022 / Published: 11 February 2022

Abstract

:
This study assessed the soil carbon storage potential in terms of the total carbon (TC) and total carbon stocks (TC stocks) and associated soil physicochemical properties (i.e., soil pH, bulk density (Db), and gravimetric soil moisture (GSM)) for four forested wetlands in the urbanized region of Northern Virginia (NOVA). The study sites were balanced between the two physiographic provinces of the region (Piedmont vs. Coastal Plain); at each site, soils were sampled and analyzed (n = 180) at three depth intervals (0–10 cm; 10–20 cm; 20–30 cm). There was no significant difference in TC stocks between physiographic provinces (p > 0.05); however, wetland soils had higher TC contents at the Coastal Plain (4.32 ± 0.41%) than in Piedmont (2.57 ± 0.22%; p < 0.05). Both Db and GSM significantly differed by physiographic province and were highly correlated to TC, indicating that the TC variability is strongly explained by Db (R2 = 0.38) or GSM (R2 = 0.39), respectively (p < 0.01 for all). These outcomes highlight the capacity of urban forested wetlands to store carbon, especially in their topsoil (top 10 cm). Elucidating the carbon storage potentials of forested wetlands in an urbanized landscape may assist with future efforts to combat urban carbon emissions.

1. Introduction

In wetland ecosystems, soil acts as the primary medium for biogeochemical transformations and storage of nutrients that provide important ecosystem services, such as carbon sequestration and storage [1,2]. A wetland’s role in the global carbon cycle depends on the net flux of carbon in or out of the wetland system [3,4], but the total soil carbon contents (TC) and carbon stocks (TC stocks) can serve as a starting point for identifying how effective a site is at accumulating and storing carbon [5,6]: for example, the International Organization of Standardization (ISO) calls for the determination of TC and TN to be monitored over time and used in modeling sequestration rates [7]. Thus, tracking and assessing wetland soil carbon stocks is key to understanding how certain physicochemical and physiographic settings may affect a wetland’s capacity to store carbon in the era of anthropogenic climate change.
Monitoring soil carbon may be particularly useful in urbanizing and urbanized landscapes where green space conservation, preservation, and restoration serve as promising climate resilience strategies. However, modeling carbon sequestration and storage potentials from in situ carbon stocks requires knowledge of the relationships between a given site’s soil carbon and soil physicochemical properties [7]. Previous efforts to quantify and track the carbon storage potential have provided useful insights into these relationships, indicating that plot-specific soil physicochemical properties such as bulk density (Db), pH, and gravimetric soil moisture (GSM) can inform measurements of soil functional properties, including carbon stocks [8,9,10,11,12]. Soil carbon investigations that capture geographic and site variability in soils can therefore provide context to a study on urbanized wetland soils at a regional scale [13,14,15].
Forested wetlands are abundant within the Piedmont (P) and Coastal Plain (CP) physiographic provinces of the United States Mid-Atlantic region; distinct geomorphologies, hydrologic regimes, and soil series may give rise to significant variability in TC stocks between and within regional forested wetlands [16,17]. Moreover, the Northern Virginia (NOVA) region of the Washington, D.C. metropolitan area—Fairfax, Loudoun, and Prince William Counties—has endured extensive conversion of natural habitats into urban landcover, having lost over 60% of pre-development forest and wetland cover as of 2013 [18,19]. NOVA thus provides an opportunity to investigate the interplay between physiographic setting and wetland soil properties within the context of urbanized landscapes [20,21,22,23,24,25,26,27]. While high extents of impervious surface coverage have ultimately changed the cycling of nutrients and water in NOVA, the region’s forested wetlands, whether highly impacted or more remote, may have high carbon storage potentials as demonstrated within forested wetlands of other urbanized regions [14,28].
Our study aimed to assess the soil physicochemistry and its potential to inform soil carbon storage potentials of four forested wetlands across NOVA’s Piedmont and Coastal Plain. Wetland soil properties were characterized and compared with respect to soil physicochemical properties (Db, GSM, and pH) as well as carbon and nitrogen contents (TC, TC stocks, and TN (total nitrogen). The results of the study were compared to previous assessments of Piedmont and Coastal Plain wetland soil carbon contents and stocks through a literature review of studies between 1990 to 2020 focused on similar types of freshwater wetlands.

2. Materials and Methods

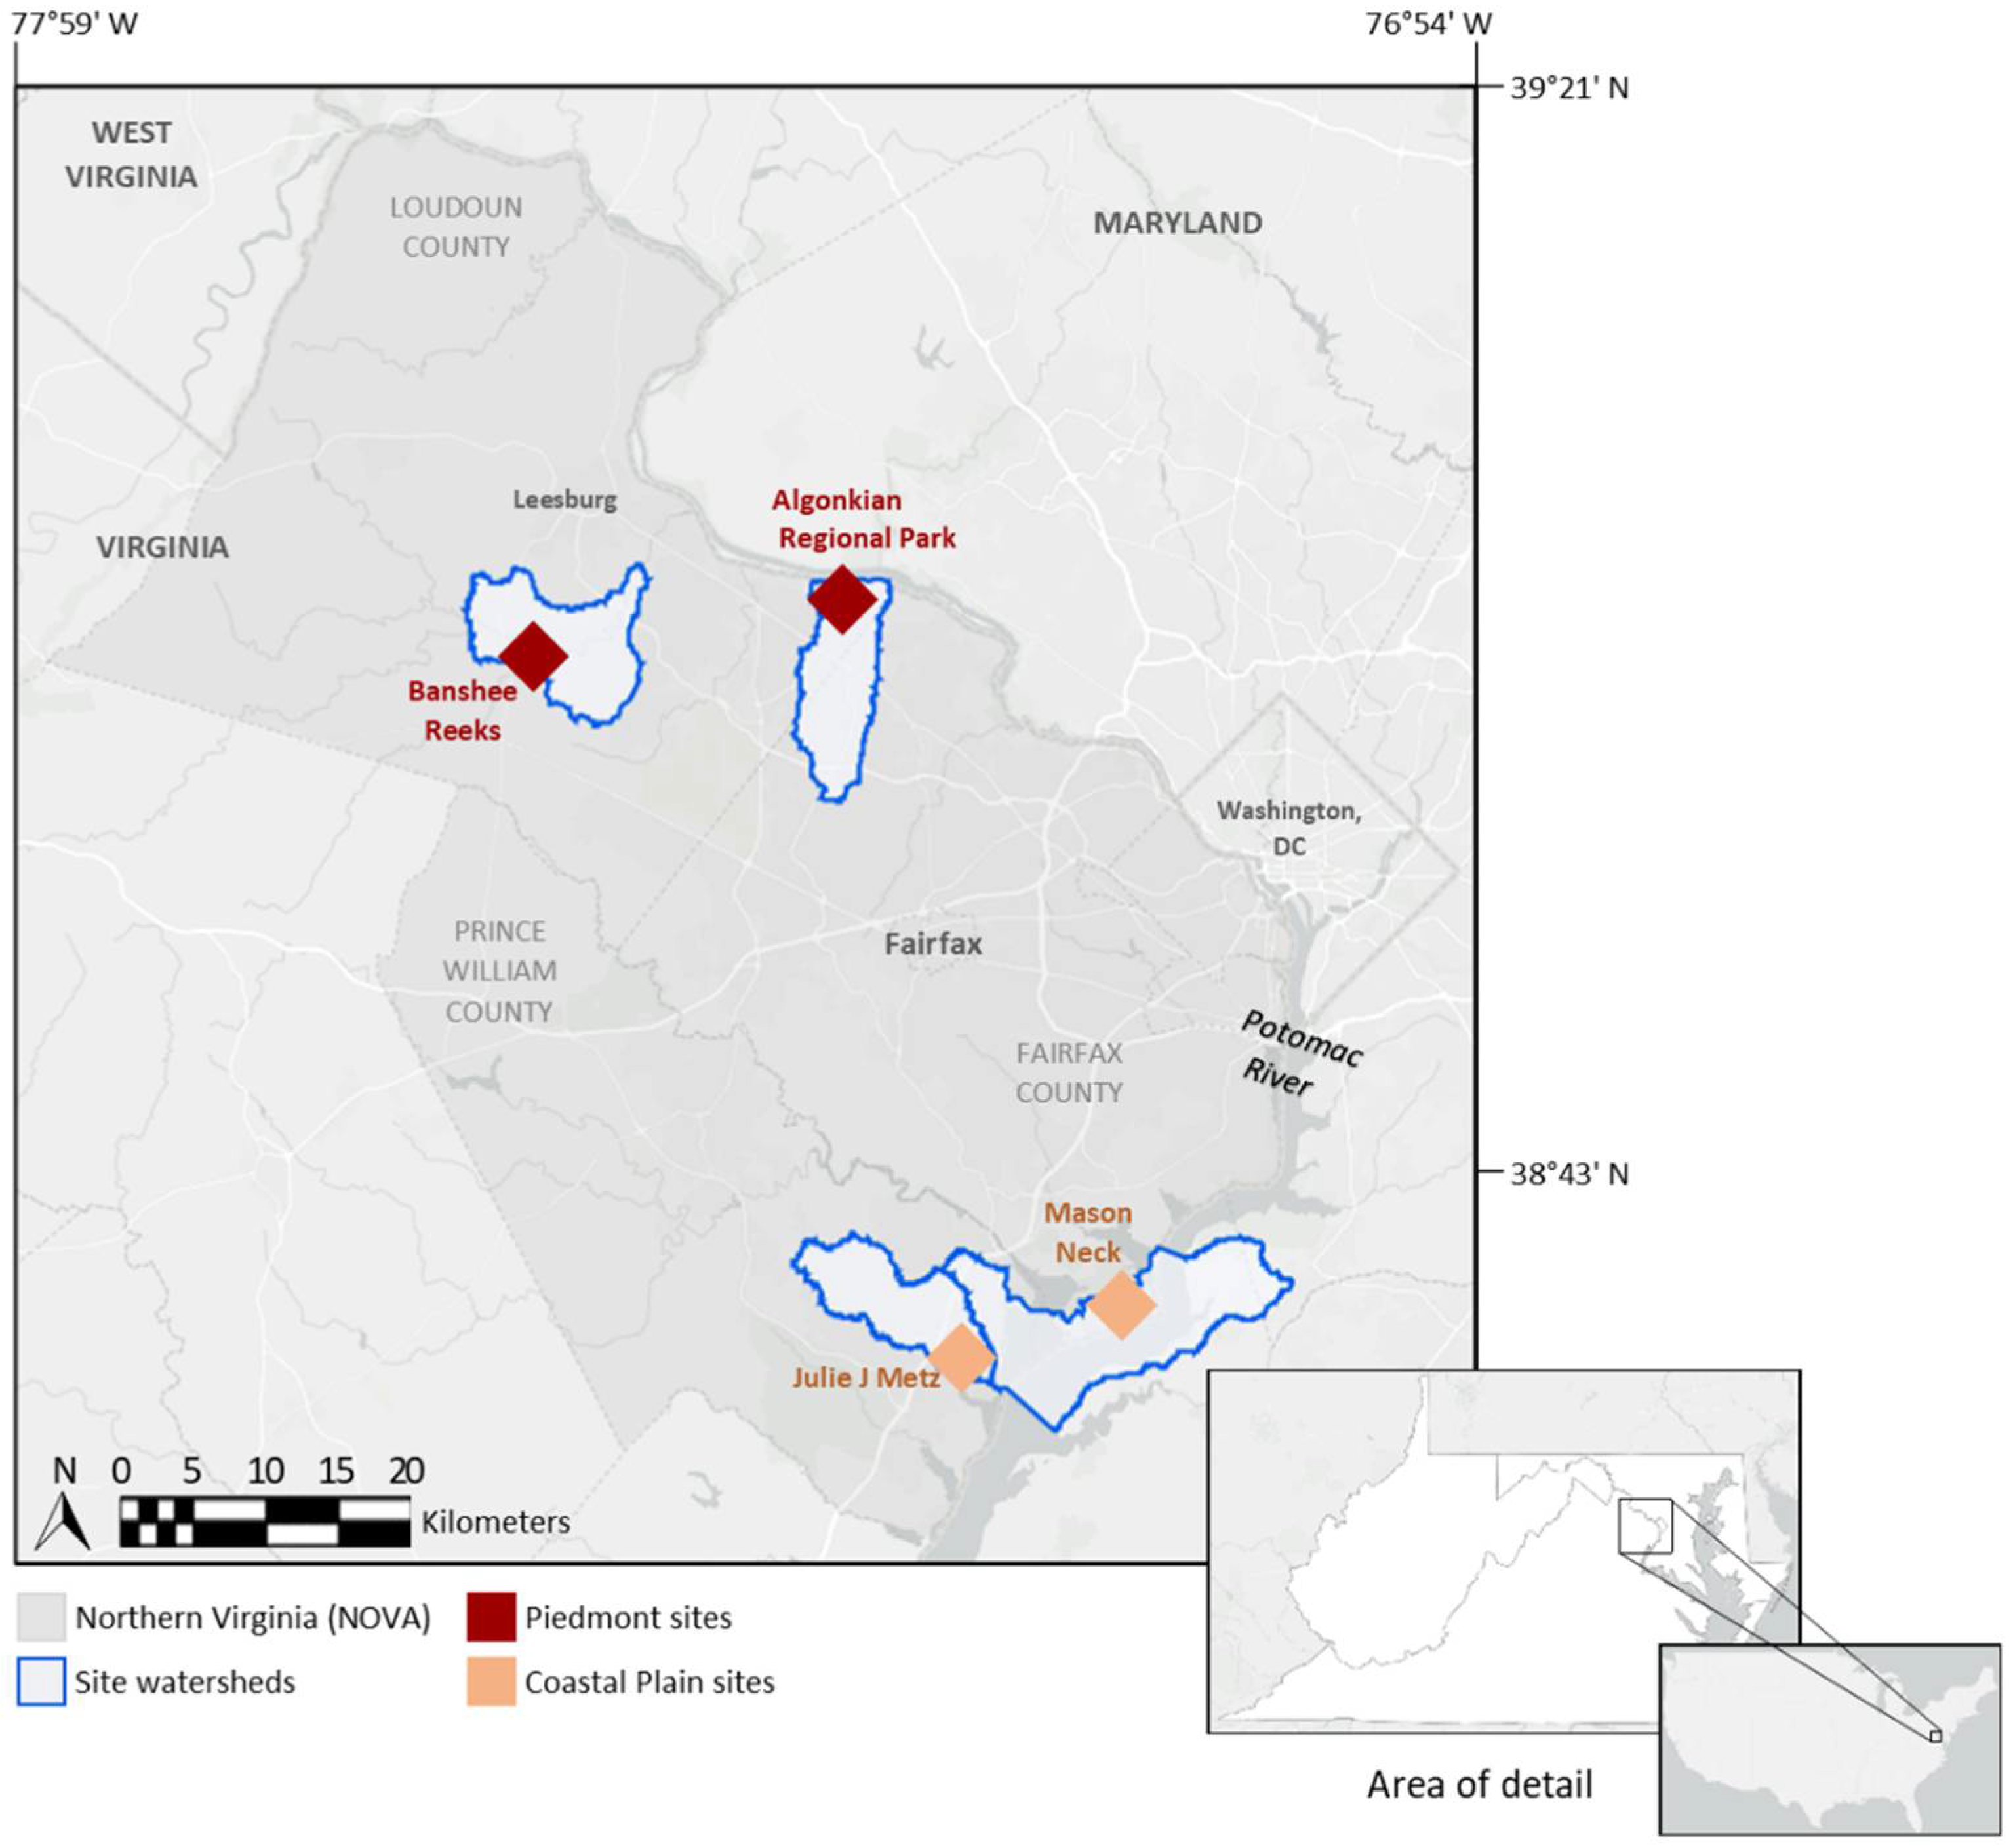
2.1. Site Descriptions

Field research was carried out between March and August 2020 at four NOVA forested wetlands, within which 5 plots were studied to investigate intra-site heterogeneity. Wetlands were balanced between the Piedmont and Coastal Plain physiographic provinces; Piedmont (P) sites include Algonkian Regional Park, Loudoun County (ARP; 39°59′9″ N, 77°37′36″ W) and Banshee Reeks Nature Preserve, Loudoun County (BR; 39°36′73″ N, 77°59′17″ W), and Coastal Plain (CP) sites include Julie J. Metz Wetlands Bank in Prince William County (JJM; 38°36′23″ N, 77°16′38″ W) and Mason Neck National Wildlife Refuge in Fairfax County (MN; 38°63′94″ N, 77°19′19″ W) (Figure 1). Table 1 describes site watersheds (including urbanization extent, higher at ARP and JJM than BR and MN), geomorphology, and dominant soils, and vegetation communities.
ARP and BR are in the Virginia Piedmont physiographic province, which consists of erosional interfluves and valleys with less sandy and more clayey soils than the Coastal Plain [29]. ARP lies adjacent to the Potomac River and contains 30 acres of freshwater forested wetlands and a freshwater emergent wetland [30]. Soils are mapped as the nonhydric Linside and Huntington silt loams and the hydric Kinkora–Delanco complex (Table 1). BR is a 695 acre preserve adjacent to Goose Creek with diverse hydrologic regimes across its hardwood forests, riparian wetlands, and Mountain-Piedmont basic seepage swamp [31,32]. Soils include the nonhydric Leedsville cobbly silt loam, Oatlands gravelly silt loam, and Manassas silt loam, as well as hydric silt loams including the Codorus, Albano, and Hatboro series [33].
JJM and MN lie in the Coastal Plain, which contains broader and flatter interfluves and valleys with thicker and sandier soils that have higher water-infiltration rates [29]. JJM sits adjacent to Neabsco Creek and contains over 200 acres of forested, scrub, and emergent wetland communities. In contrast to its other sites, JJM includes 17 acres of wetland constructed in 1996 by Wetland Studies and Solutions, Inc. (WSSI; Gainesville, VA, USA) that were modified by flattening alluvial fans and providing earthen berms as “pod” boundaries [34]. Soils are mapped as the nonhydric Dumfries sandy loam and Lunt loam in occasionally flooded areas, and Featherstone mucky silt loam and Hatboro-Codorus silt loam in frequently to permanently flooded areas. Finally, MN plots lie adjacent to a 2 km trail consisting of high points (hummocks) and occasionally ponded low points (hollows) within the hardwood forests and palustrine forested wetlands of the Mason Neck peninsula [10,35,36]. Hummocks are dominated by nonhydric soils including Gunston and Matapeake silt loams while hollows are dominated by hydric soils including Elbert and Elkton silt loams [33] (Table 1).
Per site, five 1 × 1 m randomly selected plots were chosen to represent local wetland and site heterogeneity (n = 20) using ESRI ArcGIS software (raster cells of 100 m2 size). Randomly chosen plots were modified if necessary to ensure accessibility and maintain ≥ 200 m between plots (Chi et al., 2018). Plot centers were pinpointed by flags, from which 3 subplot locations approximately 50 cm from the plot center and ~90 cm from one another (generalized per equilateral triangle geometry) were selected for each plot (total subplot n = 60).

2.2. Soil Collection and Field Methods

Soil core samples were collected down to 30 cm at each subplot between March and August 2020 using a PVC pipe with handcrafted jigsaw teeth (radius = 3.8 cm) modified from other designs [37,38] and following procedures of previous studies [9,39,40]. After removal, each core (n = 60) was trisected into three depth intervals of equal length using notches on the PVC pipe at 10 cm, 20 cm, and 30 cm. Subplots at JJM plot 2 were only sampled down to 20 cm due to the soil’s cobbly nature, yielding 177 total depth interval samples from all sites (0–10 cm: n = 60; 10–20 cm: n = 60; 20–30 cm: n = 57). Documented issues included heavy inundation at some sites, causing issues with the integrity of soil cores. Trisected core samples (length = 10 cm; n = 177) were then wrapped in aluminum and placed in a prelabeled paper bag for weighing.
Separate soil samples were collected to measure the soil pH at three subplots per plot spaced ~10 cm from Db subplots. A 2.5 cm-diameter soil probe was pushed ~30 cm into the soil then divided into three soil depth layers: 0–10 cm, 10–20 cm, and 20–30 cm (n = 177). Soil pH was measured using a Hach IQ160 meter after creating a 1:1 homogenized slurry of soils and distilled water.

2.3. Analysis of Soil Physicochemistry and Soil Carbon

Wet masses were obtained for soil cores using a Sartorius Miras 2 scale with 5 g readability. Samples were placed into drying oven at 85 °C to 105 °C for at least 72 h until a constant dry mass was achieved. The mass of aluminum foil and paper bag (15 g) was subtracted from measured wet and final dry masses. The volume of each soil core sample was calculated as the volume of the trisected soil core (453.656 cm3, or π · [3.8 cm]2 · 10 cm). GSM (%) was calculated using the formula 100 × (wet mass [g] − dry mass [g])/(dry mass [g]). Finally, Db was calculated as (dry mass [g])/453.656 cm3.
To prepare soils for elemental carbon and nitrogen analysis, dried soil core samples were ground using a mortar and pestle then passed through a 2 mm sieve at least three times to remove any non-soil debris (e.g., organic material or cobbles) and homogenize the samples. Percent TC and TN were determined by dry combustion of samples using a Perkin–Elmer 2400 Series II CHNS/O Analyzer (Perkin-Elmer Corporation, Norwalk, CT, USA). To convert percentages into a carbon storage metric comparable between sites of different bulk densities, TC stocks (kgC·m2) were calculated from TC contents (%) and Db (g·cm−3) of the upper 10 cm of soil [TC stocks = (Db · 104) · (TC/100)/1000], which is the most biogeochemically active layer of wetland soil [35,41].

2.4. Data Analysis

Statistical analyses were performed on Db, GSM, TC, TN, and TC stocks using version 15 of JMP® [42]. Soils were assessed by subplot samples (0–30 cm; n = 60) and by depth interval (n = 177). Additionally, to separate the most biogeochemically active layer of soil—the top 10 cm—from remaining collected soil samples, 10–20 cm and 20–30 cm samples were pooled to provide a comparison between topsoil (0–10 cm) and 10–30 cm samples.
Data were screened for normality and linearity through visual assessments and residual plots. One-way analysis of variance (ANOVA) was performed for all soil physicochemical properties measured among the wetland sites (α = 0.05 significance level). A two-way ANOVA was also performed using the depth and physiographic province as factors. Fisher’s least significant difference (LSD) post hoc test was conducted to determine the main effects of the two environmental factors. The degree of urbanization (high vs. low; Table 1) was not used as a factor in analysis due to diverse land use, planning, and management histories that obscure the impact of urbanization. Pearson correlation analysis was performed among all the soil physicochemical properties, including soil carbon and nitrogen contents and stocks. Finally, bivariate linear regression analyses were conducted between each physicochemical property and TC and TC stocks using pooled data from all sites, and regression statistics were obtained to evaluate the goodness of fit for each resulting equation.

3. Results and Discussion

3.1. Soil Physicochemistry across Sites

ANOVA revealed significant differences in all soil physicochemical properties as well as carbon content and nitrogen content between sites when separated into 10 cm intervals, and differences in all but Db when considering the top 30 cm overall (p < 0.05; Table 2). An examination of the standard errors (Table 2) highlights heterogeneity of the plot and site soil properties that may be more dependent on smaller-scale variability in microtopography, vegetation, and hydrology [35]. Nonetheless, significant between-site differences indicate that the physicochemistry can aid in distinguishing wetland sites, which may be attributable to broader watershed and/or landscape factors such as physiographic province. JJM had the highest GSM out of all the sites (58.03 ± 5.01%), corroborating high levels of inundation observed during collection at JJM for plots 3, 4, and 5. In contrast, GSM was lowest at BR (33.67 ± 2.06%; p < 0.05), where several plots did not show signs of seasonal saturation despite being mapped as hydric by Loudoun County. Soil pH was significantly more acidic at MN (4.67 ± 0.03) than other sites, despite measuring ~0.5 pH units higher than that of previous research at the same sampling locations [35] (p < 0.01). While the overall (0–30 cm) soil Db did not significantly differ between sites, Db was consistently highest for the top 10 cm soil (1.01 ± 0.04 g·cm−3) than other depth layers at all sites except JJM (p < 0.01). Homogeneity in soil physicochemistry within JJM suggests that the site’s hydrologic conditions—engineered and managed to have a biogeochemically active top 30 cm [34]—are the most stable of all sites down to 30 cm (Table 2).
This study’s measurements of wetland soil physicochemistry are comparable to some, but not all, previous studies of freshwater wetlands between 1990 and 2020, several of which were within the Mid-Atlantic Piedmont and Coastal Plain. High variability in wetland soil pH has been reported for freshwater marshes, swamps, and riparian systems; the riparian system range (4.2 [13] to 6.73 [43]) encompasses our measurements (Table 3). While several wetlands of Table 3 report bulk densities below 1.0 g·cm−3, previous Coastal Plain (Craft and Chiang: 1.28 g·cm−3 [44]; Axt and Walbridge: 1.05 g·cm−3 [13]) and Piedmont measurements (Axt and Walbridge: 1.26 g·cm−3 [13]; Peralta et al.: 1.25 g·cm−3 [45]) were comparable to our measured values of 1.15 ± 0.08 g·cm−3 and 1.25 ± 0.05 g·cm−3) in the Coastal Plain and 1.27 ± 0.03 g·cm−3 and 1.37 ± 0.06 g·cm−3 in the Piedmont (Table 2). Differences may be attributable to nonidentical site and plot selection, where soil physicochemical heterogeneity between spatial scales—evidenced by Table 2 between-site differences and within-site differences (i.e., standard errors)—is likely an artifact of habitat and microhabitat variability (e.g., below versus outside of tree canopies) [46].
Comparing our results to studies investigating the same sites elucidates changes in soil properties that may be attributed to seasonal and hydrologic variability in sampling conditions along with nonidentical plot choices leading to variability. In contrast to Ahn et al.’s [35] measurements of soil physicochemistry at MN in 2006, current measurements indicate that MN has developed higher—but still acidic—soil pH (4.09 (historical); 4.57 (current)), along with higher Db (0.45 g·cm−3 (historical); 1.25 g·cm−3 (current)). While more circumneutral pH values in 2020 may relate to higher precipitation totals within a month of sampling in 2020 compared to 2006 [47], vast differences in Db were obtained because of differences in the sampling depth [35], with the current study relying on soils to a deeper depth, i.e., higher density. Finally, Peralta et al. [45] identified higher pH and GSM values at BR in 2010 and 2011 than observed in our study; this discrepancy may simply be a result of seasonal differences in sampling, as their soil collection occurred between October and June [45] versus the current study’s June to August collection.

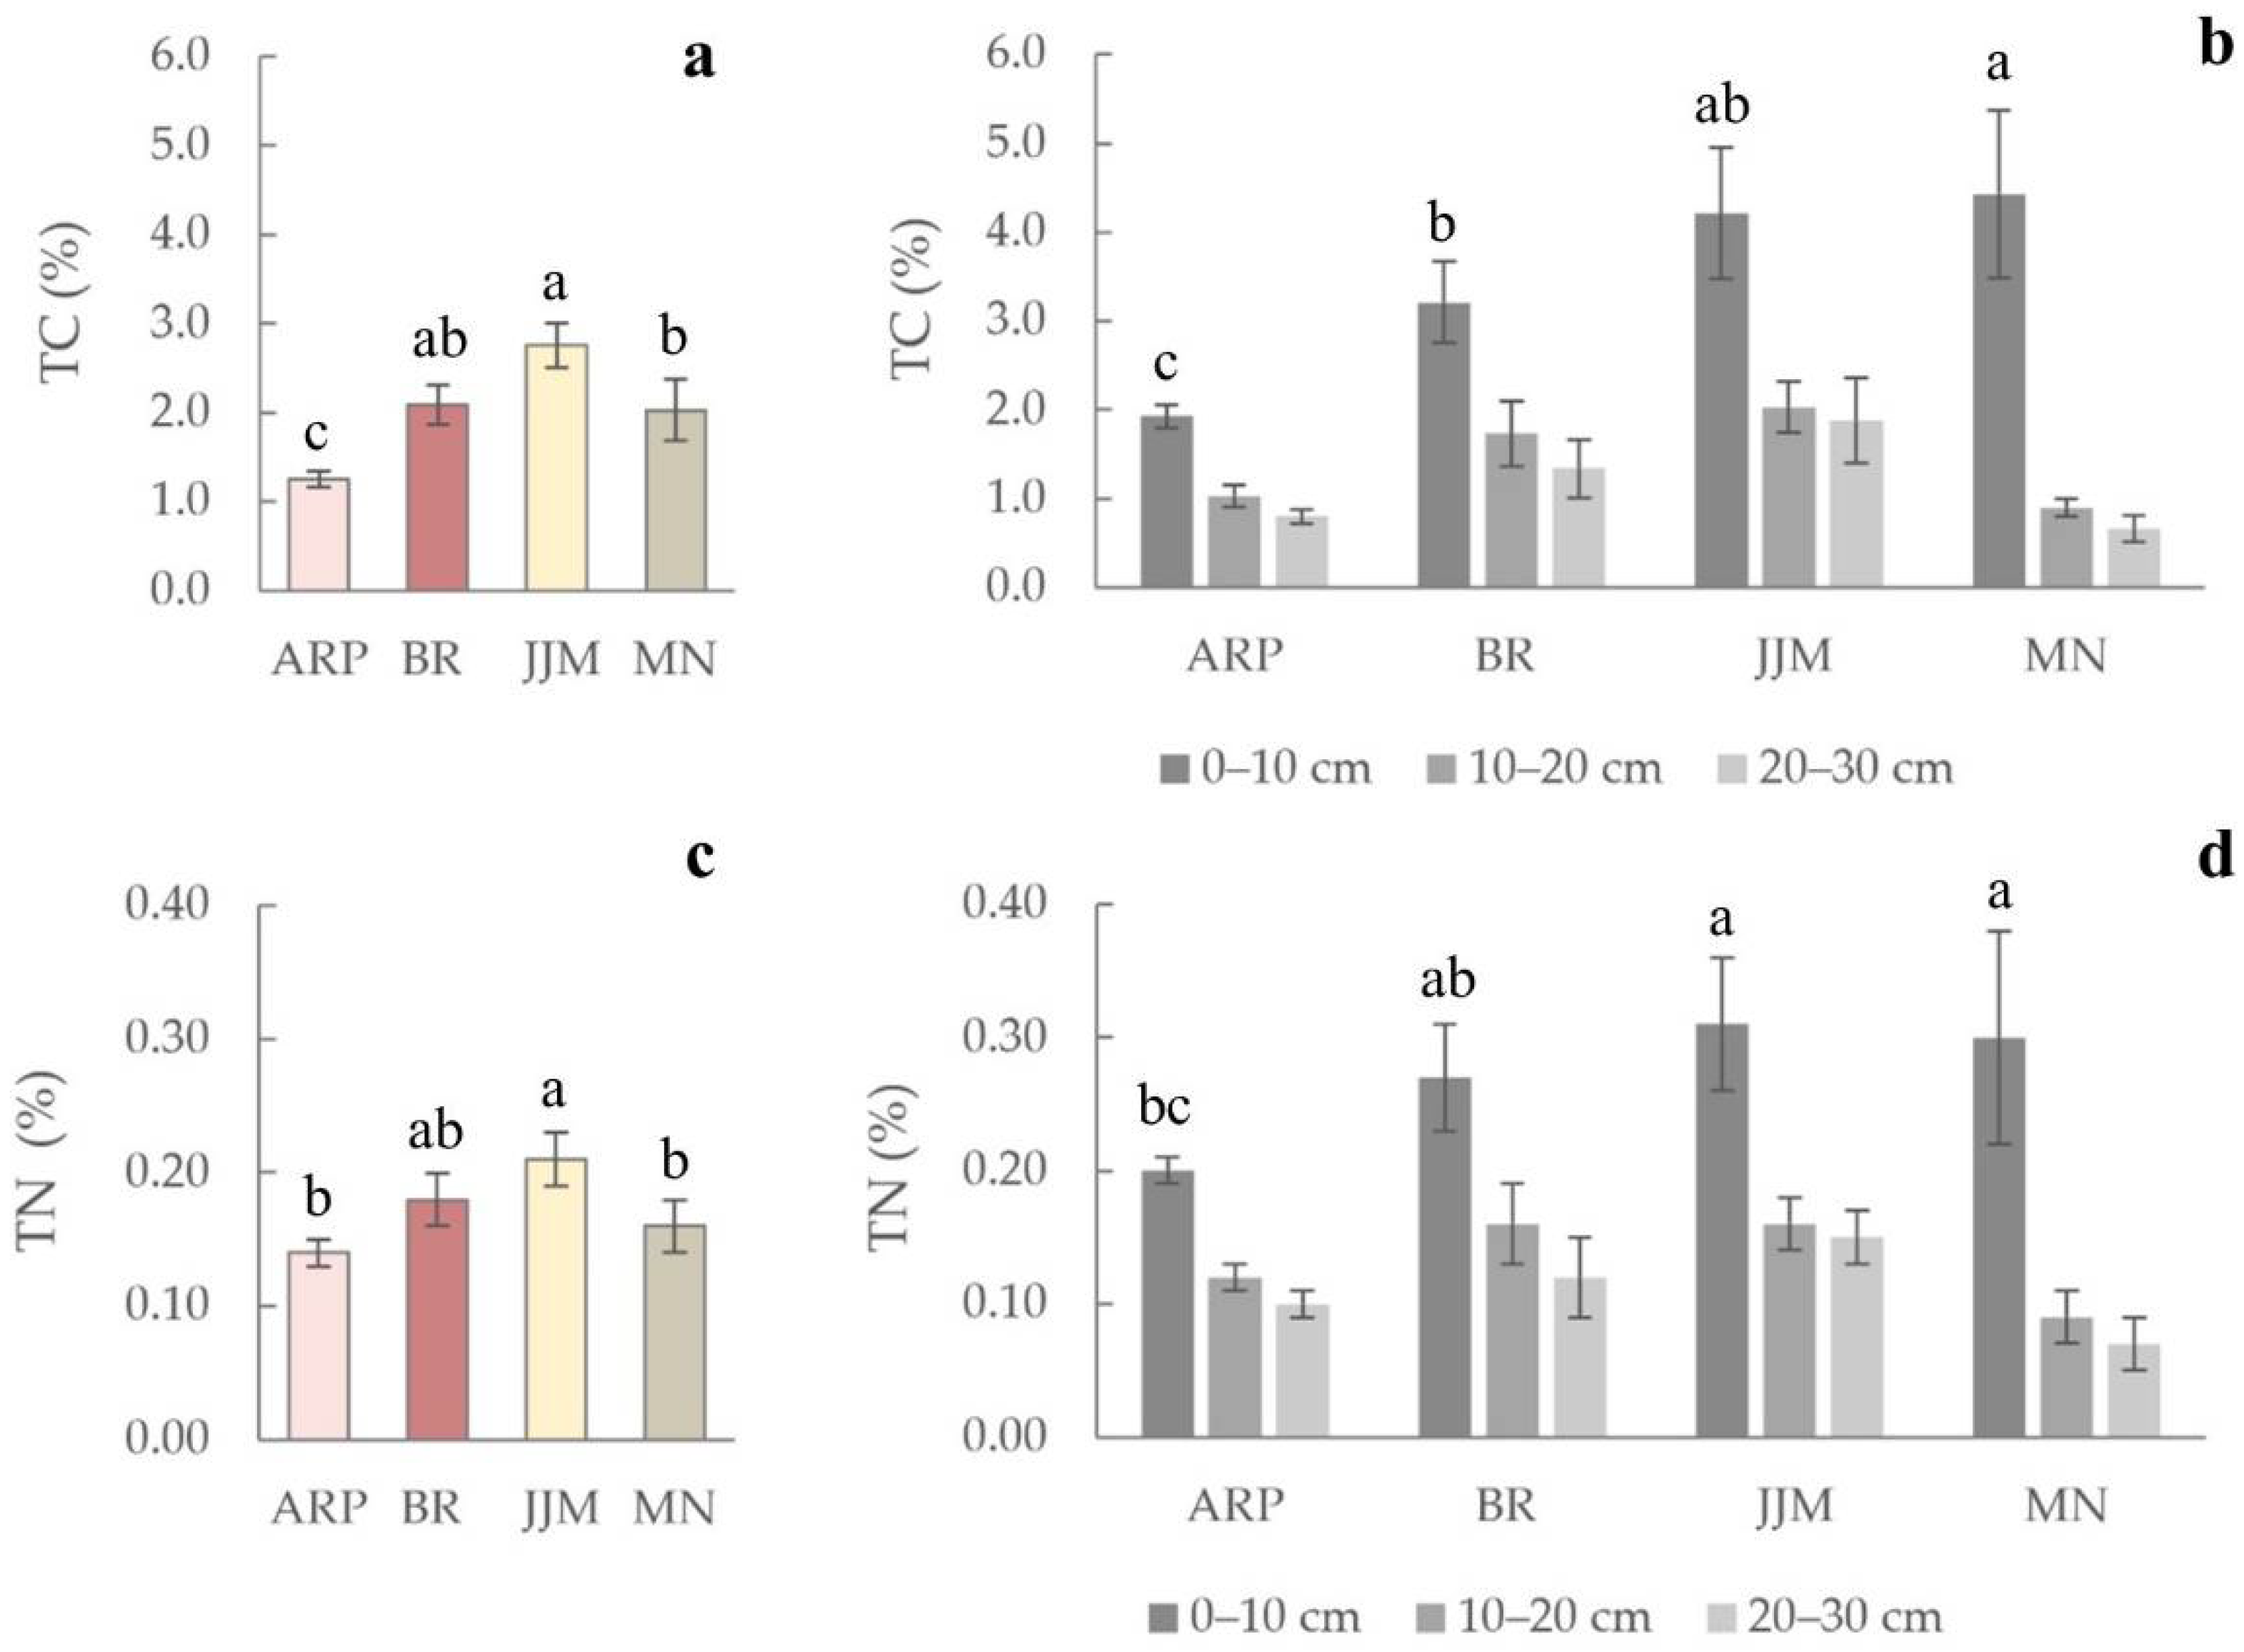
3.2. Soil Carbon and Nitrogen

Carbon and nitrogen contents followed similar trends across sites and depths (Figure 2a–d). Corroborating the highly generalizable relationship between the soil carbon and depth, the majority of our study site’s soil carbon and nitrogen was measured in the top 10 cm (p < 0.05); specifically, 54.6% of TC and 50.1% of TC stocks from 0 to 30 cm were derived from the top 10 cm. On average, topsoils (0–10 cm) contained 3.45% TC (1.93 ± 0.13% (ARP) to 4.43 ± 0.94 (MN)) and 0.27% TN (0.20 ± 0.01 (ARP) to 0.31 ± 0.05 (JJM)) across all sites (Figure 2b,d), in comparison to an average of 2.03% TC and 0.17% TN in the top 30 cm. The soil carbon values mirror those of previous studies (Table 3). Slightly higher soil carbon and nitrogen contents were reported at BR by Peralta et al. [45] in 2013—2.5 ± 0.41% versus our study’s 2.09 ± 0.22% (Table 2)—likely explained by differences in core depths (where Peralta et al. [45] sampled down to a depth of 5–10 cm). Aligned with previous investigations, all studied soils were determined to be mineral soils: TC ranged from 0.24% to 11.07%, and no plots approached the organic soil TC range of 12% to 20% [1].
The TC contents at all sites except ARP were exclusively above 2.0% (Figure 2a), supporting the observation that such soils host wetland storage potentials comparable to riparian mineral wetlands of the area (Table 3). While upland soils may still be rich in carbon and surpass TC contents of 2.0% [63], a comparison of plots with hydrology more congruent to that of wetlands—e.g., the hollows at MN, a semi-permanently flooded floodplain section of JJM, and a flooded depression at the bottom of a hill at BR where %C contents ≥ 5%—and plots with less frequent flooding/ponding—e.g., the hummocks at MN, a drier portion of the floodplain at ARP, and a low-moisture plot next to a creek at BR where TC contents < 5%—indicates that plot hydrological characteristics are key to sustaining site heterogeneity in carbon storage (Table 2). As the plot vegetation and microbial biomass likely contributed significantly to the variation in soil carbon contents and stocks, future research may consider incorporating vegetation biomass as a factor in evaluating soil carbon differences.
TC was significantly different between and within sites (p < 0.05), indicating high spatial heterogeneity despite general similarities in ecosystem functions. Both TC and TN contents were highest at JJM (2.76 ± 0.25%; 0.21 ± 0.02%; Figure 2a,c; p < 0.05), which could be due to the consistent presence of a hydrologic regime more conducive to wetland ecosystem functions such as seasonally anoxic conditions responsible for reducing organic matter decomposition rates. Furthermore, polluted run-off downstream of a watershed such as Neabsco Creek with impervious surfaces surpassing 25% (Table 1), in combination with prolonged oxidizing conditions during certain periods of the year, may lead to nitrogen mineralization and nitrification that sustains soil nitrogen stores without proportional removal via denitrification [64]. Conversely, ARP soils hosted the lowest TC and TN contents of the sites (1.25 ± 0.09%; 0.14 ± 0.01%; Figure 2a,c; p < 0.05) despite similar watershed impervious surface cover (ISC; Table 1), which may be explained through land management: ARP was cleared farmland as opposed to forest as late as 1957 [65]. Additionally, plots experience occasional as opposed to frequent flooding [66]. These results indicate that watershed carbon storage can be maximized by deliberately planning, designing, and managing urban areas to act as hydrologic sinks and develop wetland functions, be it with constructed wetlands such as JJM [34], restored wetlands, or sustained site management.
ARP had significantly lower TC stocks than all other sites (2.12 ± 0.24 kg·m−2; p < 0.05), while TC stocks at BR (3.49 ± 0.61 kg·m−2), JJM (3.50 ± 0.55 kg·m−2), and MN (3.67 ± 0.45 kg·m−2) did not significantly differ from one another (Table 2; p < 0.05). The plot hydrology and geomorphology at ARP were relatively homogenous, which may explain less variability in the site’s TC stocks. The heterogeneity at BR, JJM, and MN may be explained by microtopographic controls on hydrology and vegetation, as well as distinct geomorphological dynamics; for example, depressions such as hollows at MN are prone to receive hydrologic inputs from rainfall and runoff, and will retain inundation from periodic river flooding, unlike higher hummock areas [35].

3.3. Soil Carbon Storage and Physicochemistry as Affected by Soil Depth and Physiographic Province

Understanding the urban wetland physicochemistry and carbon storage potential in the context of NOVA’s Piedmont and Coastal Plain has implications for evaluating and managing their ecosystem services through land and waterscape planning, development, and management [67,68]. The two-way ANOVA (Table 4) builds upon previously established trends and relationships to tease apart the effects of, and interactions between, the soil depth and physiographic province. Disparate soil carbon contents and physicochemical attributes were apparent by site that were not necessarily explained by physiographic setting or depth (Table 2). Our wetlands may have shown similarities in TC stocks due to variability in sedimentation accumulation, hydrologic regime, geomorphology, or vegetation community at the plot or site level [69,70]. Nonetheless, Table 4 indicates that both physiography and depth could explain certain wetland soil characteristics.
Independent of physiography, the top 10 cm had significantly higher TC and TN compared to the deeper depth layers (Figure 2b,d), attributed to a moderate negative linear correlation between Db and TC (r = −0.62; R2 = 0.38; Figure 3b), and Db and TN (r = −0.61; R2 = 0.37; p < 0.01 for both). These results corroborate the established inverse relationship between the carbon content and depth from the surface [71], which has been explained through the reductions in SOC due to lessened inputs of carbon from organic additions and translocations when soils have greater compaction [1,21,72,73,74,75,76,77].
The Piedmont and Coastal Plain sites showed differences in physicochemical properties: Coastal Plain soils had significantly lower Db (1.21 ± 0.04 g·cm−3 (CP) versus 1.40 ± 0.04 g·cm−3 (P)) and higher GSM (48.79 ± 3.14% (CP); 38.51 ± 1.43% (P)) than Piedmont soils (p < 0.01 for both). While the Piedmont soils hosted higher clay percentages that can influence the stabilization of organic carbon within the soil and result in greater TC in soils with more clay [78], the Piedmont sites hosted greater variability in soil carbon than Coastal Plain sites (p < 0.05; Table 2); however, between 0 and 10 cm, the Coastal Plain soils at JJM and MN had significantly higher TC (4.32 ± 0.41%) than the Piedmont soils at ARP and BR (2.57 ± 0.22%) (p < 0.01; Table 2). This result is statistically limited in its comparison of two sites per physiographic province but persists despite studying both relatively remote (watershed %ISC < 5%) and highly impacted (watershed %ISC ≥ 25%) urban wetlands in both physiographic provinces. Further study is necessary to determine if this result may be attributable to biological factors such as vegetation cover, microbial community density, and biomass, in addition to contrasting hydrology, geomorphology, and land management. In contrast, there was no significant difference in TC stocks between physiographic provinces (p > 0.05), which may simply be explained by bulk density’s correlation to TC but not TC stocks (see Section 3.4; Figure 3b,d). Further research with more study sites may be warranted to better understand the interplay between soil carbon, bulk density, and physiographic province.
Landscape position and changes are known to impact carbon and nitrogen cycling and stocks of wetlands [44,79], with disturbances such as urbanization causing immediate function disruptions; therefore, alterations to the soil physicochemistry and carbon storage not only act as indicators of present urbanization but also time since urbanization began [80]. Our study results cannot ascertain the footprint urbanization has had on soil physicochemical properties and carbon stocks but highlights the potential for urban Coastal Plain wetlands to sustain larger soil carbon pools than those in the Piedmont (Table 2), despite the CP sites having similar watershed urbanization to the P sites (where JJM~ARP and MN~BR). Studies including more study sites are warranted to identify the inherent properties of Coastal Plain versus Piedmont wetland soils after considering the role of factors such as status as constructed versus natural wetland, hydrologic regime, and—since the Coastal Plain transitioned to suburban and urban development decades before the Piedmont in NOVA [18]—years since surrounding urban and/or agricultural development. Nonetheless, regional carbon sequestration strategies focused on green spaces may be more successful if restoration and conservation focuses on Coastal Plain rather than Piedmont sites.

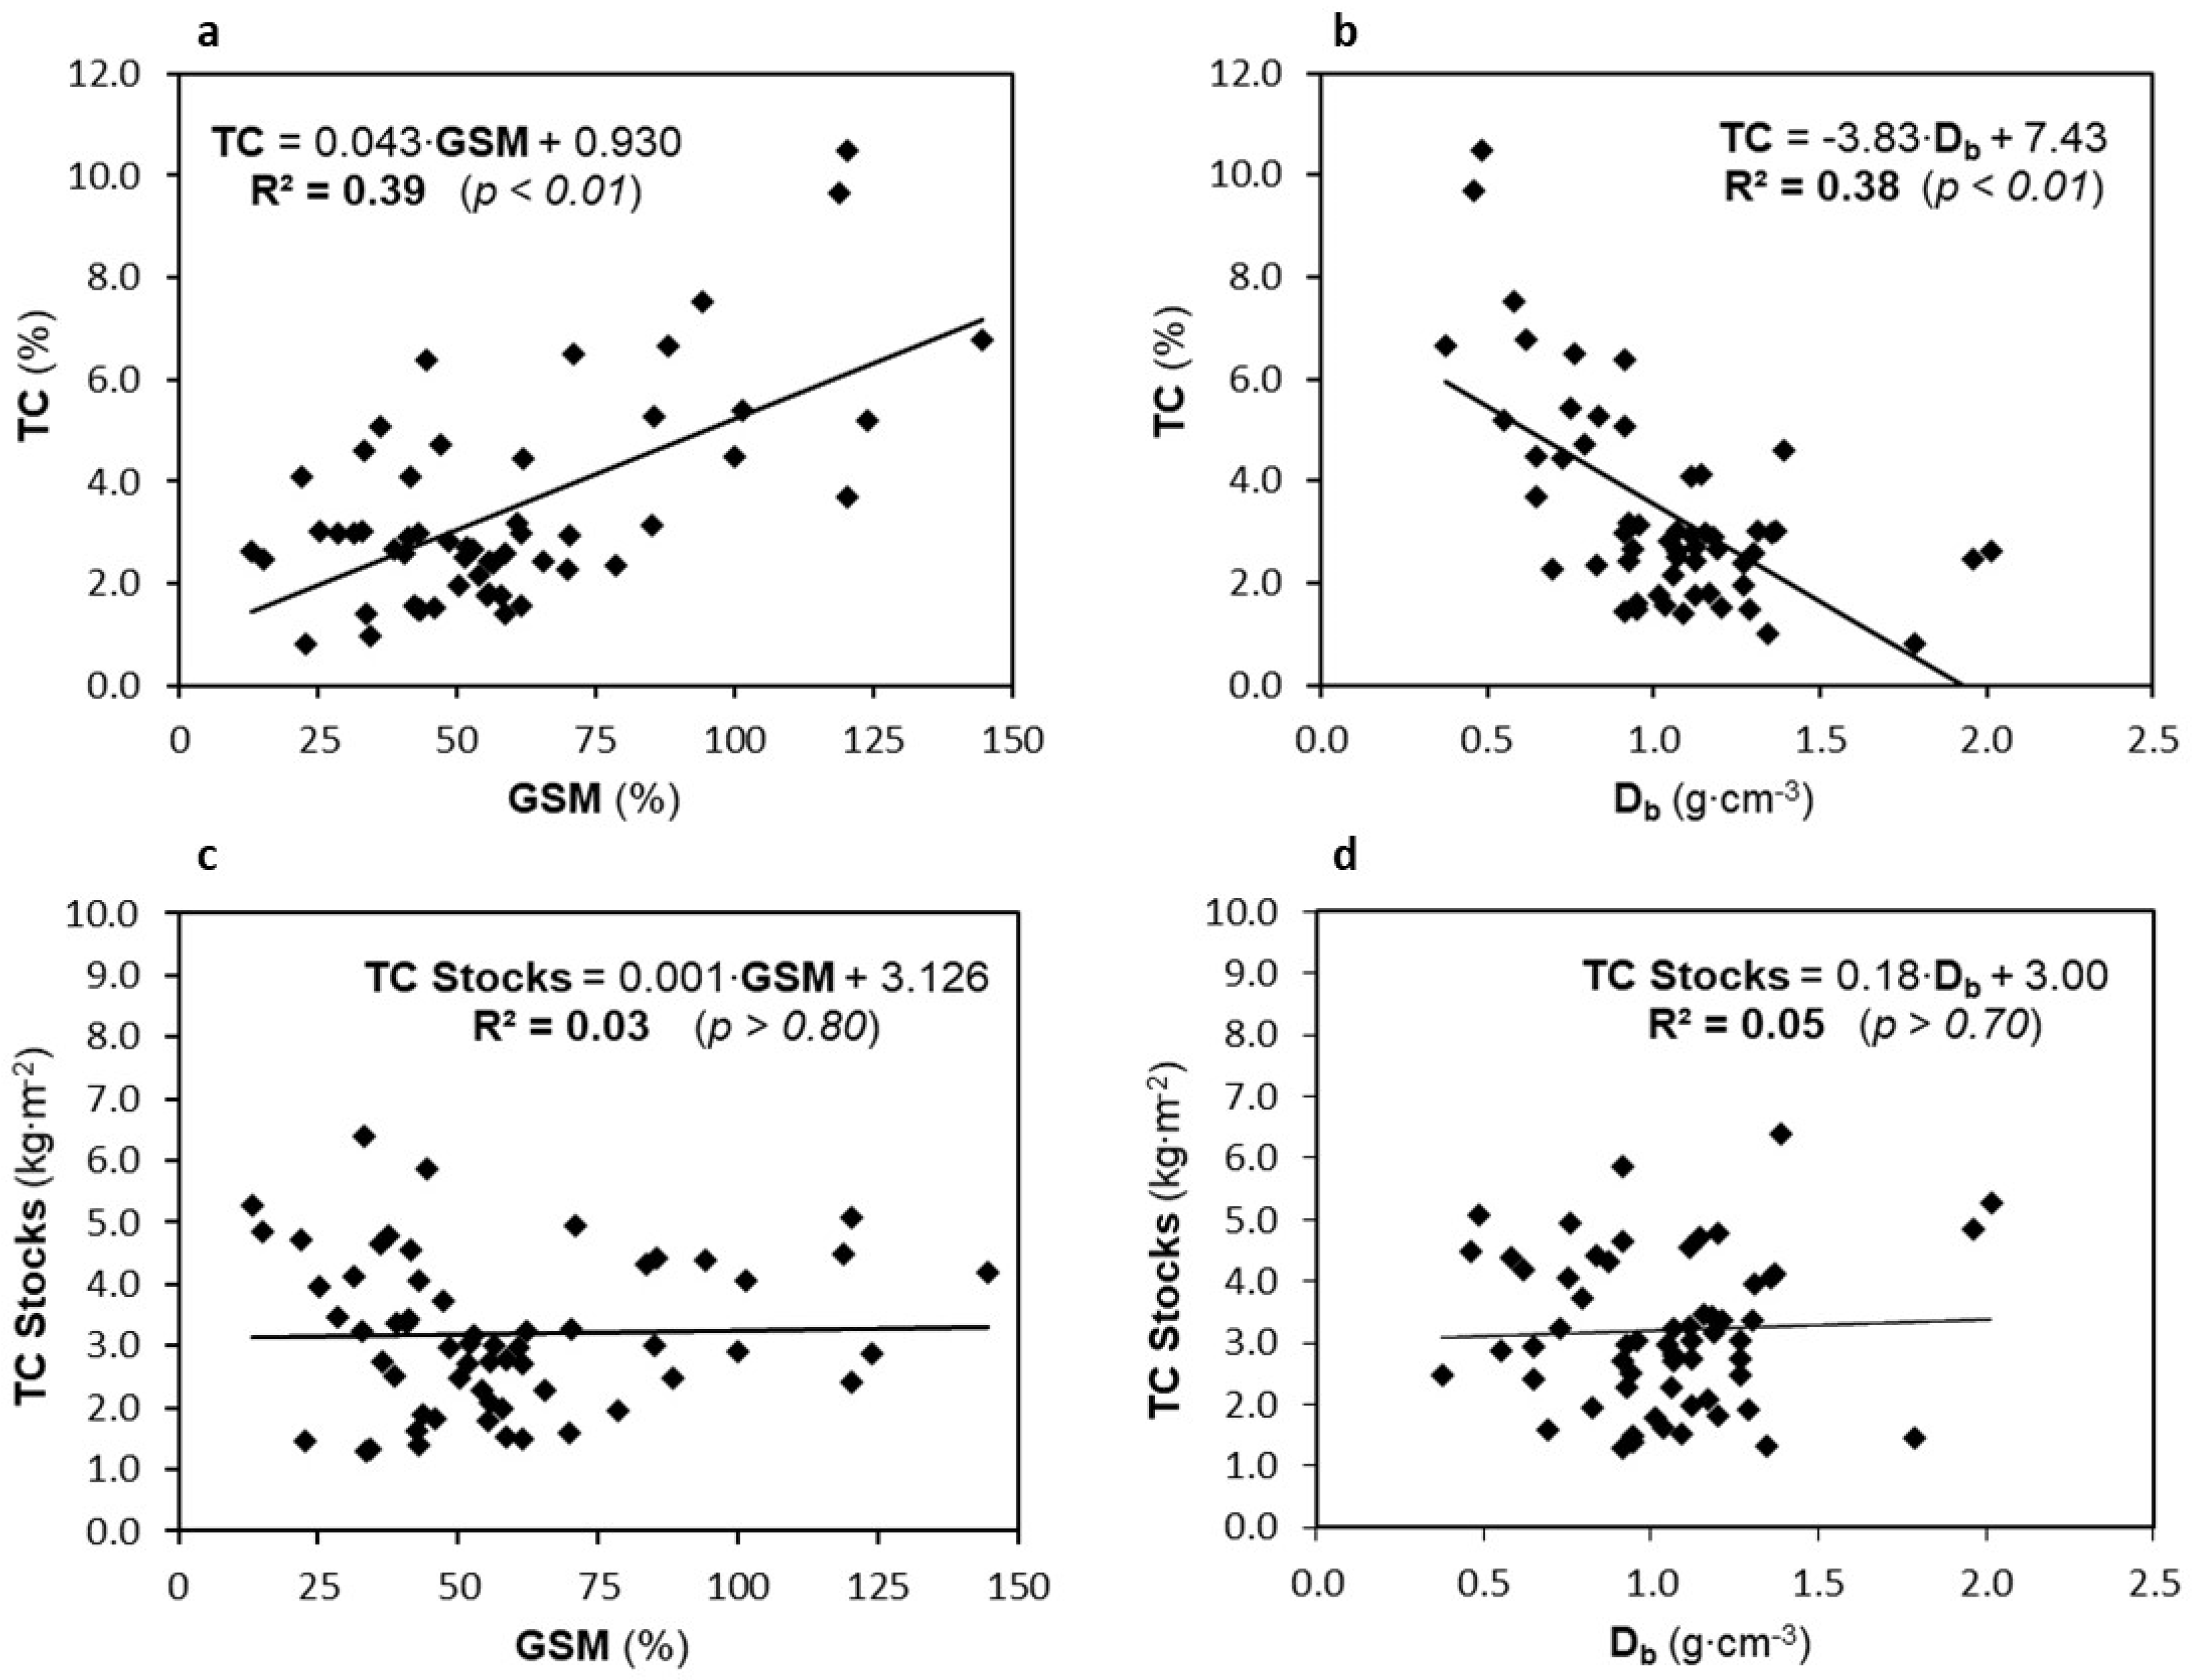
3.4. Correlations and Regressions between Soil Physicochemistry and Soil Carbon

Additional considerations of soil physicochemical properties may pointedly aid urban planners and designers focusing on soil carbon by providing strong and easily accessible indicators of soil carbon storage potential. Our regression analyses indicated that variability in the soil carbon content—but not stocks—is modestly explained by GSM and Db, such that the use of such soil physicochemical properties in a model enhanced by further investigation can provide support in capturing plot-level characteristics related to carbon storage potential than can generalize landscape characteristics [21].
While GSM and Db regressions were significant when assessing samples from all sites, a significant relationship was apparent between soil pH and soil carbon and nitrogen only for ARP (TC: r = −0.35) and JJM (TC: r = −0.55; TN: r = −0.55; p < 0.05 for all), but not BR or MN. Mature wetlands are more capable of buffering soil pH rending pHs that tend toward circumneutral values [1] such that this disparity may indicate relatively younger ecosystems at ARP and JJM. As the pH may provide more valuable information when contextualized by wetland maturity, it may not be a suitable indicator of soil carbon storage potential when compared to other physicochemical properties.
In contrast, GSM—a soil property that that may vary depending on rainfall or season but which is inevitably linked to soil water retention—was observed to be correlated with TC (r = 0.62; p < 0.01) [81], providing evidence for the theoretical link between hydrologic regime and carbon storage. Linear regression indicated that 39% of TC variability could be estimated by GSM using the equation TC = 0.043 · GSM + 0.930 (R2 = 0.39; p < 0.01; Figure 3a), with increases in the soil moisture relating to increases in the carbon content. Nonetheless, the relationship between GSM and TC stocks was insignificant, with less than 5% of TC stock variability attributable to GSM (p > 0.05; Figure 3c). TC is known to correlate with GSM for soils with high TC and GSM that can exceed 300% [82]. GSM for the sites of this study did not exceed 150%; an inclusion of soils with a greater range in both TC and GSM may have resulted in a stronger positive relationship between GSM and TC and/or TC stocks. The explanatory power of GSM is modest but indicates that, in conjunction with Db measurements, GSM can provide insight into wetland carbon contents but not stocks.
Similar to GSM, Db shared a moderately strong negative correlation with both TC and TN (r = −0.62; r = −0.61; p < 0.05 for both). The regression model for TC from Db resulted in a negative slope (−3.83; p < 0.05) and a modest regression coefficient (R2 = 0.38; p < 0.05; Figure 3b), suggesting that small increases in bulk density can have significant but variable impacts on the soil carbon content. The incorporation of Db into the metric of carbon storage potential via TC stocks rendered a regression model that was much weaker, with Db unable to provide any explanatory power for TC stocks (R2 = 0.05; p > 0.05; Figure 3d). The inverse relationship between Db and both carbon and nitrogen contents was expected: Db is known to relate positively to the processes of carbon and nitrogen mineralization such that increasing Db would be related to a decrease in soil TC and TN [73]; additionally, Db decreases with increasing organic content [20,52,82,83]. While the total rather than organic carbon was measured in this study, our data can be suggested to support this relationship given the lack of soil inorganic carbon contents of the Mid-Atlantic Piedmont and Coastal Plain evidenced in previous studies [84,85]—in other words, the results are generalizable to the soil organic carbon (SOC) contents and stocks.
The importance of Db in modeling TC but not TC stocks is reasonably deduced through the mathematical derivation of TC stocks, in which a concentration of soil carbon—TC—is multiplied by bulk density (Section 2.3). It is reasonable that high variability in soil properties such as texture, porosity, and structure (e.g., micro- versus macro-aggregates) can influence the carbon storage independent of the bulk density [86]; as carbon stocks rather than carbon contents are often the topic of carbon dynamics and conservation strategies, further investigation of the relationship between TC stocks and bulk density that considers these additional physicochemical attributes is necessary.

4. Conclusions

Our results indicate that forested wetlands existing within urbanized landscapes—whether more remote or highly impacted with surrounding impervious surfaces—can sustain important ecosystem functions by hosting carbon contents and stocks significant to regional carbon pools, regardless of variability in geomorphologic, physiographic, and soil physicochemical environments. However, the Coastal Plain as opposed to Piedmont wetlands in NOVA may be better targets for planners interested in relying on green spaces for carbon sequestration strategies. Our results also corroborate that forested wetland topsoils (0–10 cm) are the most capable of storing carbon, but consequential stores of carbon are nonetheless present down to 30 cm. Continuous monitoring of soil physicochemical and carbon properties at various sites across an urbanized landscape provides an opportunity to better forecast soil carbon sequestration in urban forested wetlands and is a necessary step for adequate planning of conservation and restoration strategies. Our study further promotes the continued monitoring of both soil physicochemical and carbon and nitrogen properties in areas where urbanization may threaten wetland functions such that localities can better track and understand carbon dynamics.

Author Contributions

Conceptualization, C.A.; methodology, C.A. and S.A.S.; software, K.L. and S.A.S.; validation, K.L.; formal analysis, K.L. and S.A.S.; investigation, K.L. and S.A.S.; resources, C.A., K.L. and S.A.S.; data curation, K.L. and S.A.S.; writing—original draft preparation, K.L.; writing—review and editing, C.A., K.L. and S.A.S.; visualization, C.A., K.L. and S.A.S.; supervision, C.A.; project administration, C.A.; funding acquisition, C.A. All authors have read and agreed to the published version of the manuscript.

Funding

This research received no external funding.

Institutional Review Board Statement

Not applicable.

Informed Consent Statement

Not applicable.

Data Availability Statement

The data that support the findings of this study are available from the corresponding author, C.A., upon reasonable request.

Acknowledgments

The authors thank Katrina Napora for her assistance in the lab with processing soil samples for carbon analysis.

Conflicts of Interest

The authors declare no conflict of interest.

References

  1. Mitsch, W.J.; Gosselink, J.G. Wetlands, 5th ed.; John Wiley & Sons, Incorporated: Somerset, NJ, USA, 2015; ISBN 978-1-119-01979-4. [Google Scholar]
  2. Nahlik, A.M.; Fennessy, M.S. Carbon Storage in US Wetlands. Nat. Commun. 2016, 7, 13835. [Google Scholar] [CrossRef] [PubMed] [Green Version]
  3. Kolka, R.; Trettin, C.; Tang, W.; Krauss, K.; Bansal, S.; Drexler, J.; Wickland, K.; Chimner, R.; Hogan, D.; Pindilli, E.J.; et al. Chapter 13: Terrestrial Wetlands. In Second State of the Carbon Cycle Report (SOCCR2): A Sustained Assessment Report; U.S. Global Change Research Program: Washington, DC, USA, 2018; pp. 507–567. [Google Scholar]
  4. Villa, J.A.; Bernal, B. Carbon Sequestration in Wetlands, from Science to Practice: An Overview of the Biogeochemical Process, Measurement Methods, and Policy Framework. Ecol. Eng. 2018, 114, 115–128. [Google Scholar] [CrossRef]
  5. Canedoli, C.; Ferrè, C.; El Khair, D.A.; Padoa-Schioppa, E.; Comolli, R. Soil Organic Carbon Stock in Different Urban Land Uses: High Stock Evidence in Urban Parks. Urban Ecosyst. 2020, 23, 159–171. [Google Scholar] [CrossRef]
  6. Lal, R. Soil Carbon Sequestration Impacts on Global Climate Change and Food Security. Science 2004, 304, 1623–1627. [Google Scholar] [CrossRef] [PubMed] [Green Version]
  7. Bispo, A.; Andersen, L.; Angers, D.A.; Bernoux, M.; Brossard, M.; Cécillon, L.; Comans, R.N.J.; Harmsen, J.; Jonassen, K.; Lamé, F.; et al. Accounting for Carbon Stocks in Soils and Measuring GHGs Emission Fluxes from Soils: Do We Have the Necessary Standards? Front. Environ. Sci. 2017, 5, 41. [Google Scholar] [CrossRef] [Green Version]
  8. Ahn, C.; Schmidt, S. Designing Wetlands as an Essential Infrastructural Element for Urban Development in the Era of Climate Change. Sustainability 2019, 11, 1920. [Google Scholar] [CrossRef] [Green Version]
  9. Ehrenfeld, J.G.; Cutway, H.B.; Hamilton, R.; Stander, E. Hydrologic Description of Forested Wetlands in Northeastern New Jersey, USA—An Urban/Suburban Region. Wetlands 2003, 23, 685–700. [Google Scholar] [CrossRef]
  10. Moser, K.; Ahn, C.; Noe, G. Characterization of Microtopography and Its Influence on Vegetation Patterns in Created Wetlands. Wetlands 2007, 27, 1081–1097. [Google Scholar] [CrossRef]
  11. Wahlroos, O.; Valkama, P.; Mäkinen, E.; Ojala, A.; Vasander, H.; Väänänen, V.-M.; Halonen, A.; Lindén, L.; Nummi, P.; Ahponen, H.; et al. Urban Wetland Parks in Finland: Improving Water Quality and Creating Endangered Habitats. Int. J. Biodivers. Sci. Ecosyst. Serv. Manag. 2015, 11, 46–60. [Google Scholar] [CrossRef]
  12. Yang, L.; Chang, H.-T.; Huang, M.-N. Nutrient Removal in Gravel- and Soil-Based Wetland Microcosms with and without Vegetation. Ecol. Eng. 2001, 18, 91–105. [Google Scholar] [CrossRef]
  13. Axt, J.R.; Walbridge, M.R. Phosphate Removal Capacity of Palustrine Forested Wetlands and Adjacent Uplands in Virginia. Soil Sci. Soc. Am. J. 1999, 63, 1019–1031. [Google Scholar] [CrossRef]
  14. Pouyat, R.V.; Yesilonis, I.D.; Nowak, D.J. Carbon Storage by Urban Soils in the United States. J. Environ. Qual. 2006, 35, 1566–1575. [Google Scholar] [CrossRef] [PubMed] [Green Version]
  15. Wang, H.; Piazza, S.C.; Sharp, L.A.; Stagg, C.L.; Couvillion, B.R.; Steyer, G.D.; McGinnis, T.E. Determining the Spatial Variability of Wetland Soil Bulk Density, Organic Matter, and the Conversion Factor between Organic Matter and Organic Carbon across Coastal Louisiana, U.S.A. J. Coast. Res. 2017, 33, 507–517. [Google Scholar] [CrossRef]
  16. Heath, R.C. Ground-Water Regions of the United States; Geological Survey water-supply paper; U.S. Department of the Interior, Geological Survey: Washington, DC, USA, 1984.
  17. Fretwell, J.D.; Williams, J.S.; Redman, P.J. National Water Summary on Wetland Resources; USGS Water-Supply Paper 2425; USGS: Reston, VA, USA, 1996. [Google Scholar]
  18. Painter, A.A. Rise of a Region: A Development History of Northern Virginia; Walsh Colucci Lubeley & Walsh: Arlington, VA, USA, 2018. [Google Scholar]
  19. United States Environmental Protection Agency (US EPA) Watershed Index Online (WSIO) Indicator Data for EPA Region 3, Version 2.3 2021. Available online: https://www.epa.gov/system/files/other-files/2021-12/20211112-wsio-indicator-data-v2.3-epa-region03_0.xlsx (accessed on 19 January 2022).
  20. Ahn, C.; Jones, S. Assessing Organic Matter and Organic Carbon Contents in Soils of Created Mitigation Wetlands in Virginia. Environ. Eng. Res. 2013, 18, 151–156. [Google Scholar] [CrossRef]
  21. Collins, M.E.; Kuehl, R.O. Organic Matter Accumulation and Organic Soils. In Wetland Soils: Genesis, Hydrology, Landscapes, and Classification; CRC Press: Boca Raton, FL, USA, 2000; pp. 137–162. [Google Scholar]
  22. Cui, J.; Li, C.; Trettin, C. Modeling Biogeochemistry and Forest Management Practices for Assessing GHGs Mitigation Strategies in Forested Wetlands. Environ. Model. Assess. 2005, 10, 43–53. [Google Scholar] [CrossRef]
  23. Dee, S.M.; Ahn, C. Soil Properties Predict Plant Community Development of Mitigation Wetlands Created in the Virginia Piedmont, USA. Environ. Manag. 2012, 49, 1022–1036. [Google Scholar] [CrossRef] [PubMed]
  24. Gustave, W.; Yuan, Z.-F.; Sekar, R.; Ren, Y.-X.; Liu, J.-Y.; Zhang, J.; Chen, Z. Soil Organic Matter Amount Determines the Behavior of Iron and Arsenic in Paddy Soil with Microbial Fuel Cells. Chemosphere Oxf. 2019, 237, 124459. [Google Scholar] [CrossRef] [PubMed]
  25. Gutknecht, J.L.M.; Goodman, R.M.; Balser, T.C. Linking Soil Process and Microbial Ecology in Freshwater Wetland Ecosystems. Plant Soil 2006, 289, 17–34. [Google Scholar] [CrossRef]
  26. Hartman, W.H.; Richardson, C.J.; Vilgalys, R.; Bruland, G.L. Environmental and Anthropogenic Controls over Bacterial Communities in Wetland Soils. Proc. Natl. Acad. Sci. USA 2008, 105, 17842–17847. [Google Scholar] [CrossRef] [Green Version]
  27. Keller, J.K.; Medvedeff, K.L. Soil Organic Matter. In Wetland Soils: Genesis, Hydrology, Landscapes, and Classification; CRC Press: Boca Raton, FL, USA, 2016; pp. 165–188. [Google Scholar]
  28. Bae, J.; Ryu, Y. Land Use and Land Cover Changes Explain Spatial and Temporal Variations of the Soil Organic Carbon Stocks in a Constructed Urban Park. Landsc. Urban Plan. 2015, 136, 57–67. [Google Scholar] [CrossRef]
  29. Markewich, H.W.; Pavich, M.J.; Buell, G.R. Contrasting Soils and Landscapes of the Piedmont and Coastal Plain, Eastern United States. Geomorphology 1990, 3, 417–447. [Google Scholar] [CrossRef]
  30. Northern Virginia Regional Park Authority, Algonkian Regional Park 2020. Available online: https://www.novaparks.com/parks/algonkian-regional-park (accessed on 9 April 2020).
  31. Friends of Banshee Reeks Nature Preserve, Banshee Reeks Nature Preserve 2020. Available online: https://bansheereeksnp.org (accessed on 9 April 2020).
  32. Paul, J. In Our Backyard: Banshee Reeks, a Virginia Treasure. Loudoun Now, 24 March 2017. Available online: https://loudounnow.com/2017/03/24/in-our-backyard-banshee-reeks-a-virginia-treasure/(accessed on 24 July 2017).
  33. United States Department of Agriculture—Natural Resource Conservation Service (USDA–NRCS) Soil Survey Staff Web Soil Survey. 2020. Available online: https://websoilsurvey.nrcs.usda.gov/ (accessed on 5 January 2021).
  34. Hiza, B. Groundwater and Tidal Controls on Wetland Hydrology, Julie J. Metz Wetland Mitigation Bank, Woodbridge, Virginia. Master’s Thesis, Old Dominion University, Norfolk, VA, USA, 2017. Available online: http://digitalcommons.odu.edu/oeas_etds/6 (accessed on 6 August 2017).
  35. Ahn, C.; Gillevet, P.M.; Sikaroodi, M.; Wolf, K.L. An Assessment of Soil Bacterial Community Structure and Physicochemistry in Two Microtopographic Locations of a Palustrine Forested Wetland. Wetl. Ecol. Manag. 2009, 17, 397–407. [Google Scholar] [CrossRef]
  36. U.S. Fish and Wildlife Service Elizabeth Hartwell Mason Neck and Featherstone National Wildlife Refuges: Draft Comprehensive Conservation Plan and the Environmental Assessment, 2010. Available online: https://www.fws.gov/northeast/planning/MasonNeck_Featherstone/draftccp/Entire_Document.pdf (accessed on 18 June 2020).
  37. Caldwell, P.V.; Adams, A.A.; Niewoehner, C.P.; Vepraskas, M.J.; Gregory, J.D. Sampling Device to Extract Intact Cores in Saturated Organic Soils. Soil Sci. Soc. Am. J. 2005, 69, 2071–2075. [Google Scholar] [CrossRef]
  38. Giannopoulos, G.; Lee, D.Y.; Neubauer, S.C.; Brown, B.L.; Franklin, R.B. A Simple and Effective Sampler to Collect Undisturbed Cores from Tidal Marshes. bioRxiv 2019, 515825. [Google Scholar] [CrossRef] [Green Version]
  39. Craft, C.; Broome, S.; Campbell, C. Fifteen Years of Vegetation and Soil Development after Brackish-Water Marsh Creation. Restor. Ecol. 2002, 10, 248–258. [Google Scholar] [CrossRef] [Green Version]
  40. Osland, M.J.; Spivak, A.C.; Nestlerode, J.A.; Lessmann, J.M.; Almario, A.E.; Heitmuller, P.T.; Russell, M.J.; Krauss, K.W.; Alvarez, F.; Dantin, D.D.; et al. Ecosystem Development after Mangrove Wetland Creation: Plant–Soil Change across a 20-Year Chronosequence. Ecosystems 2012, 15, 848–866. [Google Scholar] [CrossRef]
  41. Bruland, G.L.; Richardson, C.J. Comparison of Soil Organic Matter in Created, Restored and Paired Natural Wetlands in North Carolina. Wetl. Ecol. Manag. 2006, 14, 245–251. [Google Scholar] [CrossRef]
  42. SAS Institute Inc. JMP®; SAS Institute Inc.: Cary, NC, USA, 1989. [Google Scholar]
  43. D’Angelo, E.M. Phosphorus Sorption Capacity and Exchange by Soils from Mitigated and Late Successional Bottomland Forest Wetlands. Wetlands 2005, 25, 297–305. [Google Scholar] [CrossRef]
  44. Craft, C.B.; Chiang, C. Forms and Amounts of Soil Nitrogen and Phosphorus across a Longleaf Pine–Depressional Wetland Landscape. Soil Sci. Soc. Am. J. 2002, 66, 1713–1721. [Google Scholar] [CrossRef]
  45. Peralta, R.M.; Ahn, C.; Gillevet, P.M. Characterization of Soil Bacterial Community Structure and Physicochemical Properties in Created and Natural Wetlands. Sci. Total Environ. 2013, 443, 725–732. [Google Scholar] [CrossRef]
  46. Heydari, M.; Prévosto, B.; Naji, H.R.; Mehrabi, A.A.; Pothier, D. Influence of Soil Properties and Burial Depth on Persian Oak (Quercus brantii Lindl.) Establishment in Different Microhabitats Resulting from Traditional Forest Practices. Eur. J. For. Res. 2017, 136, 287–305. [Google Scholar] [CrossRef] [Green Version]
  47. Menne, M.J.; Durre, I.; Korzeniewski, B.; McNeill, S.; Thomas, K.; Yin, X.; Anthony, S.; Ray, R.; Vose, R.S.; Gleason, B.E.; et al. Global Historical Climatology Network—Daily (GHCN-Daily), Version 3 [Daily Summaries] 2012. Available online: https://doi.org/10.7289/V5D21VHZ (accessed on 28 April 2021). [CrossRef]
  48. Galatowitsch, S.; Valk, A.; Van Der Valk, A. Vegetation and Environmental Conditions in Recently Restored Wetlands in the Prairie Pothole Region of the USA. Vegetatio 1996, 126, 89–99. [Google Scholar] [CrossRef]
  49. Rodríguez-Murillo, J.C.; Almendros, G.; Knicker, H. Wetland Soil Organic Matter Composition in a Mediterranean Semiarid Wetland (Las Tablas de Daimiel, Central Spain): Insight into Different Carbon Sequestration Pathways. Org. Geochem. 2011, 42, 762–773. [Google Scholar] [CrossRef] [Green Version]
  50. Korol, A.R.; Noe, G.B. Patterns of Denitrification Potential in Tidal Freshwater Forested Wetlands. Estuaries Coasts 2020, 43, 329–346. [Google Scholar] [CrossRef]
  51. Nair, V.D.; Graetz, D.A.; Reddy, K.R.; Olila, O.G. Soil Development in Phosphate-Mined Created Wetlands of Florida, USA. Wetlands 2001, 21, 232–239. [Google Scholar] [CrossRef]
  52. Ausseil, A.-G.E.; Jamali, H.; Clarkson, B.R.; Golubiewski, N.E. Soil Carbon Stocks in Wetlands of New Zealand and Impact of Land Conversion since European Settlement. Wetl. Ecol. Manag. 2015, 23, 947–961. [Google Scholar] [CrossRef]
  53. Yoon, T.K.; Noh, N.J.; Han, S.; Kwak, H.; Lee, W.-K.; Son, Y. Small-Scale Spatial Variability of Soil Properties in a Korean Swamp. Landsc. Ecol. Eng. 2015, 11, 303–312. [Google Scholar] [CrossRef]
  54. Giese, L.A.; Aust, W.M.; Trettin, C.C.; Kolka, R.K. Spatial and Temporal Patterns of Carbon Storage and Species Richness in Three South Carolina Coastal Plain Riparian Forests. Ecol. Eng. 2020, 15, S157–S170. [Google Scholar] [CrossRef] [Green Version]
  55. Hansen, V.D.; Nestlerode, J.A. Carbon Sequestration in Wetland Soils of the Northern Gulf of Mexico Coastal Region. Wetl. Ecol. Manag. 2014, 22, 289–303. [Google Scholar] [CrossRef]
  56. Johns, D.; Williams, H.; Farrish, K.; Wagner, S. Denitrification and Soil Characteristics of Wetlands Created on Two Mine Soils in East Texas, USA. Wetlands 2004, 24, 57–67. [Google Scholar] [CrossRef]
  57. Noe, G.B. Measurement of Net Nitrogen and Phosphorus Mineralization in Wetland Soils Using a Modification of the Resin-Core Technique. Soil Sci. Soc. Am. J. 2011, 75, 760–770. [Google Scholar] [CrossRef]
  58. Fajardo, G. Physical and Chemical Soil Properties of Ten Virginia Department of Transportation (VDOT) Mitigation Wetlands. Master’s Thesis, Virginia Polytechnic Institute and State University, Blacksburg, VA, USA, 2006. [Google Scholar]
  59. Stolt, M.H.; Genthner, M.H.; Daniels, W.L.; Groover, V.A.; Nagle, S.; Haering, K.C. Comparison of Soil and Other Environmental Conditions in Constructed and Adjacent Palustrine Reference Wetlands. Wetlands 2000, 20, 671–683. [Google Scholar] [CrossRef]
  60. D’Angelo, E.; Karathanasis, A.; Sparks, E.; Ritchey, S.; Wehr-McChesney, S. Soil Carbon and Microbial Communities at Mitigated and Late Successional Bottomland Forest Wetlands. Wetlands 2005, 25, 162–175. [Google Scholar] [CrossRef]
  61. Liggett, C.; Knappenberger, T.; Shaw, J.N.; Brantley, E.; Gamble, A.V. Comparison of Constructed Wetlands to a Preservation Wetland in the Nashville Basin, Tennessee (USA). Wetl. Wilmington NC 2019, 40, 1635–1646. [Google Scholar] [CrossRef]
  62. Taylor, J.; Middleton, B.A. Comparison of Litter Decomposition in a Natural versus Coal-Slurry Pond Reclaimed as a Wetland. Land Degrad. Dev. 2004, 15, 439–446. [Google Scholar] [CrossRef]
  63. Bernal, B.; Mitsch, W.J. Comparing Carbon Sequestration in Temperate Freshwater Wetland Communities. Glob. Chang. Biol. 2012, 18, 1636–1647. [Google Scholar] [CrossRef]
  64. Wolf, K.L.; Ahn, C.; Noe, G.B. Microtopography Enhances Nitrogen Cycling and Removal in Created Mitigation Wetlands. Ecol. Eng. 2011, 37, 1398–1406. [Google Scholar] [CrossRef]
  65. Loudoun County Office of Mapping and Geographic Information Aerial Archive, 1957 Imagery. Available online: https://logis.loudoun.gov/archive/ (accessed on 5 December 2021).
  66. Schmidt, S.A.; Ahn, C. Characterization of Redoximorphic Features of Forested Wetland Soils by Simple Hydro-Physicochemical Attributes in Northern Virginia, USA. Wetl. Ecol Manag. 2022. Available online: https://doi.org/10.1007/s11273-021-09855-z (accessed on 19 January 2022). [CrossRef]
  67. Palta, M.M.; Grimm, N.B.; Groffman, P.M. “Accidental” Urban Wetlands: Ecosystem Functions in Unexpected Places. Front. Ecol. Environ. 2017, 15, 248–256. [Google Scholar] [CrossRef]
  68. Zedler, J.B.; Leach, M.K. Managing Urban Wetlands for Multiple Use: Research, Restoration, and Recreation. Urban Ecosyst. 1998, 2, 189–204. [Google Scholar] [CrossRef]
  69. Adame, M.F.; Reef, R.; Wong, V.N.L.; Balcombe, S.R.; Turschwell, M.P.; Kavehei, E.; Rodríguez, D.C.; Kelleway, J.J.; Masque, P.; Ronan, M. Carbon and Nitrogen Sequestration of Melaleuca Floodplain Wetlands in Tropical Australia. Ecosystems 2020, 23, 454–466. [Google Scholar] [CrossRef]
  70. Chmura, G.L.; Anisfeld, S.C.; Cahoon, D.R.; Lynch, J.C. Global Carbon Sequestration in Tidal, Saline Wetland Soils. Glob. Biogeochem. Cycles 2003, 17. [Google Scholar] [CrossRef]
  71. Van Dam, D.; Veldkamp, E.; Van Breemen, N. Soil Organic Carbon Dynamics: Variability with Depth in Forested and Deforested Soils under Pasture in Costa Rica. Biogeochemistry 1997, 39, 343–375. [Google Scholar] [CrossRef]
  72. Bai, J.; Ouyang, H.; Deng, W.; Zhu, Y.; Zhang, X.; Wang, Q. Spatial Distribution Characteristics of Organic Matter and Total Nitrogen of Marsh Soils in River Marginal Wetlands. Geoderma 2005, 124, 181–192. [Google Scholar] [CrossRef]
  73. Bridgham, S.D.; Updegraff, K.; Pastor, J. Carbon, Nitrogen, and Phosphorus Mineralization in Northern Wetlands. Ecology 1998, 79, 1545–1561. [Google Scholar] [CrossRef]
  74. Gathumbi, S.M.; Bohlen, P.J.; Graetz, D.A. Nutrient Enrichment of Wetland Vegetation and Sediments in Subtropical Pastures. Soil Sci. Soc. Am. J. 2005, 69, 539–548. [Google Scholar] [CrossRef]
  75. Ma, K.; Zhang, Y.; Tang, S.; Liu, J. Spatial Distribution of Soil Organic Carbon in the Zoige Alpine Wetland, Northeastern Qinghai–Tibet Plateau. CATENA 2016, 144, 102–108. [Google Scholar] [CrossRef]
  76. Sigua, G.C.; Griffin, J.; Kang, W.; Coleman, S.W. Wetland Conversion to Beef Cattle Pasture Changes in Soil Properties. J. Soils Sediments 2004, 4, 4–10. [Google Scholar] [CrossRef]
  77. Stephens, K.; Sencindiver, J.; Skousen, J. Characteristics of Wetland Soils Impacted by Acid Mine Drainage. Southeast. Nat. Steuben Me 2015, 14, 40–57. [Google Scholar] [CrossRef]
  78. Causarano, H.J.; Franzluebbers, A.J.; Shaw, J.N.; Reeves, D.W.; Raper, R.L.; Wood, C.W. Soil Organic Carbon Fractions and Aggregation in the Southern Piedmont and Coastal Plain. Soil Sci. Soc. Am. J. 2008, 72, 221–230. [Google Scholar] [CrossRef] [Green Version]
  79. Craft, C.; Vymazal, J.; Kröpfelová, L. Carbon Sequestration and Nutrient Accumulation in Floodplain and Depressional Wetlands. Ecol. Eng. 2018, 114, 137–145. [Google Scholar] [CrossRef]
  80. Trammell, T.L.E.; Pataki, D.E.; Pouyat, R.V.; Groffman, P.M.; Rosier, C.; Bettez, N.; Cavender-Bares, J.; Grove, M.J.; Hall, S.J.; Heffernan, J.; et al. Urban Soil Carbon and Nitrogen Converge at a Continental Scale. Ecol. Monogr. 2020, 90, e01401. [Google Scholar] [CrossRef] [Green Version]
  81. Ahn, C.; Peralta, R.M. Soil Bacterial Community Structure and Physicochemical Properties in Mitigation Wetlands Created in the Piedmont Region of Virginia (USA). Ecol. Eng. 2009, 35, 1036–1042. [Google Scholar] [CrossRef]
  82. Verry, E.S.; Boelter, D.H.; Paivanen, J.; Nichols, D.S.; Malterer, T.; Gafni, A. Physical Properties of Organic Soils. Chapter 5. In Peatland Biogeochemistry and Watershed Hydrology at the Marcell Experimental Forest; Kolka, R.K., Sebestyen, S., Verry, E., Brooks, K.N., Eds.; CRC Press: Boca Raton, FL, USA, 2011; pp. 135–176. [Google Scholar]
  83. Ruehlmann, J.; Körschens, M. Calculating the Effect of Soil Organic Matter Concentration on Soil Bulk Density. Soil Sci. Soc. Am. J. 2009, 73, 876–885. [Google Scholar] [CrossRef]
  84. Goddard, M.A.; Mikhailova, E.A.; Post, C.J.; Schlautman, M.A.; Galbraith, J.M. Continental United States Atmospheric Wet Calcium Deposition and Soil Inorganic Carbon Stocks. Soil Sci. Soc. Am. J. 2009, 73, 989–994. [Google Scholar] [CrossRef]
  85. Roper, W.R.; Robarge, W.P.; Osmond, D.L.; Heitman, J.L. Comparing Four Methods of Measuring Soil Organic Matter in North Carolina Soils. Soil Sci. Soc. Am. J. 2019, 83, 466–474. [Google Scholar] [CrossRef]
  86. Hossler, K.; Bouchard, V. Soil Development and Establishment of Carbon-Based Properties in Created Freshwater Marshes. Ecol. Appl. Publ. Ecol. Soc. Am. 2010, 20, 539–553. [Google Scholar] [CrossRef]
Figure 1. Study area of Northern Virginia (NOVA), highlighting wetland site locations and their respective physiographic provinces.
Sustainability 14 02048 g001
Figure 2. Total carbon (TC, %) and nitrogen (TN, %) contents by site and by depth. (a): TC (%) between 0 and 30 cm by site; (b): TC (%) by site and depth interval (0–10, 10–20, and 20–30 cm); (c): TN (%) between 0 and 30 cm by site; (d): TN (%) by site and depth interval (0–10, 10–20, and 20–30 cm). a,b,c letters indicate significant differences between sites for 0–30 cm (a,c) and 0–10 cm (b,d) depths at α = 0.05.
Sustainability 14 02048 g002
Figure 3. Regression plots for total carbon percentages (TC) and total carbon stocks (TC stocks, kg·m−2) versus two physicochemical properties, gravimetric soil moisture (GSM) and bulk density (Db), where average measurements and calculations for each sample plot were used as the basis for regression. Regressions include (a) TC (%) vs. GSM (%) and (b): TC (%) vs. Db (g·cm−3), which were statistically significant (p < 0.05); and (c) TC stocks (kgC·m−2) vs. GSM (%) and (d) TC stocks (kgC·m−2) vs. Db (g·cm−3), which were not statistically significant (p > 0.05).
Sustainability 14 02048 g003
Table 1. Site setting as described by landscape, site, and wetland properties.
Algonkian Regional Park (ARP) Banshee Reeks
(BR)
Julie J. Metz—Neabsco Creek
(JJM)
Mason Neck
(MN)
Watershed NameSugarland Run Big Branch—Goose Creek Neabsco Creek Occoquan Bay—
Potomac River
% Impervious
Surface Cover
≥25% (high) <5% (low) ≥25% (high) <5% (low)
Physiographic ProvincePiedmont (P)Piedmont (P)Coastal Plain (CP)Coastal Plain (CP)
GeomorphologyDrainageways, floodplains, terracesDrainageways, floodplainsTerraces, floodplainsFluvomarine terraces,
interfluves, drainageways
Nonhydric
soil series
Linside silt loam
Huntington silt loam
Leedsville cobbly silt loam
Oatlands gravelly silt loam
Manassas silt loam
Dumfries sandy loam
Lunt loam
Gunston silt loam
Matapeake silt loam
Mattapex loam
Hydric
soil series
Kinkora–Delanco complexCodorus, Albano,
and Hatboro silt loams
Featherstone mucky silt loam
Hatboro-Codorus silt loam
Elbert silt loam
Elkton silt loam
Major HabitatsBlack walnut and oak
forested floodplain;
freshwater forested wetlands; freshwater emergent wetland
Hardwood forests; riparian zones and wetlands;
Mountain-Piedmont basic seepage swamp
Forested, scrub, and emergent wetlandsHardwood oak-hickory forest; palustrine forested wetlands
Table 2. Soil physicochemical properties measured for four sites along the depth scale reported as averages ± standard errors. Total carbon stocks were calculated with the carbon values of the upper 10 cm of soil. GSM: gravimetric soil moisture; Db: bulk density; TC: soil total carbon content; TN: soil total nitrogen content; TC stock: soil total carbon stocks.
Piedmont (P)Coastal Plain (CP)
DepthARPBRJJMMN
GSM (%) *0–30 cm43.36 ± 1.72 a,b33.67 ± 2.06 b58.03 ± 5.01 a40.16 ± 3.44 b
0–10 cm55.27 ± 2.52 a,b,c42.85 ± 3.02 b,c,d76.92 ± 10.30 a57.65 ± 8.12 a,b
10–20 cm38.06 ± 1.75 b,c,d32.46 ± 3.79 c,d44.09 ± 6.65 b,c,d32.12 ± 2.40 c,d
20–30 cm36.74 ± 1.52 b,c,d25.70 ± 2.46 d51.83 ± 4.76 b,c,d30.71 ± 2.65 d
Soil pH *0–30 cm6.09 ± 0.03 a6.11 ± 0.08 a5.96 ± 0.04 a4.67 ± 0.03 b
0–10 cm5.96 ± 0.05 a6.14 ± 0.08 a5.79 ± 0.25 a4.68 ± 0.08 b
10–20 cm6.09 ± 0.04 a6.13 ± 0.15 a5.89 ± 0.22 a4.68 ± 0.05 b
20–30 cm6.21 ± 0.04 a6.06 ± 0.18 a6.28 ± 0.21 a4.65 ± 0.03 b
Db (g·cm−3) 0–30 cm1.27 ± 0.03 a1.37 ± 0.06 a1.15 ± 0.08 a1.25 ± 0.05 a
0–10 cm1.11 ± 0.04 b,c,d1.14 ± 0.07 b,c,d0.94 ± 0.12 d0.96 ± 0.07 c,d
10–20 cm1.38 ± 0.06 a,b1.32 ± 0.08 a,b,c1.26 ± 0.14 b,c,d1.36 ± 0.06 a,b
20–30 cm1.31 ± 0.04 a,b,c1.65 ± 0.12 a1.29 ± 0.14 a,b,c,d1.44 ± 0.06 a,b
TC (%) *0–30 cm1.25 ± 0.09 c2.09 ± 0.22 a,b2.76 ± 0.25 a2.03 ± 0.35 b
0–10 cm1.93 ± 0.13 d,e3.21 ± 0.46 b,c4.21 ± 0.74 a,b4.43 ± 0.94 a
10–20 cm1.03 ± 0.13 d,e,f1.73 ± 0.37 d,e,f2.03 ± 0.29 c,d0.90 ± 0.10 d,e,f
20–30 cm0.80 ± 0.08 e,f1.34 ± 0.33 d,e,f1.88 ± 0.48 c,d0.66 ± 0.15 f
TN (%) *0–30 cm0.14 ± 0.01 b0.18 ± 0.02 ab0.21 ± 0.02 a0.16 ± 0.02 b
0–10 cm0.20 ± 0.01 b,c0.27 ± 0.04 a,b0.31 ± 0.05 a0.30 ± 0.08 a
10–20 cm0.12 ± 0.01 c,d0.16 ± 0.03 c,d0.16 ± 0.02 c,d0.09 ± 0.02 d
20–30 cm0.10 ± 0.01 d0.12 ± 0.03 c,d0.15 ± 0.02 c,d0.07 ± 0.02 d
TC Stock (kg·m−2) 0–10 cm2.12 ± 0.24 b3.49 ± 0.61 a3.50 ± 0.55 a3.67 ± 0.45 a
* Statistically significant (p < 0.05). a,b,c,d,e,f letters indicate significant differences between sites and depth intervals at α = 0.05.
Table 3. Soil physicochemical and total carbon (TC) and nitrogen (TN) contents in various types of freshwater wetland soils as reported from selected references (from 1990 to 2020).
Wetland TypeSoil pHDb (g·cm−3)TC (%)TN (%)nSource
Freshwater marshes
P *5.61.07--3Ahn and Jones 2013 [20]
P *4.951.29-0.174Dee and Ahn 2012 [23]
other8.760.98--20Galatowitsch and van der Valk 1996 [48]
other7.33--0.841Rodríguez-Murillo et al., 2011 [49]
Freshwater swamps
CP-0.71--2Korol and Noe 2020 [50]
CP6.240.95-0.31Nair et al., 2001 [51]
other-0.431.73-42Ausseil et al., 2015 [52]
other5.29-5.240.521Yoon et al., 2015 [53]
Riparian systems
CP4.21.05--3Axt and Walbridge 1999 [13]
CP-1.28-0.123Craft and Chiang 2002 [44]
CP *--2.2–2.9-3Giese et al., 2000 [54]
CP-0.788.48-13Hansen and Nestlerode 2014 [55]
CP4.83--1.453Johns et al., 2004 [56]
P4.971.26--3Axt and Walbridge 1999 [13]
P5.620.882.890.171Noe 2011 [57]
P4.91.252.50.322Peralta et al., 2013 [45]
both *--0.85–2.32-10Fajardo 2006 [58]
both5.55-3.850.302Stolt et al., 2000 [59]
both *6.40-1.200.132Stolt et al., 2000 [59]
other-1.012.17-8D’Angelo 2005 [43]; D’Angelo et al., 2005 [60]
other6.85---1Liggett et al., 2019 [61]
other5.3---1Taylor and Middleton 2004 [62]
* Constructed wetlands in literature.
Table 4. Two-way analysis of variance (ANOVA) of soil carbon and physicochemical properties by two factors and their interaction: soil depth (i.e., 0–10 cm and 10–30 cm) and physiography (i.e., Piedmont or Coastal Plain). GSM = gravimetric soil moisture (%); Db = bulk density (g·cm−3); TC = total carbon (%); TN = total nitrogen (%).
GSM Db pH TC TN
FSigFSigFSigFSigFSig
Depth9.84**9.26**0.23-33.03**27.74**
Physiography3.44-2.02-33.23**8.06**1.42-
Depth X Physiography0.94-0.29-0.03-4.52*1.76-
** significant at the 0.01 level; * significant at the 0.05 level; - is non-significant (p > 0.05).
Publisher’s Note: MDPI stays neutral with regard to jurisdictional claims in published maps and institutional affiliations.

