Article

Geometric and Topological Bases of a New Classification of Wood Vascular Tissues, Part 2: Classification of Vessels According to Their Grouping

by
Nikolai Bardarov
1,*,
Nicole Christoff
2 and
Vladislav Todorov
3
1
Faculty of Forest Industry, University of Forestry Sofia, 1797 Sofia, Bulgaria
2
Faculty of Telecommunications, Technical University of Sofia, 1756 Sofia, Bulgaria
3
Faculty of Business Management, University of Forestry Sofia, 1797 Sofia, Bulgaria
*
Author to whom correspondence should be addressed.
Sustainability 2022, 14(4), 2031; https://doi.org/10.3390/su14042031
Submission received: 6 November 2021 / Revised: 19 January 2022 / Accepted: 1 February 2022 / Published: 11 February 2022
(This article belongs to the Special Issue System Engineering Development and Sustainability Applications)

Abstract

:
The arrangement of vessels and their grouping is unique in most tree species. When observing tiny, microscopic samples of wood, the arrangement of the wood vessels forms a characteristic and repetitive pattern, which is largely determined by the tree species, but it is also influenced by the site conditions as well as its location in the tree. The present study is part of a project aimed at applying computer vision and computer recognition methods to present a more general and comprehensive group classification of wood vessels. Quantitative descriptions of the grouping of vessels, as a rule, have so far been used mainly to reveal characteristic deviations from the typical structure of wood, for example, due to extreme site conditions. Therefore, they are applicable but not sufficient for the present study and need in-depth revision. A classification of vessels is presented depending on their mutual position, and more precisely, the groups of adjacent vessels are determined using quantitative methods. The quantitative indicators used for this purpose are based on the diameter and other quantitative indicators of the vessels’ arrangements. The proposed classification, although based on a long-known classification scheme in structural wood science, allows for the more precise definition of the classes of a grouping of adjacent vessels in a cross-section as a necessary step towards the wider use of the methods of machine recognition of wood.

1. Introduction

The structure of the anatomical elements in the cross-section of the wood divides tree species into groups [1,2,3]. Each of these structures is distinguished by a distinct arrangement of vascular cells (vessels) as well as typical variations in their diameter and mutual position as seen in the stem cross-section [4,5]. The current classification employs indicators such as vessel diameter, distance between vessels, and cross-section shape. All of these indicators are statistically significant and allow for the quantitative analyses of various aspects of wood structure [2,5].
For most species, the repeatability and predictability of the characteristic pattern visible on vessels and other tissues in cross-sectional samples (also known as the transverse texture of the wood) are preserved in all parts of the stem and all representatives of the species. So far, qualitative characteristics have been used primarily in such a description of the wood structure. The tree species are classified and identified with their aid, which in most cases requires a high level of qualification and is extremely difficult [1,4].
The subdivision of vessels based on quantitative characteristics, as well as their safe and accurate identification, poses challenges that have yet to be resolved using standard statistical methods in order to obtain a more accurate and precise representation of the spatial structure. It is also useful in practice. When varnishing wood surfaces, for example, a varnish is chosen to accentuate the texture of the wood [2,3]. Statistical and computer methods in the field of computer vision can be used to more accurately determine the location of vessels and their spatial grouping.
The limitations of the standard statistical values of object spatial scattering determine this requirement. For example, using statistical variance of vessel distances as a grouping indicator cannot determine whether vessels are glued or spaced individually. Species with an uneven vessel arrangement, on the other hand, may have a dispersion equal to species with significantly more evenly distributed wood but many glued vessels. Solving such and similar problems necessitates the development of a database of species with distinct spatial structures.
The current work aims to compare and analyze the values of observable and calculated quantitative indicators (coefficients) of the anatomical wood structure, to classify the tree species according to their mutual position (topology) in groups of neighboring vessels.

State of the Arts

Pattern recognition has evolved into a valuable tool for assisting in the identification and classification of timber species. Traditionally, forest species recognition has been approached as a texture classification problem (see Table 1). In the field of image processing, a texture of an image is a set of features, computed from the input image, aiming to measure the visible texture (pattern) of an image. The classification of wood species using texture characteristics of transverse cross-section microscopic images is the focus of the current study. Some authors, such as [6,7], use the images as inputs for convolutional neural network (CNN), where the features are extracted by the classifier.
Other authors explore and extract features using standard texture methods such as Local Binary Patterns (LBP) [2,8], Local Phase Quantization (LPQ) [9], gray level co-occurrence matrix [10] or Mathematical morphological operation and K-L divergence [11]. After the analysis of the pixel information, the extracted features can be dimensionally reduced by linear discriminant analysis (LDA) [9], principal component analysis (PCA) [9,11] and kernel principal component analysis (KPCA) [11], and multidimensional scaling (MDS) [11].
After that, for the classification task, the support vector machine (SVM) is commonly exploited [8,10]. This classifier can be combined with BP neural network and Mahalanobis distance (MD) to perform hardwood species classification [11]. In recent years, a deep learning classifier, such as CNN architectures, has started to be exploited [6,7,12].
Another method for wood classification is by benefiting from information about the trees themselves. For example, He et al. [13] employs forensic identification from its anatomically similar species P. tinctorius, distance- (TaxonDNA) and tree-based (NJ tree). For the classification task, four machine learning algorithms, such as Barcoding with logic (BLOG), BP-neural network, Sequential Minimal Optimization (SMO), and decision tree algorithm (J48) are used.
The neural network can accept various types of data, including pixels, vectors, and entire images. Ravindran et al. [12] employs images as neural network architecture entries. The proposed classification could be useful for quantitative wood anatomy studies such as clone comparison, differentiating growing patterns, and cell aggregations. They can also be reported in algorithms for image analysis. In the field of computer vision, the best data is obtained with a small quantity (for example, the length of the vector, not the number of vectors) to produce quality (descriptive) information. The obtained results will be high-quality entries for machine learning architectures. We suggest a combination of the two methods (image analysis and specific wood information) for the classification of wood vascular tissues. We propose to extract anatomical information of microscopic cross-section images to perform the classification of vessels according to their grouping.

2. Methods and Materials

The wood studied in this work is presented with microscopic preparations by Richter and Dallwitz [14]. Only the cross-sections of wood are examined. Representatives of the tree flora have been selected to cover the main variety of anatomical wood structures. The second criterion by which the tree species are selected is their economic importance as a raw material.
For this purpose, 76 tree species (see Table 2) are studied as representatives of the main wood structures. Based on previous classifications, an attempt has been made to quantify each major structure of wood anatomy [4]. Coefficients used to quantify the anatomical wood structure are used.
It is assumed that positions (X, Y) of the centers of the vessels and some vessel properties, such as diameters, the orientation, the centroid. and the perimeter of the segmented cell cavity, are known.

2.1. Classification of Vessels into Groups According to Their Grouping

In fulfillment of the requirements of the computer vision methods, it is correct when grouping the vessels to divide the groups into homogeneous and heterogeneous according to their diameter, and into regular and irregular according to the distances between them. In the former, the diameters or distances are comparable (i.e., statistically close), while in the latter the diameters or distances between vessels vary within more size classes (in histograms) and have a greater coefficient of variation. A given tree species may have a combination of different structure groups.
The grouping of the vessels into homogenous and inhomogeneous groups can be performed by the method of k-means, known in the cluster analysis or another similar to it.
To improve the analysis of the individual structures and the possibilities for the classification of the individual tree species, the following coefficients characterizing the anatomical wood structure can be used [15]:
  • Vessel distribution coefficient (A), which relates the diameter and distance of the examined cells to the density of the vessels.
  • Coefficient of influence of the site (B), which connects the diameter and distance of the studied cells with the total area of the vessels.
  • Coefficient of concentration (C), which represents the ratio of the distance between the two cells tested (µ1) to the average diameter of these cells ( d ¯ ).
  • Coefficient of diffusion (D), which represents the ratio of the average diameter between two measured cells ( d ¯ ) to the distance between them (µ1).

2.2. Solitary Arrangement of Vessels

In this arrangement, the vessels are at such distances from each other (for at least 90% of them) that their cell walls do not touch other adjacent vessels (Figure 1) [4]. Such a mutual arrangement is found in most tree species and all major wood structures. There is a big difference between the species growing in the temperate zone and the species found in the tropics.
For example, in sparsely porous species growing in temperate conditions, the vessels are small (up to about d = 70–90–100 µm), numerous (δ = 40–50 number/mm2 in boxwood (Buxus sempervirens) and maple (Acer pseudoplatanus)), and up to δ = 150–170–240 number/mm2 for pear (Pyrus communis), apple (Malus silvestris), etc., where they are located very densely. This density is expressed in average distances from about 219 µm (for maple) to 91 µm (for pear). In tropical species, for example, the diameter of the vessels is often over 100 µm and they are visible to the naked eye. In addition, their density is much lower compared to the diffuse porous (1) 315 (30) number/mm2.
Even in species with small vessels (rosewood, ebony, etc.), the density does not exceed 30–40 number/mm2. This also affects the distances between them, which are much larger (300 µm for ebony and 516 µm for rosewood). The main difference between tropical and those with a separate annual ring is that their diameter and density do not change within the observed surface (even if the species are composed of vessels of different diameters).
By a solitary arrangement of adjacent vessels, we will understand such a grouping, in which the ratio between the diameters of the vessels and the distances between them correspond to the condition γ = n.d, as n > 1.5. Therefore, the quantitative and more precisely, in our opinion, the definition of the term “group of vessels” states that adjacent vessels that are less than 1.5 times their diameter (γ < 1.5 d) will be called a group of vessels. This is because many species form structures visible to the naked eye without the vessels touching each other.
The variety of the location of adjacent vessels makes it difficult to establish a separate classification, which includes all possible variants of the mutual arrangement of adjacent vessels, which can uniquely characterize the tree species or its site. That is why we usually call them groups of vessels, here only some are characteristic and have easy to distinguish configurations of adjacent vessels.

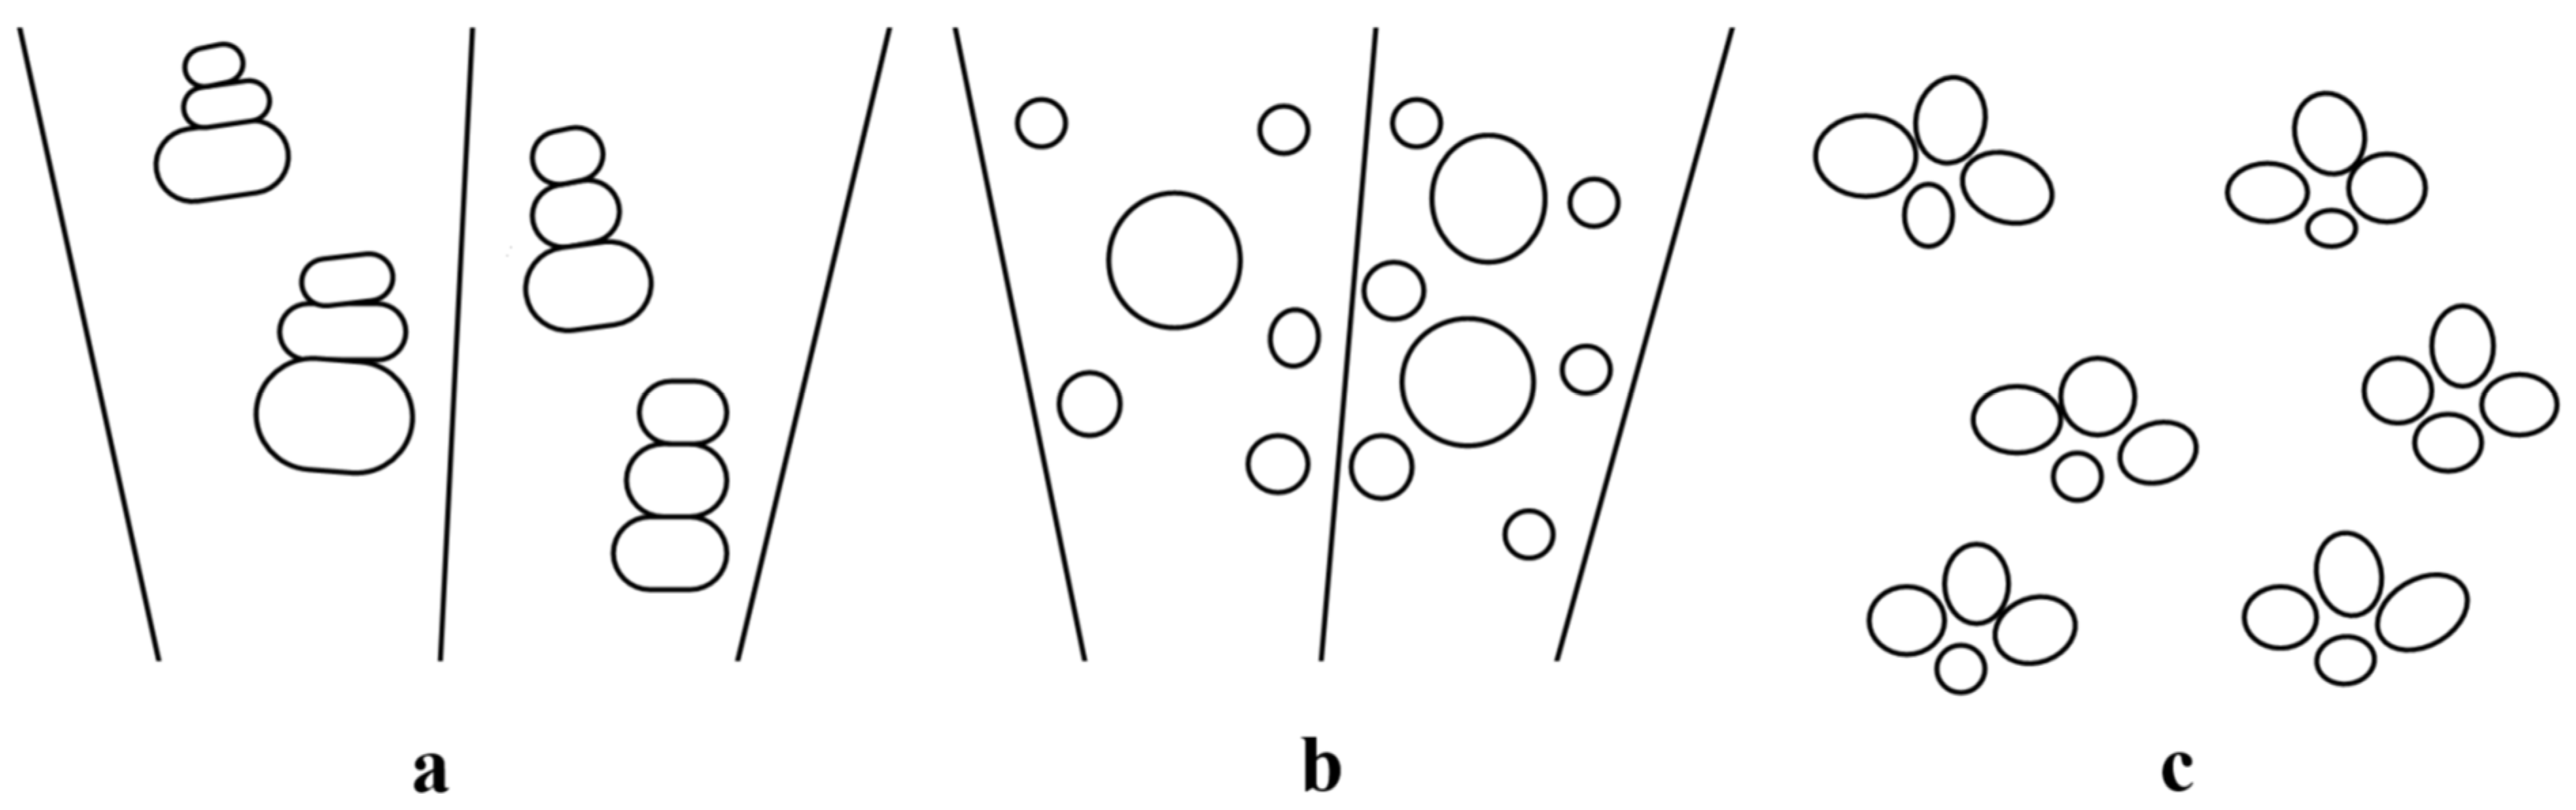
2.3. Arrangement of Vessels in Clusters and Tangential Groups

Clusters are groups in which the vessels come into contact with more than one wall and more than one cell. Tangential groups are formed by cells that are in contact with their radial wall, and sometimes these bands can be several cells wide and they can also be in contact with their other wall [4]. For some of the tree species, this arrangement of the vessels is unique, and this makes their classification and identification safe and fast.
Not coincidentally, the grouping of vessels in long tangential wavy tapes is called the “ulmoid” (from elm—Ulmus glabra) arrangement of vessels. In these classifications, the indicated locations can be found in different main construction structures (Figure 2). For example, nests are found in black locust (Robinia pseudoacacia), mulberry (Morus alba), maakia (Maakia amurensis), etc., which are ring-porous [4,16,17].
There, these groups are made up of vessels that a have larger diameter in the middle of the annual ring, but towards the end, it decreases and the number of cells in the cluster increases. This definition, which is widely accepted in the anatomy of wood, gives great freedom for their interpretation. Here, the shape and size of clusters are variable and sometimes difficult to define [17].
Elderberry (Sambucus nigra) wood can be mentioned as a transitional form between the nests and the long tangential groups. The distance between the groups often exceeds three times the diameter (γmax = 2–3 d), while the distance within the groups is less than the diameter of the vessels (γmin < d) Figure 2b. The short tangential groups of vessels have so far not been separated into individual groups (vessels arranged perpendicular to the beams and forming tangential bands).
These strips can be straight or wavy [4]. In addition, they are usually one or two cells wide. In some species, however, they are typical vessel structures. Such groups are found in Ailanthus altisima, which is ring-porous, in Cardwellia sublimis (which is a tropical tree known as the “northern silk oak”), called “garlands” [6].
Such an arrangement is also found in Astragalus fruticosus and Caragana jubata, which are diffuse-porous, as well as in Rhus coriaria and Aralia elata, which have a rather transitional structure [15]. The exact number of repeated minimum distances is important when dividing this group in automatic recognition.
The grouping of the vessels in long tangential bands, apart from the elm (Ulmus glabra), is also found in the European nettle tree (Celtis australis), Kalopanax septemlobus, etc., which are ring-porous. However, a similar arrangement is found in Eleutherococcus senticosus and Acanthopanax sessiliflorus, which are diffuse-porous [15]. The latter type grouping can be considered as a transition from short to long tangential groups.
There is a similar arrangement in the wood of ivy (Hedera helix), which is a liana. Here, in classifying and identifying, not only is the width of the area of the vessels in the latewood important, but also the width of the area of the fibers between them (i.e., γmax). Furthermore, some of these wavy lines are not always continuous (i.e., interrupted in the tangential direction only by wood rays) Figure 2c.
In general, however, these types of arrangements are relatively rare. That is why we combine them into one group together with the short tangential groups. What they have in common is that they are made up of vessels of approximately the same diameter. In addition, they are quantified by the ratio between the distances between the groups and the distances within the groups themselves (γmax/γmin).

2.4. Radial and Diagonal Grouping of Vessels

One of the most common ways of grouping is radial groups (Figure 3). The wood rays also help a lot, especially those that are on both sides of the vessels, and “mark” the places where the groups are formed. These include strictly radial groups (Figure 3a), diagonally arranged groups Figure 3b, and groups of expanding funnel-shaped structures of vessels called dendrites Figure 3c.
Strictly radial chains can be divided into three groups—with a few vessels called short radial chains Figure 3a(1)). These groups contain 2–3 cells and the distances between them in the radial direction are significant. They are found in Duschekia frutikoza, which is diffuse-porous [16].
The second group contains vessels up to about 3–5 cells. These are repetitive and characteristic groups, and the distances between them are smaller (Figure 3a(2)). They are found in hornbeam (Carpinus betulus) and water hornbeam (Ostrya carpinifolia), which are diffuse-porous, in vessels in the late sumac wood (Cotinus coggygria), which is ring-porous, and in some tropical ones such as Gambia (Gambeya beguei) [14,16]. According to recent authors, the formation and size of groups may also depend on environmental conditions and the same species could occasionally have short groups and sometimes medium groups, for example in Alstonia (Alstonia scholaris).
The third group consists of long radial chains. Here, the cells in the chain are more than 6 (Figure 3a(3)). They are found in baehni (Breviea leptosperma), duca (Tieghemella africana), called pore chains [6], and Nicotiana glauca [17]. The main characteristics of these radial arrangements are the alternation of γmax and γmin in the radial direction. It is important to note that the contact between the vessels can be at one point (i.e., γmin = d) or in a common line (i.e., γmin < d), which strongly affects the shape of the vessels in a group and helps to classify them.
The diagonal arrangement of the vessels can also be found in several variants (Figure 3b). It is most typical for the tropical makore (Tieghemella heckelii) and guanandi (Calophyllum brasiliense) [14]. They are also found in Chamaccytisus ruthenicus, which is diffuse-porous and in the transition zone between the vessels in the early and latewood of common chestnut (Castanea sativa) [16].
The last group consists of vessels that have a funnel-shaped arrangement, often meandering groups called dendrites (Figure 3c). They are found in the latewood of oaks (Quercus robur), mainly in the section of roburoid oaks. However, it should be noted that they show their true shape with regular, medium-wide annual rings.
Apart from them, they are also found in Bupleurum fruticosum, which is rather with a transitional structure, or in Rhamnus, Adenocarpus viscosus, and Coronilla valentina, which are diffuse-porous [16,17]. The distances within and between the groups are typical. Within the group, the distances are approximately equal in all directions (i.e., µmin ≈ d ÷ 2d, but mainly 1.5 d). This arrangement is one of the reasons to define the term group with the condition µmin = 1.5 d, otherwise these vessels must be indicated as single.
Between the dendrites, these distances vary considerably within the annual ring. This change depends mainly on the tree species and the width of the annual ring. In the case of oaks, γmax starts from about 10d, and somewhere the dendrites almost gather/merge (i.e., µmax ≈ 2d ÷ 3d). In some species, such as Adenocarpus decorticans and Rhamnus cathartica, the dendrites overflow from one to another.

2.5. Heterogeneous Groups (Mixed Arrangement of Large and Small Vessels)

In many of the species, there are variations in the formation of groups with different diameter vessels (Figure 4). Here, the differences are both quantitative and qualitative. These species have a highly inhomogeneous wood structure. Some of the tropics form groups that are somewhere between short radial groups and clusters. What is special in these groups is the large difference in the diameter of the vessel-forming stem (Figure 4a).
They are found in (Antiaris africana), duce (Afzelia africana), lati (Amphimas ferrugineus), tornillo (Cedrelinga catenaeformis), and others. Another important feature of these groups is that the vessels are flattened radially in the ellipse, and the radial diameter is smaller than the average. The large diameter of the ellipse can be of any orientation but is most often in the tangential direction. This group is a kind of cluster, but here the vessels are in contact mainly with their tangential walls.
Although it does not consider the other fabrics in the wood (spare and mechanical), this classification allows to place here and consider the structure of the stems of palms and bamboo Figure 4c. This wood can also have good physical and mechanical properties. Its construction is no less interesting, as the proposed classification can assign it in this subgroup.
There are no annual rings and no boundaries between them. The main mass is of parenchymal tissue, and the conducting cells are gathered in characteristic closed collateral bundles, which change depending on their position in the stem (both in height and diameter). The minimum and maximum dimensions between the vessels are almost constant and characteristic of each species.

3. Results and Discussion

3.1. Quantitative Definition of Homogeneous and Heterogeneous Anatomical Structures

To propose a definition of a homogeneous or heterogeneous grouping of vessels, the limits of variation in diameter or distances between individual vessels should be indicated. The density of the vessels, the average diameter, and the distances between them are determined. The total area of the vessels, given as a product of the number of observed vessels and their average diameter, as well as the coefficients proposed above, have been calculated.
For each tree species, the results are presented statistically in the form of histograms of the elementary distribution of the observed values. The purpose of this presentation of the results is to determine the ranges of variation of the anatomical parameters as groups of grouping. The weight of the classes is a key indicator in the classification of species, which is done together with the visual analysis of the samples. When identifying groups of species as homogeneous, moderately inhomogeneous, and highly inhomogeneous, the value of the coefficient of variation is also used.
The main result of the proposed procedure for analysis of wood species is to determine as accurately and consistently as possible the belonging of the species to one of the above groups of wood. In cases where the same tree species has characteristics belonging to two different groups, it is hypothesized that representatives of a species move from one group to another due to habitat peculiarities that greatly change the structure of the wood, as well as quantitatively.

3.2. Classification of Species with Solitary Vessels

The average value of the coefficient C (µ/d) of almost all of the studied tree species is greater than 2.0. According to the 1989 IAWA definition, those are selected in which the vessels forming ratios of less than 1.5 are not more than 10% [4]. With such a single location there are representatives of all major construction structures. As expected, most of them are tropical tree species, and some of these structures can be called homogeneous in diameter.
Of the semi-ring-porous (walnut, teak, paulownia), all species having a single arrangement of vessels are heterogeneous in their diameter. Both of the studied diffuse-porous species are homogeneous in diameter. Breccia is regular, and the gel is moderately irregular according to the distances between their vessels. Out of the 11 tropical tree species studied, 5 species are homogeneous and 6 species are heterogeneous in diameter. Some are regular and 8 species are moderately irregular in the distances between their vessels.

3.3. Classification of Species with Clusters and Tangential Groups

From the studied species, those with tangential groups of vessels were selected mainly based on visual analysis. Here, the average value of C (µ/d) is the lowest (1.87) among the 76 studied species. The range of values of the distances between the vessels is of key importance for the classification of the species.
Of particular importance for the classification is the orientation of these distances, especially those in the radial direction. In earlywood, the small distances are oriented mainly tangentially. If the orientations in the other directions increase, it means that there are either nests of many vessels or a strip of vessels several cells wide. Four of the studied species, are ring-porous and two are diffuse-porous.

3.4. Classification of Species with Radial and Diagonal Grouping of Vessels

From the studied species, those with radial and diagonal groups of vessels were also selected mainly based on visual analysis. Their mean value of C (µ/d) is also low (2.30). In order to determine to which subgroup (small, medium, or long radial chains) they belong, the range of values of the distances between the vessels must be examined.
Here the orientation of the minimum distances is in the radial direction. Long distances are oriented mainly tangentially, and often we have a chain of vessels only one cell wide. Two of the studied species are ring-porous, one is semi-ring-porous, six are diffuse-porous, and eight are tropical.

3.5. Classification of Species with Heterogeneous Groups of Vessels

This construction is the most diverse and is most difficult to classify the wood structure. It is characteristic of most tropical as well as vines and parasitic plants that do not form annual rings, such as the Viscum album [18]. To make the differentiation, the diameters of the vessels must be analyzed, as well as the orientation of the small and large distances between the vessels.
There are significant species whose vessels have a ratio of µ = d and µ < d, but also a large coefficient of variation of the diameter values (V > 15%). From the studied species, there is 1 ring-porous, 1 semi-ring-porous, 4 diffuse-porous, and 16 tropical.

3.6. Classification of Species with Diffuse Groups of Vessels

Here, we have the species that have paired or built vessels, as well as those that form loose, irregular structures, with a ratio of µ = 1.5 d and µ = d and µ < d. The orientation of the large diameter of the vessels is not always in the tangential direction. The main indicator is the value of the coefficient of variation, which is low (V < 15%). Two of the studied species are diffuse-porous and twelve are tropical. When creating a database that includes more than one species, this will probably be the largest group.

3.7. Classification of Species with Marginal Groups of Vessels

This includes species that do not have the classification feature for any reason or have a value that cannot assign them to any group. Many species have such a structure in their juvenile wood (the first 10–15 year old rings). This group will also include angiosperms that do not have vessels (they belong to genera of its families). Since we are talking about automatic recognition and analysis of wood vessels, this will include all deviations from the normal structure—corrugated stems [18].

4. Classification of Groups by Quantitative Indicators

4.1. Classification by Degrees of Homogeneity/Regularity

Each of the studied quantitative indicators (coefficients) was considered as an average value and coefficient of variation in the studied tree species. It has already been stated that they have been selected to provide full coverage of the huge variety of wood structures. In determining the classification groups, the value of the coefficient of variation and the elementary distribution of the measured values are of primary importance (Table 3).
When choosing the classification groups, we focused on three, given the initial stage of this type of research. According to the diameter of the vessels, the groups are homogeneous and inhomogeneous, and according to the distances between them and the values of the quantitative coefficients, they are regular and irregular. It should be noted that the group of inhomogeneous and irregular is divided into two, but with the accumulation of more species and more measurements, this division may increase.
It should be noted that there is often a discrepancy between the value classes (i.e., the distribution of values in the histogram) and the value of the coefficient of variation. In addition, the values of some quantitative indicators are distributed more collected and others more diffuse.

4.2. Usage of Quantitative Indicators to Identify Wood

In this part of the article, we will show our research aimed at the possibility of identifying tree species by quantitative indicators. For this purpose, we chose two types with very similar anatomical wood structure from each main standing structure.
From the ring-porous species, we will follow the values of the quantitative indicators of nettle and elm. These species have an identical anatomical structure and their recognition by classical methods is quite difficult given the changes that this wood acquires at different widths of annual rings. The average value of the diameter of the vessels is 118.9 µm for the nettle and 71.3 µm for the elm at a coefficient of variation of 70.0% and 73.4%, respectively.
The lower value of elm can be explained by the larger number of vessels in the latewood. Apart from the difference in the average values, the higher value of the coefficient of variation is also impressive. However, both species fall into the group of highly inhomogeneous in diameter. The average value of the distances between the vessels is 195.2 µm for the nettle and 115.6 µm for the elm at a coefficient of variation of 70.9% and 77.4%, respectively.
The trend is the same, but both species are again in the group of highly irregular distribution. The main difference in these species is in the value of coefficient A. In nettle it is 5.43, while in elm it reaches 49.4. No matter how much these values vary within the change in the width of the annual ring, the difference is significant. The coefficient of variation is almost identical in both species. Conversely, the other coefficients do not show a difference in values.
At coefficient B, the values are 1.01 for nettle and 0.94 for elm, respectively. Here, too, the coefficients of variation are very close. In addition, they are very tall and place both species in the group of highly irregular and inhomogeneous species according to these coefficients. Impressive is the much larger range of values of the studied quantitative coefficients.
From the diffuse-porous species, pear (Pyrus communis) and breccia (Sorbus torminalis) were selected for comparison. According to the value of the diameter of the vessels both types fall into the group of homogeneous vessels. The average value for pear vessels is 50.0 µm with a coefficient of variation of 20.8%. The average value for breccia is lower—37.4 µm, with a coefficient of variation almost half that of the pear vessels—11.32%.
Although they fall into one group on this anatomical indicator, these differences can be used in possible recognition. Both species are regular according to the distances between their vessels, but there are almost no differences. The average value for pear is 91.0 µm, while that of breccia is 73.2 µm. The coefficient of variation is identical for both types. Another difference is observed in the values of coefficient A.
For pears, it has an average value of 58.7, while for breccia this value is 93.0. It is noteworthy that the coefficient of variation for pears is higher (37.5%), while that of breccia is 24.4. Although the vessels of both species are regular and homogeneous in the indicator, in structures, these differences may also be useful for possible recognition.
For the other coefficients, there are no significant differences both in the average values and in the values of the coefficient of variation. According to them, both species fall into the group of regular and homogeneous structures. In these two types, the range of values of the studied quantitative indicators is slightly larger in the pear.
From the tropical species, two species of Terminalia were selected—Indian Laurel (T. elliptica) and Framire (T. ivorensis). The wood of these two species is homogeneous according to the diameter of the vessels. The mean value for T. elliptica is slightly higher at 283.6 µm, compared to 233.1 µm for T. ivorensis. The differences in the values of the coefficient of variation are negligible. The distances between the vessels in T. elliptica are slightly larger than those of T. ivorensis—566.0 µm and 474.0 µm, respectively.
In the first species, they are located a little more evenly, as the difference between the coefficient of variation is significant (17.0%) for T. elliptica and 28.2% for T. ivorensis. However, both species belong to the group of regular structures according to the distance
The average values of the studied coefficients do not differ much, and according to these indicators, both types are regular and homogeneous in their structures. The only exception is that T. ivorensis is a moderately irregular and inhomogeneous structure according to indicator D. In these two types, the range of values of the studied quantitative indicators is slightly larger in framire (T. ivorensis).

5. Conclusions

From the analysis of the data for the studied quantitative indicators, it is clear that the individual location and the location of the vessels in clusters and tangential groups can be defined mainly by the ratio between the value of the distances and their orientation. Located in a histogram, these values make it possible to classify tree species with a better vessel structure.
Quantitative estimates of coefficient C allow us to define the dendrites as a characteristic group of constructions, and not as an independent arrangement of the vessels. It is the analysis of the minimum distances (those in the groups) and the maximum ones that define the incorrect arrangement of the vessels as a separate construction structures.
The comparisons made between the species show that the indicated quantitative indicators cannot be used to identify a specific unknown tree species. However, they can be used successfully to compare it with other tree species according to the values of the studied coefficients.
For future work, the proposed method will be used as an input for computer vision algorithms, based on both supervised and unsupervised learning.

Author Contributions

Conceptualization: N.B. and V.T.; methodology, N.B. and V.T.; formal analysis, N.B., V.T. and N.C.; investigation, N.B. and N.C.; resources, N.B.; writing—original draft preparation, N.B., V.T. and N.C.; writing—review and editing, N.B., V.T. and N.C.; visualization, N.B. and N.C.; supervision, V.T. and N.C.; project administration, N.C. All authors have read and agreed to the published version of the manuscript.

Funding

This work was supported by the National Science Fund at the Ministry of Education and Science of the Republic of Bulgaria under project KP-06-M47/2 26 November 2020 “Geometric features extraction and classification of tree species in Bulgaria in order to protect the environment, part of NATURA 2000”.

Institutional Review Board Statement

Not applicable.

Informed Consent Statement

Not applicable.

Data Availability Statement

Publicly available datasets were analyzed in this study. This data can be found here: https://www.delta-intkey.com/wood/en/index.htm (accessed on 4 January 2022).

Conflicts of Interest

The authors declare no conflict of interest.

References

  1. Wagenführ, R. Anatomy of Wood; VEB Fachbuchverlag: Leipzig, Germany, 1984; pp. 78–173. [Google Scholar]
  2. Ugolev, B.N. Wood Science; ACADEMIA: Moscow, Russia, 2006; pp. 65–83. [Google Scholar]
  3. Enchev, E. Wood Science, Textbook; Publishing House of Zemizdat: Sofia, Bulgaria, 1984; pp. 28–54. [Google Scholar]
  4. Baas, P. Terminology of imperforate tracheary elements in defence of ubriform fibres with minutely bordered pits. IAWA Bull. 1986, 7, 82–86. [Google Scholar] [CrossRef]
  5. Wagenführ, R.; Scheiber, C. Atlas of Wood; Springer: Berlin, Germany, 1996; pp. 42–56. [Google Scholar]
  6. Hafemann, L.G.; Oliveira, L.S.; Cavalin, P. Forest species recognition using deep convolutional neural networks. In Proceedings of the 2014 22nd International Conference on Pattern Recognition, Stockholm, Sweden, 24–28 August 2014; pp. 1103–1107. [Google Scholar]
  7. Kwon, O.; Lee, H.G.; Lee, M.-R.; Jang, S.; Yang, S.-Y.; Park, S.-Y.; Choi, I.-G.; Yeo, H. Automatic Wood Species Identification of Korean Softwood Based on Convolutional Neural Networks. J. Korean Wood Sci. Technol. 2017, 45, 797–808. [Google Scholar] [CrossRef]
  8. Souza, D.V.; Santos, J.X.; Vieira, H.C.; Naide, T.L.; Nisgoski, S.; Oliveira, L.E.S. An automatic recognition system of Brazilian flora species based on textural features of macroscopic images of wood. Wood Sci. Technol. 2020, 54, 1065–1090. [Google Scholar] [CrossRef]
  9. da Silva, N.R.; De Ridder, M.; Baetens, J.M.; Van den Bulcke, J.; Rousseau, M.; Bruno, O.M.; Beeckman, H.; De Baets, B. Automated classification of wood transverse cross-section micro-imagery from 77 commercial Central-African timber species. Ann. For. Sci. 2017, 74, 30. [Google Scholar] [CrossRef]
  10. de Andrade, B.G.; Basso, V.M.; de Figueiredo Latorraca, J.V. Machine vision for field-level wood identification. IAWA J. 2020, 41, 681–698. [Google Scholar] [CrossRef]
  11. Zhao, P.; Wang, C.K. Hardwood Species Classification with Hyperspectral Microscopic Images. J. Spectrosc. 2019, 2019, 2039453. [Google Scholar] [CrossRef]
  12. Ravindran, P.; Owens, F.C.; Wade, A.C.; Vega, P.; Muro, R.M.; Shmulsky, R.; Wiedenhoeft, A.C. Field-deployable computer vision wood identification of Peruvian timbers. Front. Plant Sci. 2021, 12, 940. [Google Scholar] [CrossRef] [PubMed]
  13. He, T.; Jiao, L.; Wiedenhoeft, A.C.; Yin, Y. Machine learning approaches outperform distance-and tree-based methods for DNA barcoding of Pterocarpus wood. Planta 2019, 249, 1617–1625. [Google Scholar] [CrossRef] [PubMed]
  14. Richter, H.G.; Dallwitz, M.J. Commercial Timbers: Descriptions, Illustrations, Identification, and Information Retrieval. Available online: https://www.delta-intkey.com/wood/index.htm (accessed on 10 December 2021).
  15. Benkova, V.E.; Schweingruber, F.H. Anatomy of Russian Woods; Haupt Verlag: Bern, Austria, 2004; pp. 17–48. [Google Scholar]
  16. Schweingruber, F.H.; Crivellaro, A. Stem Anatomical Features of Dicotyledons. Xylem, Phloem, Cortex and Periderm Characteristics for Ecological and Taxonomical Analysis; Dr. Kessel: Remagen, Germany, 2015; p. 37. Available online: https://www.forstbuch.de/wp-content/uploads/2018/04/SchweingruberCrivellaroWEB.pdf (accessed on 10 December 2021).
  17. Schweingruber, F.H.; Börner, A. The Plant Stem. A Microscopic Aspect; Springer Nature: Cham, Switzerland, 2018; pp. 23–65. [Google Scholar]
  18. Alfonso, V.A.; Baas, P.; Carlquist, S.; Chimelo, J.P.; Rauber Coradin, V.T.; Détienne, P.; Gasson, P.; Grosser, D.; Ilic, J.; Kuroda, K.; et al. IAWA list of microscopic features for hardwood identification, with an Appendix on non-anatomical information. IAWA Bull. 1989, 10, 219–332. [Google Scholar] [CrossRef]
Figure 1. Examples of solitary arrangement vessels in some structure groups. (a) single lateral vessels in ring-porous (ash); (b) numerous small vessels in the diffuse-porous species (pear); (c) few large vessels in the tropics (sapeli).
Sustainability 14 02031 g001
Figure 2. Scheme of a grouped arrangement of vessels: (a) in clusters; (b) in short tangential chains; (c) in long tangential tapes.
Sustainability 14 02031 g002
Figure 3. Diagram of radial and diagonal arrangement of the vessels: (a) in strictly radial groups: (1) in short radial groups, (2) in middle radial groups, (3) in long radial groups (due to lack of space, groups 1 to 3 are represented by only one chain); (b) diagonal arrangement; (c) dendrites.
Sustainability 14 02031 g003
Figure 4. Scheme of a heterogeneous arrangement of vessels: (a) in radial groups; (b) mixed location; (c) sockets with mechanical cells.
Sustainability 14 02031 g004
Table 1. Recent methods for wood classification.
AuthorDatabaseFeatures ExtractionClassification
Hafemann et al. [6]2 Brazilian forest species datasets No preliminary feature extraction.CNN
Kwon et al. [7]5 Korean softwood speciesNo preliminary feature extraction.CNN
da Silva [9]77 commercial timber species from the Democratic Republic of CongoLPQ and LBPLDA and PCA
Souza et al. [8]1901 macroscopic images of wood from 46 Brazilian speciesConcatenation of rotation-invariant LBP histogramsSVM
de Andrade [10]21 species, 2000 macroscopic imagesGray level co-occurrence matrixSVM
Zhao and Wang [11]6 hardwood species were studied, where 1440 wood samples are preparedMathematical morphological operation and K-L divergencePCA, KPCA, and MDS, and the three classifiers BP neural network, SVM, and MD are combined for the classification task
Table 2. The wood from 76 species used for the study [14].
1European ash Fraxinus excelsior L.39Makore Tieghemella heckelii (A.Chev.)
2White mulberry Morus alba L.40Ako Antiaris africana Engl.
3Black locust Robinia pseudoacacia L. 41Iroko Chlorophora excelsa (Welw.) C.C.Berg
4Honey locust Gleditsia triacanthos L.42Dibetu Lovoa; trichilioides Harms.
5Field elm Ulmus campestris Mill.43Koto Pterygota macrocarpa K.Schum.
6Common (European) oak Quercus robur L.44Eyong Sterculia oblonga Mast.
7Sweet chestnut Castanea sativa Mill.45Avodire Turraeanthus africana Welw. ex C. DC.
8Common beech Fagus sylvatica L.46Emien Alstonia congensis De Wild.
9Sycamore Acer pseudoplatanus L.47Ramin Gonystylus bancanus (Miq.) Kurz.
10Black alder Alnus glutinosa (L.) Britton48Balsa Ochroma lagopus Cav. ex Lam.
11Common hornbeam Carpinus betulus L.49Ilomba Pycnanthus angolensis (Welw.) Warb.
12Common hazel Corylus avellana L.50Limba Terminalia superba Engl. & Diels
13Common aspen Populus tremula L.51Obeche Triplochiton scleroxylon K.Schum.
14White willow Salix alba L.52Duse Afzelia bipindensis Harms
15Small-leaved linden Tilia cordata Mill.53Mukulungu Autranella congolensis (De Wild.) A.Chev.
16Horse chestnut Aesculus hippocastanum L.54Pernambouc Caesalpinia echinata Lam
17Silver birch Betula pendula (Regel)55Brazilian rosewood Dalbergia nigra Allem. ex Benth.,
18Common pear Pyrus communis L.56Macassar Ebony Diospyros celebica Bakh.
19Rowan Sorbus aucuparia L.57Lignum vitae Guaiacum officinale L.
20Wild service tree Sorbus torminalis (L.) Crantz58Bubinga Guibourtia tessmannii (Harms) J.Leonard
21Persian silk tree Albizia julibrissin Durazz.59Mansonia Mansonia altissima A.Chev.
22Pecan (Hickory) Carya pecan (Marshall) Nutt.60Wenge Millettia laurentii De Wild.
23Persian walnut Juglans regia L.61Wild cashew Anacardium excelsum (Bertero & Balb. ex Kunth) Skeels
24Empress tree Paulownia tomentosa (Thunb.) Steud.62Verawood Bulnesia arborea (Jacq.) Engl.
25Teac Tectona grandis L.f.63Guanandi Calophyllum brasiliense Cambess.
26Wild cherry Prunus avium L.64Lemonwood Calycophyllum multiflorum Griseb.
27European buckthorn Rhamnus cathartica L.65Faro Daniellia ogea (Harms) Rolfe ex Holland
28Okoumé Aucoumea klaineana Pierre66Indian laurel Terminalia elliptica Willd.
29Sapelli Entandrophragma cylindricum Sprague67Angelim Hymenolobium petraeum Ducke
30Sipo Entandrophragma utile Sprague68Silky Oak Grevillea robusta A.Cunn. ex R.Br.
31Karri Eucalyptus diversicolor F.Muell.69Boa Gambeya beguei Aubrév. & Pellegr.
32Kotibe Nesogordonia papaverifera (A.Chev.) Capuron ex N.Hallé70Slender Tea-tree Brevia leptospermum L.
33African mahogany Khaya ivorensis A.Chev.71Alcornoque (Sapupira) Bowdichia sp (Tul.) Ducke
34Honduras mahogany Swietenia macrophylla King72Afzelia Afzelia africana Sm. ex Pers.
35Krabac (Mersava) Anisoptera cochinchinensis Pierre73Honey Bee Tree Koompassia excelsa (Becc.) Taub.
36Dabema Piptadeniastrum africanum (Hook.f.) Brenan74Framire Terminalia ivorensis A.Chev.
37African padauk Pterocarpus soyauxii Taub.75Red lauan (Nemesu) Shorea pauciflora King
38Dark-red meranti Shorea polysperma (Blanco) Merr.76Ocotea Ocotea puberula (Rich.) Nees
Table 3. Regular and irregular (homogeneous and inhomogeneous) structures for a given indicator.
Degree of Homogeneity/RegularityIndicator (Value Classes; Var. Coefficient; Number of Species; Share)
Diameter
d, µm
Distances
v, µm
Indicator
A
Indicator
B
Indicator
C
Indicator
D
Homogeneous and regular2; <15%; 34; 44.7%<10; <30%; 22; 28.9% <3; <60%; 28; 36.8% <3; <30%; 37; 48.7% <5; <40%; 18; 23.7% <7; <30%; 13; 17.1%
Moderately inhomogeneous and irregular3–4; 16–24%;
29; 38.2%
10–16; 31–49%;
33; 43.4%
3–6; 61–79%;
23; 30.3%
3–6; 31–39%;
23; 30.3%
5–6; 41–49%;
31; 40.8%
7–9; 31–69%;
39; 51.3%
Highly inhomogeneous and irregular>4; >25%
13; 17.1%
>16; >50%
21; 27.6%
>6; >80%
25; 32.9%
>6; >40%
16; 21.1%
>6; >50%
27; 35.5%
>9; >70%
24; 31.6%
Publisher’s Note: MDPI stays neutral with regard to jurisdictional claims in published maps and institutional affiliations.

