Abstract
The need to identify wood by its anatomical features requires a detailed analysis of all the elements that make it up. This is a significant problem of structural wood science, the most general and complete solution of which is yet to be sought. In recent years, increasing attention has been paid to the use of computer vision methods to automate processes such as the detection, identification, and classification of different tissues and different tree species. The more successful use of these methods in wood anatomy requires a more precise and comprehensive definition of the anatomical elements, according to their geometric and topological characteristics. In this article, we conduct a detailed analysis of the limits of variation of the location and grouping of vessels in the observed microscopic samples. The present development offers criteria and quantitative indicators for defining the terms shape, location, and group of wood tissues. It is proposed to differentiate the quantitative indicators of the vessels depending on their geometric and topological characteristics. Thus, with the help of computer vision technics, it will be possible to establish topological characteristics of wood vessels, the extraction of which would be used to develop an algorithm for the automatic classification of tree species.
1. Introduction
Wood consists mainly of three types of tissue—vascular, mechanical, and reserve parenchyma. Their ratio and location are genetically set, and they serve to perform their physiological and mechanical functions in the stem [1,2,3,4,5]. The identification of the individual tree species is performed based on persistently repeating geometric shapes and groups that are characteristic for each species observed in the longitudinal and transverse section of the stem. For example, the location and quantitative ratio of vascular cells (vessels) are genetically pledged and determine the affiliation of species to the main groups of wood structure. It depends on many factors, but mostly on environmental conditions, the position of these tissues in the stem, the size and age of the stem, and more [1,2,3,4,5].
It was found that with increasing latitude there is a decrease in the size of the cellular elements in the wood. The vessels become shorter, narrower, increase in their density, the fibers are sometimes narrower, and the rays lower. Spiral thickenings appear on the walls of the vessels. Increasing altitude has similar but much weaker effects [6,7].
The size of individuals also affects the size of the vessels. Large trees rarely have pots with a diameter of about 50 (30) µm. The vessels most often have a diameter of 70 to 200 µm. Large trees are also the only ones that have vessels with a diameter greater than 200 µm. Conversely, small trees and especially shrubs have vessels whose diameter is 50–100 µm, or usually 50 µm [8].
The location of the vessels is predetermined in the cambial layer during the formation of the wood and by strong changes in the height of the stem [9]. It is believed that the overall increase in the size of the vessels and the decrease in their density from the leaves to the roots is due to the decreasing concentration of auxins [10]. However, the general opinion is that their distribution is not accidental and that it obeys essential, sustainable, and recurring patterns in plant development [11,12]. As a result, the spatial distribution of vessels often involves the presence of tracheids so that a parallel set of mechanical adaptations is periodically achieved simultaneously. These models have different distributions in monocotyledonous and dicotyledonous plants. In a study of many species, some results show that the increased presence of tracheids appears to reduce the tendency of vessels to cluster [13,14].
At the same time, vasicentric tracheids have been found to define a wide variety of strategies for grouping vessels to counteract cavitation [15]. The quantification of the optimal number of vessels is given by various mathematical models. It is assumed that there are different ways to optimize the number of vessels, depending on both the tree species and the environmental conditions [16].
A new field of research in wood science, in the field of machine learning, called computer-vision-based wood identification is progressing steadily towards the development of automated wood identification. It is currently just a minor topic in wood science and many wood anatomists are still inexperienced [17]. The majority of research has been on texture analysis techniques such as local binary pattern (LBP) or local phase quantization (LPQ) [18]. Additional authors suggest multidimensional texture analysis [19], wood texture grouping by a fuzzy logic [20], or histogram of oriented gradient (HOG) feature and support vector machine (SVM) [21]. Different types of neural networks have been examined to find out whether two species are very likely to be biometrically distinguished from their anatomy [22]. Deep learning architectures, such as Convolutional Neural Networks [23] and ResNet50 [24], have also been utilized.
The present study aims to determine some general characteristics of the shape and location of the vessels, which give grounds for their geometric and topological classification. These classifications are based on measurable quantitative indicators of the vessels, determining more precisely their shape, size, and location and defining the limits of variation of these indicators in the wood for the main anatomical patterns. In addition, the proposed classification could be useful for quantitative wood anatomy studies such as comparison of clones, differentiating growing patterns, and cell aggregations. They can also be used in algorithms aimed at the elaboration of image analysis. The purpose is to obtain information with a small quantity (the size, not for the number of entries) of input information to give quality (descriptive) anatomical pattern information. The obtained results will be highly informative entries for the construction of machine learning architectures.
2. Methods and Materials
2.1. Classification of Vessels According to Their Geometric Shape: Geometry Classes of Vessels
Despite the huge variety of deciduous tree species, the cross-sectional shape of the vessels do not differ much. From a geometric point of view, the vessels can be divided into three groups (Figure 1). In the first group, the shape can be likened to a circle or figure in which every two diameters are approximately equal, i. d1 = d2 (Figure 1a). In the second group of vessels, the shape can be defined as an ellipse, with the two mutually perpendicular diameters being different, most often as d2 > d1, with d2 most often oriented in the radial direction (Figure 1b). The shape of the third group of vessels can be defined as irregular or rounded-polygonal (“star” type). Here, more than two diameters will be needed to determine some generally accepted average quantitative parameters of the vessels, such as diameter, area, and the coordinates of the centroid of the vessel (Figure 1c) [3,13]. Each of these three classes of the geometric classification of vessels is a geometric primitive.
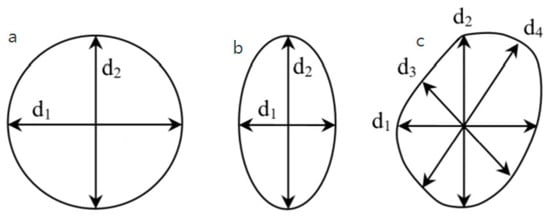
Figure 1.
Cross-sectional shapes of vessels (geometric primitives): (a) round; (b) ellipse; (c) star.
There are four diameters measured: radial, tangential, and two diagonals. Their lengths are measured and compared. If the differences are statistically insignificant, it is sufficient to say that the vessel is class A or a circle. If at least three of the diameter differences are greater than the quantitative criterion chosen above (see Figure 1c), the vessel is classified as class C or a star. If the difference between d1 and d2 is statistically significant, and the difference between d3 and d4 is statistically insignificant (see Figure 1b), then the vessel is class B or ellipse.
The indicators significantly depend on the geometric shape of the vessels and will largely depend on their belonging to one of the geometric primitives defined above. For example, vessel diameter is usually understood as the size of the vessel cavity in the tangential direction [15].
The shape of the vessels may depend on the tree species, its location in the annual ring, or its location in the group, if any (Figure 2) [6,7]. However, it is possible to determine not only the diameter and shape of the vessel but also the orientation of its large diameter [25].
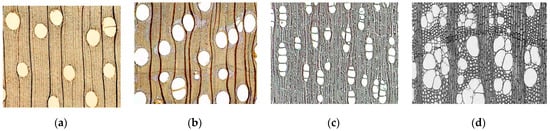
Figure 2.
Cross-sectional shapes of vessels depending on the tree species and grouping. (a) round in limba (Terminalia rubiginosa); (b) ellipse in dabema (Piptadeniastrum africanum); (c) star in aniegr (Aningeria robusta) and (d) ivy (Hedera helix) [26].
This indicator is determined by several statistical characteristics, such as the average of the diameter and variance of the diameters of the individual vessels, as well as the span—the difference between the diameter of the smallest and largest vessel in the group of measured cells. To determine the affiliation of the vessels to one of the three primitives, the average diameter is calculated as follows:
where:
- di—measured diameters of the vessel, as i varies from 1 to 4;
- d1—the diameter in the tangential direction, in µm;
- d2—the diameter in the radial direction, in µm;
- d3, d4—diameters located below 45° degrees relative to the tangential and radial directions, in µm.
The geometric classification of the vessels made here is conditional from the point of view of the manner and clarity of their determination. However, it is essential for the biological conditionality of the shape of the vessels from the characteristics of the species composition and the peculiarities of the global habitat of the plants. Furthermore, it is one of the necessary conditions for the successful application of computer vision methods to automate the activities of accurate recognition of vessel’s form.
2.2. The Classification of Vessels According to Their Mutual Position (Arrangement)
2.2.1. Density Arrangement Classes of Vessels
When considering the location of the vessels, various indicators can be defined to determine their place in the tiny, microscopic sample, subject to a single measurement of the vessels. Yet, the density of the vessels has most often been determined using the indicator number of cells per unit area (δ = number/mm2) [2].
This approach is not appropriate in cases where the individual zones in the annual ring are examined or the microscopic sample is not complete (i.e., there is a rupture of the slide). For example, this indicator is difficult to determine concerning vessels in the early wood of ring-porous tree species. In the present study, we propose a solution to this problem by calculating the density based on a defined distance between cells (µ, μm).
Here, however, these distances are related to the size of the vessel diameters (Figure 3). It can be assumed that the presence of one or another quantitative and qualitative relationship would define the species or would serve to distinguish two or more species. This quantitative indicator has the following statistical characteristics: average, standard deviation, and limit values.
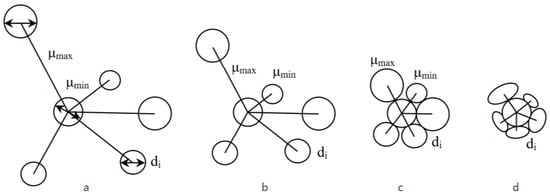
Figure 3.
Scheme of the classes of mutual arrangement of the vessels depending on their density, represented by the distance/diameter ratio; (a) µmean > dav; (b) µmean ≈ 2dav; (c) µmean ≈ dav; (d) µmean < dav (The arrows indicate the specified diameter di).
The distance between the vessels in relation to their diameter is now used to determine the individual classes. Four main density classes are defined, where every two or more adjacent vessels belong to one and only one density class. However, in the wood of a species, there may be more than one class of arrangement of vessels. Density arrangement class can be distinguished as follows:
Class A: the average distance between the vessels is greater than three times their average diameter (Figure 3a).
µmean > 3.dav
Class B: the average distance between the vessels is about twice their average diameter (Figure 3b):
µmean ≈ 2.dav
Class C: the average distance between the vessels is equal to their average diameter (Figure 3c), i.e., they touch at one point.
µmean ≈ dav
Class D: the average distance between the vessels is less than their average diameter (Figure 3d), i.e., they touch in a line and are irregularly deformed.
µmean < dav
As shown in Figure 2, in class A, the relative position of the vessels is characteristic of the wood of tropical species, which have a low density of vessels (Figure 3a). Class B occurs in most diffuse-porous species—beech, maple, poplar (Figure 3b). Class C, where the contacts between the vessels are at one point, occurs in the early vessels of the ring-porous ash (Figure 3c). Contacts with a whole wall (which is double) are observed in some species—mulberry, robinia (Figure 3d)—both as clusters and in a strictly radial or tangential arrangement of vessels.
The present group of vessels is considered as a structure in which the vessels are in contact with each other at a point or with a part of the wall [2]. Figure 4 shows a typical arrangement of the vessels, as the most common ratio between the distances and diameters of the vessels (µ/d) is exactly 1.5. For the groups with contact vessels, this ratio will be 1.0. However, some species form a characteristic pattern even when the vessels are at a certain distance. Therefore, quantitatively, the term group of vessels located close to each other is defined by any set of vessels spaced less than 1.5 times their diameter (µ < 1.5d). In automatic detection algorithms, the same element can be detected several times, with slight variations in coordinates and size. This condition will be used to distinguish between individual vessels and eliminate repetitions, taking into account the arrangement in the class.
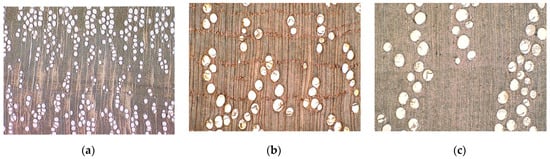
Figure 4.
Examples of species forming a characteristic morphology without contact between vessels. (a) Bulnesia arborea; (b) Calophyllum brasiliense; (c) Castanopsis malayana [26].
2.2.2. Orientation Arrangement Classes of Vessels
When considering the above-mentioned groups of vessels, it is possible to study their spatial orientation in relation to the neighboring vessels (Figure 5). For example, when each cell is in contact with two and only two adjacent ones, it is possible to classify them according to their orientation as follows:
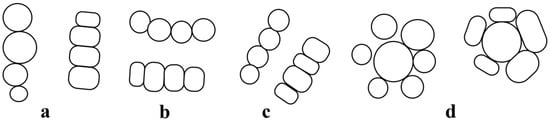
Figure 5.
Distribution of the vessels depending on their orientation and the number of their contact walls. (a) radial groups; (b) tangential groups; (c) diagonal groups; (d) clusters. Of the shown structures, the ratio µ/d is 1.0 and 0.8.
- -
- Radial Orientation Class. Includes all vessels that are in contact with or close to their tangential walls (Figure 5a).
- -
- Tangential Orientation Class. It is defined by all cells that are in contact with or close to their radial walls (Figure 5b).
- -
- Diagonal Orientation Class. In the third group, there is mixed contact with both radial and tangential walls. If the vessels are arranged in a chain, the groups are defined as diagonal (Figure 5c).
In cases where the vessels are in contact with more than two adjacent cells, they should be considered as a cluster (Figure 5d), coinciding with classes c and d shown in Figure 3. In each of these groups (with a ratio µ/d of 1.5, 1.0 and 0.8), the orientation of the large diameter of the vessels will be different.
2.3. Quantitative Indicators Used in the Analysis of the Relative Position of the Vessels
The location of the vessels depending on the relationship between the diameters of the cell cavities and the distance between them have recently been considered. To further distinguish the individual variants shown in Figure 3, we offer a few summary indicators. Using the techniques of computer vision and computer processing, they will be calculated very quickly and accurately. In previous methods of measuring vessels, most of them are impossible to calculate.
The first indicator “A” is called the distribution coefficient of vessels. It connects the diameter and distance of the studied cells with the density of the vessels. It can be expressed by the formula:
where:
- —the average diameter of the two measured vessels, in µm;
- µi—the distance between the centers of the two measured vessels, in µm;
- δ—density of vessels in the sample, number/mm2.
When studying the location and average diameters of the vessels in the main wood structures (ring-porous, diffuse-porous, etc.), it can be assumed that the specified coefficient will be an effective quantitative indicator for determining the affiliation of a tree species to the corresponding group shown in Figure 5.
Thus, for the structures of vessels located close to each other (case 1) A = 2.0, when the vessels touch at one point (case 2) A = 3.0, and when the vessels are flattened and bordering a whole wall (case 3) A = 3.75. If the vessels are spaced apart (µ/d > 3.0), A will be less than 1.0. The variation of A within the annual ring will also be an indicator of the peculiarities of the wood structure and can be used as a classifier.
The second indicator “B” is called the coefficient of the influence of the side. It connects the diameter and the distance of the examined cells with the total area of the vessels as follows:
where:
- S—the total area of the vessels in the tiny, microscopic samples, in µm2 (The most commonly used magnification is 25 to 32×).
Since the total area of the vessels depends more on the environmental conditions than on the tree species, with this indicator, we aim to express the influence of these conditions on the structure of the wood. It can also be used as a classifier, as for the structures of vessels located close to each other (case 1) B = 1.06. When the vessels touch at one point (case 2) B = 0.85 and when the vessels are flattened and adjacent to a whole wall (case 3) B = 0.76. When the vessels are spaced apart (µ/d > 3.0) B will be less than 1.70.
The third (concentration coefficient), “C”, represents the ratio of the distance between the two cells studied (µι) to the average diameter of these cells ():
When C < 1, we have a cluster or group in which the cells are flattened and bordered by a whole wall (density arrangement class D, Figure 3d). In C ≈ 1.0 they contact only at one point (density arrangement class C, Figure 3c). At C 1.5, the vessels are closely spaced so that they can form a recognizable texture. At C ≈ 2.0, the vessels are spaced far enough apart so that they can be defined as solitary (density arrangement class B, Figure 3b).
Due to the great variety of wood structures, the first main case of vessel arrangement can be divided into subclasses where C ≈ 3.0; 4.0; 5.0; etc. (density arrangement class A, Figure 3a).
The fourth (coefficient of diffusion), “D”, is reciprocal to the previous one. It represents the ratio of the average diameter between two measured cells () to the distance between them (µι):
Thus, for the structures of vessels located close to each other (case 1) D = 0.667, when the vessels touch at one point (case 2) D = 1.0, when the vessels are flattened and adjacent to a whole wall (case 3) D = 1.25, and when the vessels are spaced apart (µ/d > 3.0) D will be less than 0.333.
If these indicators are calculated for a series of vessels located in a radial strip, this will allow the variation of their values to be traced within the annual ring. This would help in determining the growth zones of tropical tree species. These indicators can also be used in the study of the wood of coniferous tree species. It should be noted that there the arrangement is only class D, as the tracheids are located close to each other.
For the three indicators, the average of all measured cells, the standard deviation of these values, and the range (i.e., the difference between the maximum and minimum value) are determined. The values of these indicators can be used in the comparison of tree species but can also be considered as histograms. For example, in the species shown in Figure 4, it will be dominated by C = 1.5, while in these species with many grouped vessels, values of C = 1.0 will prevail.
2.4. Methodology of Experimental Research
There are 76 species included in this study. Richter and Dallwitz [26] cite the data used in this study for these species, as well as the figures used in this text (Figure 2 and Figure 4). We use only cross-sectional data with the same scale as in the cited source, and it is indicated by a marker in the proposed figure. The selected species are specific representatives of the groups in the new classification under discussion. The diagrams show the distributions of the values of the studied indicators. Therefore, when presenting the results, only one circular-porous species, one scattered-porous species, and one species with tropical wood were selected. The density of the vessels, the average diameter, and the distances between them are determined. The total area of the vessels is calculated, as well as the coefficients proposed in this study.
The most distinctive part of the sample must be taken when determining the measuring vessels. The closest 2–3 cells are selected. The cells to be studied are chosen in the following manner: a section descends in a radial direction forward from the center of the chosen (called the first). The vessels listed below are ordered clockwise and 3–5 vessels are selected. Their diameters and the distance to the first cell are determined. The next one is chosen again in the radial direction, i.e., in the direction of the tree growth, etc. The distances between them are always graded as minimum µmin, maximum µmax, and intermediate µav. The distances between the centers of adjacent vessels are calculated as Cartesian:
where:
- µmax—the maximum distance between the centers of the vessels, in µm;
- µmin—the minimum distance between the centers of the vessels, in µm;
- µmean—the intermediate distance between the centers of the vessels, in µm;
- n—the number of distances ranging from 2 to 3.
3. Results and Discussion
3.1. By Quantitative Indicators
3.1.1. Diameter of Vessels
This quantitative indicator varies significantly in the individual main wood structures. In some of them (e.g., the ring-porous ones) these differences are the main characteristic. There are also significant differences between species. In the diffuse-porous species it is the smallest—the average value is 62.3 µm—while in the tropical species, it is 184.3 µm.
For ring-porous species, it is 124.4 µm, but here the averaging is quite conditional. An important statistical characteristic is the standard deviation of these values. The biological meaning of dispersion is that the lower it is, the closer the vessels are in diameter and vice versa. For ring-porous dispersion, it is 31.1 µm with a range of 96.1 µm. In the case of diffuse-porous species, the value of the dispersion is 19.8 µm with a span of 67.7 µm. In the tropical tree species, its value is 66.7 µm with a range of 269.0 µm. It should be noted that these are average values of the main wood structures. Half of the diffuse-porous species have dispersion values of 2 to 5 µm. For tropical species, the basic values are from 20 to 40 (60) µm.
Statistical indicators cannot describe the location of the vessels, but the distribution of diameters in a general range can show many of the characteristics of this quantitative indicator (Figure 6a). While in ash there is a characteristic bimodal distribution of large (early) and small (late) vessels, in beech there are diameters collected in a narrow range and up to 90 to 100 µm. In the tropics, this range is much wider and shifted to larger diameters.
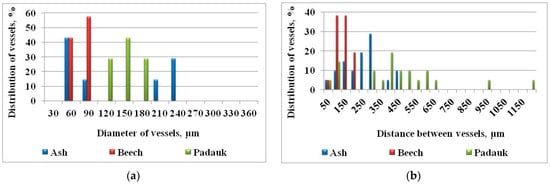
Figure 6.
Distribution of vessels in ash (Fraxinus, ring-porous), beech (Fagus, diffuse-porous), and padauk (Pterocarpus, tropical): (a) with different diameters and (b) with different distances.
3.1.2. Distance between Vessels
This quantitative indicator also varies considerably with the individual main wood structures. The differences between the species are even more characteristic. In the diffuse-porous species it is the smallest, the average value is 136.6 µm, while in the tropical species, it is 538.5 µm. The ring-porous ones are somewhere in the middle with an average value of 209.6 µm. Here, the standard deviation of these values is also very important.
The lower it is, the more evenly spaced the vessels and vice versa. In the case of diffuse-porous species, the value of the dispersion is 59.5 µm with a range of 209.8 µm. In the tropical species, its value is 265.5 µm with a range of 1399.6 µm. Here, the largest values reach 1500 µm, i.e., from which it can be seen that it is indeed possible for the existence of species that in certain areas of one square millimeter to be absent in the presence of vessels.
To show the peculiarities of this quantitative indicator, we chose the same tree species (Figure 6b). The figure shows how the beech is collected in a narrow range, with small values. In ash, the small distances are in the vessels of the early wood, while the vessels in the late wood are separated at greater distances from each other. In padauk, the histogram can be divided into three ranges (Figure 6b). In the middle is the main group of vessels, but some are separated from the rest at considerable distances. The presence of all three tree species at distances of about 50 µm indicates that these are most likely paired vessels.
Due to the biological peculiarities in the formation of wood, in further research, an analysis of the orientation of the large and small distances between the vessels can be made.
3.1.3. Coefficient of Distribution A
This is one of the quantitative indicators that give us reason to separate tropical species into a separate basic wood structure. While the values of ring-porous and diffuse-porous differ by about two times (A = 12.6 and A = 33.0, respectively), the difference between tropical species is about 100 times in respect to both the previous ones (Figure 7a). The greatest value here is the mansonia, which slightly resembles the diffuse-porous ones, but with its A = 2.49. The smallest value in the diffuse-porous species is in the hornbeam (A = 6.38).
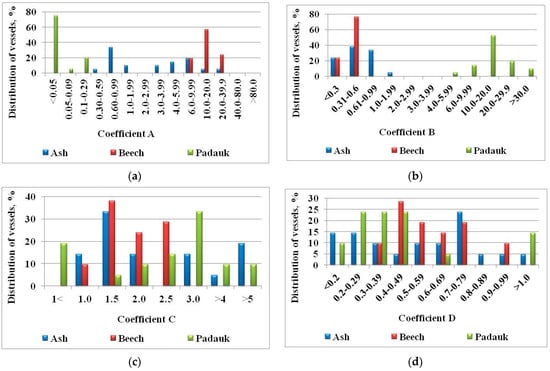
Figure 7.
Distribution of vessels for ash, beech, and padauk: (a) with different values of the coefficient A. Distance between vessels, µm. Distribution of vessels, %; (b) with different values of the coefficient B; (c) with different values of the coefficient C (µ/d); (d) with different values of the coefficient D.
Standard deviation is not so important here, but it is noteworthy that in ring-porous and tropical species it is numerically larger than the arithmetic mean. Such species are elm, chestnut, limba, and obeche.
3.1.4. Coefficient of Site B
At this ratio, the differences between the species growing in the temperate zone and the tropics are also significant. There are also differences between the main wood structures. In the case of ring-porous species, the average value of B is 1.05, while in the case of diffuse-porous species it is almost twice less at 0.58. In the tropical species, this value is significantly higher at 7.25.
The distribution of values in the tree species shows some of the characteristics of the main wood structures. In the case of the diffuse-porous ones, as a rule, it is concentrated in a narrow range to the small values, while in the tropical ones they are located wider and at higher values, and there are no values higher than 30 (Figure 7b).
3.1.5. Coefficient of Concentration C
This is one of the main indicators used in the classification of species. Although the values of the individual construction structures are close, their distribution is important and carries a lot of diagnostic information (Figure 7c). After analyzing the results of all studied species, the group of vessels located at large distances (µ > 3d) is divided into three—µ = 3d, µ = 4d, and µ > 5d.
We add two more: µ = 1.5d and µ = 2.5d. Although it is possible to calculate this coefficient within the annual ring, it is important to note that it eliminates the difference between early and late wood. If the automatic recognition of the vessels makes it possible to follow the measured vessels in the radial direction, it will be possible to trace the change of the values in the early and late wood.
Figure 7c shows values at which the distance is equal to or less than the diameter of both early and late wood vessels. It can be seen from the figure that the vessels of beech are relatively evenly distributed, both at the beginning and the end of the ring. In ash, the low values are probably for the vessels in the early wood, while the high values are for the vessels in the late wood.
In padauk, there are values in almost the entire possible range. The average value for this coefficient for ash is 2.9 (as a total for ring-porous species, it is 1.96). It is very close to that of the padauk whose coefficient 3.03 (the average for the tropics is 2.97). However, the comparison and classification of species follow the sequence of these coefficients (from 4.1.1 to 4.1.5) and there can be no confusion between these two species. The value of this coefficient for beech is 1.84, with an average value for scattered-porous of 2.23.
3.1.6. Coefficient of Diffusion D
The coefficient D is reciprocal to C, and the distribution of values is more important than their average value (Figure 7d). The average values of the main wood structures are close and do not carry the information necessary for the classification of the species. For ring-porous species, the average value is 0.68, for diffuse-porous species it is 0.57, and for tropical species, 0.48. Here, too, the standard deviation makes little biological sense. In total, for most species, the values of this indicator are scattered throughout the range. They are more useful for comparing individual species than for distinguishing main wood structures.
3.2. According to the Main Wood Structures
3.2.1. Ring-Porous Tree Species
This wood is characterized by a clear division of early-large and late-small vessels. The obtained average value for the density of the vessels is 35 mm2. The lowest values are obtained for Robinia (8 mm2), and the highest for Elm, Ulmus (55 mm2). The obtained average value for the diameter of the vessels is 124.4 µm.
In these species, this averaging is most conditional due to the large difference in vessel diameter in early and late wood. That is why histograms are especially useful here, showing the actual distribution of values. The obtained average value for the distances between the vessels is 209.6 µm, the lowest being in Ulmus (115.6 µm) and the highest in Robinia (319.2 µm).
These two wood species determine the limits of variation of most indicators. With this main wood structure, it is important to study the orientation of the large and small distances between the vessels. The small ones will be inside the groups, and the big distances are those between the groups. For example, in Ulmus, the large ones will be oriented mainly radially, while in Quercus, they will be oriented mainly tangentially. The average value of coefficient A is 12.6 and of the coefficient B, 1.05. The values of the coefficients C and D are 1.96 and 0.68, respectively.
3.2.2. Diffuse-Porous Tree Species
Diffuse-porous wood is made up of numerous small vessels. The obtained average value for the density of the vessels is 138 mm2. The lowest values are obtained for Hornbeam, Carpinus (80 mm2) and the highest for Pear, Pyrus (240 mm2). The obtained average value for the diameter of the vessels is 62.3 µm. Although in this structure the vessels are similar in diameter in both early and late wood, the distribution of values in histograms also provides useful information.
The average value of the distances between the vessels is 136.6 µm. Here the dispersion is very small because in these types of combinations it is located almost evenly 59.5 µm. The values of the calculation coefficients are very different from those of the ring-porous ones. The average value of coefficient A is 33.0 and of the coefficient B, 0.58. The value of the coefficient C is 2.23 and that of D is 0.57.
3.2.3. Tropical Tree Species
These are species in which the cambium works continuously throughout the year. We have lately tried to separate these species into a separate main wood structure due to the large differences in the quantitative indicators of their anatomical structure. Some tropical trees are important for the woodworking and furniture industry, while others have a very characteristic structure of the vessels.
These species cover almost the entire variety of textures, which will be very useful for the subsequent classification of species. For tropical tree species, the average vessel density is very low (9 mm2). The lowest values vary from 1–3 mm2 (balsa, dabema, padauk, etc.), and the highest is about 30 mm2 (mansonia, louro branco, mukulungu, brazilwood, etc.).
It is important to note that the highest values are significantly lower than the density in the diffuse-porous species. The obtained average value for the diameter of the vessels is 184.3 µm and the standard deviation is 66.7 µm. It should be noted that standard deviation is of particular importance here. The lower it is, the closer the vessels are in diameter and vice versa. The obtained mean value for the distances between the cells is 538.5 µm and the dispersion is 265.5 µm.
These values are many times greater than the distances in the diffuse-porous species. Therefore, we consider it justified to separate these species into a separate main wood structure, called tropical wood. When examining the distances between vessels, the standard deviation is also very important. The smaller it is, the more evenly spaced the vessels are. The average value of coefficient A is 0.36 and of the coefficient B, 7.25. The values of the coefficient C is 2.97, and D is 0.48.
3.2.4. Wood with a Transitional Structure
This wood is characterized by a gradual decrease in the diameter and density of the vessels within the annual ring. It is a conditional combination of semi-ring-porous wood (such as walnut and hickory) and semi-diffuse-porous wood (such as cherry). In the former, the change in the diameters of the vessels is more significant than their density, and in the latter, it is the opposite.
When analyzing the values of the quantitative indicators and the possibilities of the automatic recognition of the vessels, it becomes clear that it is better to divide this main structure of the construction into two and to join them respectively to the ring-porous and diffuse-porous species.
4. Conclusions
Initial research has shown that the structure of wood can be successfully classified in a new way that allows the use of quantitative indicators. They are defined to be able to correctly use the methods and advantages of computer vision. The shape, location, and mutual arrangement (grouping) of the vessels can be defined with the limits of variation of these indicators.
Thus, tree species with a specific anatomical structure can be divided into separate groups to help classify them for their automatic recognition. The study of the proposed quantitative indicators in experimental conditions will give evidence of the practical use of this classification.
The analysis of the quantitative indicators allows for the differentiation of a new main wood structure or to eliminate the existing one. Tropical wood already has its quantitative indicators, very different from other main wood structures. At the same time, it would be difficult to separate semi-ring-porous species from ring-porous species and semi-diffuse-porous species from diffuse-porous species.
To improve classification methods, future studies should include an analysis of the orientation of the distances between the cells.
Author Contributions
Conceptualization, N.B. and V.T.; methodology, N.B. and V.T.; software, N.C.; validation, N.B., V.T. and N.C.; formal analysis, V.T.; investigation, N.B.; resources, N.B.; data curation, N.B. and N.C.; writing—original draft preparation, N.B.; writing—review and editing N.B., V.T. and N.C.; visualization, N.B. and N.C.; supervision, N.B.; project administration, N.B.; funding acquisition, N.B. All authors have read and agreed to the published version of the manuscript.
Funding
This research was funded by University of Forestry, Sofia, grant number (No. NIS-B-1073/16 March 2020).
Institutional Review Board Statement
Not applicable.
Informed Consent Statement
Not applicable.
Data Availability Statement
Publicly available datasets were analyzed in this study. This data can be found here: [https://www.delta-intkey.com/wood/en/index.htm], accessed on 4 June 2021.
Acknowledgments
This report was completed during the development of the project “Creation and testing of a methodology for examination of vessels in ash, mulberry, elm and oak” (No. NIS-B-1073/16 March 2020) funded by the University of Forestry, Sofia. We express our gratitude for the support provided.
Conflicts of Interest
The authors declare no conflict of interest.
References
- Enchev, E.A. Wood Science, Textbook; Publishing House of Zemizdat: Sofia, Bulgaria, 1984; pp. 32–46. [Google Scholar]
- Wagenführ, R. Anatomie des Holzes; VEB Fachbuchverlag: Leipzig, Germany, 1984; pp. 78–173. [Google Scholar]
- Wagenführ, R. Holzatlas; Springer: Berlin, Germany, 1996; pp. 22–27. [Google Scholar]
- Bluskova, G.S. Wood Science, Textbook; University of Forestry Publishing House: Sofia, Bulgaria, 2009; pp. 99–121. [Google Scholar]
- Bardarov, N.S. A Guide to the Identification of Tree Species by the Anatomical Features of Wood; Publishing House at LTU: Sofia, Bulgaria, 2014; pp. 19–65. [Google Scholar]
- van der Graaff, N.A.; Baas, P. Wood anatomical variation in relation to latitude and altitude. Blumea 1974, 22, 101–121. [Google Scholar]
- Chen, F.F.; Evans, R. Automated measurement of vessel properties in birch and poplar wood. Holzforschung 2010, 64, 369–374. [Google Scholar] [CrossRef]
- Wheeler, E.A.; Baas, P.; Rodgers, S. Variations in Dicot Wood Anatomy: A Global Analysis Based on the Inside wood Database. IAWA J. 2007, 28, 229–258. [Google Scholar] [CrossRef]
- Burggraaf, P.D. Some observations on the course of the vessels in the wood of Fraxinus excelsior L. Acta Bot. Neerl. 1972, 21, 32–47. [Google Scholar] [CrossRef]
- Aloni, R.; Zimmermann, M.H. The control of vessel size and density along the plant axis. A new hypothesis. Differentiation 1983, 24, 203–208. [Google Scholar] [CrossRef]
- Greguss, P. Holzanatomie der Europäischen Laubiiölzer und Sträucher; Budapest Akademiai Kiado: Budapest, Hungary, 1959. [Google Scholar]
- Zimmermann, M.H.; Jeje, A.A. Vessel-length distribution in stems of some American woody plants. Can. J. Bot. 1981, 59, 1882–1892. [Google Scholar] [CrossRef]
- Baas, P. Terminology of imperforate tracheary elements -in defense of ubriform fibres with minutely bordered pits. IAWA Bull. 1986, 7, 82–86. [Google Scholar] [CrossRef]
- Carlquist, S. Non-random Vessel Distribution in Woods: Patterns, Modes, Diversity, Correlations. Aliso 2009, 27, 39–58. [Google Scholar] [CrossRef] [Green Version]
- Rosell, J.A.; Olson, M.E.; Aguirre-Hernandez, R.; Carlquist, S. Logistic regression in comparative wood anatomy: Tracheid types, wood anatomical terminology, and new inferences from the Carlquist and Hoekman southern Californian data set. Bot. J. Linn. Soc. 2007, 154, 331–351. [Google Scholar] [CrossRef] [Green Version]
- Ewers, F.W.; Ewers, J.M.; Jacobsen, A.L.; López-Portillo, J. Vessel redundancy: Modeling safety in numbers. IAWA J. 2007, 28, 373–388. [Google Scholar] [CrossRef] [Green Version]
- Hwang, S.W.; Sugiyama, J. Computer vision-based wood identification and its expansion and contribution potentials in wood science: A review. Plant Methods 2021, 17, 1–21. [Google Scholar] [CrossRef] [PubMed]
- da Silva, N.R.; De Ridder, M.; Baetens, J.M.; Van den Bulcke, J.; Rousseau, M.; Bruno, O.M.; Beeckman, H.; Van Acker, J.; De Baets, B. Automated classification of wood transverse cross section micro-imagery from 77 commercial central-african timber species. Ann. For. Sci. 2017, 74, 30. [Google Scholar] [CrossRef]
- Barmpoutis, P.; Dimitropoulos, K.; Barboutis, I.; Grammalidis, N.; Lefakis, P. Wood species recognition through multidimensional texture analysis. Comput. Electron. Agric. 2018, 144, 241–248. [Google Scholar] [CrossRef]
- Ibrahim, I.; Khairuddin, A.S.M.; Arof, H.; Yusof, R.; Hanafi, E. Statistical feature extraction method for wood species recognition system. Eur. J. Wood Wood Prod. 2018, 76, 345–356. [Google Scholar] [CrossRef]
- Sugiarto, B.; Prakasa, E.; Wardoyo, R.; Damayanti, R.; Krisdianto; Dewi, L.M.; Pardede, H.; Rianto, Y. Wood identification based on histogram of oriented gradient (hog) feature and support vector machine (svm) classifier. In Proceedings of the 2017 2nd International conferences on Information Technology, Information Systems and Electrical Engineering (ICITISEE), Yogyakarta, Indonesia, 1–2 November 2017; pp. 337–341. [Google Scholar]
- de Andrade, B.G.; Basso, V.M.; de Figueiredo Latorraca, J.V. Machine vision for field-level wood identification. IAWA J. 2020, 41, 681–698. [Google Scholar] [CrossRef]
- Liu, S. Realtime classification of rubber wood boards using an ssr-based cnn. IEEE Trans. Instrum. Meas. 2020, 69, 8725–8734. [Google Scholar] [CrossRef]
- Sun, Y.; Lin, Q.; He, X.; Zhao, Y.; Dai, F.; Qiu, J.; Cao, Y. Wood species recognition with small data: A deep learning approach. Int. J. Comput. Intell. Syst. 2021, 14, 1451–1460. [Google Scholar] [CrossRef]
- Christoff, N.; Bardarov, N.; Manolova, A.; Tonchev, K. Feature Extraction and Automatic Detection of Wooden Vessels from Raster Images. In Proceedings of the 2020 XXIX International Scientific Conference Electronics (ET), Sozopol, Bulgaria, 16–18 September 2020; pp. 1–4. [Google Scholar]
- Richter, H.G.; Dallwitz, M.J. 2000 Onwards. Commercial Timbers: Descriptions, Illustrations, Identification, and Information Retrieval. In English, French, German, Portuguese, and Spanish. Available online: https://www.delta-intkey.com/wood/en/index.htm (accessed on 4 July 2021).
Publisher’s Note: MDPI stays neutral with regard to jurisdictional claims in published maps and institutional affiliations. |
© 2021 by the authors. Licensee MDPI, Basel, Switzerland. This article is an open access article distributed under the terms and conditions of the Creative Commons Attribution (CC BY) license (https://creativecommons.org/licenses/by/4.0/).