Article

Land Cover Changes in Selected Areas Next to Lagoons Located on the Southern Coast of the Baltic Sea, 1984–2021

by
Dariusz Gozdowski
1,
Jan Žukovskis
2,
Artūras Razinkovas-Baziukas
3 and
Elżbieta Wójcik-Gront
1,*
1
Department of Biometry, Institute of Agriculture, Warsaw University of Life Sciences, 02-776 Warsaw, Poland
2
Department of Business and Rural Development Management, Vytautas Magnus University, 53361 Kaunas, Lithuania
3
Marine Research Institute, Klaipėda University, 92294 Klaipėda, Lithuania
*
Author to whom correspondence should be addressed.
Sustainability 2022, 14(4), 2006; https://doi.org/10.3390/su14042006
Submission received: 14 January 2022 / Revised: 3 February 2022 / Accepted: 7 February 2022 / Published: 10 February 2022

Abstract

:
The aim of the study is the evaluation of land cover changes in selected areas next to three lagoons (the Curonian Lagoon, the Vistula Lagoon and the Szczecin Lagoon) located on the southern coast of the Baltic Sea (in Lithuania, Russia, Poland and Germany) from 1984 to 2021. The changes are evaluated using multispectral (visible light—RGB and near infrared—NIR) satellite images from the Landsat 5 and Sentinel-2 sensors. Due to their high importance for ecosystem services, two main land cover types are evaluated, i.e., forest area and inland water reservoirs. The classification of the images is performed using a random forest algorithm. Areas of water bodies and forests are evaluated for the years 1984 and 2021. During period 1984–2021, positive changes in land cover are observed in all three regions included in the study. In almost all parts, with the exception of the Polish part of the area located next to the Szczecin Lagoon, of these regions, an increase in forest area is observed. The increase ranges from 0.1% (Poland, area next to the Vistula Lagoon) to 1.2% (Germany, area next to the Szczecin Lagoon). The area of inland water reservoirs has not changed significantly in the long term. Despite the global warming, no reduction in the area of these water reservoirs is observed, even new seminatural reservoirs have been created in some parts of the study area.

1. Introduction

The long term monitoring of land cover and land use changes is possible using satellite images and it is very important for evaluating the potential of ecosystem services [1,2]. Key land cover indicators for ecosystem services are forests and water reservoirs. They are evaluated in the studies on land cover changes most often [3,4,5]. Deforestation is one of the main problems caused by the overexploitation of land resources and, therefore, forest areas should be monitored and the formation of forests should be promoted [6]. Another very important issue in the face of climate change is the decline in wetlands, water reservoirs, especially in coastal environments [7,8,9]. Reasons that may cause a decrease in the surface area of water reservoirs are smaller precipitation and eutrophication, which can be a serious problem in costal river deltas [9,10,11]. Land cover monitoring is especially important for coastal areas, as they have multiple social functions as a part of the natural environment [12,13]. The monitoring of land use and land cover is possible through the use of archival and current satellite images [14,15,16]. One of the most important and earliest sources of satellite images with worldwide coverage is the Landsat 1 satellite, which delivered images with a pixel size of 60 [17]. Landsat 1 was launched in 1972, making it possible to monitor land cover and land use changes for almost 50 years. Successive Landsat satellites provided satellite images with improved resolution and spectral range, and a higher frequency of revisits. One of the most important steps in the Landsat program was the launching of Landsat 5, which operated from 1984 to 2003 [18]. The main advantage of Landsat 5 images is its high spatial resolution. This is a 30-meter resolution for the multispectral sensor thematic mapper (TM) which registered seven bands in the spectral range of visible light and shortwave infrared, with a revisit time of 16 days [19]. Currently, the newest operational satellite of the Landsat program is Landsat 9, which was launched in September 2021 [20]. Landsat 9 is equipped with two multispectral sensors, i.e., OLI-2 (Operational Land Imager 2) with nine visible and infrared spectra and the TIRS-2 (Thermal Infrared Sensor 2), which registers the images at a 14-bit radiometric resolution and has a revisit time of 16 days. In recent years, many various Earth-observing satellites have been launched, therefore, the possibilities of monitoring land changes are much more extensive. One of the frequently used satellite constellations is Sentinel-2 (two satellites—2A and 2B), which delivers multispectral images with a spatial resolution of 10 m for RGB and near infrared bands with a revisit time from 2 to 5 days (depending on the place on Earth) [21]. Land cover and land use changes are the target of many projects with different geographic coverage [22]. One of the most important projects is CORINE Land Cover (CLC), which covers the territory of Europe [23,24]. CLC is updated approximately every five years and the most recent maps of land cover and land use are for 2016–2018. One of the main disadvantages of the CLC project is its large mapping unit, the area of which area 25 ha. It is too generalized to detect changes in smaller areas. Another disadvantage of CLC is accuracy, which is estimated to be at least 85%, but probably far from 100%. A similar project on mapping land cover and land use changes is the Geo-harmonizer project [25], which produced annual land cover maps at a 30-meter resolution for the period 2000–2019.
The simplest method of classifying land cover from satellite images is the pixel based method, where each pixel is treated as an individual unit [17]. Pixels with similar values of one or more spectra are classified as the same land use/cover type. Pixel based methods can be supervised by selecting training areas as a reference for a specific type of land use/cover [26,27] or unsupervised when training areas are not used [28,29]. For pixel based classification, spectra for individual bands can be used as well as spectra for multiple bands and various spectral indices based on multiple bands. Examples of such indices include NDVI (normalized difference vegetation index), which can be used to classify areas with different types of vegetation [30] and NDWI (normalized difference water index), which can be used for the selection of water reservoirs [31]. More comprehensive approaches include multiple attributes/variables and more advanced methods of multivariate classification. One of the most accurate methods is the random forest (RF) classification based on machine-learning algorithms [32,33,34,35]. The overall accuracy of RF is usually higher in comparison to other multivariate classification methods used to classify satellite images for land cover detection, such as, e.g., decision tree (DT), rule based (RB), Support Vector Machine (SVM), and Artificial Neural Network (ANN) methods. RF is a supervised method of classification that requires sample training areas for classified land cover types. The variables used for classification are usually individual bands, most often visible light and near infrared, and spectral indices based on these bands (e.g., NDVI, NDWI). A more complex classification requires multitemporal satellite images from different seasons, which allow, e.g., better classification of broadleaf forests.
As the pixel size is of medium resolution, satellite images (for Landsat satellites the pixel size is from 30 to 60 m) can include various types of land cover/use. Subpixel classification methods can be used to classify small objects more accurately [36,37]. Despite the use of analytical methods of land cover/use classification, in certain cases visual analysis of ortophotophotographs is used. Then, an interpreter’s expertise is used to classify the images and support other methods of classification [38,39]. In classifying land cover, the expertise of an interpreter can be used as an auxiliary method.
The aim of the study is to evaluate the main changes in land cover in selected areas next to three lagoons (the Curonian Lagoon, the Vistula Lagoon, and the Szczecin Lagoon) located on the southern coast of the Baltic Sea from 1984 to 2021 using satellite data from Landsat 5 and Sentinel-2. The evaluation is focused on forests and water reservoirs, which are very important for ecosystem services, especially because of locations next to estuarine and coastal ecosystems. The study is focused on the long term changes between 1984 and 2021.

2. Materials and Methods
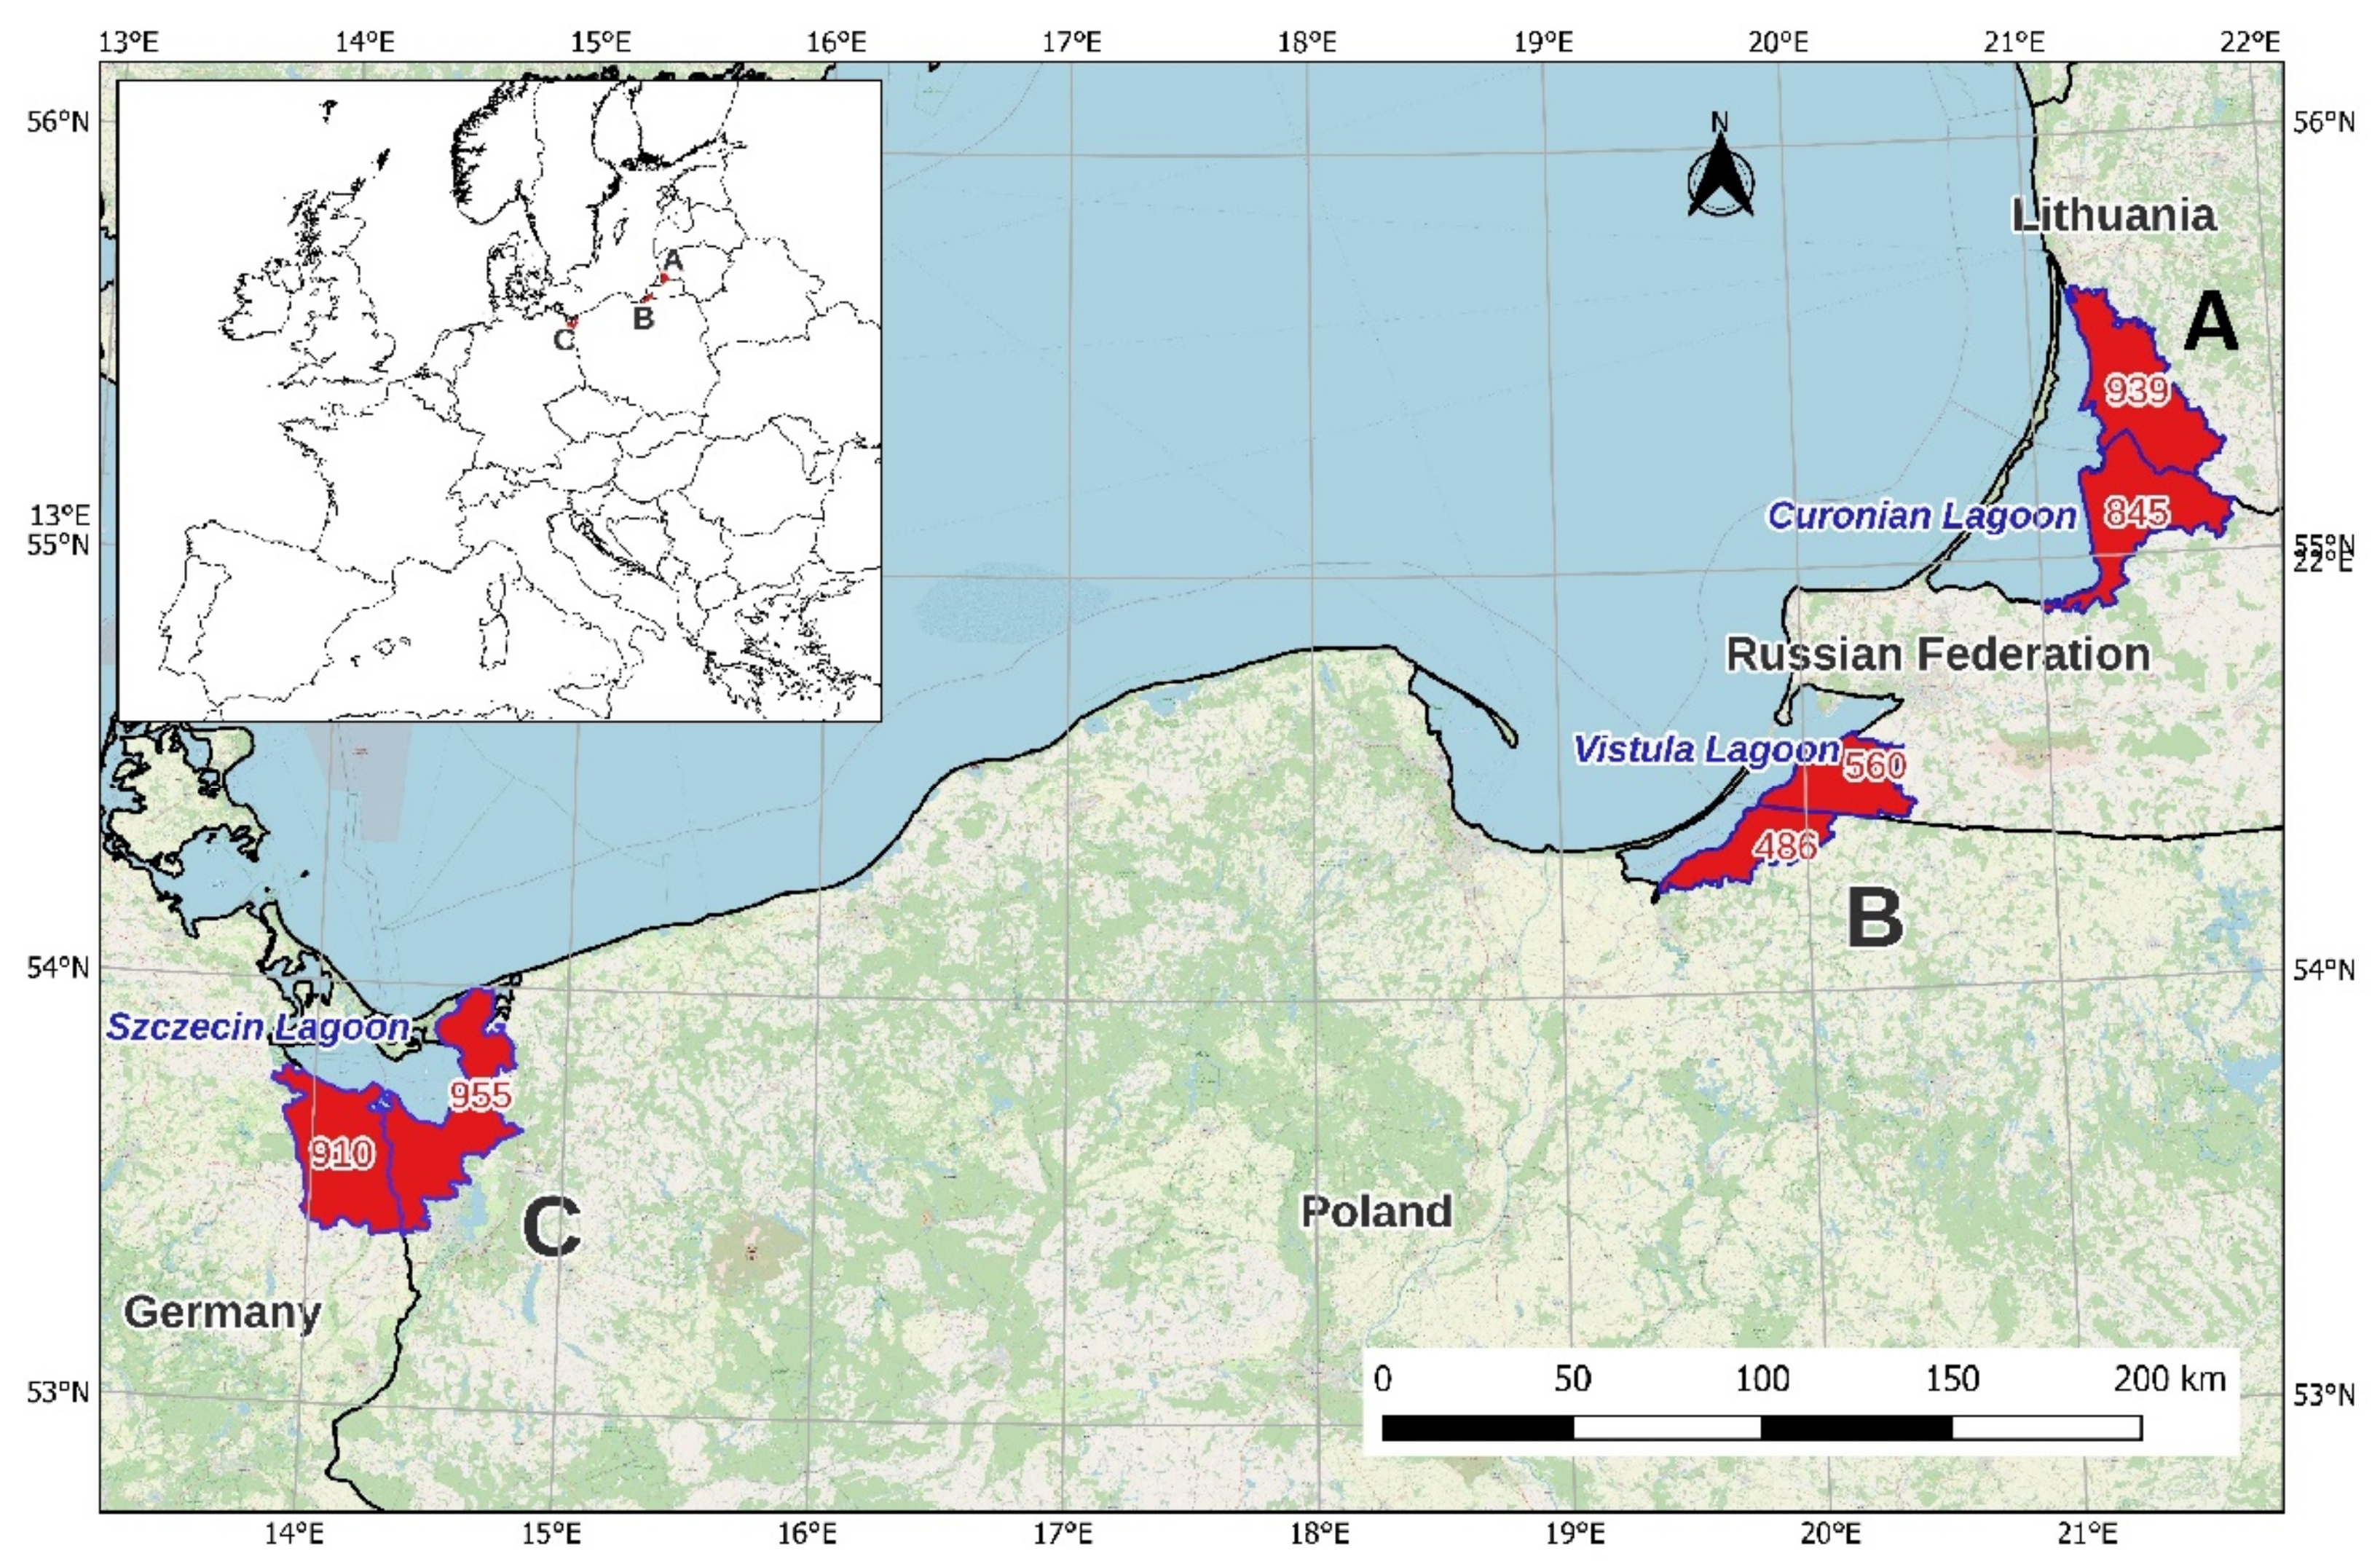
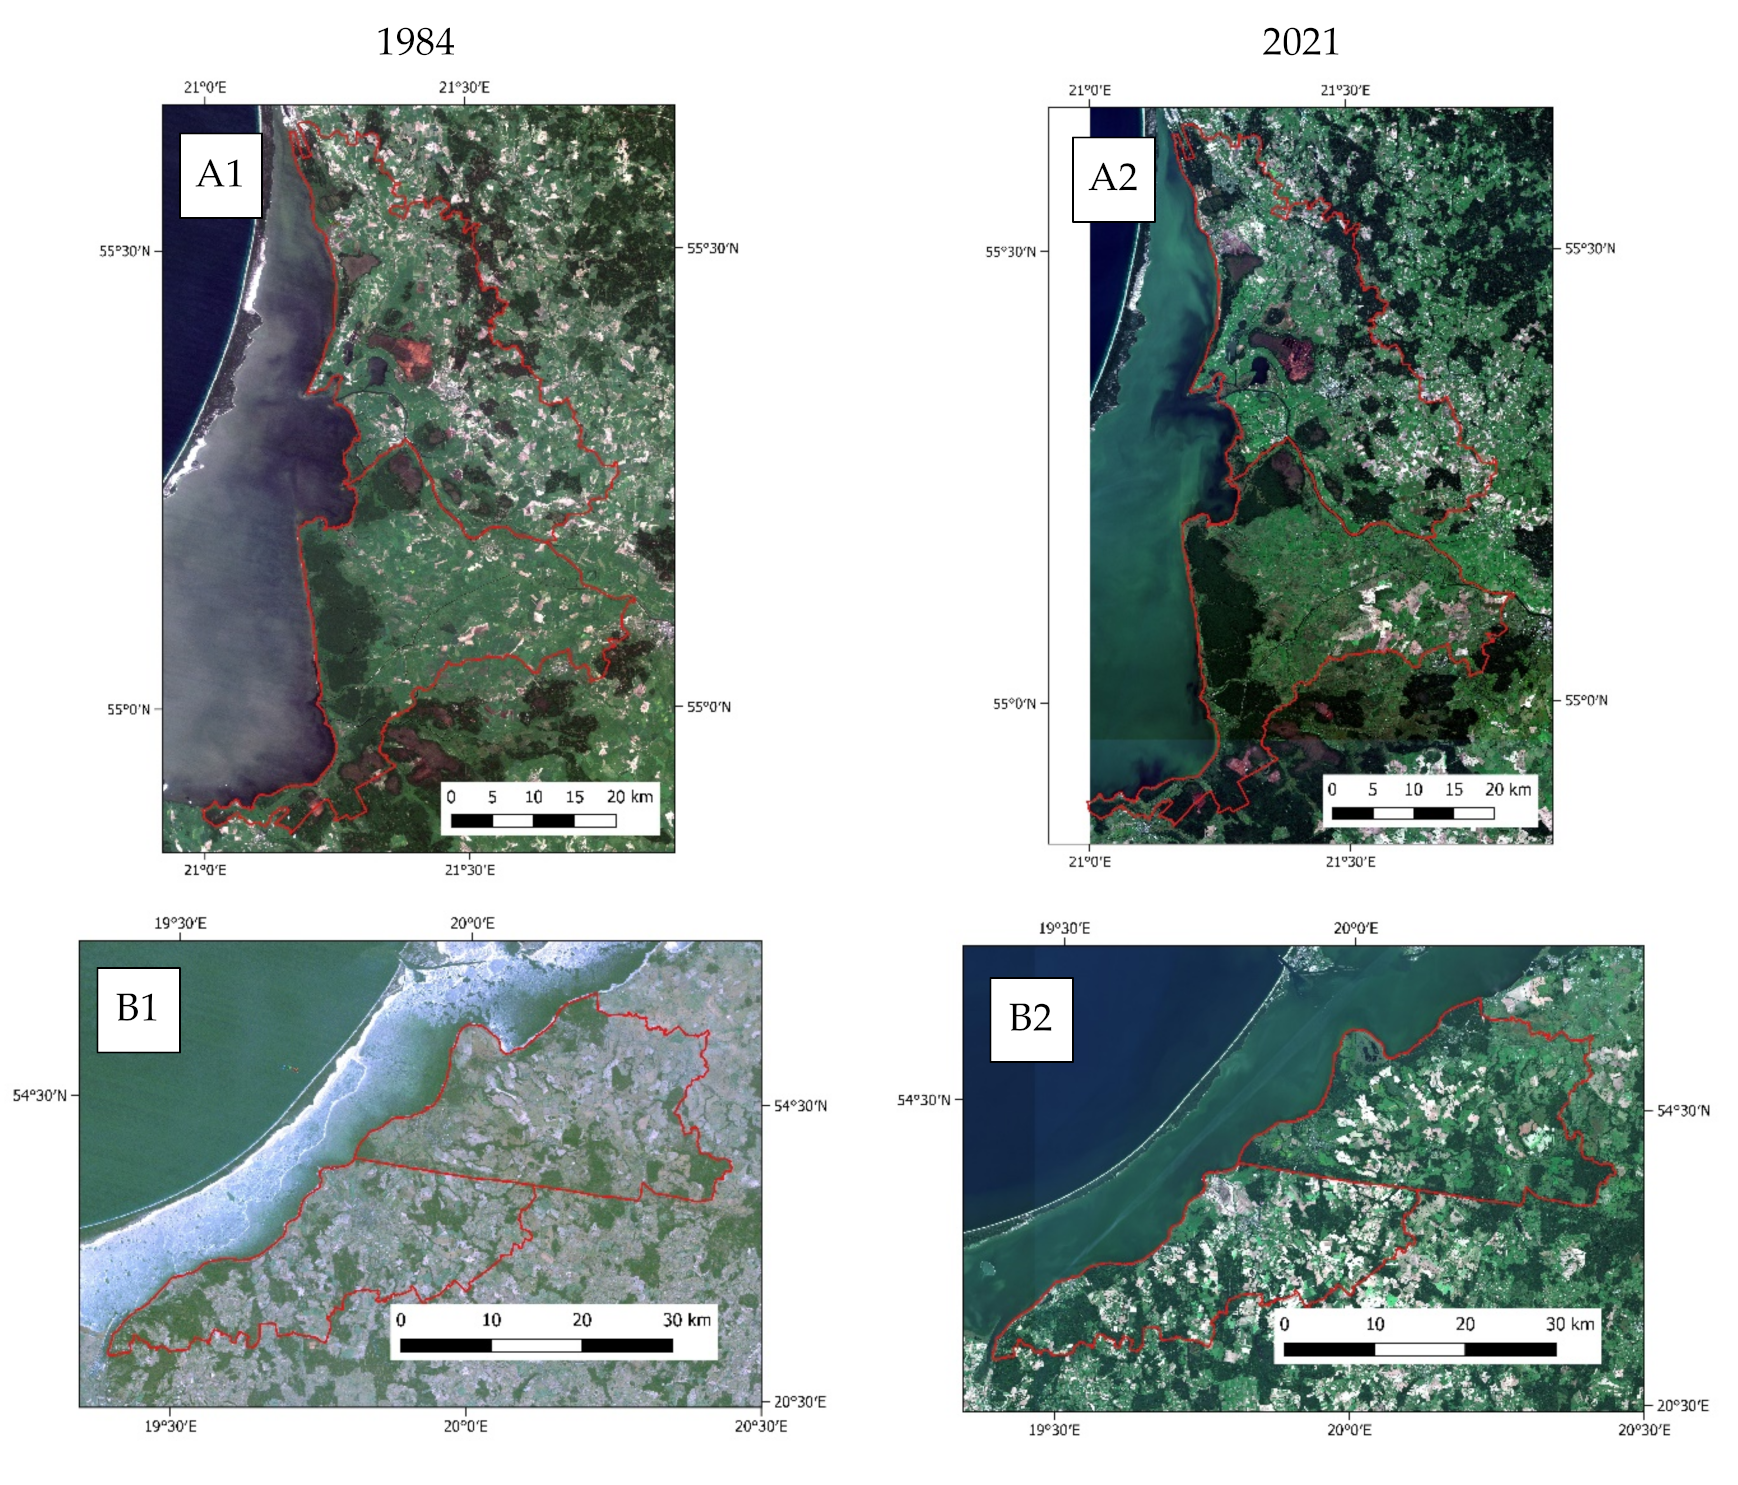
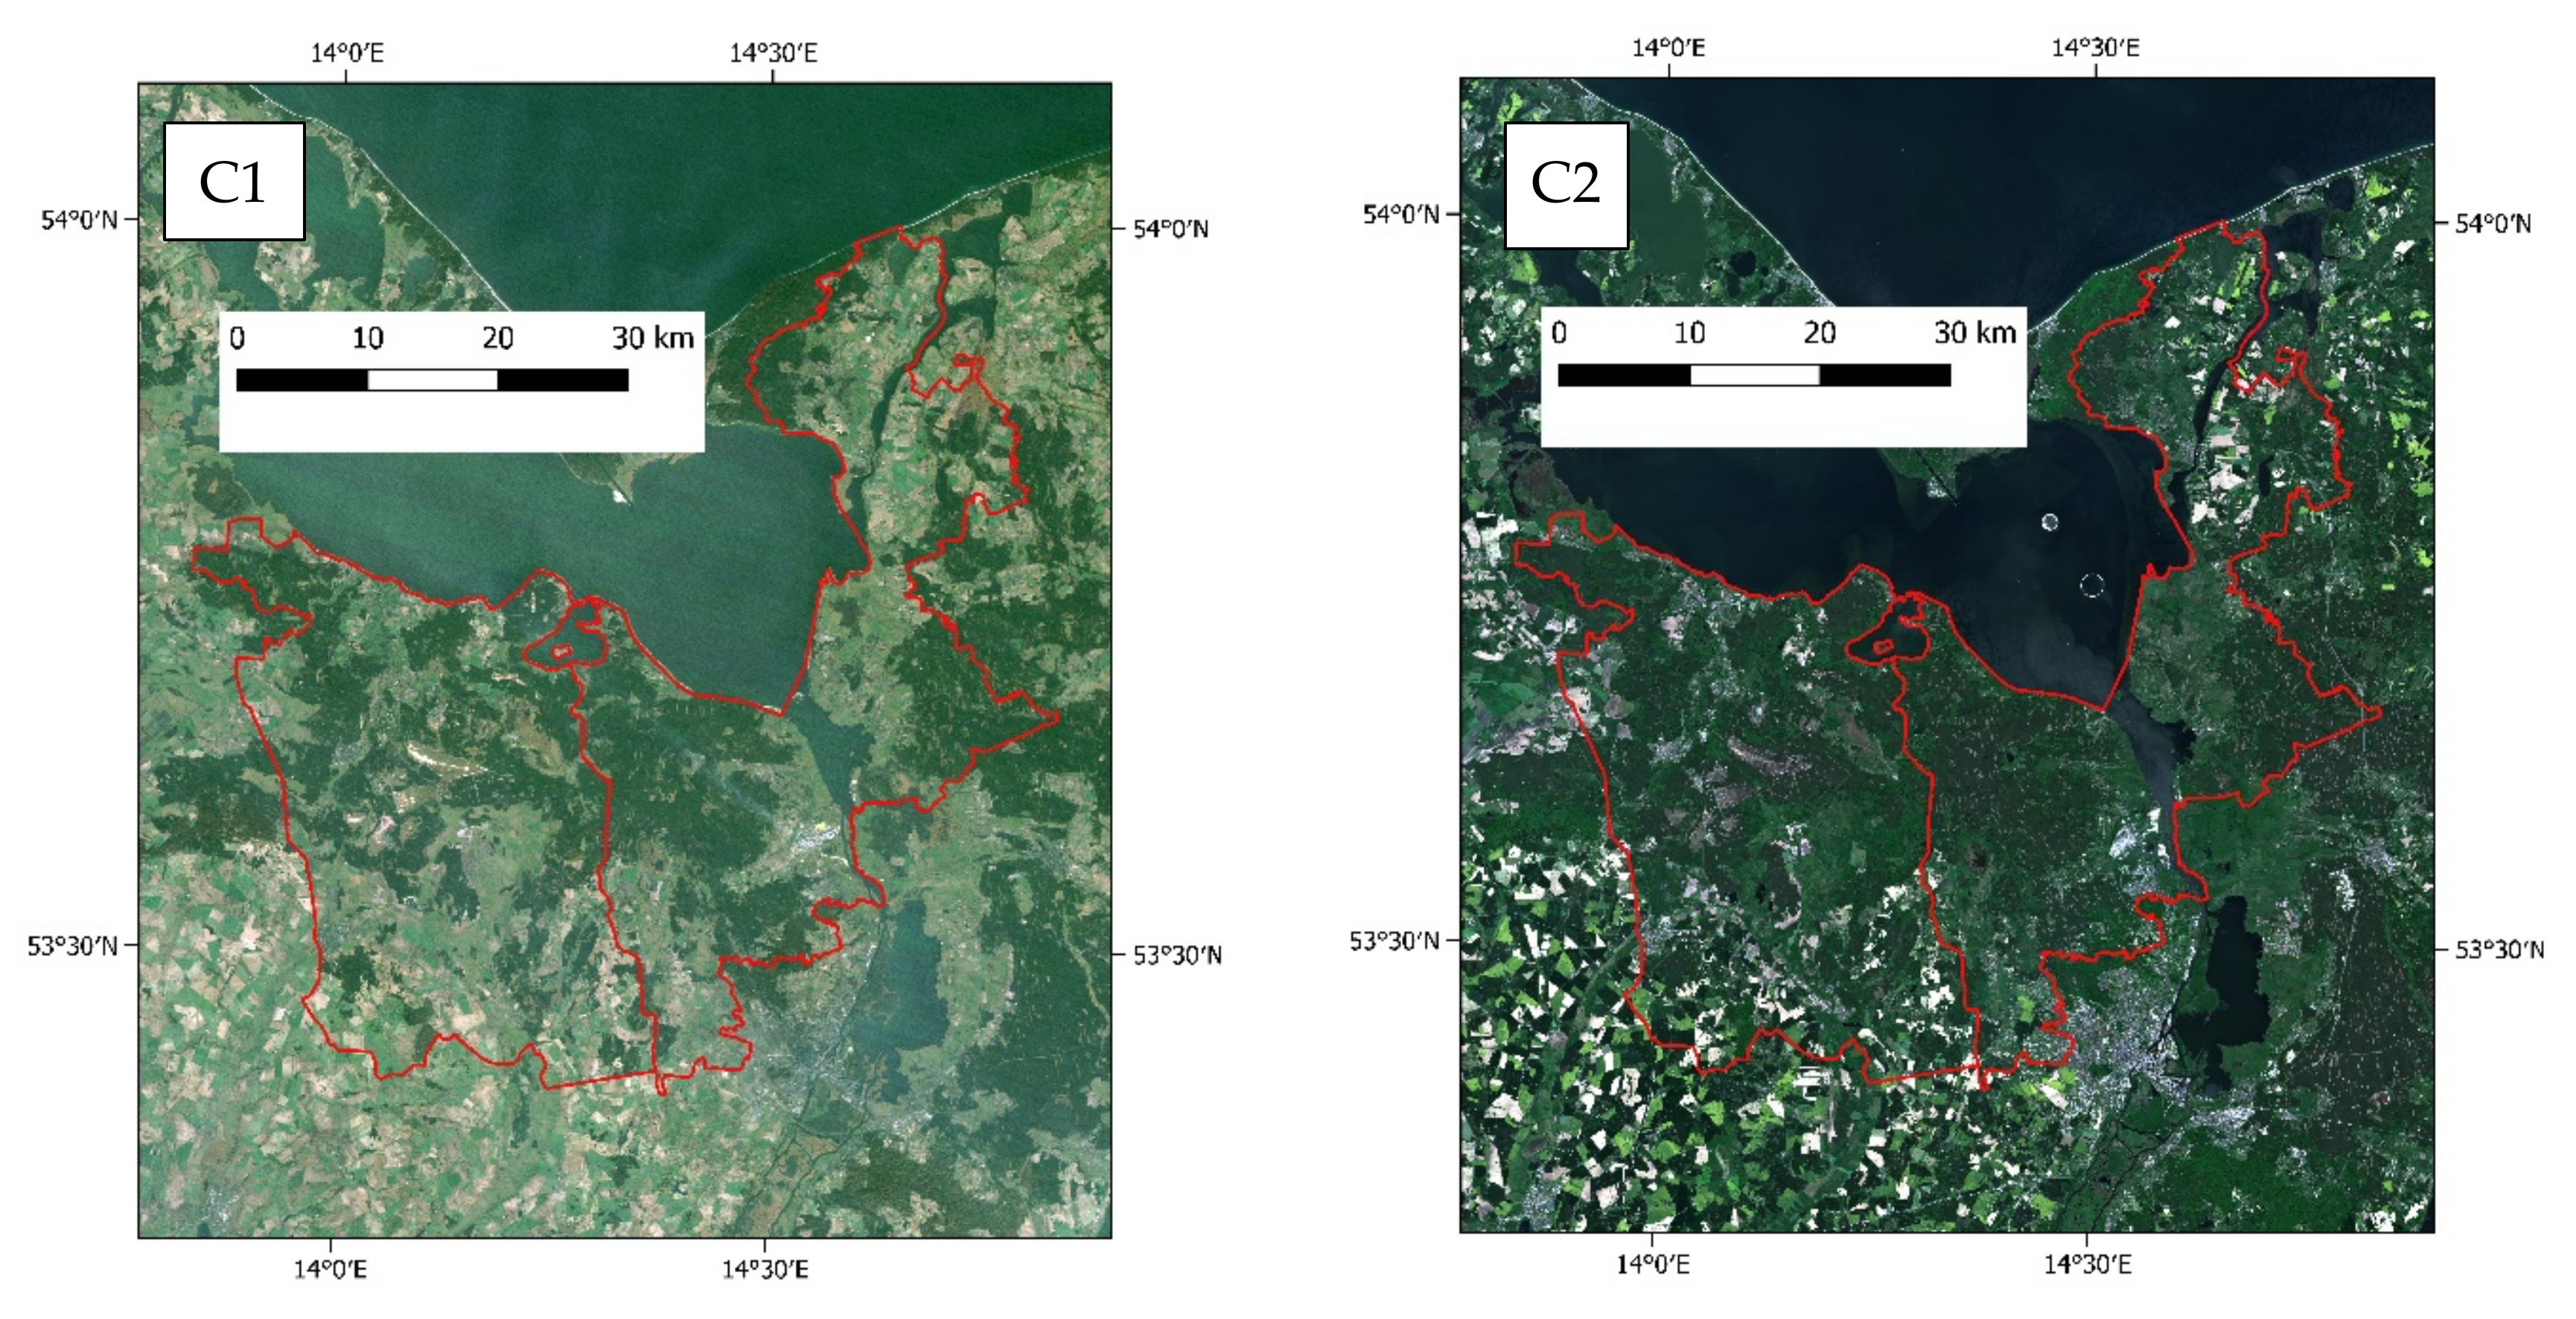
2.1. Studied Area

The studied areas were located in three locations on the southern coast of the Baltic Sea (Figure 1). The locations are next to three lagoons, i.e., (A) the Curonian Lagoon, (B) the Vistula Lagoon, and (C) the Szczecin Lagoon. The main criterion for selecting the sites was the location on the Baltic Sea in the vicinity of a large lagoon. Moreover, highly industrialized and urbanized areas were omitted, while areas of high natural value, important from the point of view of ecosystem services, were selected. For each area, its location was selected to include two countries. The choice of different countries was due to the fact that we wanted to assess the changes in land cover resulting, inter alia, from political changes (transition from the communist period–1984) to the market economy (the period from 1990 to 2021). Four countries were included, i.e., Lithuania, Poland, the eastern part of Germany (there were transitions from socialist states in 1990 to democracies and market economies in all three countries), Russia (a socialist state in 1984 without deep changes in political system until 2021). Changes in political system can affect land cover changes due to a change of ownership, land abandonment in some parts of the study areas and natural forest succession.

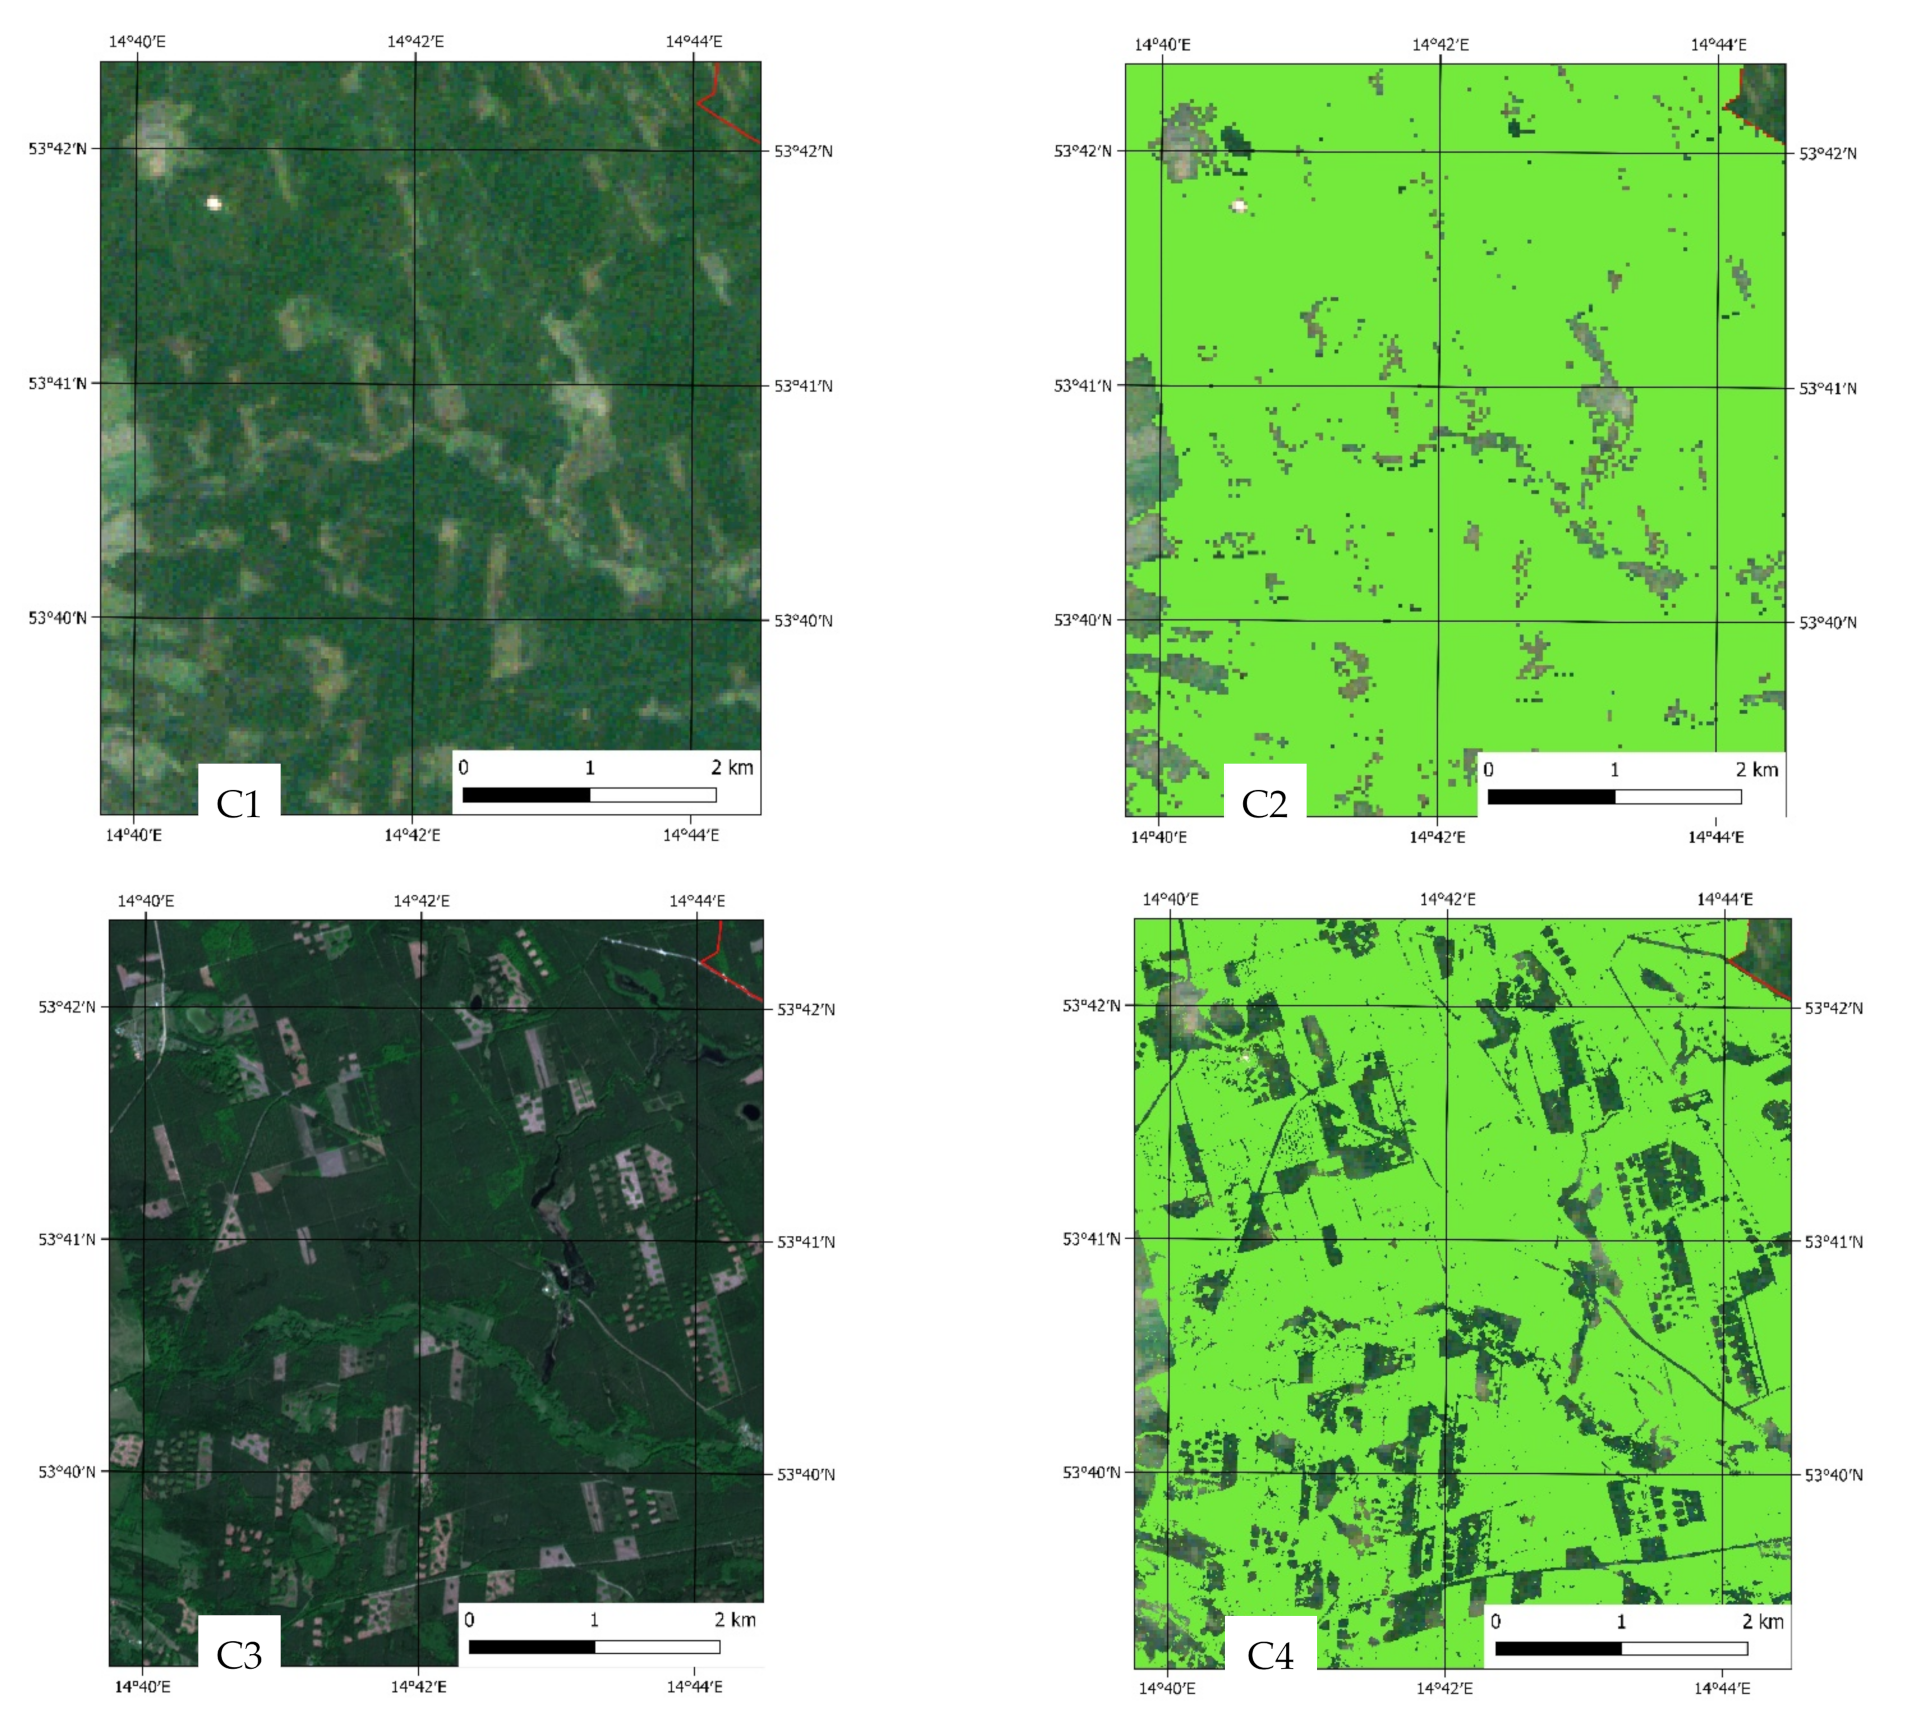
2.2. Methods Used of Land Cover Classification

The data for land cover/use evaluation were medium resolution satellite images from Landsat 5 with multispectral sensor thematic mapper (TM) for beginning of the period (1984) and Sentinel- 2 (A and B) for the end of the period (2021) (Figure 2). Cloudless images were selected in seasons where level of water is relatively low (early spring was avoided because of occurrence of short lived backwaters). Characteristics of satellite images for each location and year are presented in Table 1.
The spatial resolution of multispectral RGB + NIR images for Landsat 5 was 30 m (pixel size 30 × 30 m) and for Sentinel-2 was 10 m (pixel size 10 × 10 m). Due to different spatial resolutions in 1984 and 2021, the modifiable areal unit problem (MAUP) can be a source of the bias, especially for small water bodies such as rivers or ponds. Other bands were not included in the analysis to ensure the highest possible resolution. However, the bands used in the analysis were sufficient for good accuracy of classification of the land cover types in the study. The images came from the Landviewer service [40]. Landsat 5 L-1 product was downloaded and atmospheric correction was performed using the DOS1 method in Semi-Automatic Classification Plugin (SCP) in QGIS software [41]. In case of Sentinel-2 L2A, products after atmospheric correction were downloaded directly from Landviewer service.
In the analysis, spectra in a range of visible light (RGB, red, green and blue) and in the near infrared (NIR) were processed using the QGIS 3.20 and the ArcGIS 10.8 software.
Classification of the satellite images was conducted using random forest algorithm implemented in Spatial Analyst Tools in ArcGIS software. Training samples consisted of 10 classes, i.e., urban fabric, green urban areas, arable land, pastures, broad leaved forest, coniferous forest, moors and heathland, transitional woodland shrub, inland wetlands, water bodies. These land types cover all major types occurring in the three areas of the study. In the study we have focused only on two types of land cover, i.e., areas of forests (both broad leaved and coniferous forest) and areas of water bodies (only inland water bodies were included in analysis). These two types of land cover are most important for development of ecosystem services. The process of land cover classification consisted of the following stages:
-
download of the satellite images and selection of completely cloudless images;
-
merging (if necessary) satellite scenes;
-
calculation of spectral indices (NDVI) using QGIS software (raster calculator tool);
-
preparation of multiband rasters (R, G, B, NIR and NDVI);
-
preparation of vector layers with sample training areas for main land cover types based on visual assessment and previous studies (CORINE Land Cover and Geo-harmonizer projects) for each location and date separately (for each cover type at least 10 training polygons were selected);
-
generation of Esri classifier definition files (.ecd) for each location and date (separately for each satellite sensor);
-
performing classification using Random Trees Classifier in ArcGIS (random forest algorithm) and generation of the rasters with land cover types;
-
calculation of area of forests and water bodies using raster calculator and zonal statistics in QGIS software.
The results obtained in this study (areas of forests and water bodies) for 2021 were compared to the latest results from CORINE Land Cover (2018) and Geo-harmonizer (2019) projects. Moreover, classification quality assessment was performed on selected validation areas and these results are presented in Table S1.

3. Results

The study focuses on two types of land cover that are very important for ecosystem services, i.e., forests and inland water reservoirs. The classification of these two types of land cover was based on two sources of satellite data; from Landsat 5 for 1984, where satellite images are 30 m, and Sentinel-2 for 2021, where images are 10 m pixel size. For this reason, some small objects, such as small ponds and smaller rivers were not properly classified, especially in 1984. Nevertheless, the results allow us to reliably evaluate long term changes in these two types of land cover. In the case of water reservoirs, high seasonal changes occur due to higher water levels, which are usually observed in early spring. Therefore, the water level was evaluated in late spring, in summer or autumn, when the level of water was lower. This approach may be influenced by the eutrophication of water reservoirs, as the plant cover on the water surface can interfere with the correct classification of water reservoirs. This is especially important for lakes and ponds that are sensitive to eutrophication. The areas selected in the study were characterized by a low effect of human activity. Large cities were excluded from the analysis and the intensity of agricultural production in these areas is low. For this reason, these areas have a high nature value and are very important for sustainable development, ecosystem services and can mitigate the negative impact of human activities on marine pollution. The results focus only on these two land cover types because of their key importance for the sustainable development of rural areas and also due to the simplicity of classifying these types of land cover.

3.1. Changes in Forest Area

The forests covered by this research were areas with coniferous, broad leaved trees as well mixed stands. The transitional woodland shrub was not included as a forest area. The percentage of forest area was quite high in all the studied areas. The largest forest area was observed in the area of the Szczecin Lagoon (both for the Polish and German parts of the area) and the smallest by the Curonian Lagoon (especially for the Lithuanian part of the area) (Table 2, Figure 3). In 1984, in the Lithuanian part of the area next to the Curonian Lagoon, forests covered about 16.2% of the total area. This was a low share in comparison to other studied areas, but during the period of the study until 2021 an increase in forest area to 16.7% was observed. Such an increase in forest area was mainly due to the conversion of natural areas from shrubs or fields to natural forest without human activity. In the case of the remaining areas next to the Curonian Lagoon, a decrease in forest areas was observed for an area of Russia (Kaliningrad Oblast), where the share of forests decreased from 28.9% to 28.4%. The main difference between the Lithuanian part of the area located next to the Curonian Lagoon and the Russian part, was the size of a single forest. The forests in the Russian part were concentrated near the coast, while in Lithuania they were scattered and located in various parts of the studied area. Forests in Lithuania and Russia next to the Curonian Lagoon are not intensively pruned and have a seminatural character. The situation was different in areas next to the Vistula Lagoon as well next to the Szczecin Lagoon, where the forest is cut more intensely, especially in the Polish part of the area, and, inside the forests, it was possible to see the areas immediately after logging (Figure 4). In the case of areas next to the Vistula Lagoon, a large part of the forest is deciduous forests, while, in the case of the Szczecin Lagoon, coniferous forests dominate. The highest share of forest was observed next to the Szczecin Lagoon, where approximately 40–44% of the total area was covered by forest, both for the Polish and German part of the studied area. The forest area decreased in the Polish part next to Szczecin Lagoon from 43.0% to 40.9%, which is caused by quite intensive cutting down. The areas after felling were not treated as forests, and their area was not included in the forest area in the study. Usually, small areas within the forest are cut down and then reforested, but trees grow quite slowly and for one or more seasons the area is treeless or trees are very small. In the case of areas next to the Vistula Lagoon, the increase in forest area was very small—0.4% (from 32.5% to 32.9%) for the Russian part and 0.1% (from 32.0% to 32.1%) for the Polish part.

3.2. Changes in Inland Water Reservoirs

Inland water reservoirs covered a small part of the studied areas. In the case of the areas next to the Curonian Lagoon, it was 1.8% for the Lithuanian part in 1984 and 1.3% for the Russian part of the studied area (Table 3). The changes in 1984–2021 were relatively small and, in the case of Lithuania, were caused by human activity (the controlled flooding of polders), and not by natural changes. In the case of areas located next to the Vistula Lagoon, the share of inland water reservoirs was very low (0.04% for the Russian part and 0.01% for the Polish part in 1984). In the Russian part of the study area, a new seminatural lake was created in the north-eastern part of the region with an area of approximately 1.5 km2, which resulted in an increase in water reservoirs by 0.29%. The changes in the inland water area for the Polish part of the study area next to the Vistula Lagoon were very small. The slightly greater water area detected in 2021 was mainly due to the higher spatial resolution of satellite imagery (10 m instead of 30 m in 1984). In the case of areas located in the vicinity of the Szczecin Lagoon, a much higher share of inland water reservoirs was observed for the Polish part, where a part of the Szczecin Lagoon was included in the area of the study. If we exclude the area of the Szczecin Lagoon, only about 1% of the area was covered by inland water. The changes in the water area between 1984 and 2021 were small and the impact of climate change on the area covered by inland waters was not observed. Human activities have a greater impact on changes in the surface of inland waters, e.g., in the case of Lithuania, fishing activities, and in case of Russia, opencast mines, where new water reservoirs appear.

4. Discussion

The results presented in the study are based on the data acquired by two satellite sensors, i.e., TM of Landsat-5 (pixel size 30 m) and MSI of Sentinel-2 (pixel size 10 m). The modifiable areal unit problem (MAUP) can be a cause of discrepancies in the results, especially for small water bodies such as rivers and ponds. The higher spatial resolution of Sentinel-2 sensors allows for better accuracy of land cover classification [42], which in this study resulted in the detection of smaller water reservoirs in 2021 (smaller lakes and narrower rivers) which was not possible in 1984. The study focused on two land cover types, i.e., forests and inland water reservoirs, because of their importance for ecosystem services [43,44]. A limitation of this study may be the insufficient resolution of satellite images for the identification of small water reservoirs. This was 30 m for 1984 and 10 m for 2021, which can cause the underestimation of water areas because small water reservoirs can be omitted. Moreover, since a very high seasonal variability in water cover was observed, it is difficult to accurately evaluate the impact of long term changes in water reservoirs [45]. Besides, changes in water cover can be caused by human activity, not natural changes [46]. One of the most important and positive changes in the land cover in the studied areas from 1984 to 2021 was the increase in forest area in almost all the locations studied. The exception was the Polish part located next to the Szczecin Lagoon, where a decrease was observed. However, according to the study by Bielecka et al., in the total Polish Baltic coastal zone, in the years 1990–2018, an increase in forested area was observed from 32.15% to 33.57% [47]. The increase was relatively small and mainly caused by the transition of scrub/shrub to forests, as well as by the transition of marginal agricultural land to forest. Land cover research for these areas of study is very limited. The study for the part of Lithuania, next to Curonian Lagoon, for years 1975–2000, shows an increase in forest area from 20.6% to 21.5% and an increase in inland water from 1.8% to 2.5% [48]. Another study conducted for the entire area of Klaipėda district (covering part of the Lithuanian area analyzed in this study) proved an increase in forested area from 20.5% in 1986 to 23.9% in 2005. The increase in forested area is greater in comparison to the results obtained in this study; however, it is not fully comparable because the study areas are not the same [49]. Future scenarios for Lithuania, based on the study of Gomes at al., predict an increase in forested area by 2050, which may vary depending on scenario [50]. This confirms that long term changes are positive for the development of environmental services in these areas. The evaluation of land cover changes in regions located next to the coast of the Baltic Sea is very important to mitigate sea eutrophication and maintaining biodiversity in coastal environments [51]. Natural variability and biodiversity are positive factors not only of wildlife but for the development of ecosystem services which are very important for regional sustainable development [52]. The results of the study proved that the changes in all the studied areas located in different countries were positive, especially due to the increase in forested area. A negative change (decrease in forest area) was observed only in the Polish part located next to Szczecin Lagoon, but it was a temporary change because areas after felling are or will be reforested. Different countries conduct different environmental policies, but the evaluation of land cover changes in the studied period gave promising results because of the increase in forest area in most of the studied locations, as well as the lack of negative changes in inland water reservoirs. Changes in land cover are especially important for such areas as those which were included in the study, i.e., in areas next to estuarine and coastal ecosystems [53]. Despite political changes in all the studied countries after 1990, the studied coastal regions remained relatively intact and the changes in the environment were not very significant [47,54].

5. Conclusions

During period 1984–2021, positive changes in land cover were observed in all three regions included in the study. In most of the studied locations, an increase in the forest area was observed (0.1–1.2%). A decrease in the forest area (by 2.9%) was observed only in the Polish part located next to the Szczecin Lagoon. Intensive felling of forests was conducted there, but it was only temporary deforestation as most of these areas are located in larger forest complexes and will most likely be afforested in the near future. The area of inland water reservoirs did not change significantly in the long term, which is positive, because despite global warming, no reduction in this water reservoirs was observed. Moreover, new seminatural water reservoirs appeared in some parts of the study area. Evaluation of future changes in land cover will be possible with increasing accuracy and the availability of higher resolution satellite images. This is especially important for small water reservoirs (lakes and narrow rivers), which cannot be detected in this study because of too coarse satellite imagery.

Supplementary Materials

The following supporting information can be downloaded at: https://www.mdpi.com/article/10.3390/su14042006/s1, Figure S1: RGB composite based on Landsat 5 satellite images from 1984-06-04, used for classification of land cover in the location of the study area on southern coast of the Baltic Sea next to the Curonian Lagoon. (A1—1984-06-04, A2—2021-09-09), the Vistula Lagoon (B1—1984-11-18, B2—2021-09-09) and the Szczecin Lagoon (C1—1984-11-14, C2—2021-05-31). Figure S2: RGB composite based on Sentinel-2 satellite images from 2021-09-09, used for classification of land cover in the location of the study area on southern coast of the Baltic Sea next to the Curonian Lagoon. Figure S3: RGB composite based on Landsat 5 satellite images from 1984-11-18, used for classification of land cover in the location of the study area on southern coast of the Baltic Sea next the Vistula Lagoon. Figure S4: RGB composite based on Sentinel-2 satellite images from 2021-09-09, used for classification of land cover in the location of the study area on southern coast of the Baltic Sea next to the Vistula Lagoon. Figure S5: RGB composite based on Landsat 5 satellite images from 1984-11-14, used for classification of land cover in the location of the study area on southern coast of the Baltic Sea next to the Szczecin Lagoon. Figure S6: RGB composite based on Sentinel-2 satellite images from 2021-05-31, used for classification of land cover in the location of the study area on southern coast of the Baltic Sea next to the Szczecin Lagoon. Figure S7: Areas of forest (green color) and water reservoirs (blue color) in 1984 in the studied area in south coast of Baltic Sea next to Curonian Lagoon. Figure S8: Areas of forest (green color) and water reservoirs (blue color) in 2021 in the studied area in south coast of Baltic Sea next to Curonian Lagoon. Figure S9: Areas of forest (green color) and water reservoirs (blue color) in 1984 in the studied area in south coast of Baltic Sea next to Vistula Lagoon. Figure S10: Areas of forest (green color) and water reservoirs (blue color) in 2021 in the studied area in south coast of Baltic Sea next to Vistula Lagoon. Figure S11: Areas of forest (green color) and water reservoirs (blue color) in 1984 in the studied area in south coast of Baltic Sea next to Szczecin Lagoon. Figure S12: Areas of forest (green color) and water reservoirs (blue color) in 2021 in the studied area in south coast of Baltic Sea next to Szczecin Lagoon. Table S1: Results of the classification quality assessment for selected training areas for selected areas of water bodies and forests located in Lithuania next to Curonian Lagoon in the study area. False positive are percentages of areas classified as forests (or inland water) which are not real forest (or real inland water), while false negative indicate areas which were not classified as forests (or inland water) which are real forests (or inland water).

Author Contributions

Conceptualization, D.G., J.Ž. and A.R.-B.; methodology, D.G., J.Ž. and A.R.-B.; validation, E.W.-G. and D.G.; formal analysis, D.G., J.Ž., A.R.-B. and E.W.-G.; data curation, D.G. and J.Ž.; writing—original draft preparation, D.G., J.Ž., A.R.-B. and E.W.-G.; writing—review and editing, E.W.-G. and D.G. visualization, D.G.; supervision, J.Ž. and A.R.-B.; project administration, and A.R.-B.; funding acquisition, J.Ž. and A.R.-B. All authors have read and agreed to the published version of the manuscript.

Funding

This research was funded by European Social Fund (project No 09.3.3-LMT-K-712-01-0178) under grant agreement with the Research Council of Lithuania (LMTLT).

Institutional Review Board Statement

Not applicable.

Informed Consent Statement

Not applicable.

Data Availability Statement

The data presented in this study are available on request.

Conflicts of Interest

The authors declare no conflict of interest.

References

  1. Kharazmi, R.; Tavili, A.; Rahdari, M.R.; Chaban, L.; Panidi, E.; Rodrigo-Comino, J. Monitoring and Assessment of Seasonal Land Cover Changes Using Remote Sensing: A 30-Year (1987–2016) Case Study of Hamoun Wetland, Iran. Environ. Monit. Assess. 2018, 190, 356. [Google Scholar] [CrossRef] [PubMed]
  2. Brauman, K.A.; Daily, G.C.; Duarte, T.K.; Mooney, H.A. The Nature and Value of Ecosystem Services: An Overview Highlighting Hydrologic Services. Annu. Rev. Environ. Resour. 2007, 32, 67–98. [Google Scholar] [CrossRef]
  3. Hu, H.; Liu, W.; Cao, M. Impact of Land Use and Land Cover Changes on Ecosystem Services in Menglun, Xishuangbanna, Southwest China. Environ. Monit. Assess. 2008, 146, 147–156. [Google Scholar] [CrossRef] [PubMed]
  4. Rimal, B.; Sharma, R.; Kunwar, R.; Keshtkar, H.; Stork, N.E.; Rijal, S.; Rahman, S.A.; Baral, H. Effects of Land Use and Land Cover Change on Ecosystem Services in the Koshi River Basin, Eastern Nepal. Ecosyst. Serv. 2019, 38, 100963. [Google Scholar] [CrossRef]
  5. Shrestha, M.; Acharya, S.C. Assessment of Historical and Future Land-use–Land-cover Changes and Their Impact on Valuation of Ecosystem Services in Kathmandu Valley, Nepal. Land Degrad. Dev. 2021, 32, 3731–3742. [Google Scholar] [CrossRef]
  6. Yin, H.; Pflugmacher, D.; Li, A.; Li, Z.; Hostert, P. Land Use and Land Cover Change in Inner Mongolia—Understanding the Effects of China’s Re-Vegetation Programs. Remote Sens. Environ. 2018, 204, 918–930. [Google Scholar] [CrossRef]
  7. Saintilan, N.; Rogers, K.; Kelleway, J.J.; Ens, E.; Sloane, D.R. Climate Change Impacts on the Coastal Wetlands of Australia. Wetlands 2019, 39, 1145–1154. [Google Scholar] [CrossRef]
  8. Havens, K.; Jeppesen, E. Ecological Responses of Lakes to Climate Change. Water 2018, 10, 917. [Google Scholar] [CrossRef] [Green Version]
  9. Zou, Z.; Dong, J.; Menarguez, M.A.; Xiao, X.; Qin, Y.; Doughty, R.B.; Hooker, K.V.; David Hambright, K. Continued Decrease of Open Surface Water Body Area in Oklahoma during 1984–2015. Sci. Total Environ. 2017, 595, 451–460. [Google Scholar] [CrossRef]
  10. Thompson, R.B.; Incrocci, L.; van Ruijven, J.; Massa, D. Reducing Contamination of Water Bodies from European Vegetable Production Systems. Agric. Water Manag. 2020, 240, 106258. [Google Scholar] [CrossRef]
  11. Sinha, E.; Michalak, A.M.; Balaji, V. Eutrophication Will Increase during the 21st Century as a Result of Precipitation Changes. Science 2017, 357, 405–408. [Google Scholar] [CrossRef] [Green Version]
  12. Akber, A.; Khan, W.R.; Islam, A.; Rahman, M.; Rahman, M.R. Impact of Land Use Change on Ecosystem Services of Southwest Coastal Bangladesh. J. Land Use Sci. 2018, 13, 238–250. [Google Scholar] [CrossRef]
  13. Yim, J.; Kwon, B.-O.; Nam, J.; Hwang, J.H.; Choi, K.; Khim, J.S. Analysis of Forty Years Long Changes in Coastal Land Use and Land Cover of the Yellow Sea: The Gains or Losses in Ecosystem Services. Environ. Pollut. 2018, 241, 74–84. [Google Scholar] [CrossRef]
  14. ZhiYong, L.; Liu, T.; Benediktsson, J.A.; Falco, N. Land Cover Change Detection Techniques: Very-High-Resolution Optical Images: A Review. IEEE Geosci. Remote Sens. Mag. 2021, 2–21. [Google Scholar] [CrossRef]
  15. Talukdar, S.; Singha, P.; Mahato, S.; Pal, S.; Liou, Y.-A.; Rahman, A. Land-Use Land-Cover Classification by Machine Learning Classifiers for Satellite Observations—A Review. Remote Sens. 2020, 12, 1135. [Google Scholar] [CrossRef] [Green Version]
  16. Gavade, A.B.; Rajpurohit, V.S. Systematic Analysis of Satellite Image-Based Land Cover Classification Techniques: Literature Review and Challenges. Int. J. Comput. Appl. 2021, 43, 514–523. [Google Scholar] [CrossRef]
  17. Phiri, D.; Morgenroth, J. Developments in Landsat Land Cover Classification Methods: A Review. Remote Sens. 2017, 9, 967. [Google Scholar] [CrossRef] [Green Version]
  18. O’Donnell, J.; Schalles, J. Examination of Abiotic Drivers and Their Influence on Spartina Alterniflora Biomass over a Twenty-Eight Year Period Using Landsat 5 TM Satellite Imagery of the Central Georgia Coast. Remote Sens. 2016, 8, 477. [Google Scholar] [CrossRef] [Green Version]
  19. Irons, J.R.; Dwyer, J.L.; Barsi, J.A. The next Landsat Satellite: The Landsat Data Continuity Mission. Remote Sens. Environ. 2012, 122, 11–21. [Google Scholar] [CrossRef] [Green Version]
  20. Lulla, K.; Nellis, M.D.; Rundquist, B.; Srivastava, P.; Szabo, S. Mission to Earth: LANDSAT 9 Will Continue to View the World. Geocarto Int. 2021, 36, 2261–2263. [Google Scholar] [CrossRef]
  21. Phiri, D.; Simwanda, M.; Salekin, S.; Nyirenda, V.; Murayama, Y.; Ranagalage, M. Sentinel-2 Data for Land Cover/Use Mapping: A Review. Remote Sens. 2020, 12, 2291. [Google Scholar] [CrossRef]
  22. Manakos, I.; Braun, M. (Eds.) Land Use and Land Cover Mapping in Europe: Practices & Trends; Remote Sensing and Digital Image Processing; Springer: Dordrecht, The Netherlands, 2014; Volume 18, ISBN 978-94-007-7968-6. [Google Scholar]
  23. Aune-Lundberg, L.; Strand, G.-H. The Content and Accuracy of the CORINE Land Cover Dataset for Norway. Int. J. Appl. Earth Obs. Geoinf. 2021, 96, 102266. [Google Scholar] [CrossRef]
  24. Gemitzi, A.; Albarakat, R.; Kratouna, F.; Lakshmi, V. Land Cover and Vegetation Carbon Stock Changes in Greece: A 29-Year Assessment Based on CORINE and Landsat Land Cover Data. Sci. Total Environ. 2021, 786, 147408. [Google Scholar] [CrossRef] [PubMed]
  25. Open Data Science Team Geo-Harmonizer. EU-Wide Automated Mapping System for Harmonization of Open Data Based on FOSS4G and Machine. Available online: https://maps.opendatascience.eu (accessed on 12 January 2022).
  26. Churches, C.E.; Wampler, P.J.; Sun, W.; Smith, A.J. Evaluation of Forest Cover Estimates for Haiti Using Supervised Classification of Landsat Data. Int. J. Appl. Earth Obs. Geoinf. 2014, 30, 203–216. [Google Scholar] [CrossRef] [Green Version]
  27. Li, C.; Wang, J.; Wang, L.; Hu, L.; Gong, P. Comparison of Classification Algorithms and Training Sample Sizes in Urban Land Classification with Landsat Thematic Mapper Imagery. Remote Sens. 2014, 6, 964–983. [Google Scholar] [CrossRef] [Green Version]
  28. Long, J.B.; Giri, C. Mapping the Philippines’ Mangrove Forests Using Landsat Imagery. Sensors 2011, 11, 2972–2981. [Google Scholar] [CrossRef] [Green Version]
  29. Zhang, Y.; Lu, D.; Yang, B.; Sun, C.; Sun, M. Coastal Wetland Vegetation Classification with a Landsat Thematic Mapper Image. Int. J. Remote Sens. 2011, 32, 545–561. [Google Scholar] [CrossRef]
  30. Sun, C.; Fagherazzi, S.; Liu, Y. Classification Mapping of Salt Marsh Vegetation by Flexible Monthly NDVI Time-Series Using Landsat Imagery. Estuar. Coast. Shelf Sci. 2018, 213, 61–80. [Google Scholar] [CrossRef]
  31. Özelkan, E. Water Body Detection Analysis Using NDWI Indices Derived from Landsat-8 OLI. Pol. J. Environ. Stud. 2020, 29, 1759–1769. [Google Scholar] [CrossRef]
  32. Berhane, T.; Lane, C.; Wu, Q.; Autrey, B.; Anenkhonov, O.; Chepinoga, V.; Liu, H. Decision-Tree, Rule-Based, and Random Forest Classification of High-Resolution Multispectral Imagery for Wetland Mapping and Inventory. Remote Sens. 2018, 10, 580. [Google Scholar] [CrossRef] [Green Version]
  33. Akar, Ö.; Güngör, O. Classification of Multispectral Images Using Random Forest Algorithm. J. Geod. Geoinf. 2012, 1, 105–112. [Google Scholar] [CrossRef] [Green Version]
  34. Thanh Noi, P.; Kappas, M. Comparison of Random Forest, k-Nearest Neighbor, and Support Vector Machine Classifiers for Land Cover Classification Using Sentinel-2 Imagery. Sensors 2017, 18, 18. [Google Scholar] [CrossRef] [Green Version]
  35. Zagajewski, B.; Kluczek, M.; Raczko, E.; Njegovec, A.; Dabija, A.; Kycko, M. Comparison of Random Forest, Support Vector Machines, and Neural Networks for Post-Disaster Forest Species Mapping of the Krkonoše/Karkonosze Transboundary Biosphere Reserve. Remote Sens. 2021, 13, 2581. [Google Scholar] [CrossRef]
  36. Frohn, R.C.; D’Amico, E.; Lane, C.; Autrey, B.; Rhodus, J.; Liu, H. Multi-Temporal Sub-Pixel Landsat ETM+ Classification of Isolated Wetlands in Cuyahoga County, Ohio, USA. Wetlands 2012, 32, 289–299. [Google Scholar] [CrossRef]
  37. Sun, W.; Du, B.; Xiong, S. Quantifying Sub-Pixel Surface Water Coverage in Urban Environments Using Low-Albedo Fraction from Landsat Imagery. Remote Sens. 2017, 9, 428. [Google Scholar] [CrossRef] [Green Version]
  38. Mohan, A.; Singh, A.K.; Kumar, B.; Dwivedi, R. Review on Remote Sensing Methods for Landslide Detection Using Machine and Deep Learning. Trans. Emerg. Telecommun. Technol. 2021, 32, e3998. [Google Scholar] [CrossRef]
  39. Audah, S.; Nazliyati; Bakruddin; Saputra, E.; Wathan, S.; Rizky, M.M. Visual Analysis of Satellite Landsat Images Multitemporal and GPS as a Geographic Information System for Mapping of Nugmet Plantations in Tapaktuan. IOP Conf. Ser. Mater. Sci. Eng. 2019, 506, 012037. [Google Scholar] [CrossRef]
  40. Land Viewer Satellite Observation Imagery Tool. Available online: https://eos.com/landviewer/ (accessed on 5 July 2021).
  41. Congedo, L. Semi-Automatic Classification Plugin, Documentation, Release 7.9.7.1 2021. J. Open Source Softw. 2021, 6, 3172. [Google Scholar] [CrossRef]
  42. Weigand, M.; Staab, J.; Wurm, M.; Taubenböck, H. Spatial and Semantic Effects of LUCAS Samples on Fully Automated Land Use/Land Cover Classification in High-Resolution Sentinel-2 Data. Int. J. Appl. Earth Obs. Geoinf. 2020, 88, 102065. [Google Scholar] [CrossRef]
  43. Aznar-Sánchez, J.A.; Velasco-Muñoz, J.F.; Belmonte-Ureña, L.J.; Manzano-Agugliaro, F. The Worldwide Research Trends on Water Ecosystem Services. Ecol. Indic. 2019, 99, 310–323. [Google Scholar] [CrossRef]
  44. Qi, W.; Li, H.; Zhang, Q.; Zhang, K. Forest Restoration Efforts Drive Changes in Land-Use/Land-Cover and Water-Related Ecosystem Services in China’s Han River Basin. Ecol. Eng. 2019, 126, 64–73. [Google Scholar] [CrossRef]
  45. Gozdowski, D.; Žukovskis, J.; Kaziukonytė, K.; Razinkovas-Baziukas, A. Evaluation of Land Cover Changes in Southwestern Lithuania from 1984 to 2018 Using Medium Spatial Resolution Satellite Imagery. Pol. J. Environ. Stud. 2020, 29, 4041–4051. [Google Scholar] [CrossRef]
  46. Lukianas, A.; Vaikasas, S.; Malisauskas, A.P. Water Management Tasks in the Summer Polders of the Nemunas Lowland. Irrig. Drain. 2006, 55, 145–156. [Google Scholar] [CrossRef]
  47. Bielecka, E.; Jenerowicz, A.; Pokonieczny, K.; Borkowska, S. Land Cover Changes and Flows in the Polish Baltic Coastal Zone: A Qualitative and Quantitative Approach. Remote Sens. 2020, 12, 2088. [Google Scholar] [CrossRef]
  48. Vaitkus, G.; Vaitkuvienė, D. Land Cover Changes in the Lithuanian Coastal Zone during 1975–2000. Acta Zool. Litu. 2005, 15, 183–187. [Google Scholar] [CrossRef]
  49. Gadal, S.; Lekavičūtė, J. Remote Sensing Processing Consequences of Political and Economical Changes on Klaipeda County Forests (1986–2005). Hum. Resour. Main Factor Reg. Dev. 2011, 4, 37–47. [Google Scholar]
  50. Gomes, E.; Inácio, M.; Bogdzevič, K.; Kalinauskas, M.; Karnauskaitė, D.; Pereira, P. Future Scenarios Impact on Land Use Change and Habitat Quality in Lithuania. Environ. Res. 2021, 197, 111101. [Google Scholar] [CrossRef] [PubMed]
  51. Kern, K. Governance for Sustainable Development in the Baltic Sea Region. J. Balt. Stud. 2011, 42, 21–35. [Google Scholar] [CrossRef]
  52. Fernández Martínez, P.; de Castro-Pardo, M.; Barroso, V.M.; Azevedo, J.C. Assessing Sustainable Rural Development Based on Ecosystem Services Vulnerability. Land 2020, 9, 222. [Google Scholar] [CrossRef]
  53. Barbier, E.B.; Hacker, S.D.; Kennedy, C.; Koch, E.W.; Stier, A.C.; Silliman, B.R. The Value of Estuarine and Coastal Ecosystem Services. Ecol. Monogr. 2011, 81, 169–193. [Google Scholar] [CrossRef]
  54. Gadal, S.; Gloaguen, T. Environmental Issues in the Coastal Regions of the South-Eastern Baltic Sea: A Sensitive Natural Environment in the Face of Increasing Anthropic Pressures. Baltica 2021, 34, 203–215. [Google Scholar] [CrossRef]
Figure 1. Locations of the studied areas (areas given in square kilometers) on the southern coast of the Baltic Sea next to (A) the Curonian Lagoon, (B) the Vistula Lagoon, and (C) the Szczecin Lagoon.
Sustainability 14 02006 g001
Figure 2. RGB composites based on satellite images from 1984 (Landsat 5) and 2021 (Sentinel-2) used for classification of land cover in locations of the studied areas on southern coast of the Baltic Sea next to the Curonian Lagoon ((A1)—1984-06-04, (A2)—2021-09-09), the Vistula Lagoon ((B1)—1984-11-18, (B2)—2021-09-09) and the Szczecin Lagoon ((C1)—1984-11-14, (C2)—2021-05-31). The same maps are presented in larger size in Supplementary Materials (Figures S1–S6).
Sustainability 14 02006 g002aSustainability 14 02006 g002b
Figure 3. Areas of forest (green color) and water reservoirs (blue color) in 1984 and 2021 in the studied areas in south coast of Baltic Sea next to Curonian Lagoon ((A1)—1984, (A2)—2021), Vistula Lagoon ((B1)—1984, (B2)—2021), and Szczecin Lagoon ((C1)—1984, (C2)—2021). The same maps are presented in larger size in Supplementary Materials (Figures S7–S12).
Sustainability 14 02006 g003aSustainability 14 02006 g003b
Figure 4. Areas of forest in the Polish part of the studied area next to the Szczecin Lagoon in 1984 ((C1)—RGB composite based on Landsat 5 imagery and (C2)—areas classified as forest in green color) where large parts of the forest were cut down, inside a bigger area in 2021 ((C3)—RGB composite based on Sentinel-2 imagery and (C4)—areas classified as forest in green color).
Sustainability 14 02006 g004
Table 1. Satellite images used for classification of land cover types and variables included in the analysis.
Satellite (Sensor)DateLocationBands and Spectral Indices (Spatial Resolution)
Landsat 5 (TM—thematic mapper)1984-06-04A—Curonian Lagoonblue, green, red, near infrared *, NDVI, NDWI (30 m)
Sentinel-2B (MSI—multispectral instrument)2021-09-09A—Curonian Lagoonblue, green, red, near infrared *, NDVI, NDWI (10 m)
Landsat 5 (TM—thematic mapper)1984-11-18B—Vistula Lagoonblue, green, red, near infrared, NDVI, NDWI (30 m)
Sentinel-2B (MSI—multispectral instrument)2021-09-09B—Vistula Lagoonblue, green, red, near infrared, NDVI, NDWI (10 m)
Landsat 5 (TM—thematic mapper)1984-11-14C—Szczecin Lagoonblue, green, red, near infrared, NDVI, NDWI (30 m)
Sentinel-2B (MSI—multispectral instrument)2021-05-31C—Szczecin Lagoonblue, green, red, near infrared, NDVI, NDWI (10 m)
* Wavelengths for Landsat 5 bands: blue: 450–520 nm, green: 520–600 nm, red: 630–690 nm, near infrared: 760–900 nm; wavelengths for Sentinel-2B bands: blue: 459–525 nm, green: 541–577 nm, red: 649–680 nm, near infrared: 780–886 nm.
Table 2. Area of forests (in squared kilometers and as a percentage of total area) in the studied areas in 1984 and 2021 (additionally results from CORINE Land Cover 2018 and Geo-harmonizer 2019 projects).
Area19842021
(A) Lithuania—area next to the Curonian Lagoon152.0 (16.2%)156.5 (16.7%)
CLC *: 173.5, GH **: 172.1
(A) Russia—area next to the Curonian Lagoon244.2 (28.9%)239.7 (28.4%)
(B) Russia—area next to the Vistula Lagoon182.1 (32.5%)184.0 (32.9%)
(B) Poland—area next to the Vistula Lagoon155.6 (32.0%)156.2 (32.1%)
CLC: 167.1; GH: 192.0
(C) Poland—area next to the Szczecin Lagoon418.5 (43.8%)390.0 (40.9%)
CLC 428.2; GH: 447.0
(C) Germany—area next to the Szczecin Lagoon378.3 (41.6%)389.9 (42.8%)
CLC: 415.1; GH: 418.4
* CLC—results based on CORINE Land Cover project from 2018. ** GH—results based on Geo-harmonizer project from 2019.
Table 3. Area of inland water reservoirs (in squared kilometers and as a percentage of total area) in the studied areas in 1984 and 2021 (additionally results from CORINE Land Cover 2018 and Geo-harmonizer 2019 projects).
Area19842021
(A) Lithuania—area next to the Curonian Lagoon16.7 (1.8%)18.1 (1.9%)
CLC *: 30.6; GH **: 22.6
(A) Russia—area next to the Curonian Lagoon10.4 (1.3%)8.4 (1.0%)
(B) Russia—area next to the Vistula Lagoon0.20 (0.04%)1.86 (0.33%)
(B) Poland—area next to the Vistula Lagoon0.04 (0.01%)0.18 (0.03%)
CLC: 0.67; GH: 0.41
(C) Poland—area next to the Szczecin Lagoon62.2 (6.5%)62.5 (6.5%)
CLC: 63.8; GH: 63.2
(C) Germany—area next to the Szczecin Lagoon4.9 (0.54%)4.9 (0.54%)
CLC: 5.4; GH: 5.5
* CLC—results based on CORINE Land Cover project from 2018. ** GH—results based on Geo-harmonizer project from 2019.
Publisher’s Note: MDPI stays neutral with regard to jurisdictional claims in published maps and institutional affiliations.

