Article

Intelligent Data Analysis for Infection Spread Prediction

by
Alexey I. Borovkov
,
Marina V. Bolsunovskaya
and
Aleksei M. Gintciak
*
The World-Class Research Center “Advanced Digital Technologies”, Peter the Great St. Petersburg Polytechnic University, 195251 St. Petersburg, Russia
*
Author to whom correspondence should be addressed.
Sustainability 2022, 14(4), 1995; https://doi.org/10.3390/su14041995
Submission received: 1 December 2021 / Revised: 17 January 2022 / Accepted: 7 February 2022 / Published: 10 February 2022
(This article belongs to the Collection The Impact of Digitalization on the Quality of Life)

Abstract

:
Intelligent data analysis based on artificial intelligence and Big Data tools is widely used by the scientific community to overcome global challenges. One of these challenges is the worldwide coronavirus pandemic, which began in early 2020. Data science not only provides an opportunity to assess the impact caused by a pandemic, but also to predict the infection spread. In addition, the model expansion by economic, social, and infrastructural factors makes it possible to predict changes in all spheres of human activity in competitive epidemiological conditions. This article is devoted to the use of anonymized and personal data in predicting the coronavirus infection spread. The basic “Susceptible–Exposed–Infected–Recovered” model was extended by including a set of demographic, administrative, and social factors. The developed model is more predictive and applicable in assessing future pandemic impact. After a series of simulation experiment results, we concluded that personal data use in high-level modeling of the infection spread is excessive.

1. Introduction

The real value of modern technologies is their ability to overcome global challenges. Undoubtedly, an example of such a challenge is the global COVID-19 pandemic, which has gripped the attention of the world community for more than a year [1,2]. The pandemic is having a massive impact on all spheres of human activity and all areas of the economy, which makes it a global challenge to humanity [3]. Social processes are influenced by the pandemic from various scientific fields.
Of course, the greatest attention to the SARS-CoV-2 virus and the COVID-19 pandemic is riveted in the fields of medicine, biochemistry and molecular biology, immunology, and microbiology. During 2020 and early 2021, Scopus indexed more than 139,000 articles on COVID-19, of which 101,000 were based on the abovementioned areas, which is approximately 73% of the total number of papers on COVID-19. The most significant research in these areas is highlighted in review articles [4,5,6].
However, the attention of the scientific community to the problems of the COVID-19 pandemic is not limited to the fields of biology and medicine. Social and economic sciences are working to predict the possible consequences of the virus and pandemic in order to minimize the negative component of these consequences [7,8]. In the most general sense, the contribution of the social and economic sciences to countering the spread of the virus lies in the design of changes in social and economic institutions in order to best respond to the pandemic as a challenge to the world community [9].
Computer science does not stand aside either. Basically, it is used as a tool in medical and biological research [10,11], but its use is not limited to this. Computer science is used to analyze personal and generalized data on morbidity in certain territories [12], in contact tracing [13,14], and to predict the virus spread [15,16].
Artificial intelligence is an area of computer science that is intended to solve the above problems, but it has its own specifics [17]. There are a number of studies aimed at the automated detection of COVID-19 cases based on symptoms or other indirect signs [18,19]. These and other articles describe COVID-19 detection models based on neural networks designed to reduce the burden of identifying COVID-19 cases.
Another important class of papers consists of articles devoted to predicting the spread of COVID-19 using artificial intelligence technologies and intelligent data analysis [20,21]. These and other papers are based on the statistical analysis of historical data on morbidity, the identification of patterns in the virus spread, and the extrapolation of these patterns. The result of using these models is to forecast estimates on the incidence of COVID-19 in certain territories. These estimates can be used as a basis for making decisions to counter the spread of COVID-19 in certain territories, to adopt restrictions on people’s lifestyles, and to prepare the resources of the healthcare system.
Simulation is the primary data mining tool for predicting the spread of COVID-19 [22]. Simulations are used to model the spread of COVID-19 over large areas [23,24] and within individual facilities [25,26]. Simulation models describe the structures and behavior of systems at different levels, highlighting their key elements. As a result of experiments with this system model, scientists obtain a time series of morbidity data in particular systems. In addition, simulation models provide the ability to test hypotheses. Researchers have the opportunity to find out how certain measures of influence on the system will affect morbidity. This result is important for making management decisions to counter the spread of COVID-19 in various regions.
The use of traditional methods for predicting morbidity (historical analogies, expert assessments) does not take into account the complexity of society as a system and ignores the multiple relationships between various elements of society that affect the spread of the virus. Thus, historical analogies with the SARS-CoV pandemic in 2002–2003, the H1N1 influenza pandemic in 2009–2010, or the Ebola epidemic in 2014–2016 do not take into account the individual characteristics of SARS-CoV-2 that affect its ability to spread in society. In addition, society itself has changed since these epidemics, which makes any estimates of morbidity based on historical analogies far from reality.
Simple mathematical methods also fail to predict the spread of COVID-19 due to its non-linear nature. In complex systems, there are many causal relationships, reinforcing and balancing feedback loops and delays. The system in which the virus spreads is complicated and, in general, cannot be solved by analytical methods. Nevertheless, the mathematical description of dependencies within the system can be used as the basis for a simulation model.
In addition to the tools used in predicting the spread of COVID-19, the input data quality is a key element that affects the quality of the forecast result [27]. It should be understood that the original data may be incomplete, contradictory, or even partially inaccurate. There are ways to obtain stable simulation results in the presence of defects in the original data. These methods are mainly in the areas of computer and data science [28].
Particular attention on the part of researchers and sociologists is focused on the problem of privacy. Some of the data used by researchers to predict the spread of COVID-19 are personal data. There are several differing opinions expressed by the scientific community about this [29,30,31]. In this paper, the authors try to achieve a balance between privacy and the potential public benefit from more accurate predictions. The solution of this dilemma, in a particular case, depends on the formulation of the simulation problem, the set of data required, the potential increase in forecast accuracy from the personal data use, and the potential public benefit from the increase in forecast accuracy, which includes pre-prepared hospital places, time-imposed restrictions, and economic measures. It is not possible to find a unified solution that is applicable with equal success in various cases due to the uniqueness of each case with respect to the above set of factors.

2. Materials and Methods

2.1. Simulation Tools
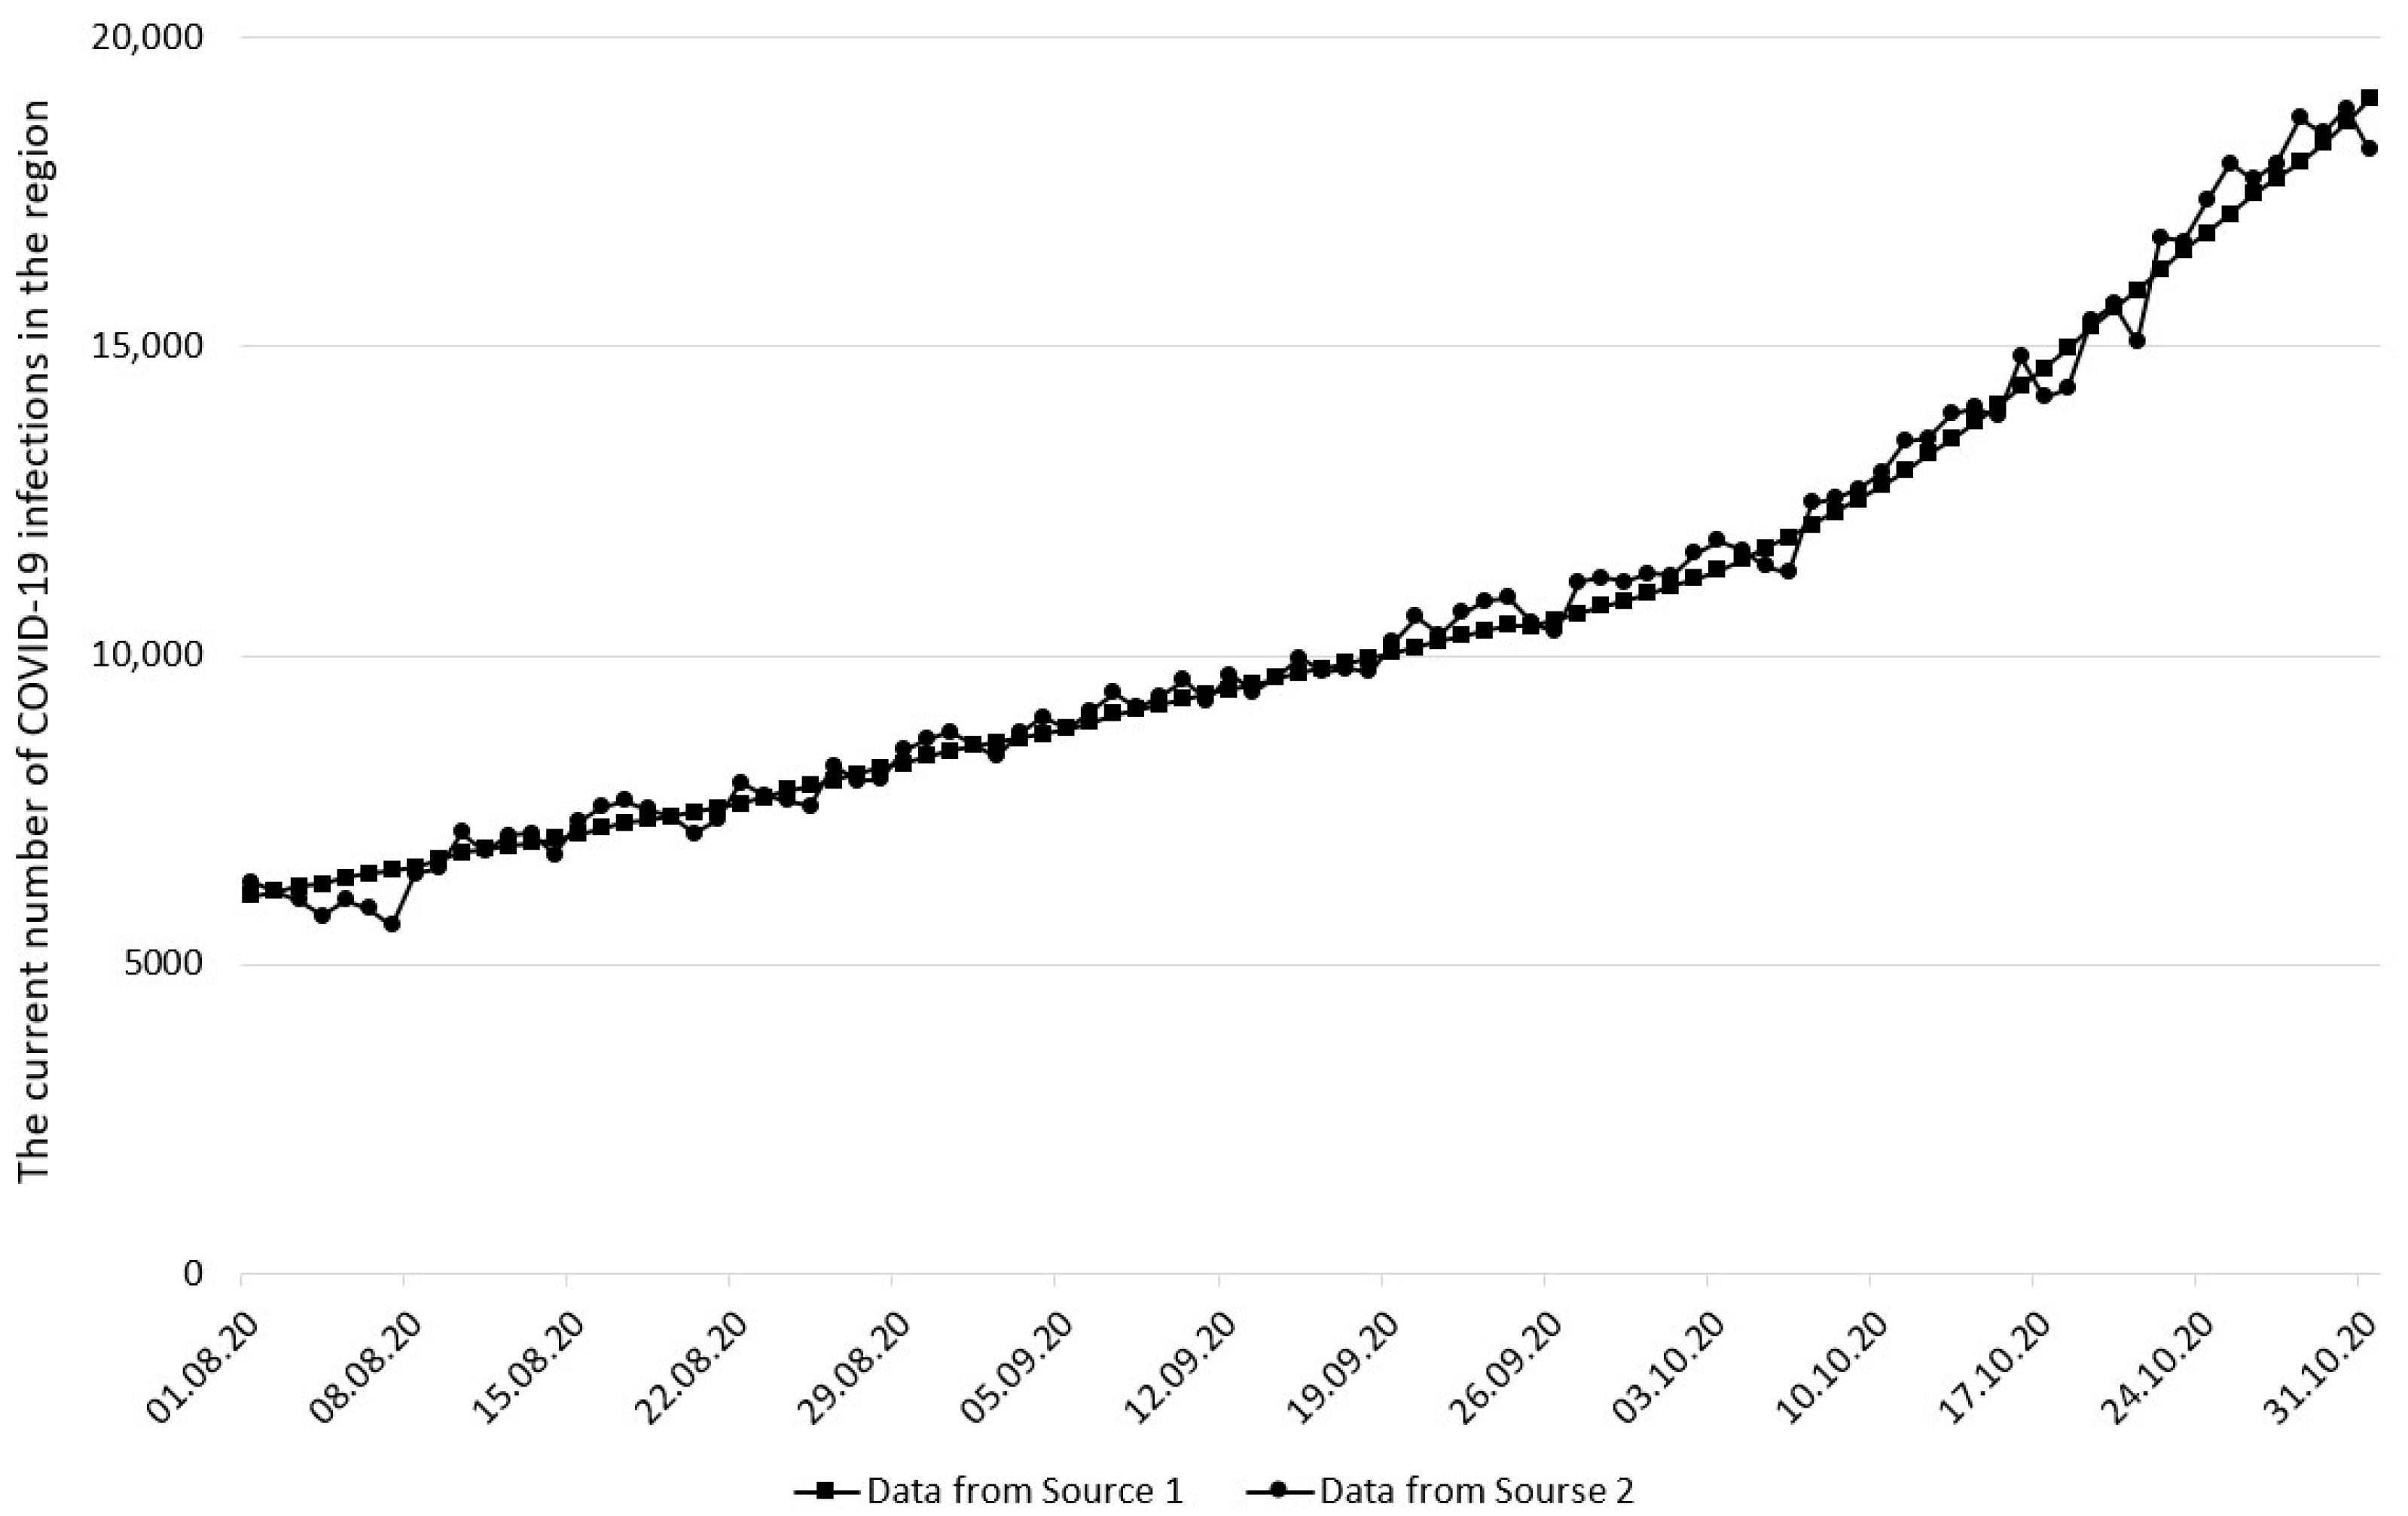
Simulation is proposed as the most practical way to respond to the spread of COVID-19. According to simulation methodology, the real system (region, city, institution) is replaced by a model of this system which has all the properties of the system that affect the spread of COVID-19; as a result, the model imitates the system’s behavior in similar situations. It is assumed that carrying out experiments on a model is equivalent to experiments on a real system. The degree of correspondence of the results of simulation experiments to the behavior of real systems is determined by the accuracy and realism of the model [32,33].
There are several simulation paradigms that define the rules for formalizing the model, the notation for describing the model, the type of mathematical patterns description, and the procedure for conducting simulation experiments [34]. To model the spread of the virus, two main modeling paradigms are used: system dynamics and agent-based modeling.
Agent-based modeling describes a system as a set of agents placed in certain conditions capable of performing conditional actions that affect the system [35,36]. Agent-based modeling is applicable for a relatively small number of agents, which makes it applicable for use in modeling the spread of the virus in small institutions. In addition, agent-based modeling allows the researcher to endow agents with special properties that affect their behavior in various situations; therefore, it is often used in behavior models aimed to predict the behavior of agents under various restrictions [37,38]. When formalizing the model, it is required to indicate individual properties of agents, which is often associated with personal data. Data can be anonymized or aggregated, but this requires additional preprocessing.
In contrast to agent-based modeling, system dynamics does not plunge into the level of individuals and works with high-level and abstract data [39,40]. The system dynamic model is structurally represented by the set of stocks, flows, and converters, which together create feedback loops of different complexity levels. In the mathematical sense, a system dynamic model is a system of differential equations. In this case, the analytical solution for the system of differential equations is replaced by a numerical solution; therefore, the system of differential equations can be arbitrarily complex.
There is a special class of system dynamic models designed to simulate the spread of viruses. They are called SIR models [41], which means “Susceptible–Infected–Recovered”. The basic SIR model divides the entire population of a region into 3 categories—susceptible (S), infected (I), and recovered (R) individuals—and also establishes high-level rules for the transition between these three groups. The speed of transition of individuals from one group to another can be determined by the group size at a given time, by external factors, or by a combination of internal and external factors. To simulate the spread of COVID-19, various modifications of SIR models are used, including additional groups of individuals: exposed (E)–SEIR models [42,43], dead (D)–SIRD models [44], and re-susceptible (D)–SIRS/SIS models [45,46].
As a model for carrying out a simulation experiment, a modified SEIR model with quarantined individuals is used [47]. The basic SEIR model was extended by including a set of demographics and social and economic factors. A special part of the quarantined population was added. The rate of the individuals’ movement between susceptible (S) and quarantined (Q) groups is determined by administrative and social measures affecting the spread of COVID-19. Administrative factors are determined by decrees of regional officials mandating the introduction or removal of restrictions on social and economic behavior for the population [48]. Social factors include the population’s fatigue from compliance with control measures and the awareness of their behavior and compliance with the imposed restrictions.
Adding a new group of individuals corresponds to the process of isolating individuals who are not exposed or infected in order to separate them from those who are potentially infected but not yet detected. These measures were applied on a large scale in many countries at the beginning of the pandemic in 2020 and are now being applied locally to decelerate the spread of COVID-19 as enormous new waves of infection have occurred in certain regions.
This modification of the classical SIR model not only allows the researcher to take into account the presence of the incubation period of the SARS-CoV-2 virus, but also to model various scenarios for establishing and removing restrictions in various economy sectors. Thanks to this extension, the model is more consistent with reality, and the researcher has the opportunity to study the impact of various scenarios for establishing and removing restrictions on the dynamics of morbidity in the region. The model structure is presented in Figure 1.
This model assumes a sequential movement between groups from left to right along the route “S–E–I–R” (Figure 1) with the possibility of temporary isolation in quarantine (“Q”). φ(t) and ω(t) in Figure 1 denote scenarios for establishing and removing restrictions, respectively. The speed of individuals’ transitions along the route “S–E–I–R” is determined by the coefficients β, γ, and δ. In this case, β corresponds to the intensity of effective contacts, leading to new cases of morbidity, and γ and δ are quantities inversely proportional to the duration of the incubation period and of the disease, respectively.
Algorithmically, this model is a system of five differential equations [47], each of which corresponds to its own group of individuals. The modeling process involves numerically solving a differential equations system for a given set of parameter values. The values of the parameters are determined during the calibration process in such a way that the model dynamics of the COVID-19 spread with the greatest degree of accuracy correspond to the real data on the historical interval. The process of numerically solving a system of differential equations is implemented in the Python programming language, including the process of selecting parameters during the calibration process.

2.2. Input Data

To calibrate the model, historical data on the current number of COVID-19 infections in St. Petersburg, Russian Federation, from 1 August 2020 to 31 October 2020 (three months), were used. This time interval corresponds to complete and consistent datasets from two official sources (to be described further). In addition, for a historical perspective, this period turned out to be the initial stage of a large wave that lasted in St. Petersburg until the beginning of the summer of 2021. In this regard, it is advisable to identify the characteristics of the COVID-19 spread over the wave by calibrating the model on the given dataset.
Datasets consist of a single variable: the current number of COVID-19-infected individuals in the region. This variable is available in several sources, which makes it possible to compare simulation results with calibration results on datasets from different sources. The time increment of one day is used.
To assess the impact of personal data on the accuracy of the COVID-19 spread forecast during modeling, two data sources are used.
Data Source 1: official data of the situational headquarters of the Federal Service for Surveillance on Consumer Rights Protection and Human Wellbeing (Available online: https://coronavirus-monitor.ru/coronavirus-v-sankt-peterburge/, last accessed 15 May 2021).
Data Source 2: official data provided by the regional executive agencies in the field of healthcare in St. Petersburg.
These two data sources have different methods of collecting and processing data, as well as different frequency in their updates, which explains the differences in the data series. However, there is a fundamental difference in the nature of the data. Data from Source 1 are initially collected and processed in an aggregated form, which excludes the possibility of personal data there. Data from Source 2, on the other hand, are collected with the presence of personal data, before being processed and then depersonalized. For this reason, data from Source 2 are potentially more accurate. A comparison of data from Source 1 with data from Source 2 is provided in Figure 2.
Data from Source 2 have more fluctuations, which are explained by differences in the methodology for collecting and processing the data. One of these differences, for example, may be weekly seasonality or the peculiarities of accounting for incoming and outgoing patients between data fixation points. At the same time, it is noticeable that the overall incidence rate according to data from both sources is quite the same, so it is reasonable to conclude that the data are not contradictory.

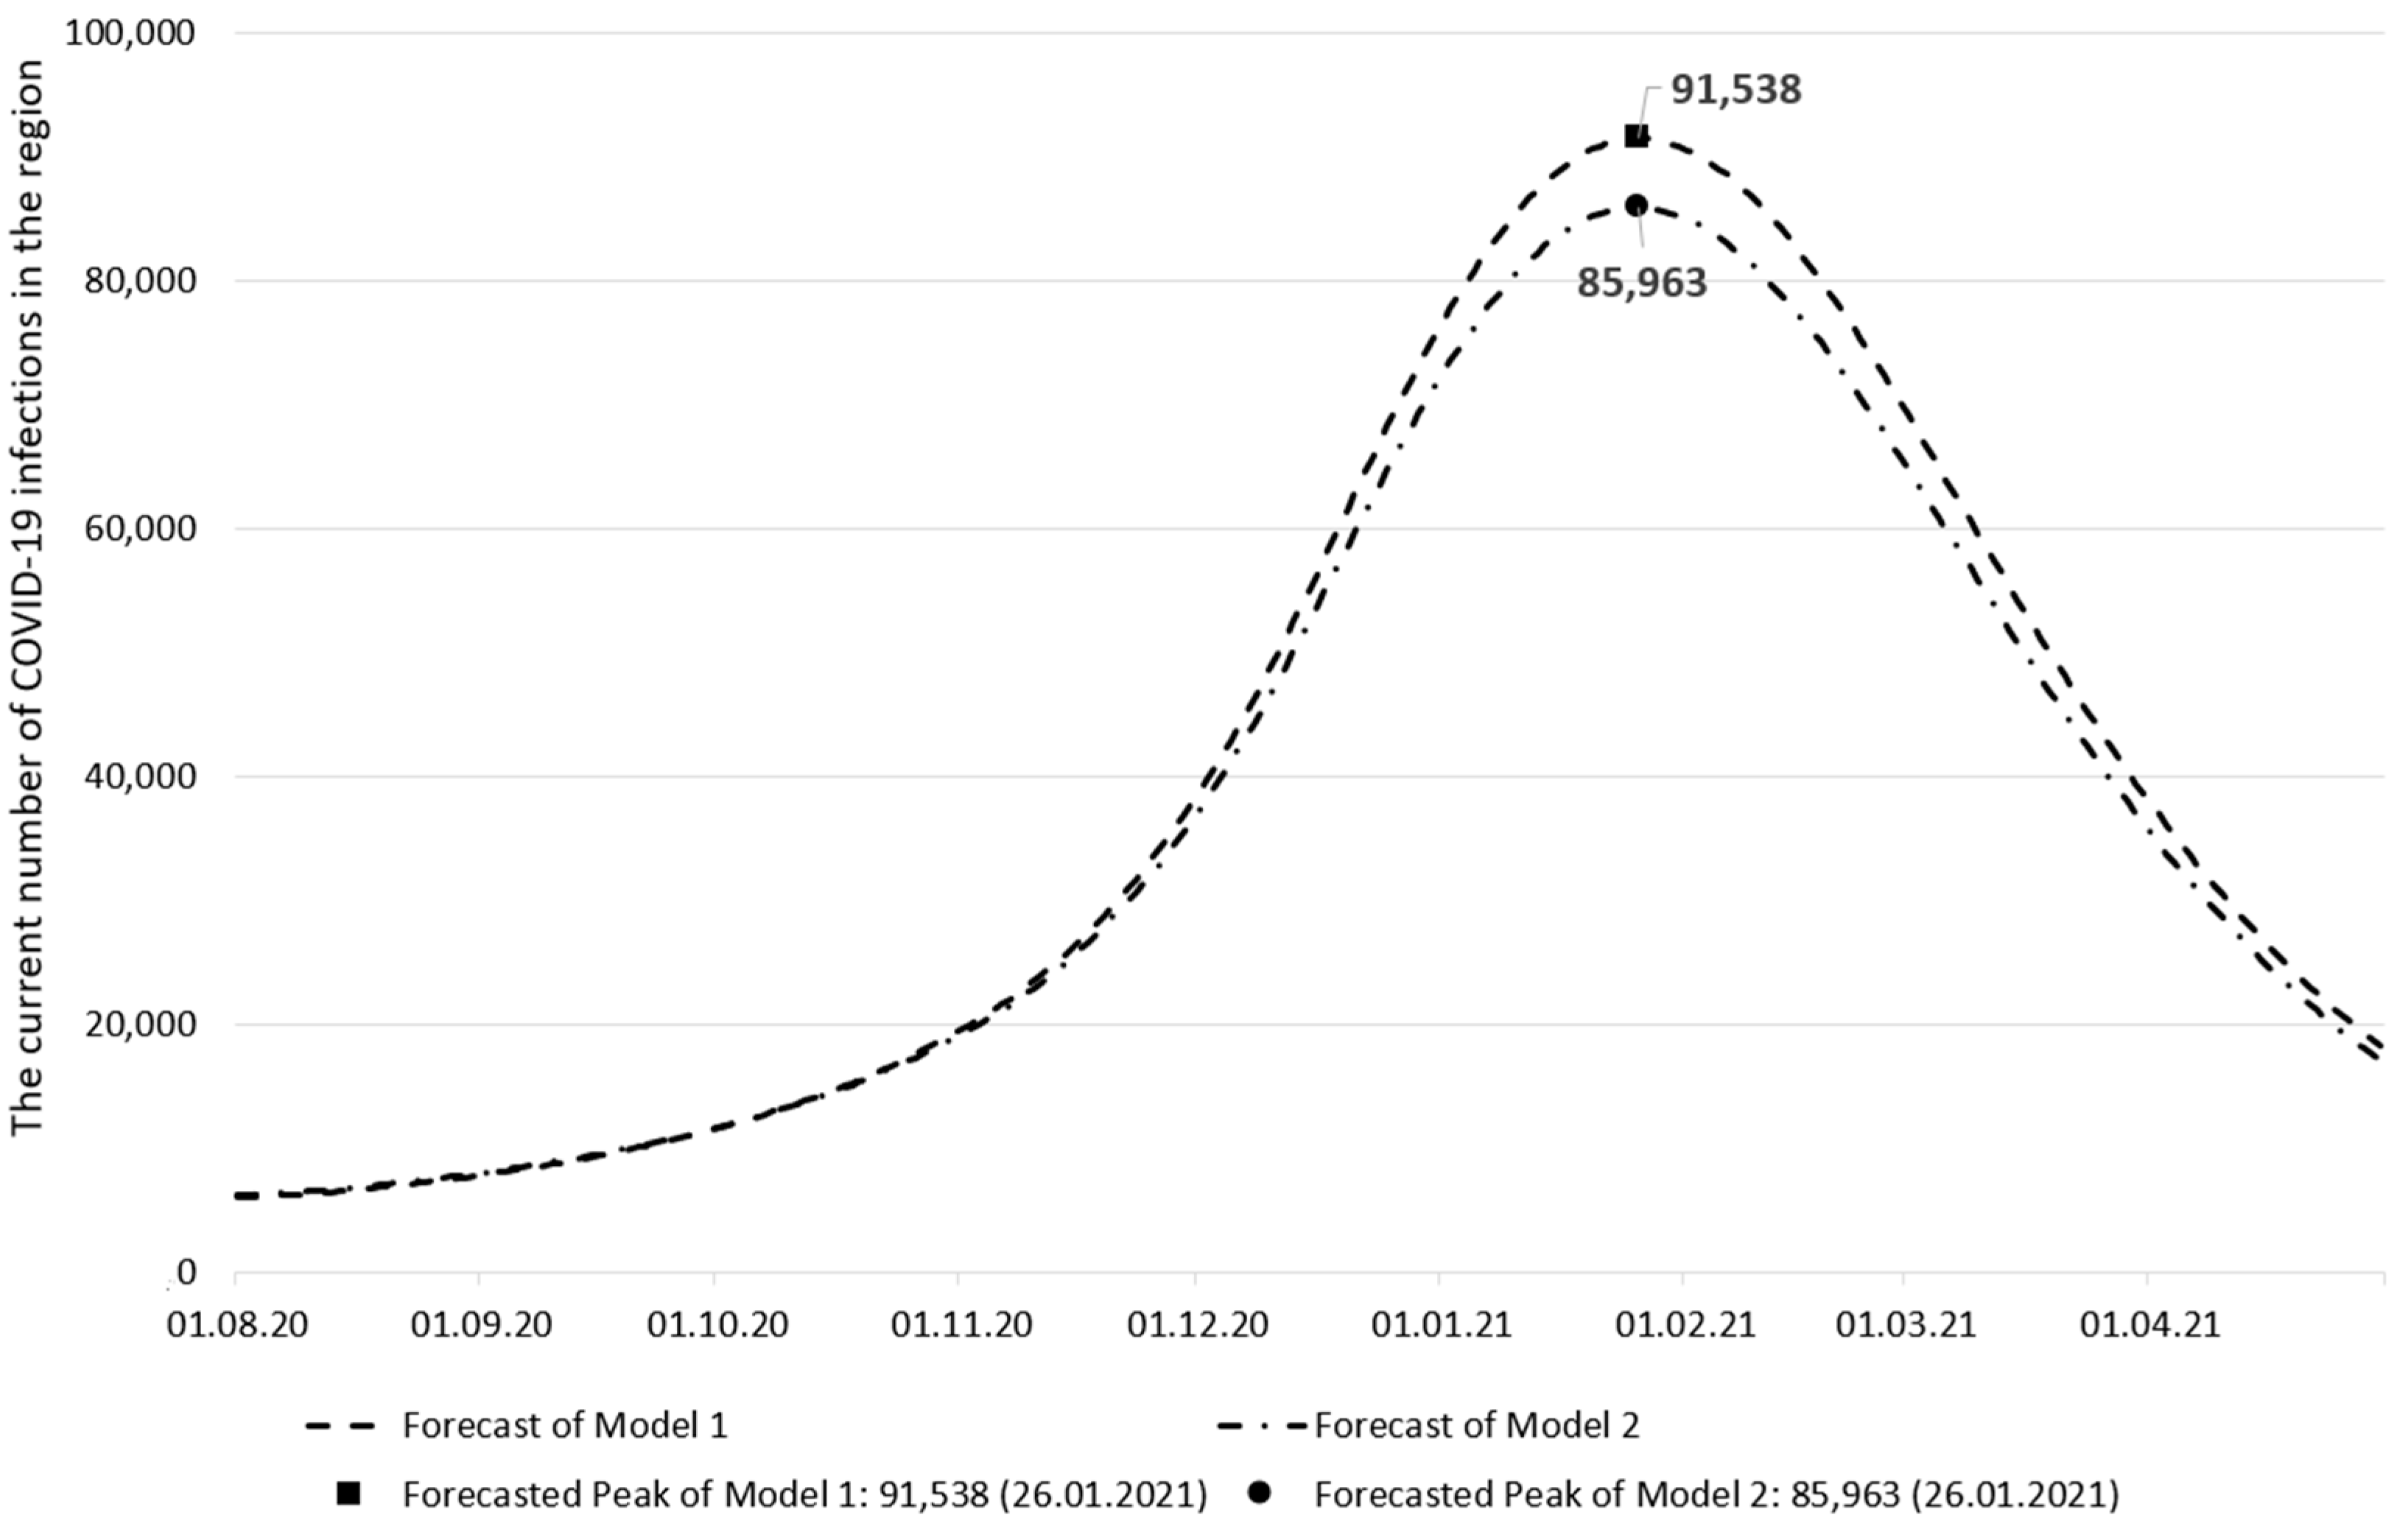
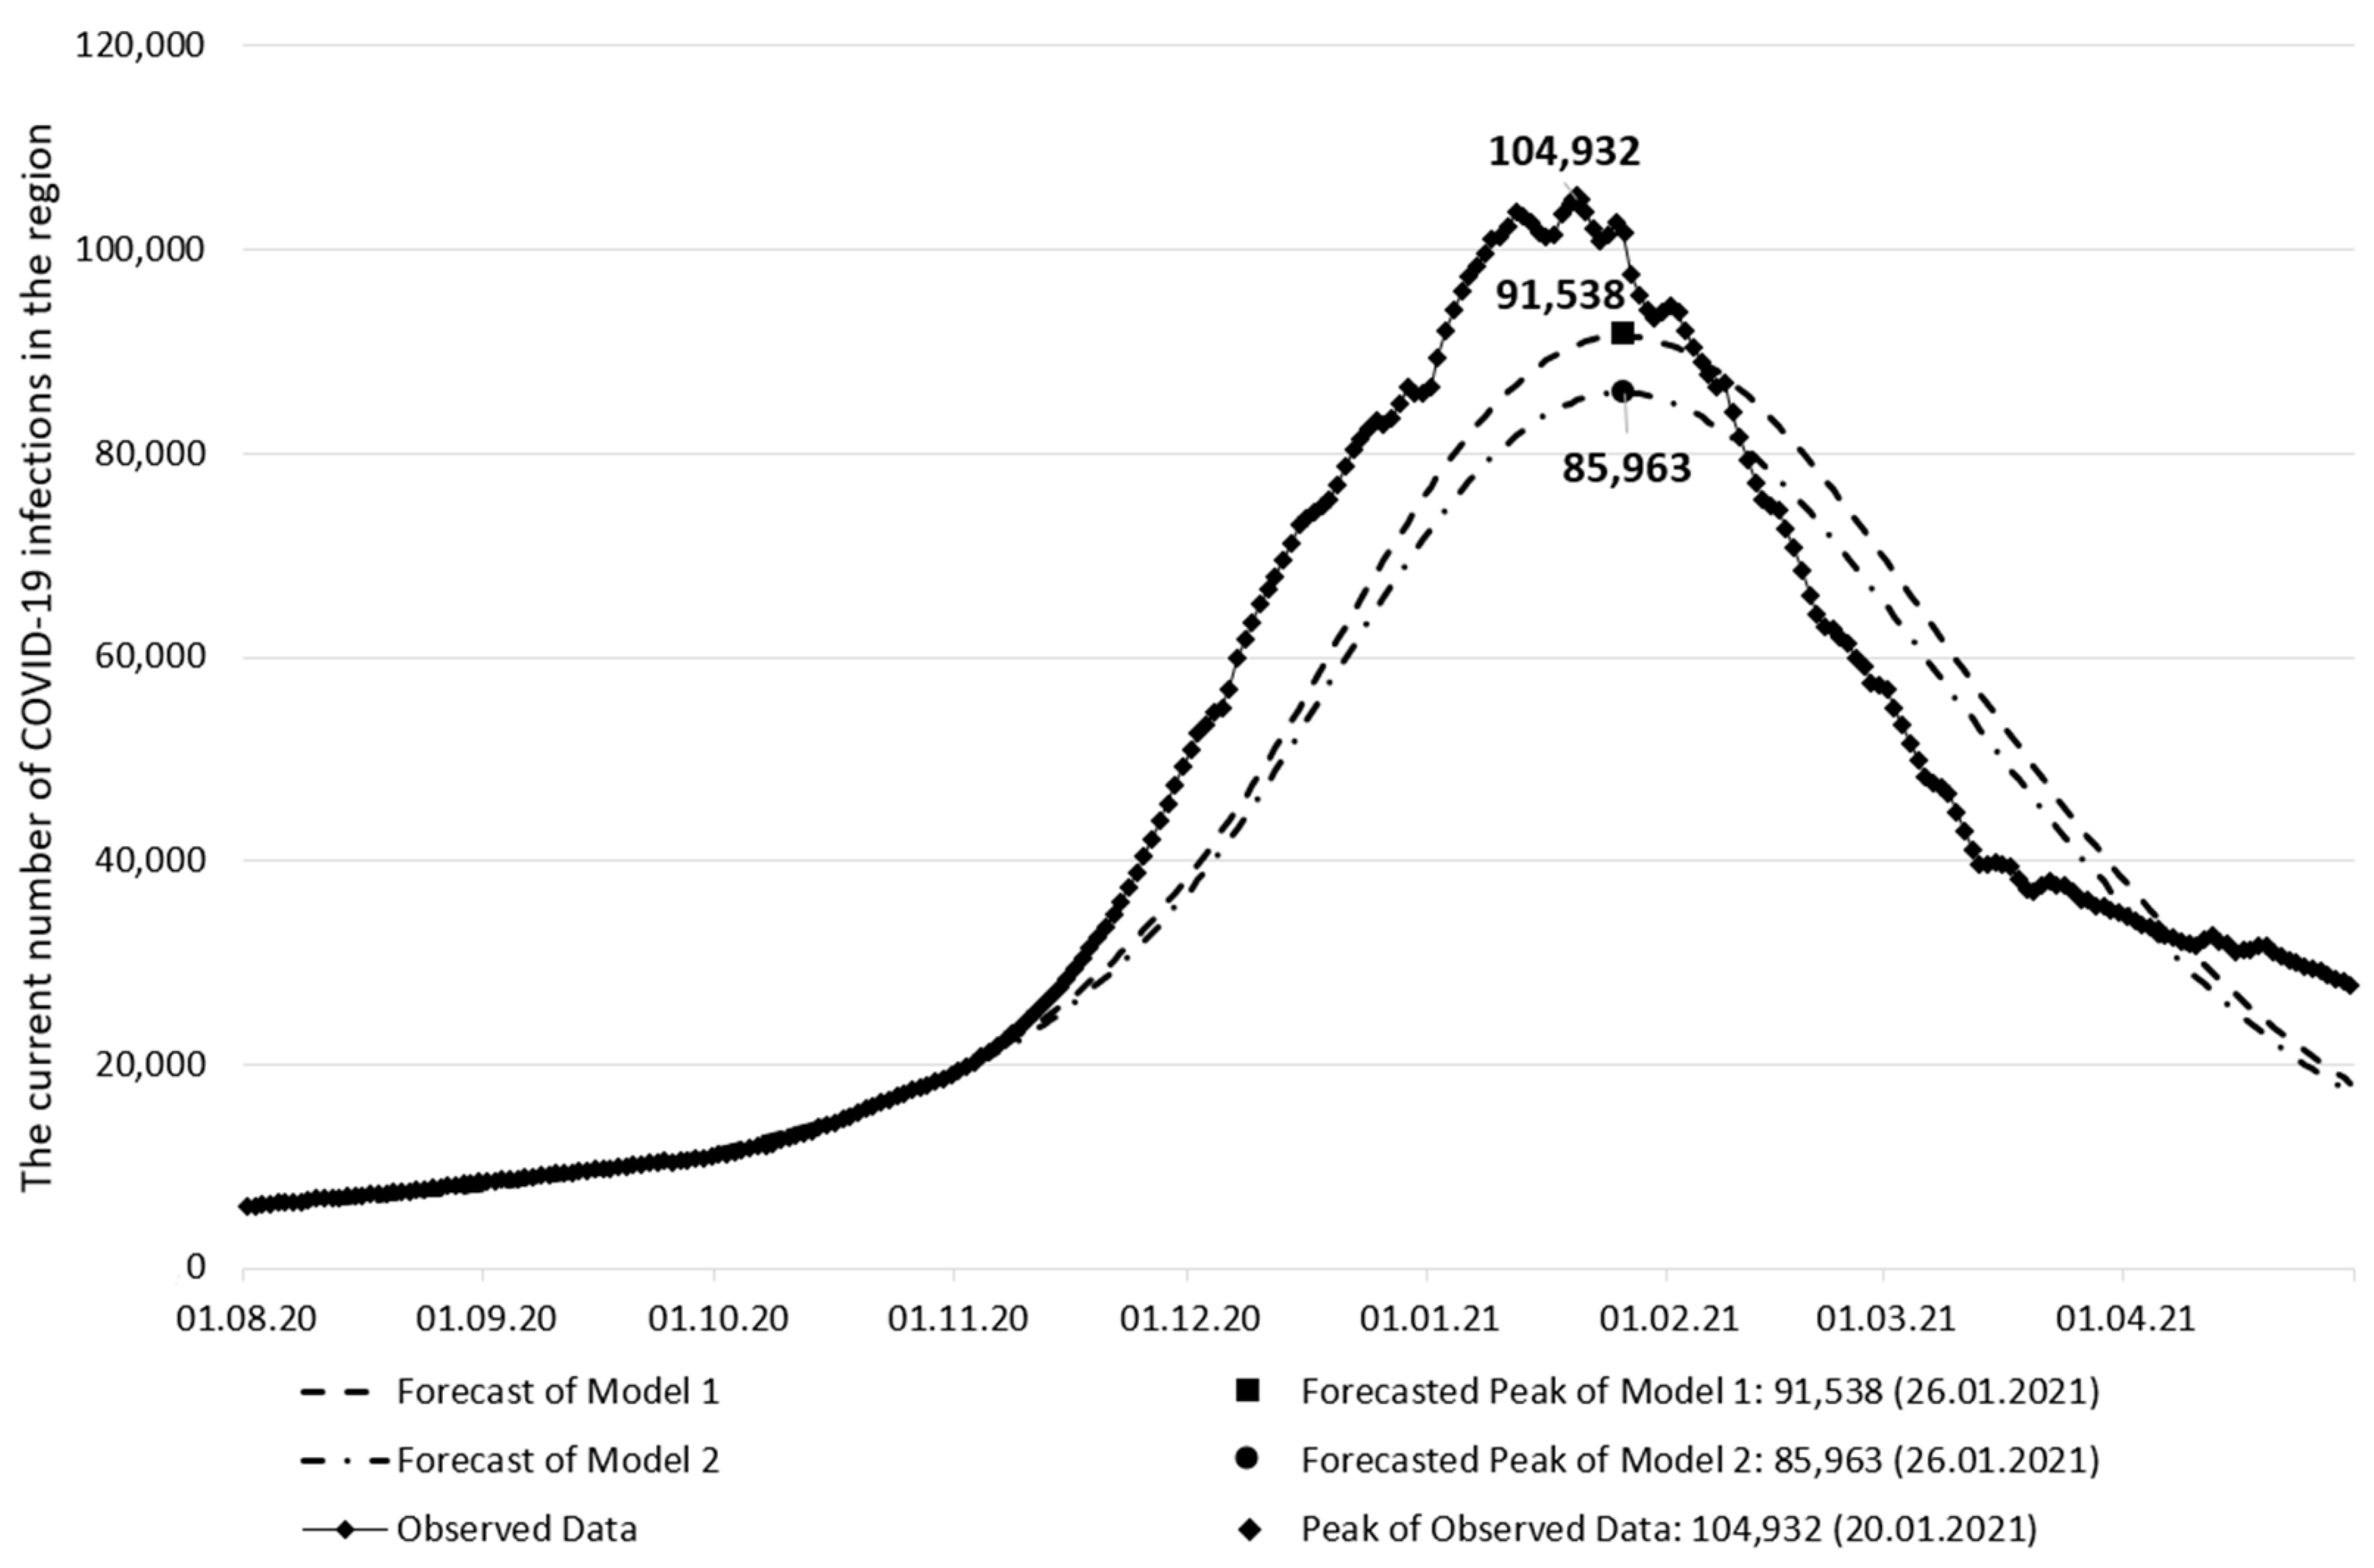
3. Results and Discussion

This section is divided into subheadings and aims to provide a concise and precise description of the experimental results, their interpretation, and the experimental conclusions that can be drawn.
The model was calibrated separately on two datasets: data from Source 1 and data from Source 2. The model parameters obtained as a result of the calibration are presented in Table 1.
A negative value for the isolation efficiency is believed to indicate population tiredness from complying with the restrictions associated with COVID-19. This phenomenon has been repeatedly described, for example in the works of [49,50]. Constraint tiredness is psychological in nature and is associated with the long-term refusal of individuals to perform habitual social activities during the COVID-19 pandemic.
The parameters of the models are close to each other due to the fact that the series of input data show a general trend and differ insignificantly, primarily in terms of fluctuations. The presence of fluctuations also explains the lower coefficient of determination for the model based on data from Source 2.
The remaining parameters (the number of individuals in different groups, modeling time, other input parameters) for both models coincide with and correspond to the epidemiological and demographic situation in St. Petersburg as of 1 August 2020.
Simulation experiments were carried out with both models using the original data obtained as a result of calibration. The main modeled parameter was the current number of infected. Simulation experiments were carried out using self-made software that implements the modified SEIR model with quarantined individuals using the Python programming language. The simulation time included 6 months from the end date of the input data (from 1 November 2020 to 30 April 2021). The simulation experiment results are provided in Figure 3.
The predicted data series obtained as a result of simulation experiments with both models are of the same nature, which is due to two factors. Firstly, the use of a common model structure (a modified SEIR model with quarantined individuals) means that, in both models, the same laws of structural elements interrelation operate; that is, the models are similar to each other. Secondly, the initial data for modeling in both models differ slightly from each other. Under such conditions, the different nature of the simulation results is possible only if the initial data in different models are located on opposite sides of the bifurcation point, which does not happen in this case.
As the main quantitative forecasting metrics, the peak date of the current number of infected and the current number of infected on this date are proposed. These indicators are critical for the healthcare system, as they affect the requirements for available resources (hospital beds, medical ventilators).
As shown in Figure 3, both models predict the same peak date for the current number of infections (26 January 2021), but the current number of infections on that date differs by 6% (91,538 vs. 85,963). This difference is insignificant, as observed in medium-term forecasts.
Table 2 compares the key quantitative forecast metrics of both models with those actually observed in St. Petersburg. The observed data are provided by the situational headquarters of the Federal Service for Surveillance on Consumer Rights Protection and Human Wellbeing (Available online: https://coronavirus-monitor.ru/coronavirus-v-sankt-peterburge/, last accessed 15 May 2021).
Comparison of the predicted data series of the infected current number with the actually observed one is provided in Figure 4.
When comparing quantitative metrics, it is possible to conclude that the forecasting accuracy of the peak date of the current infected number is the same for both models, while the forecasting accuracy of the current infected number on the peak date is better for the first model. Note that the predicted values of the current infected number on the peak date for both models are closer to each other than to the actually observed corresponding value. This means that the predictive accuracy of both models can be considered approximately the same.
The discrepancy between the predicted and observed incidence values could arise for a number of reasons associated with changes in the modeled system during the modeling process. Despite the fact that the general nature of the observed data is homogeneous (i.e., corresponds to the one wave of the spread of the disease), there are small unaccounted administrative changes in the region that affect the dynamics of the COVID-19 spread. In addition, a limitation of the model is that it does not take into account a number of unknown factors, such as the psychology of the population [51,52], the weather [53,54], or other factors [55,56,57].
As a rule, the accuracy of forecasting the spread of viral diseases decreases with an increase in the forecasting period [58]. This is because the predictive power of any model decreases over time. There are models for predicting the spread of COVID-19, the accuracy of which can reach 98–99% in the perspective of 7 days in the absence of significant events that change the characteristics of the spread of the disease [59,60]. Predicting the spread of COVID-19 over the longer term presents the challenges of a changing system. When the epidemiological situation changes, administrative measures are taken and the behavior of the population changes; therefore, long-term forecasts often lose their relevance. For example, achieving an accuracy of 90–92% when forecasting for a period of 1 month is only possible if no new administrative measures are taken and the behavior of the population does not change significantly [61]. In this regard, achieving an accuracy of 82–88% in predicting the peak incidence in St. Petersburg 3 months in advance can be considered a successful result.
Thus, a comparison of two models based on different types of data (public and private) demonstrated that the use of more accurate data containing personal information does not give a significant increase in accuracy when predicting the spread of infection. This is presumably because the processes of the infection spread are not critically dependent on low-level data associated with personal data. At the regional level, statistical processing of data averages all the characteristics of individuals, presenting society as a whole.
The class of SIR models does not go deep into the individual characteristics of each person, such as gender, age, social status, occupation, health characteristics, and others. Modeling the infection spread in large societies allows the researcher to ignore the differences between individuals, assuming that the entire population of the region consists of the same average individuals. This assumption greatly simplifies the modeling process without significantly reducing the forecast accuracy. The use of personal data in such models does not improve the quality of the forecast results, as shown by a series of simulation experiments in this paper.
This conclusion concerns only system dynamic models, based on their common features. At the same time, in the class of agent-based models, the significance of personal data can be fundamentally different. This is due to the fact that, in agent-based models, each individual is modeled as an agent with inherent characteristics that, according to the researcher’s intention, can affect the spread of infection. Among these characteristics, data belonging to the class of personal data can also be distinguished. In this case, it is critically important for the researcher to find a balance between adhering to the rules for working with personal data and increasing the accuracy of their predictions, which, in the event of dangerous infections, can cost human lives.

4. Conclusions

This paper proposes an approach to assess the need to use personal data to predict infection spread. Within the framework of this approach, a forecast of the current number of those infected with COVID-19 in St. Petersburg was carried out based on two datasets. The first dataset was initially collected and processed in an aggregated form, and the second one was based on personal data. To perform the forecast, a modified SEIR model with quarantined individuals was used, which, in comparison with the traditional SEIR model, allowed us to take into account the restrictions applied in the region.
However, the model does not consider other factors influencing the spread of COVID-19. The main such factors are vaccination and re-infection. These factors add new groups of individuals to the model and new flows between groups of individuals. There are also less significant factors that affect the rate of transition of individuals between groups, for example, weather, behavioral characteristics of the population, and the duration of treatment for the disease. Extending the model with these factors will make the forecast results more accurate and realistic.
The modeling results showed that the use of personal data is excessive for predicting the infection spread using models of system dynamics, which is also explained by the peculiarities of system dynamic modeling in general. The use of models of other classes presumably increases the need for the use of personal data, which, on the one hand, is a limitation for the use of models by individual researchers, but on the other hand has the potential to improve the accuracy of forecasts. Better forecasts can enable the healthcare system and the government to better prepare for rising incidences by applying the necessary restrictions and preparing the necessary resources to counter the infection spread, which can save many human lives. At the same time, the researcher must not forget about the norms for working with personal data, which is also one of the highest values at the present time.

Author Contributions

Conceptualization, A.I.B.; data curation, A.M.G.; formal analysis, A.M.G.; funding acquisition, M.V.B.; investigation, A.M.G.; project administration, M.V.B.; supervision, A.I.B.; writing—original draft, A.M.G. All authors have read and agreed to the published version of the manuscript.

Funding

This research is funded by the Ministry of Science and Higher Education of the Russian Federation as part of the World-Class Research Center Program: Advanced Digital Technologies (contract No. 075-15-2020-934 dated 17 December 2020).

Institutional Review Board Statement

Not applicable.

Informed Consent Statement

Not applicable.

Data Availability Statement

Not applicable.

Conflicts of Interest

The authors declare no conflict of interest.

References

  1. Ali, I.; Alharbi, O.M.L. COVID-19: Disease, management, treatment, and social impact. Sci. Total Environ. 2020, 728, 138861. [Google Scholar] [CrossRef] [PubMed]
  2. Huang, H.; Fan, C.; Li, M.; Nie, H.L.; Wang, F.B.; Wang, H.; Wang, R.; Xia, J.; Zheng, X.; Zuo, X.; et al. COVID-19: A Call for Physical Scientists and Engineers. ACS Nano 2020, 14, 3747–3754. [Google Scholar] [CrossRef] [PubMed] [Green Version]
  3. Berawi, M.A. Empowering Healthcare, Economic and Social Resilience during Global Pandemic Covid-19. Int. J. Technol. 2020, 11, 436. [Google Scholar] [CrossRef]
  4. Rothan, H.A.; Byrareddy, S.N. The epidemiology and pathogenesis of coronavirus disease (COVID-19) outbreak. J. Autoimmun. 2020, 109, 102433. [Google Scholar] [CrossRef] [PubMed]
  5. Sohrabi, C.; Alsafi, Z.; O’Neill, N.; Khan, M.; Kerwan, A.; Al-Jabir, A.; Iosifidis, C.; Agha, R. World Health Organization declares global emergency: A review of the 2019 novel coronavirus (COVID-19). Int. J. Surg. 2020, 76, 71–76. [Google Scholar] [CrossRef]
  6. Peeri, N.C.; Shrestha, N.; Rahman, M.S.; Zaki, R.; Tan, Z.; Bibi, S.; Baghbanzadeh, M.; Aghamohammadi, N.; Zhang, W.; Haque, U. The SARS, MERS and novel coronavirus (COVID-19) epidemics, the newest and biggest global health threats: What lessons have we learned? Int. J. Epidemiol. 2020, 49, 717–726. [Google Scholar] [CrossRef] [Green Version]
  7. Narayan, P.K.; Phan, D.H.B.; Liu, G. COVID-19 lockdowns, stimulus packages, travel bans, and stock returns. Financ. Res. Lett. 2021, 38, 101732. [Google Scholar] [CrossRef]
  8. Bol, D.; Giani, M.; Blais, A.; Loewen, P.J. The effect of COVID-19 lockdowns on political support: Some good news for democracy? Eur. J. Political Res. 2021, 60, 497–505. [Google Scholar] [CrossRef]
  9. Akhtaruzzaman, M.; Boubaker, A.; Sensoy, A. Financial contagion during COVID-19 crisis. Financ. Res. Lett. 2021, 38, 101604. [Google Scholar] [CrossRef]
  10. Wang, J. Fast Identification of Possible Drug Treatment of Coronavirus Disease-19 (COVID-19) through Computational Drug Repurposing Study. J. Chem. Inf. Modeling 2020, 60, 3277–3286. [Google Scholar] [CrossRef]
  11. Patchsung, M.; Jantarug, K.; Pattama, A.; Aphicho, K.; Suraritdechachai, S.; Meesawat, P.; Sappakhaw, K.; Leelahakorn, N.; Ruenkam, T.; Wongsatit, T.; et al. Clinical validation of a Cas13-based assay for the detection of SARS-CoV-2 RNA. Nat. Biomed. Eng. 2020, 4, 1140–1149. [Google Scholar] [CrossRef] [PubMed]
  12. Linka, K.; Peirlinck, M.; Sahli Costabal, F.; Kuhl, E. Outbreak dynamics of COVID-19 in Europe and the effect of travel restrictions. Comput. Methods Biomech. Biomed. Eng. 2020, 23, 710–717. [Google Scholar] [CrossRef]
  13. Ahmed, N.; Michelin, R.A.; Xue, W.; Ruj, S.; Malaney, R.; Kanhere, S.S.; Seneviratne, A.; Hu, W.; Janicke, H.; Jha, S.K. A Survey of COVID-19 Contact Tracing Apps. IEEE Access 2020, 8, 134577–134601. [Google Scholar] [CrossRef]
  14. Lampos, V.; Majumder, M.S.; Yom-Tov, E.; Edelstein, M.; Moura, S.; Hamada, Y.; Rangaka, M.X.; McKendry, R.A.; Cox, I.J. Tracking COVID-19 using online search. Digit. Med. 2021, 4, 17. [Google Scholar] [CrossRef] [PubMed]
  15. Zhao, S.; Chen, H. Modeling the epidemic dynamics and control of COVID-19 outbreak in China. Quant. Biol. 2020, 8, 11–19. [Google Scholar] [CrossRef] [Green Version]
  16. Nikolopoulos, K.; Punia, S.; Schäfers, A.; Tsinopoulos, C.; Vasilakis, C. Forecasting and planning during a pandemic: COVID-19 growth rates, supply chain disruptions, and governmental decisions. Eur. J. Oper. Res. 2021, 290, 99–115. [Google Scholar] [CrossRef]
  17. Naudé, W. Artificial intelligence vs COVID-19: Limitations, constraints and pitfalls. AI Soc. 2020, 35, 761–765. [Google Scholar] [CrossRef]
  18. Ozturk, T.; Talo, M.; Yildirim, E.A.; Baloglu, U.B.; Yildirim, O.; Rajendra Acharya, U. Automated detection of COVID-19 cases using deep neural networks with X-ray images. Comput. Biol. Med. 2020, 121, 103792. [Google Scholar] [CrossRef]
  19. Loey, M.; Smarandache, F.; M. Khalifa, N.E. Within the Lack of Chest COVID-19 X-ray Dataset: A Novel Detection Model Based on GAN and Deep Transfer Learning. Symmetry 2020, 12, 651. [Google Scholar] [CrossRef] [Green Version]
  20. Ardabili, S.F.; Mosavi, A.; Ghamisi, P.; Ferdinand, F.; Varkonyi-Koczy, A.R.; Reuter, U.; Rabczuk, T.; Atkinson, P.M. COVID-19 Outbreak Prediction with Machine Learning. Algorithms 2020, 13, 249. [Google Scholar] [CrossRef]
  21. Zheng, N.; Du, S.; Wang, J.; Zhang, H.; Cui, W.; Kang, Z.; Yang, T.; Lou, B.; Chi, Y.; Long, H.; et al. Predicting COVID-19 in China Using Hybrid AI Model. IEEE Trans. Cybern. 2020, 50, 2891–2904. [Google Scholar] [CrossRef] [PubMed]
  22. Currie, C.S.M.; Fowler, J.W.; Kotiadis, K.; Monks, T.; Onggo, B.S.; Robertson, D.A.; Tako, A.A. How simulation modelling can help reduce the impact of COVID-19. J. Simul. 2020, 14, 83–97. [Google Scholar] [CrossRef] [Green Version]
  23. Peter, O.; Shaikh, A.; Ibrahim, M.; Sooppy Nisar, K.; Baleanu, D.; Khan, I.; Abioye, A. Analysis and Dynamics of Fractional Order Mathematical Model of COVID-19 in Nigeria Using Atangana-Baleanu Operator. Comput. Mater. Contin. 2021, 66, 1823–1848. [Google Scholar] [CrossRef]
  24. Small, M.; Cavanagh, D. Modelling Strong Control Measures for Epidemic Propagation with Networks—A COVID-19 Case Study. IEEE Access 2020, 8, 109719–109731. [Google Scholar] [CrossRef] [PubMed]
  25. Cuevas, E. An agent-based model to evaluate the COVID-19 transmission risks in facilities. Comput. Biol. Med. 2020, 121, 103827. [Google Scholar] [CrossRef] [PubMed]
  26. Hernandez-Vargas, E.A.; Velasco-Hernandez, J.X. In-host Mathematical Modelling of COVID-19 in Humans. Annu. Rev. Control 2020, 50, 448–456. [Google Scholar] [CrossRef]
  27. Redko, S.G.; Shadrin, A.D. Quality Assessment in cyber-physical systems. In Cyber-Physical Systems and Control; Arseniev, D.G., Overmeyer, L., Kälviäinen, H., Katalinić, B., Eds.; Springer International Publishing: Cham, Switzerland, 2020; pp. 124–130. [Google Scholar]
  28. Santosh, K.C. COVID-19 Prediction Models and Unexploited Data. J. Med. Syst. 2020, 44, 170. [Google Scholar] [CrossRef]
  29. Taylor, L. The price of certainty: How the politics of pandemic data demand an ethics of care. Big Data Soc. 2020, 7, 1–7. [Google Scholar] [CrossRef]
  30. Chowdhury, M.J.M.; Ferdous, M.S.; Biswas, K.; Chowdhury, N.; Muthukkumarasamy, V. COVID-19 Contact Tracing: Challenges and Future Directions. IEEE Access 2020, 8, 225703–225729. [Google Scholar] [CrossRef]
  31. Ahmad, N.; Chauhan, P. State of Data Privacy During COVID-19. Computer 2020, 53, 119–122. [Google Scholar] [CrossRef]
  32. Upadhyay, R.K.; Roy, P. Spread of a disease and its effect on population dynamics in an eco-epidemiological system. Commun. Nonlinear Sci. Numer. Simul. 2014, 19, 4170–4184. [Google Scholar] [CrossRef]
  33. Tsvetkova, N.A.; Tukkel, I.L.; Ablyazov, V.I. Simulation modeling the spread of innovations. In Proceedings of the XX IEEE International Conference on Soft Computing and Measurements (SCM), Saint Petersburg, Russia, 24–26 May 2017; pp. 675–677. [Google Scholar]
  34. García- García, J.A.; Enríquez, J.G.; Ruiz, M.; Arévalo, C.; Jiménez-Ramírez, A. Software Process Simulation Modeling: Systematic literature review. Comput. Stand. Interfaces 2020, 70, 103425. [Google Scholar] [CrossRef]
  35. Silva, P.L.C.; Batista, P.V.C.; Lima, H.S.; Alves, M.A.; Guimarães, F.G.; Silva, R.C.P. COVID-ABS: An agent-based model of COVID-19 epidemic to simulate health and economic effects of social distancing interventions. Chaos Solitons Fractals 2020, 139, 110088. [Google Scholar] [CrossRef] [PubMed]
  36. Shamil, M.S.; Farheen, F.; Ibtehaz, N.; Khan, I.M.; Rahman, M.S. An Agent-Based Modeling of COVID-19: Validation, Analysis, and Recommendations. Cogn. Comput. 2021, 1–12. [Google Scholar] [CrossRef] [PubMed]
  37. Cotfas, L.A.; Delcea, C.; Milne, R.J.; Salari, M. Evaluating Classical Airplane Boarding Methods Considering COVID-19 Flying Restrictions. Symmetry 2020, 12, 1087. [Google Scholar] [CrossRef]
  38. Milne, R.J.; Delcea, C.; Cotfas, L.A.; Ioanas, C. Evaluation of Boarding Methods Adapted for Social Distancing When Using Apron Buses. IEEE Access 2020, 8, 151650–151667. [Google Scholar] [CrossRef]
  39. Chen, D.; Yang, Y.; Zhang, Y.; Yu, W. Prediction of COVID-19 spread by sliding mSEIR observer. Sci. China Inf. Sci. 2020, 63, 222203. [Google Scholar] [CrossRef]
  40. Crokidakis, N. Modeling the early evolution of the COVID-19 in Brazil: Results from a Susceptible–Infectious–Quarantined–Recovered (SIQR) model. Int. J. Mod. Phys. C 2020, 31, 2050135. [Google Scholar] [CrossRef]
  41. Ma, W.; Song, M.; Takeuchi, Y. Global stability of an SIR epidemic model with time delay. Appl. Math. Lett. 2004, 17, 1141–1145. [Google Scholar] [CrossRef] [Green Version]
  42. Ma, Y.; Xu, Z.; Wu, Z.; Bai, Y. COVID-19 Spreading Prediction with enhanced SEIR model. In Proceedings of the International Conference on Artificial Intelligence and Computer Engineering (ICAICE), Beijing, China, 23–25 October 2020; 2020; pp. 383–386. [Google Scholar]
  43. Mohammed, M.B.; Salsabil, L.; Tanaaz, S.S.; Shahriar, M.; Fahmin, A. An Extensive Analysis of the Effect of Social Distancing in Transmission of COVID-19 in Bangladesh by the Aid of a Modified SEIRD Model. In Proceedings of the 2020 2nd International Conference on Advanced Information and Communication Technology (ICAICT), Dhaka, Bangladesh, 28–29 November 2020; pp. 422–427. [Google Scholar]
  44. Calafiore, G.C.; Novara, C.; Possieri, C. A time-varying SIRD model for the COVID-19 contagion in Italy. Annu. Rev. Control 2020, 50, 361–372. [Google Scholar] [CrossRef]
  45. Sakib, N.; Tian, S.; Haque, M.M.; Khan, R.A.; Ahamed, S.I. SepINav (Sepsis ICU Navigator): A data-driven software tool for sepsis monitoring and intervention using Bayesian Online Change Point Detection. SoftwareX 2021, 14, 100689. [Google Scholar] [CrossRef]
  46. Salman, A.M.; Ahmed, I.; Mohd, M.H.; Jamiluddin, M.S.; Dheyab, M.A. Scenario analysis of COVID-19 transmission dynamics in Malaysia with the possibility of reinfection and limited medical resources scenarios. Comput. Biol. Med. 2021, 133, 104372. [Google Scholar] [CrossRef] [PubMed]
  47. Borovkov, A.I.; Bolsunovskaya, M.V.; Gintciak, A.M.; Kudryavtseva, T.J. Simulation Modelling Application for Balancing Epidemic and Economic Crisis in the Region. Int. J. Technol. 2020, 11, 1579. [Google Scholar] [CrossRef]
  48. Jinjarak, Y.; Ahmed, R.; Nair-Desai, S.; Xin, W.; Aizenman, J. Accounting for Global COVID-19 Diffusion Patterns, January–April 2020. Econ. Disasters Clim. Chang. 2020, 4, 515–559. [Google Scholar] [CrossRef] [PubMed]
  49. Ramaci, T.; Barattucci, M.; Ledda, C.; Rapisarda, V. Social Stigma during COVID-19 and its Impact on HCWs Outcomes. Sustainability 2020, 12, 3834. [Google Scholar] [CrossRef]
  50. Shevlin, M.; Nolan, E.; Owczarek, M.; McBride, O.; Murphy, J.; Gibson Miller, J.; Hartman, T.K.; Levita, L.; Mason, L.; Martinez, A.P.; et al. COVID-19-related anxiety predicts somatic symptoms in the UK population. Br. J. Health Psychol. 2020, 25, 875–882. [Google Scholar] [CrossRef] [PubMed]
  51. Wang, C.; Pan, R.; Wan, X.; Tan, Y.; Xu, L.; Ho, C.S.; Ho, R.C. Immediate Psychological Responses and Associated Factors during the Initial Stage of the 2019 Coronavirus Disease (COVID-19) Epidemic among the General Population in China. Int. J. Environ. Res. Public Health 2020, 17, 1729. [Google Scholar] [CrossRef] [PubMed] [Green Version]
  52. Lai, J.; Ma, S.; Wang, Y.; Cai, Z.; Hu, J.; Wei, N.; Wu, J.; Du, H.; Chen, T.; Li, R.; et al. Factors Associated with Mental Health Outcomes Among Health Care Workers Exposed to Coronavirus Disease 2019. JAMA Netw. Open 2020, 3, e203976. [Google Scholar] [CrossRef]
  53. Tosepu, R.; Gunawan, J.; Effendy, D.S.; Ahmad, L.O.A.I.; Lestari, H.; Bahar, H.; Asfian, P. Correlation between Weather and Covid-19 Pandemic in Jakarta, Indonesia. Sci. Total Environ. 2020, 725, 138436. [Google Scholar] [CrossRef]
  54. Liu, J.; Zhou, J.; Yao, J.; Zhang, X.; Li, L.; Xu, X.; He, X.; Wang, B.; Fu, S.; Niu, T.; et al. Impact of Meteorological Factors on the COVID-19 Transmission: A Multi-City Study in China. Sci. Total Environ. 2020, 726, 138513. [Google Scholar] [CrossRef]
  55. Lurie, N.; Saville, M.; Hatchett, R.; Halton, J. Developing Covid-19 Vaccines at Pandemic Speed. N. Engl. J. Med. 2020, 382, 1969–1973. [Google Scholar] [CrossRef] [PubMed]
  56. Li, L.; Huang, T.; Wang, Y.; Wang, Z.; Liang, Y.; Huang, T.; Zhang, H.; Sun, W.; Wang, Y. COVID-19 Patients’ Clinical Characteristics, Discharge Rate, and Fatality Rate of Meta-analysis. J. Med. Virol. 2020, 92, 577–583. [Google Scholar] [CrossRef] [PubMed]
  57. Lazarus, J.V.; Ratzan, S.C.; Palayew, A.; Gostin, L.O.; Larson, H.J.; Rabin, K.; Kimball, S.; El-Mohandes, A. A Global Survey of Potential Acceptance of a COVID-19 Vaccine. Nat. Med. 2021, 27, 225–228. [Google Scholar] [CrossRef] [PubMed]
  58. Siegenfeld, A.F.; Taleb, N.N.; Bar-Yam, Y. Opinion: What Models Can and Cannot Tell Us about COVID-19. Proc. Natl. Acad. Sci. USA 2020, 117, 16092–16095. [Google Scholar] [CrossRef] [PubMed]
  59. Mahmud, S.G.; Mishu, M.C.; Nandi, D. Predicting Spread, Recovery and Death Due to COVID-19 Using a Time-Series Model (Prophet). AIUB J. Sci. Eng. 2021, 20, 71–76. [Google Scholar] [CrossRef]
  60. Giordano, G.; Blanchini, F.; Bruno, R.; Colaneri, P.; Di Filippo, A.; Di Matteo, A.; Colaneri, M. Modelling the COVID-19 Epidemic and Implementation of Population-Wide Interventions in Italy. Nat. Med. 2020, 26, 855–860. [Google Scholar] [CrossRef]
  61. Anastassopoulou, C.; Russo, L.; Tsakris, A.; Siettos, C. Data-Based Analysis, Modelling and Forecasting of the COVID-19 Outbreak. PLoS ONE 2020, 15, e0230405. [Google Scholar] [CrossRef] [Green Version]
Figure 1. Structure of the modified SEIR model with quarantined individuals.
Sustainability 14 01995 g001
Figure 2. The comparison of data from Source 1 and Source 2.
Sustainability 14 01995 g002
Figure 3. Results of simulation experiments on Model 1 and Model 2.
Sustainability 14 01995 g003
Figure 4. Comparison of the predicted and observed data series.
Sustainability 14 01995 g004
Table 1. Model parameters.
Model Based on Data Source 1Model Based on Data Source 2
Individuals’ contact rate3.64 × 10−23.58 × 10⁻²
Isolation efficiency−3.45 × 10⁻³−3.43 × 10⁻³
Determination coefficient (on calibration data)99.21%98.39%
Table 2. Key quantitative forecast metrics (forecasted and real).
Forecast of Model 1Forecast of Model 2Observed Data
The peak date of the current number of infections26 January 202126 January 202120 January 2021
The current number of infections on the peak date91,53885,963104,932
The peak date forecast error (days)66-
The current number of infections forecast error12.76%18.08%-
Publisher’s Note: MDPI stays neutral with regard to jurisdictional claims in published maps and institutional affiliations.

