Article

Retrieval of Nitrogen Content in Apple Canopy Based on Unmanned Aerial Vehicle Hyperspectral Images Using a Modified Correlation Coefficient Method

1
College of Resources and Environment, Shandong Agricultural University, Tai’an 271018, China
2
National Engineering Research Center for Efficient Utilization of Soil and Fertilizer Resources, Shandong Agricultural University, Tai’an 271018, China
3
National Apple Engineering and Technology Research Center, College of Horticulture Science and Engineering, Shandong Agricultural University, Tai’an 271018, China
*
Author to whom correspondence should be addressed.
Sustainability 2022, 14(4), 1992; https://doi.org/10.3390/su14041992
Submission received: 5 January 2022 / Revised: 28 January 2022 / Accepted: 29 January 2022 / Published: 10 February 2022

Abstract

:
The accurate retrieval of nitrogen content based on Unmanned Aerial Vehicle (UAV) hyperspectral images is limited due to uncertainties in determining the locations of nitrogen-sensitive wavelengths. This study developed a Modified Correlation Coefficient Method (MCCM) to select wavelengths sensitive to nitrogen content. The Normalized Difference Canopy Shadow Index (NDCSI) was applied to remove the shadows from UAV hyperspectral images, thus yielding the canopy spectral information. The MCCM was then used to screen the bands sensitive to nitrogen content and to construct spectral characteristic parameters. Finally, the optimal model for nitrogen content retrieval was established and selected. As a result, the screened sensitive wavelengths for nitrogen content selected were 470, 474, 490, 514, 582, 634, and 682 nm, respectively. Among the nitrogen content retrieval models, the best model was the Support Vector Machine (SVM) model. In the training set, this model outperformed the other models with an R2 of 0.733, RMSE of 6.00%, an nRMSE of 12.76%, and a MAE of 4.49%. Validated by the ground-measured nitrogen content, this model yielded good performance with an R2 of 0.671, an RMSE of 4.73%, an nRMSE of 14.83%, and a MAE of 3.98%. This study can provide a new method for vegetation nutrient content retrieval based on UAV hyperspectral data.

1. Introduction

Nitrogen is an element that is an essential nutrient in the growth and development of apple trees and is a key indicator in general fruit tree growth evaluations. The level of nitrogen content affects not only the growth and development of apple trees, but also the yield and fruit quality [1]. The traditional means of measuring nitrogen content is the Kjeldahl method, which requires drying, grinding, weighing, and desiccating the leaves. Its efficiency level is low, it is time-consuming and laborious, and, more importantly, it does not meet the needs of rapid, real-time monitoring. Obtaining the nitrogen content of a tree canopy efficiently and effectively has always been an urgent problem to be solved.
With the continuous innovation and improvement of remote sensing platforms, optical remote sensing technology has become an important means of monitoring vegetation nitrogen content [2,3]. Currently, the data sources used for quantitative analysis of vegetation nitrogen mainly include near-surface hyperspectral data, satellite remote sensing data, and low-altitude UAV data [4]. Ground hyperspectral data mainly explore the relationship between each wavelength of the canopy spectrum and the nitrogen content of leaves by obtaining continuous canopy spectral information. Based on the selected wavelength sensitive to nitrogen content, an inversion model was constructed for inversion studies of vegetation nutrients [5,6,7,8]. Although this method can obtain high-precision, continuous, and multi-wavelength canopy spectral data, it cannot achieve high-quality visual monitoring in the study area. There are many studies on monitoring vegetation nitrogen content based on satellite remote sensing images. These methods usually extract spectral data based on satellite remote sensing images and construct a vegetation index to explore the relationship between that index and the nitrogen content [9,10,11]. The spectral data of the study area can be quickly obtained at a fairly low cost. However, satellite remote sensing images are often affected by sensor error, satellite orbit position, revisit cycle, etc., which cannot meet the necessary level of monitoring precision for crops in small areas. In recent years, low-altitude UAV remote sensing has been under tremendous development. Compared with the first two remote sensing platforms, low-altitude UAV remote sensing platforms are flexible and can quickly capture images with high spatial and temporal resolution in real-time. UAV image processing is relatively simple and has a low cost, making it more suitable for the quantitative retrieval of field vegetation nutrient data [12,13,14]. At present, UAV-based studies on vegetation nutrient monitoring mainly use visible-light, multispectral, and hyperspectral sensors [15,16]. At present, visible-light and multispectral sensors are the most widely used, but these two sensors contain less band information [17,18,19]. The spectral information of a hyperspectral UAV sensor is richer than that of visible-light and multispectral sensors. In addition, the sensitive wavelengths that are selected based on UAVs with hyperspectral sensors are more accurate, and the retrieval accuracy is higher [20,21,22].
However, hyperspectral images have more spectral information, which makes the screening of sensitive wavelengths more complicated. At present, the method of screening the sensitive wavelengths from hyperspectral data first involves performing a mathematical transformation (differentiation, derivation, wavelet transform, etc.) on the original spectrum. Continuum-Removal (C-R), Principal Component Analysis (PCA), the Successive Projection Algorithm (SPA), and the Genetic Algorithm (GA) determine the locations of sensitive wavelengths [23,24]. Although these methods can accurately screen out wavelengths sensitive to vegetation nutrients, the specific parameters of the algorithm used need to be determined, and the operation processes are complicated. The correlation coefficient method is simple to operate and is the most widely used sensitive wavelength screening method, but the wavelength screening of this method is relatively concentrated and the accuracy level is low [25]. The band intervals of UAV hyperspectral data are small, and the correlation levels between bands are high. The most commonly applied correlation coefficient method cannot accurately determine the positions of sensitive wavelengths. The simple and quick extraction of wavelengths sensitive to nitrogen content from UAV hyperspectral data is the problem to be solved in this study.
We used an apple orchard in Guanli Town, Qixia City, Shandong Province as the research area and the fruit tree canopy as the research object. The Normalized Difference Canopy Shadow Index (NDCSI) was adopted to remove the shadows in the UAV hyperspectral image data, the wavelengths sensitive to nitrogen content were screened using the Modified Correlation Coefficient Method (MCCM), and spectral parameters were constructed. Then, Multiple Linear Regression (MLR), Partial Least Squares (PLS), Support Vector Machine (SVM), and Random Forest (RF) were utilized. The optimal model for the retrieval of nitrogen content could then be determined. This study can provide a theoretical basis and methodological reference for vegetation nutrient content inversion based on UAV hyperspectral images in the future.

2. Materials and Methods
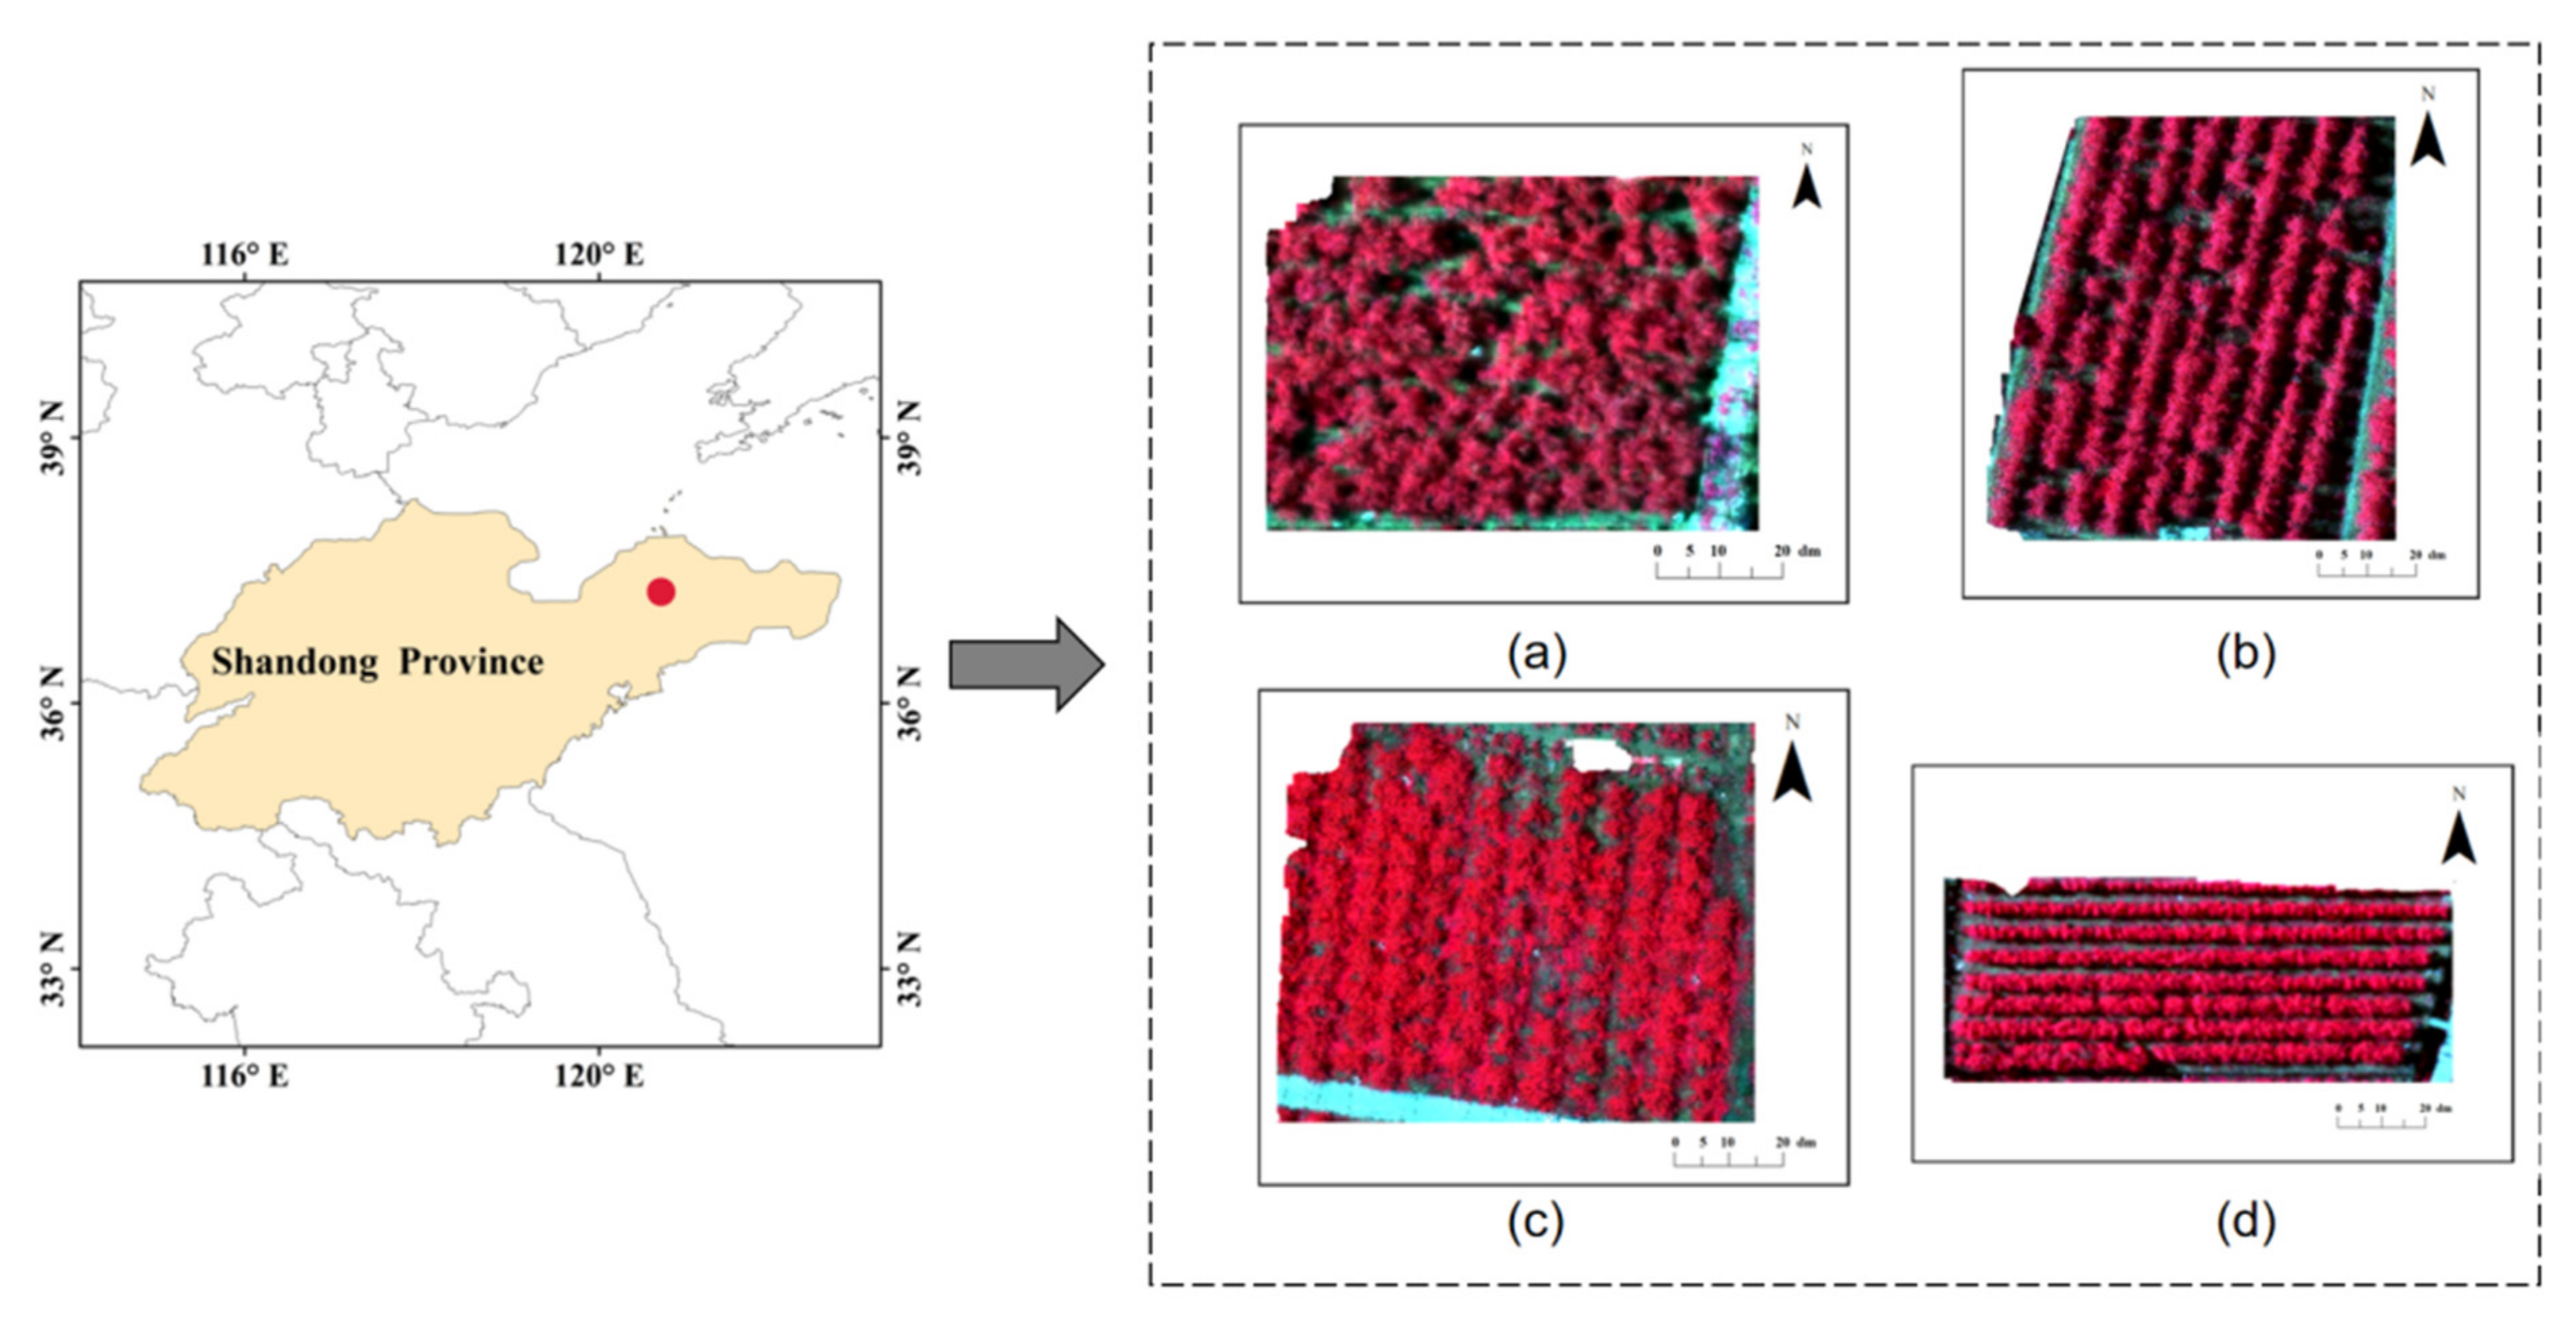
2.1. Study Area

The research area is located at the Baishi Apple Park, Guanli Town, Qixia City, Shandong Province, China (37°12′27″ N, 120°44′33″ E) (Figure 1). The park has a warm, temperate monsoon climate, with four distinct seasons. The annual mean temperature is 11.6 °C. The temperature difference between day and night in autumn is large, which is essential to sugar accumulation in fruit trees. The soil type is brown soil, and the hilly terrain is suitable for fruit tree growth. With its unique geographical location, fair climate and soil conditions, the town has become one of the most dominant apple production areas in China. Four orchards, P1, P2, P3, and P4, were randomly selected for the experiment. P1 and P3 were arbor orchards, and P2 and P4 were dwarf orchards (Figure 1).

2.2. Data Acquisition and Preprocessing

2.2.1. Hyperspectral Image Acquisition and Preprocessing

Hyperspectral images of the apple canopies in the study area were collected by UAV during 10:00–14:00 on 30 June 2019, under clear, cloudless, and windy weather. The hyperspectral images were obtained by an eight-rotor UAV M600 Pro with a UHD185 imager (produced by Cubert, Ulm, Germany). The imager has a spectral range of 450 nm–950 nm, with a total of 125 bands spaced at 4 nm, and it can provide hyperspectral images of 50 × 50 pixels and gray images of 1000 × 1000 pixels. During this test flight, the flight altitude was set at 50 m, the spectrometer lens was focused at 23 nm, the field of view angle was 15°, the image overlap rate was about 80%, and the lateral overlap rate was about 65%.
Agisoft PhotoScan software was adopted for image stitching, and the standard feature radiation correction method was used to calibrate the radiation of the hyperspectral images. Based on the layout of the ground control points for joining together of hyperspectral images geometric correction, the calibration error was set to be less than 0.5 pixel, to obtain the UAV hyperspectral images in the study area.

2.2.2. Apple Canopy Leaf Collection and Nitrogen Content Determination

The apple canopy leaves were collected simultaneously with the drone flight. Under the principle of uniform points, 25 apple trees were randomly selected in each orchard. Three similar-sized pieces of leaves with healthy blade conditionss located on the east, west, south and north sides, respectively, were collected as samples. At the same time, a handheld GPS was used to record the coordinates of the canopy samples. Each sample contained 12 blades, yielding a total of 100 samples. The collected samples were then brought back to the lab using an incubator.
In the laboratory, the leaf samples were put into a 105 °C air-blowing drying oven for 0.5 h and then dried to constant weight at 80 °C. The dried samples were ground into a powder with a mortar, and then screened. The nitrogen content in the leaves was determined via the Kjeldahl method. Finally, the nitrogen content of tree canopy leaves was obtained. The samples were also sorted according to the nitrogen content from low to high. Isometric sampling was then conducted according to the modeling set:verification set ratio = 2:1. Finally, 67 samples constituting the modeling set and 33 samples constituting the verification set (Table 1) were prepared. The mean value and standard deviation are shown in Equations (1) and (2).
µ = 1 n i = 1 n y i
δ = 1 n i = 1 n y i μ 2
where y i is the measured reflectivity value, n is the number of samples, µ is the average value, and δ is the standard deviation.

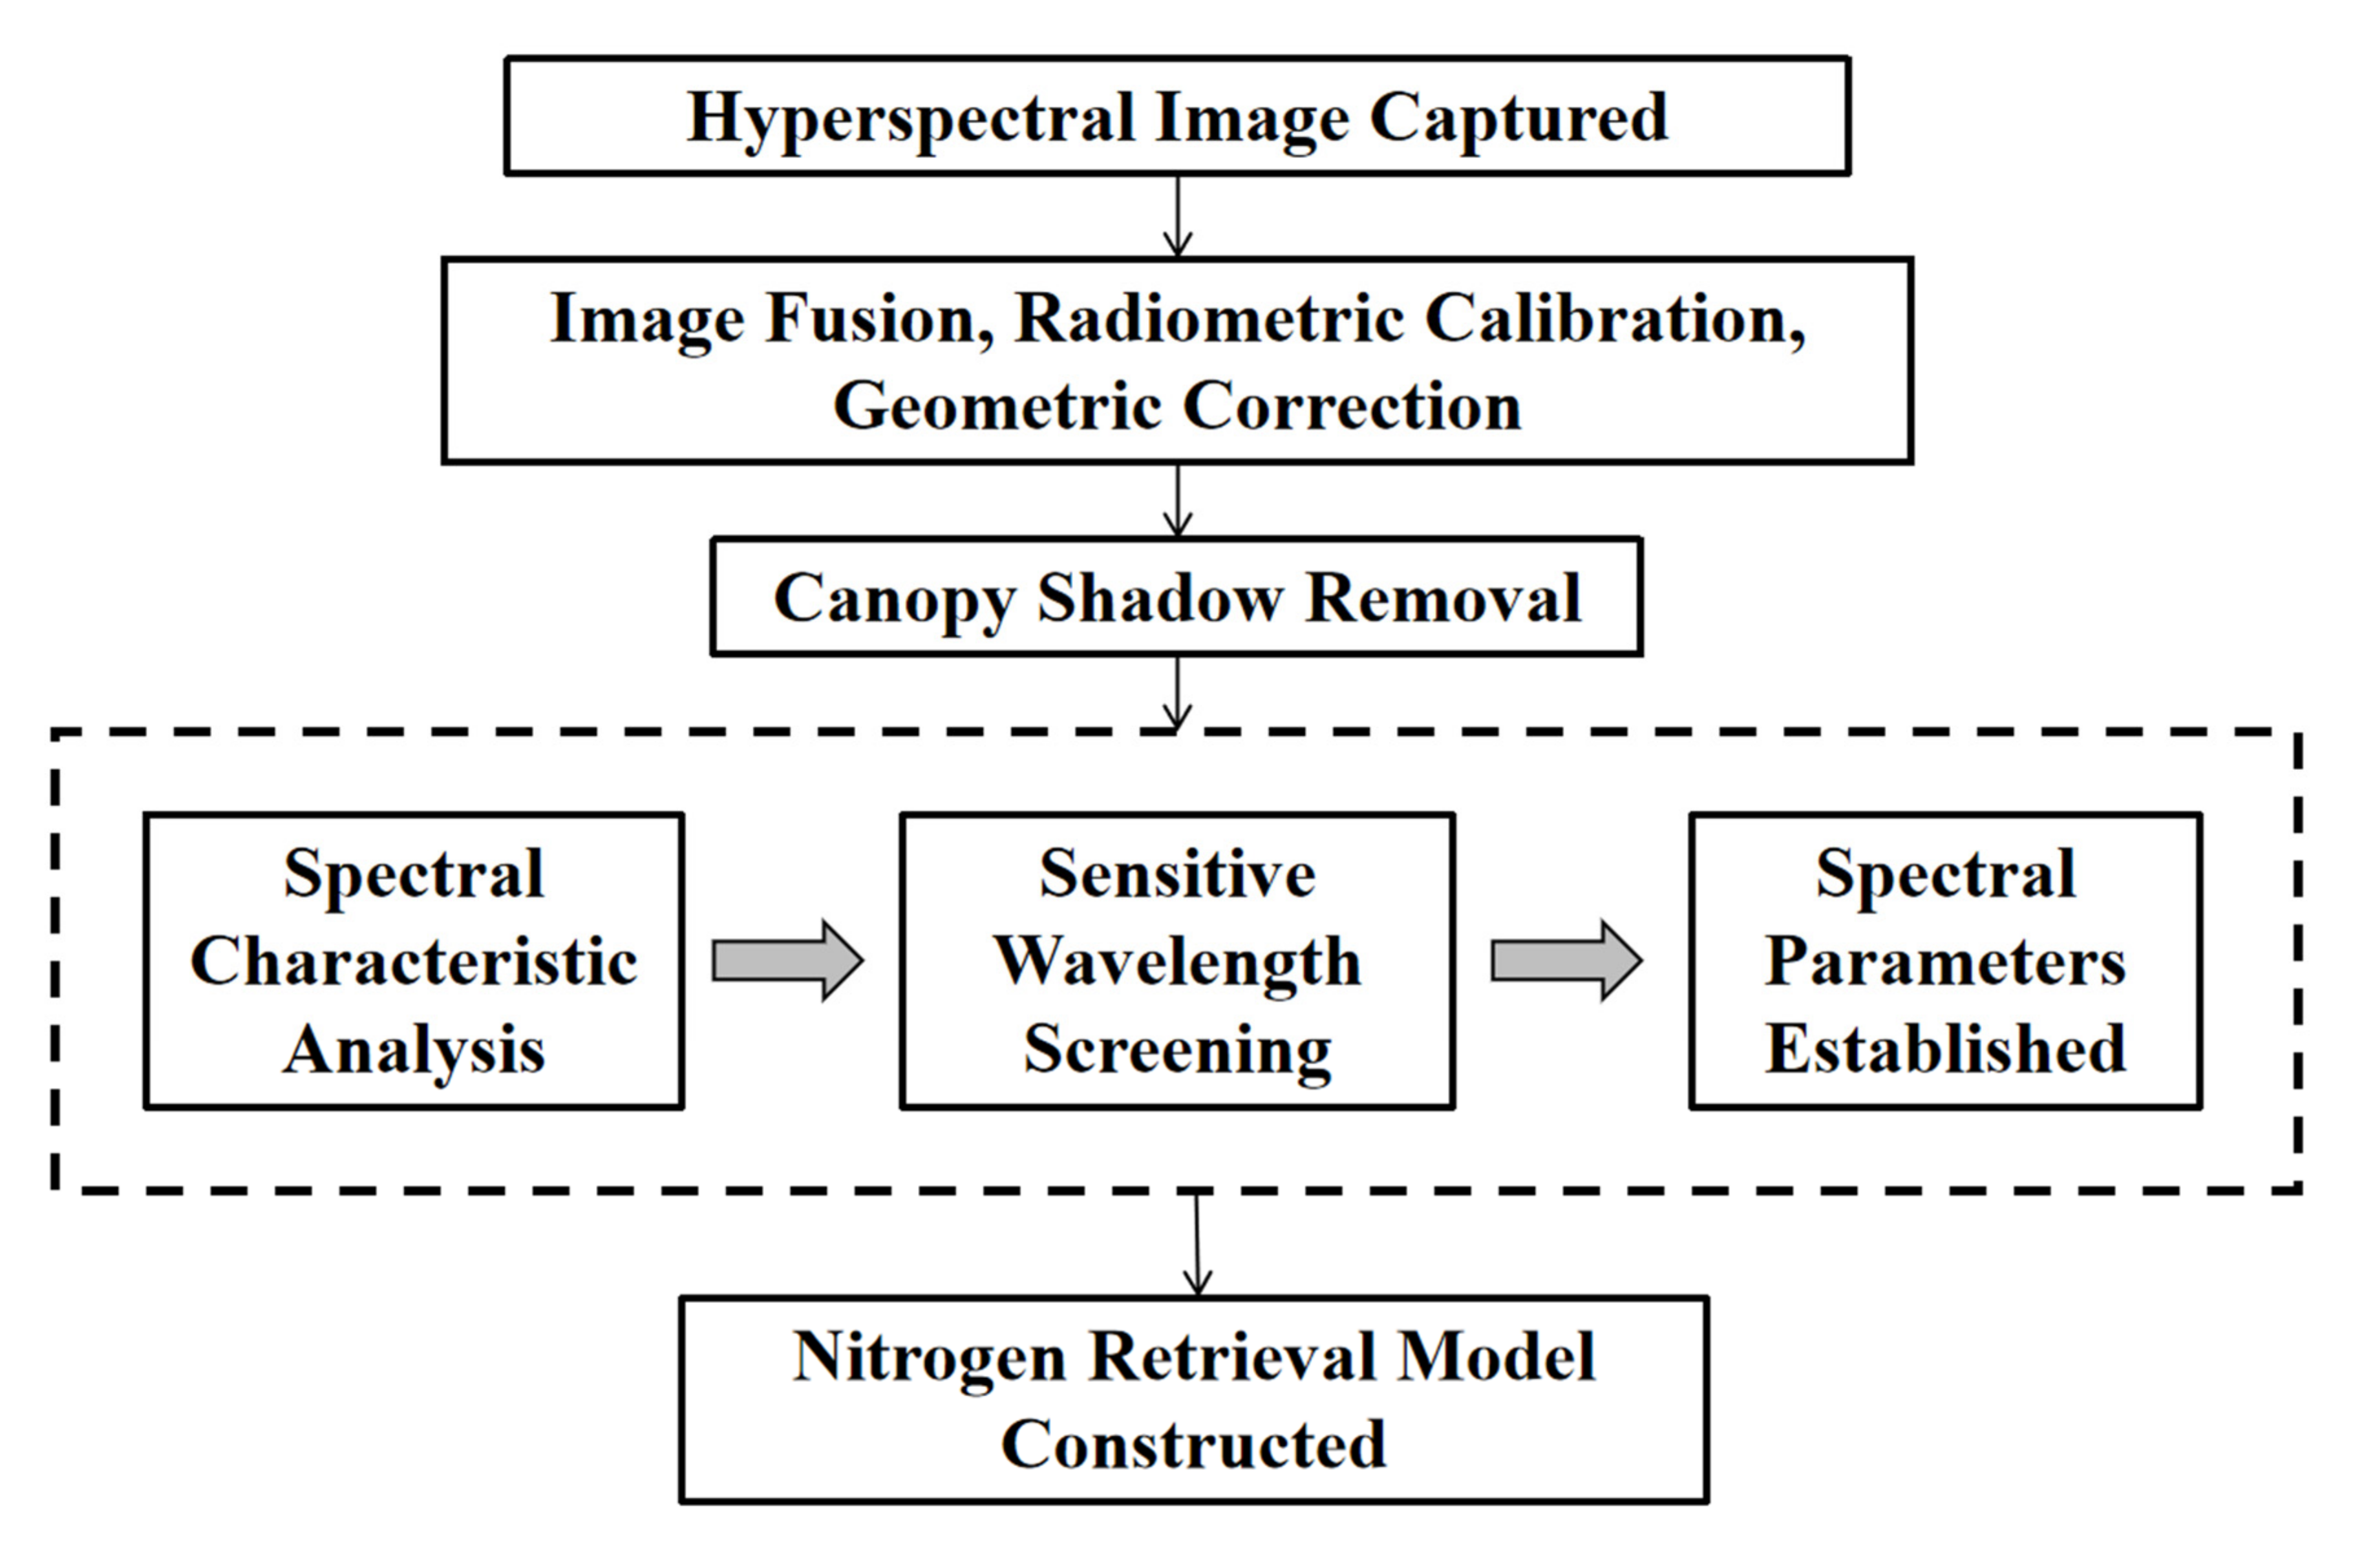
2.3. Methodology Description

In this study, the shades of tree canopy in the UAV hyperspectral images were removed based on NDCSI, and the spectral information of the canopy was extracted. Then, the sensitive wavelengths of canopy nitrogen content were screened based on MCCM and the spectral characteristic parameters were constructed. Finally, the nitrogen content retrieval models were established based on spectral characteristic parameters, and the accuracy of the model was tested. The technical route is shown in Figure 2.

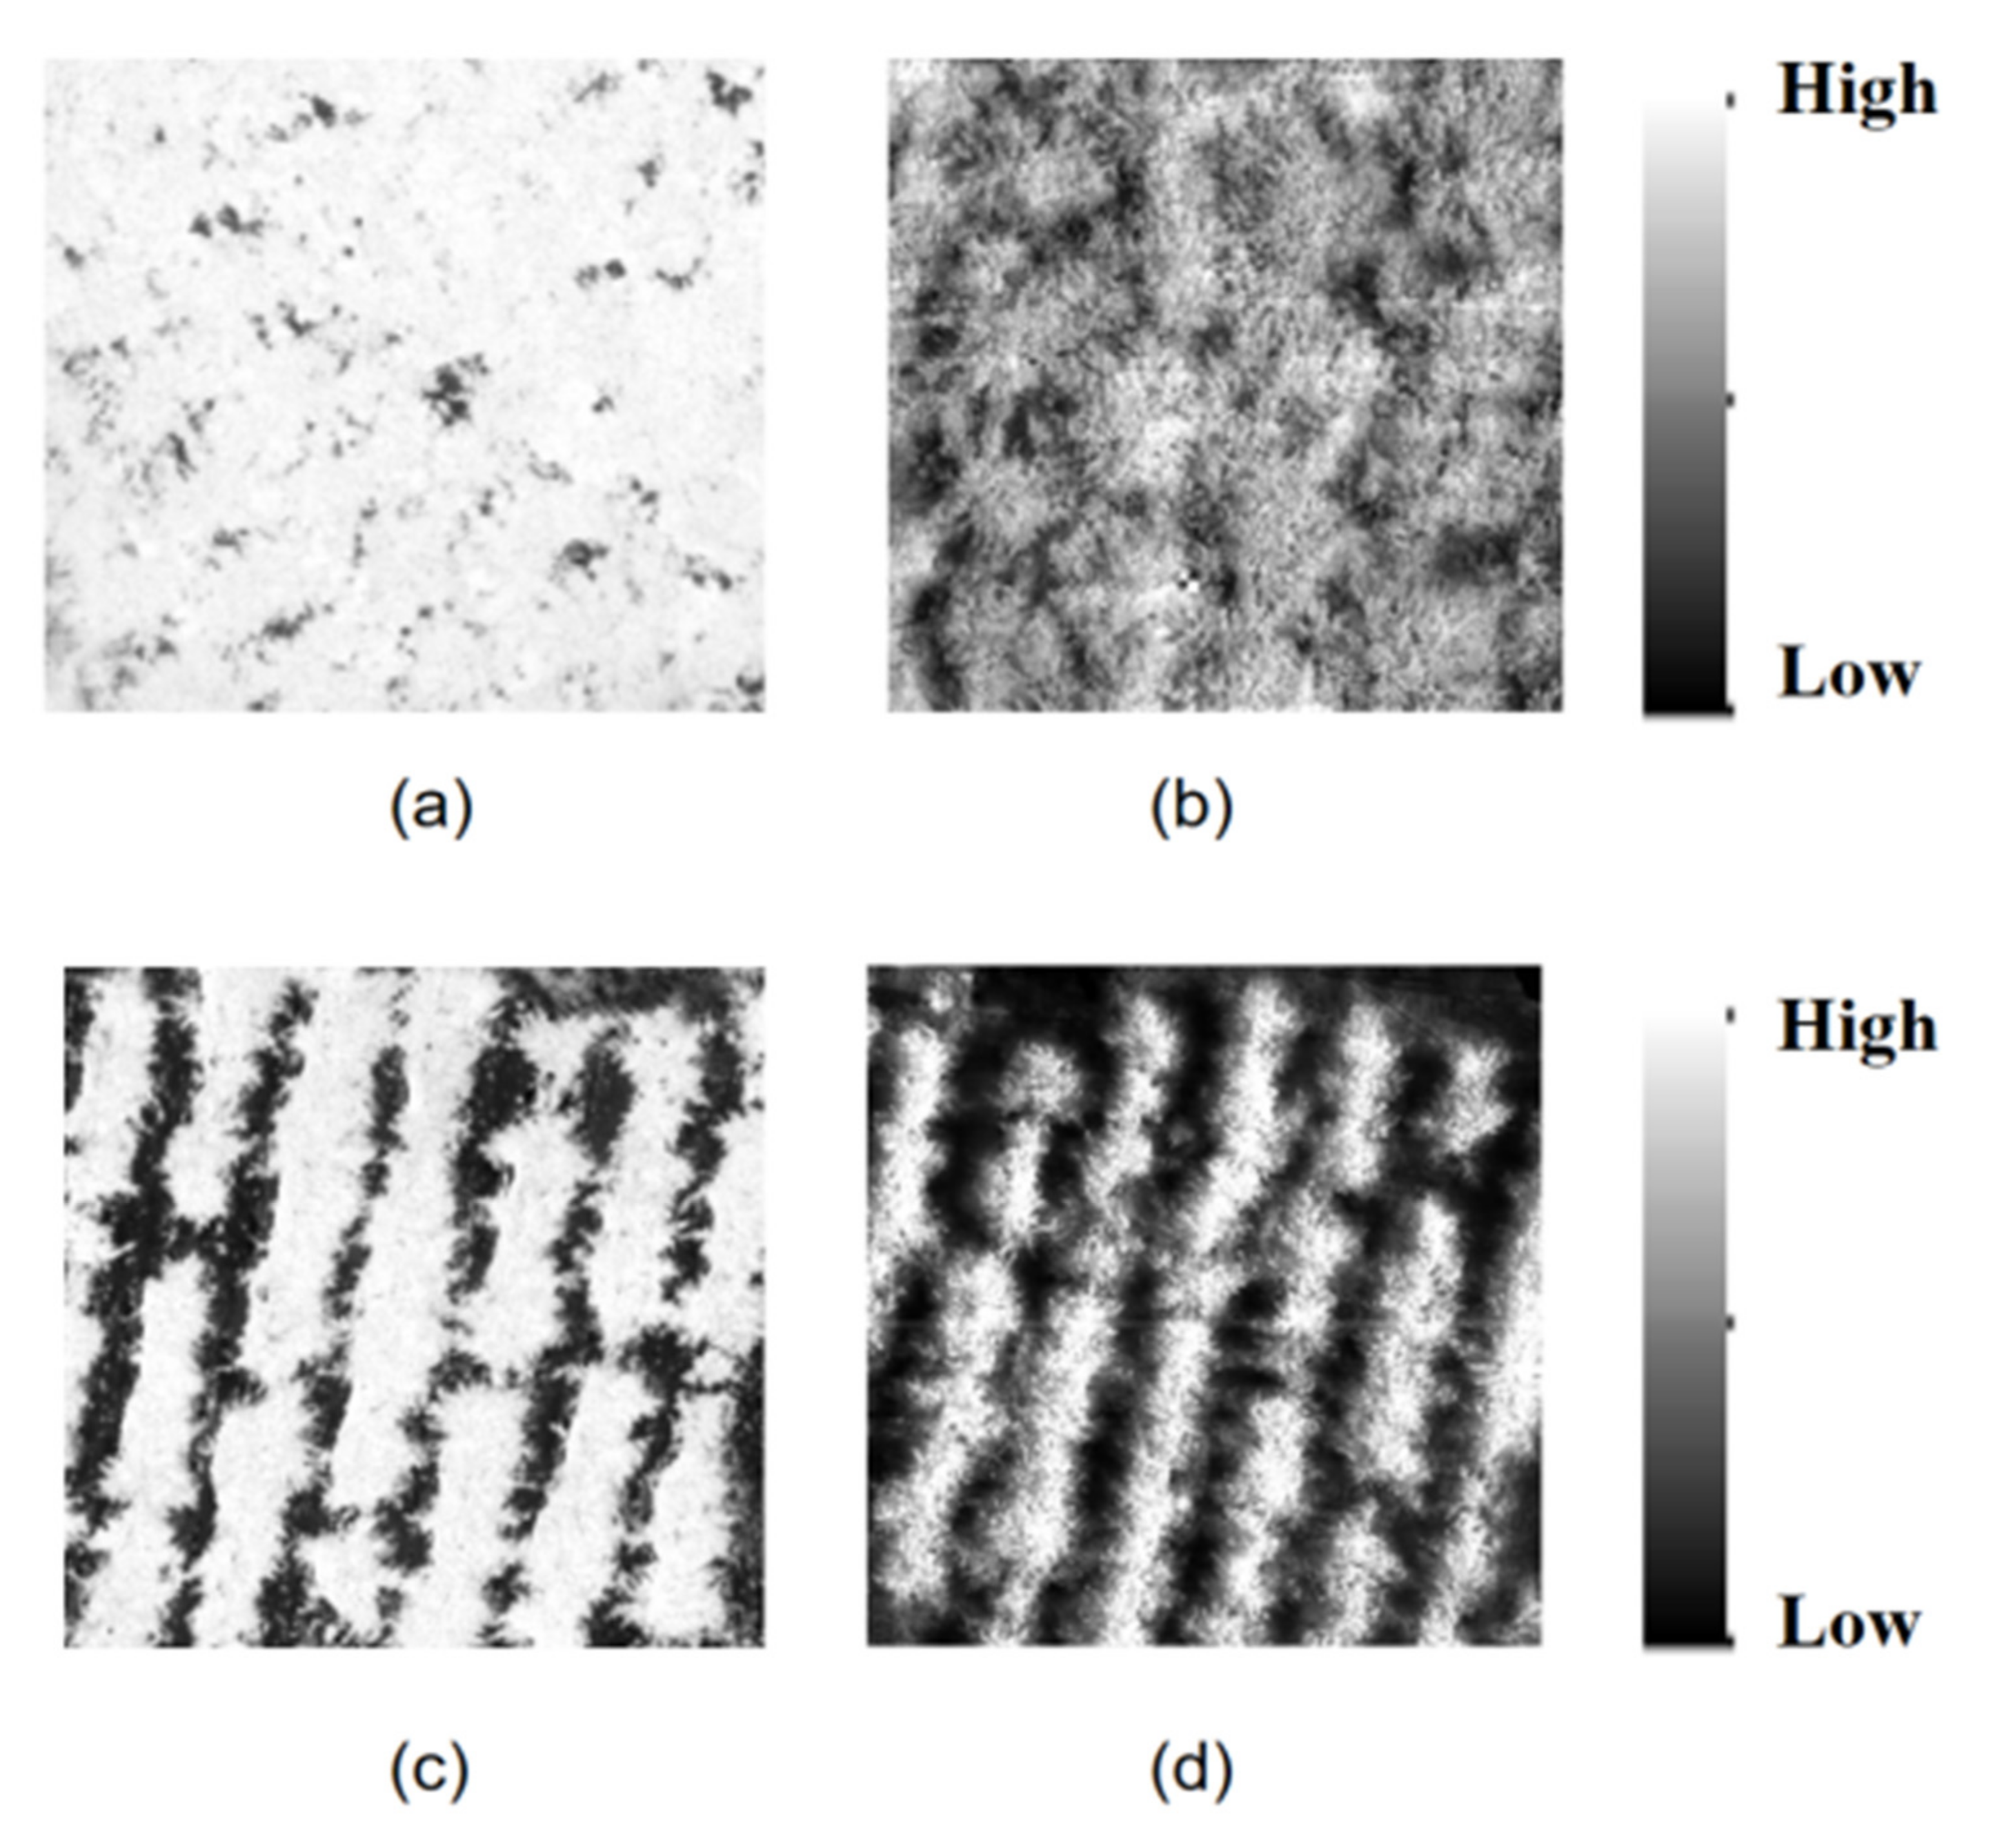
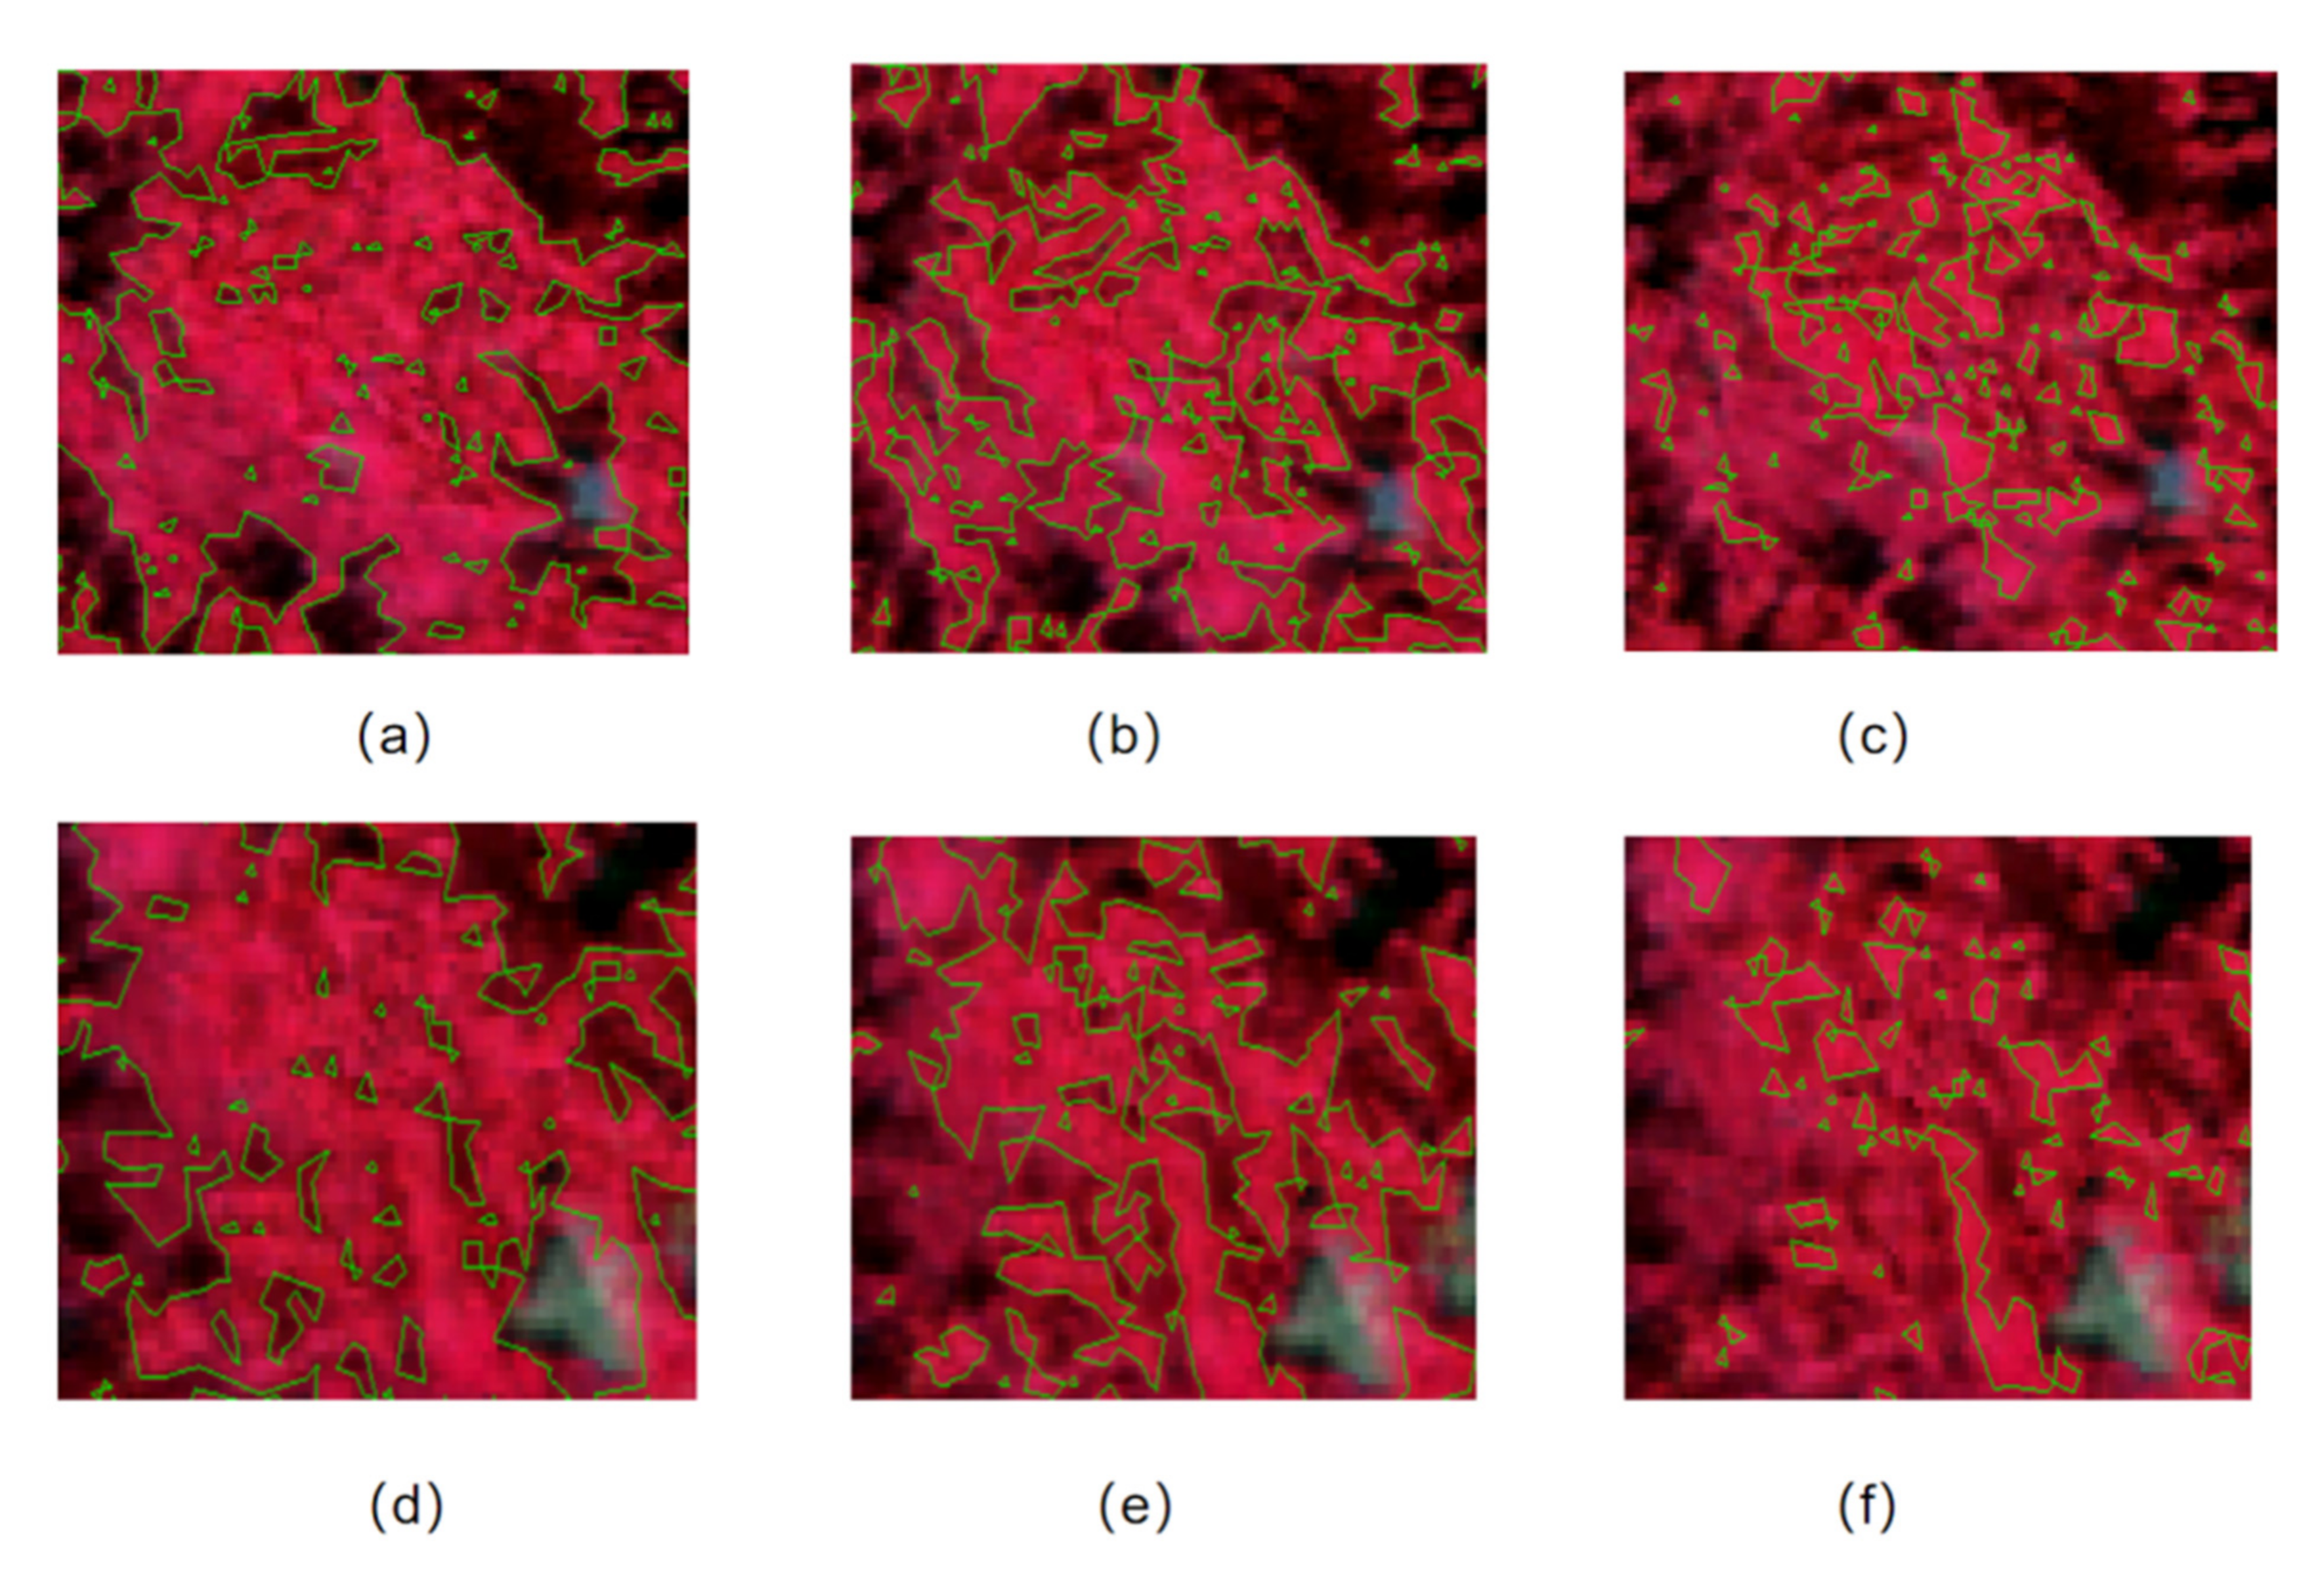
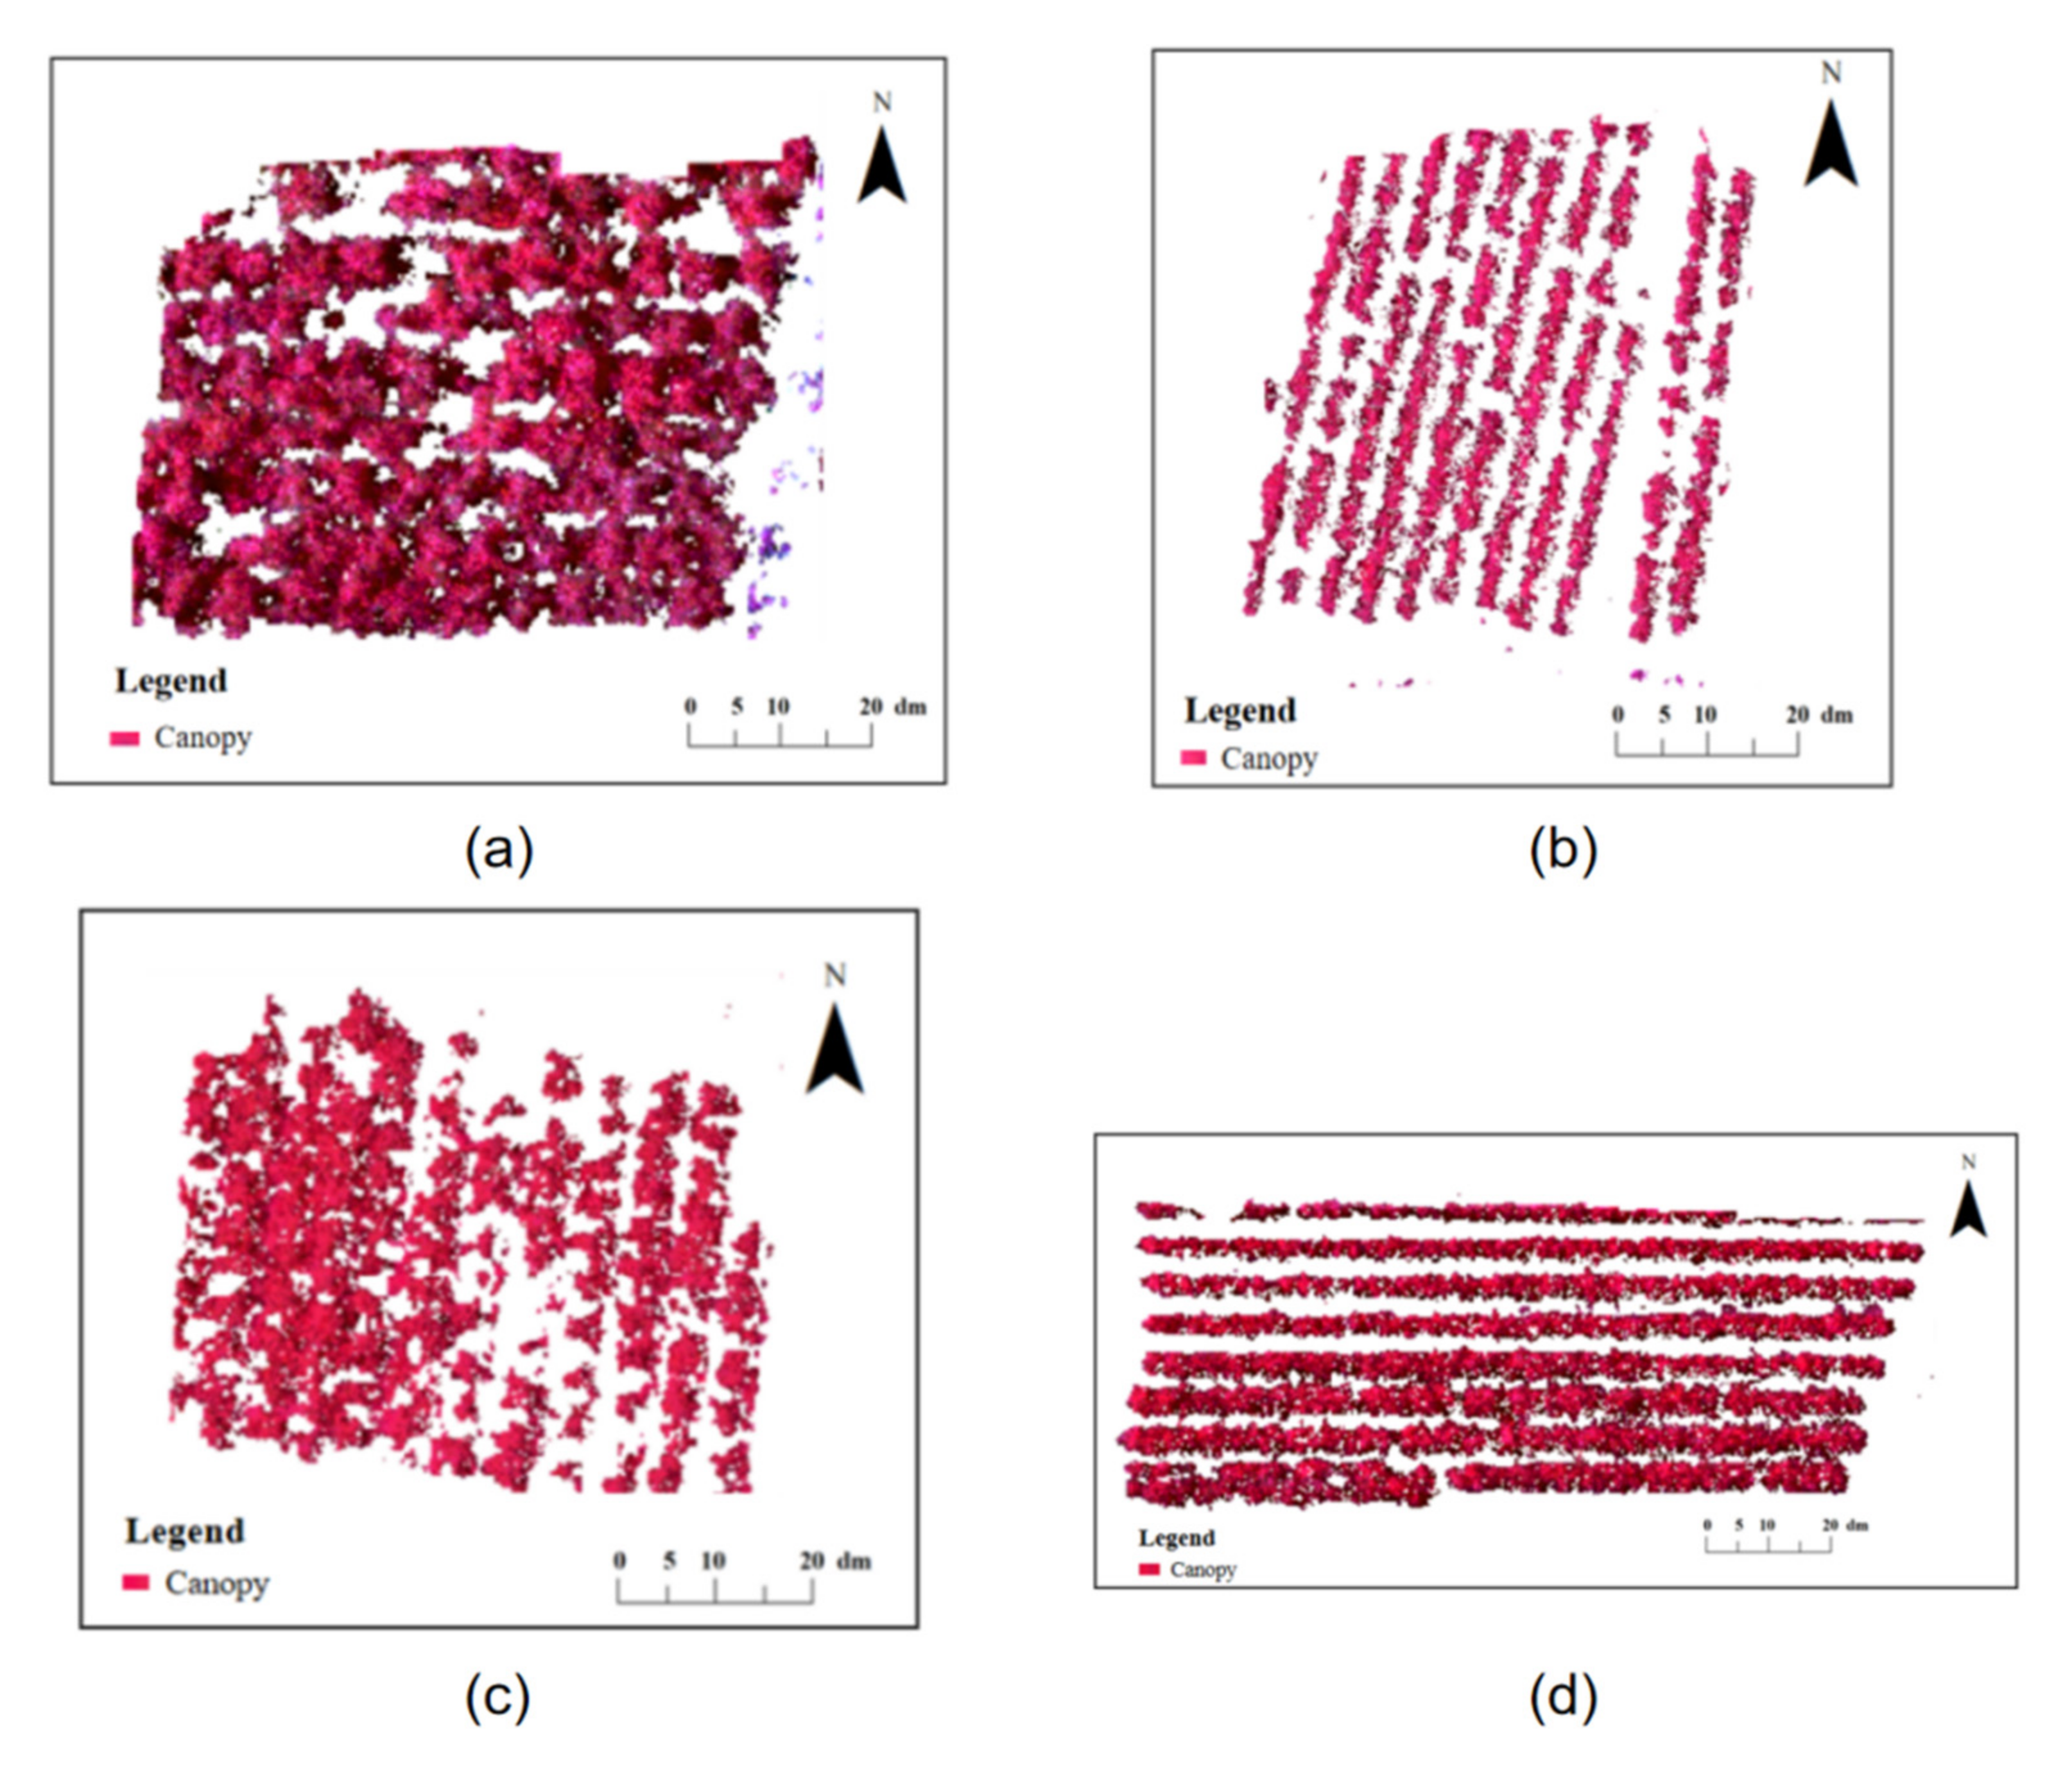
2.3.1. Extraction of Canopy Hyperspectral Images Based on NDCSI

Based on NDCSI, non-related canopy information such as soil and shadow were removed by the threshold method.
To extract the canopy information of the apple trees, the NDCSI was calculated using the band operation tool in ENVI (as shown in Equations (3) and (4)) [26]. According to the threshold range of the vegetation index in Arcgis, images of the apple tree canopy were successively extracted with a step size of 0.005, and the recognition of apple tree canopy under different thresholds was compared. The maximum value was set as the threshold, pixels larger than the threshold were classified as canopy, and pixels smaller than the threshold were classified as shadows. Based on the optimal threshold, a mask was established to extract the spectral image of tree canopy.
NDVI =   ( R N I R R R E D ) / ( R N I R + R R E D )
NDCSI = NDVI R r e d - e d g e ( R r e d - e d g e ) M I N ( R r e d - e d g e ) M A X ( R r e d - e d g e ) M I N
In Equation (3), RNIR is the gray value of the near-infrared band, and RRED is the gray value of Rred-edge band. In Equation (4), the Rred-edge band is the position of the first-order differential maximum value of spectral data. In this formula, the Rred-edge position of the hyperspectral images is the wavelength position where the first-order differential maximum value occurred most frequently. (Rred-edge)MIN is the minimum value of Rred-edge band of the image, and (Rred-edge)MAX is the maximum value of Rred-edge band of the image.

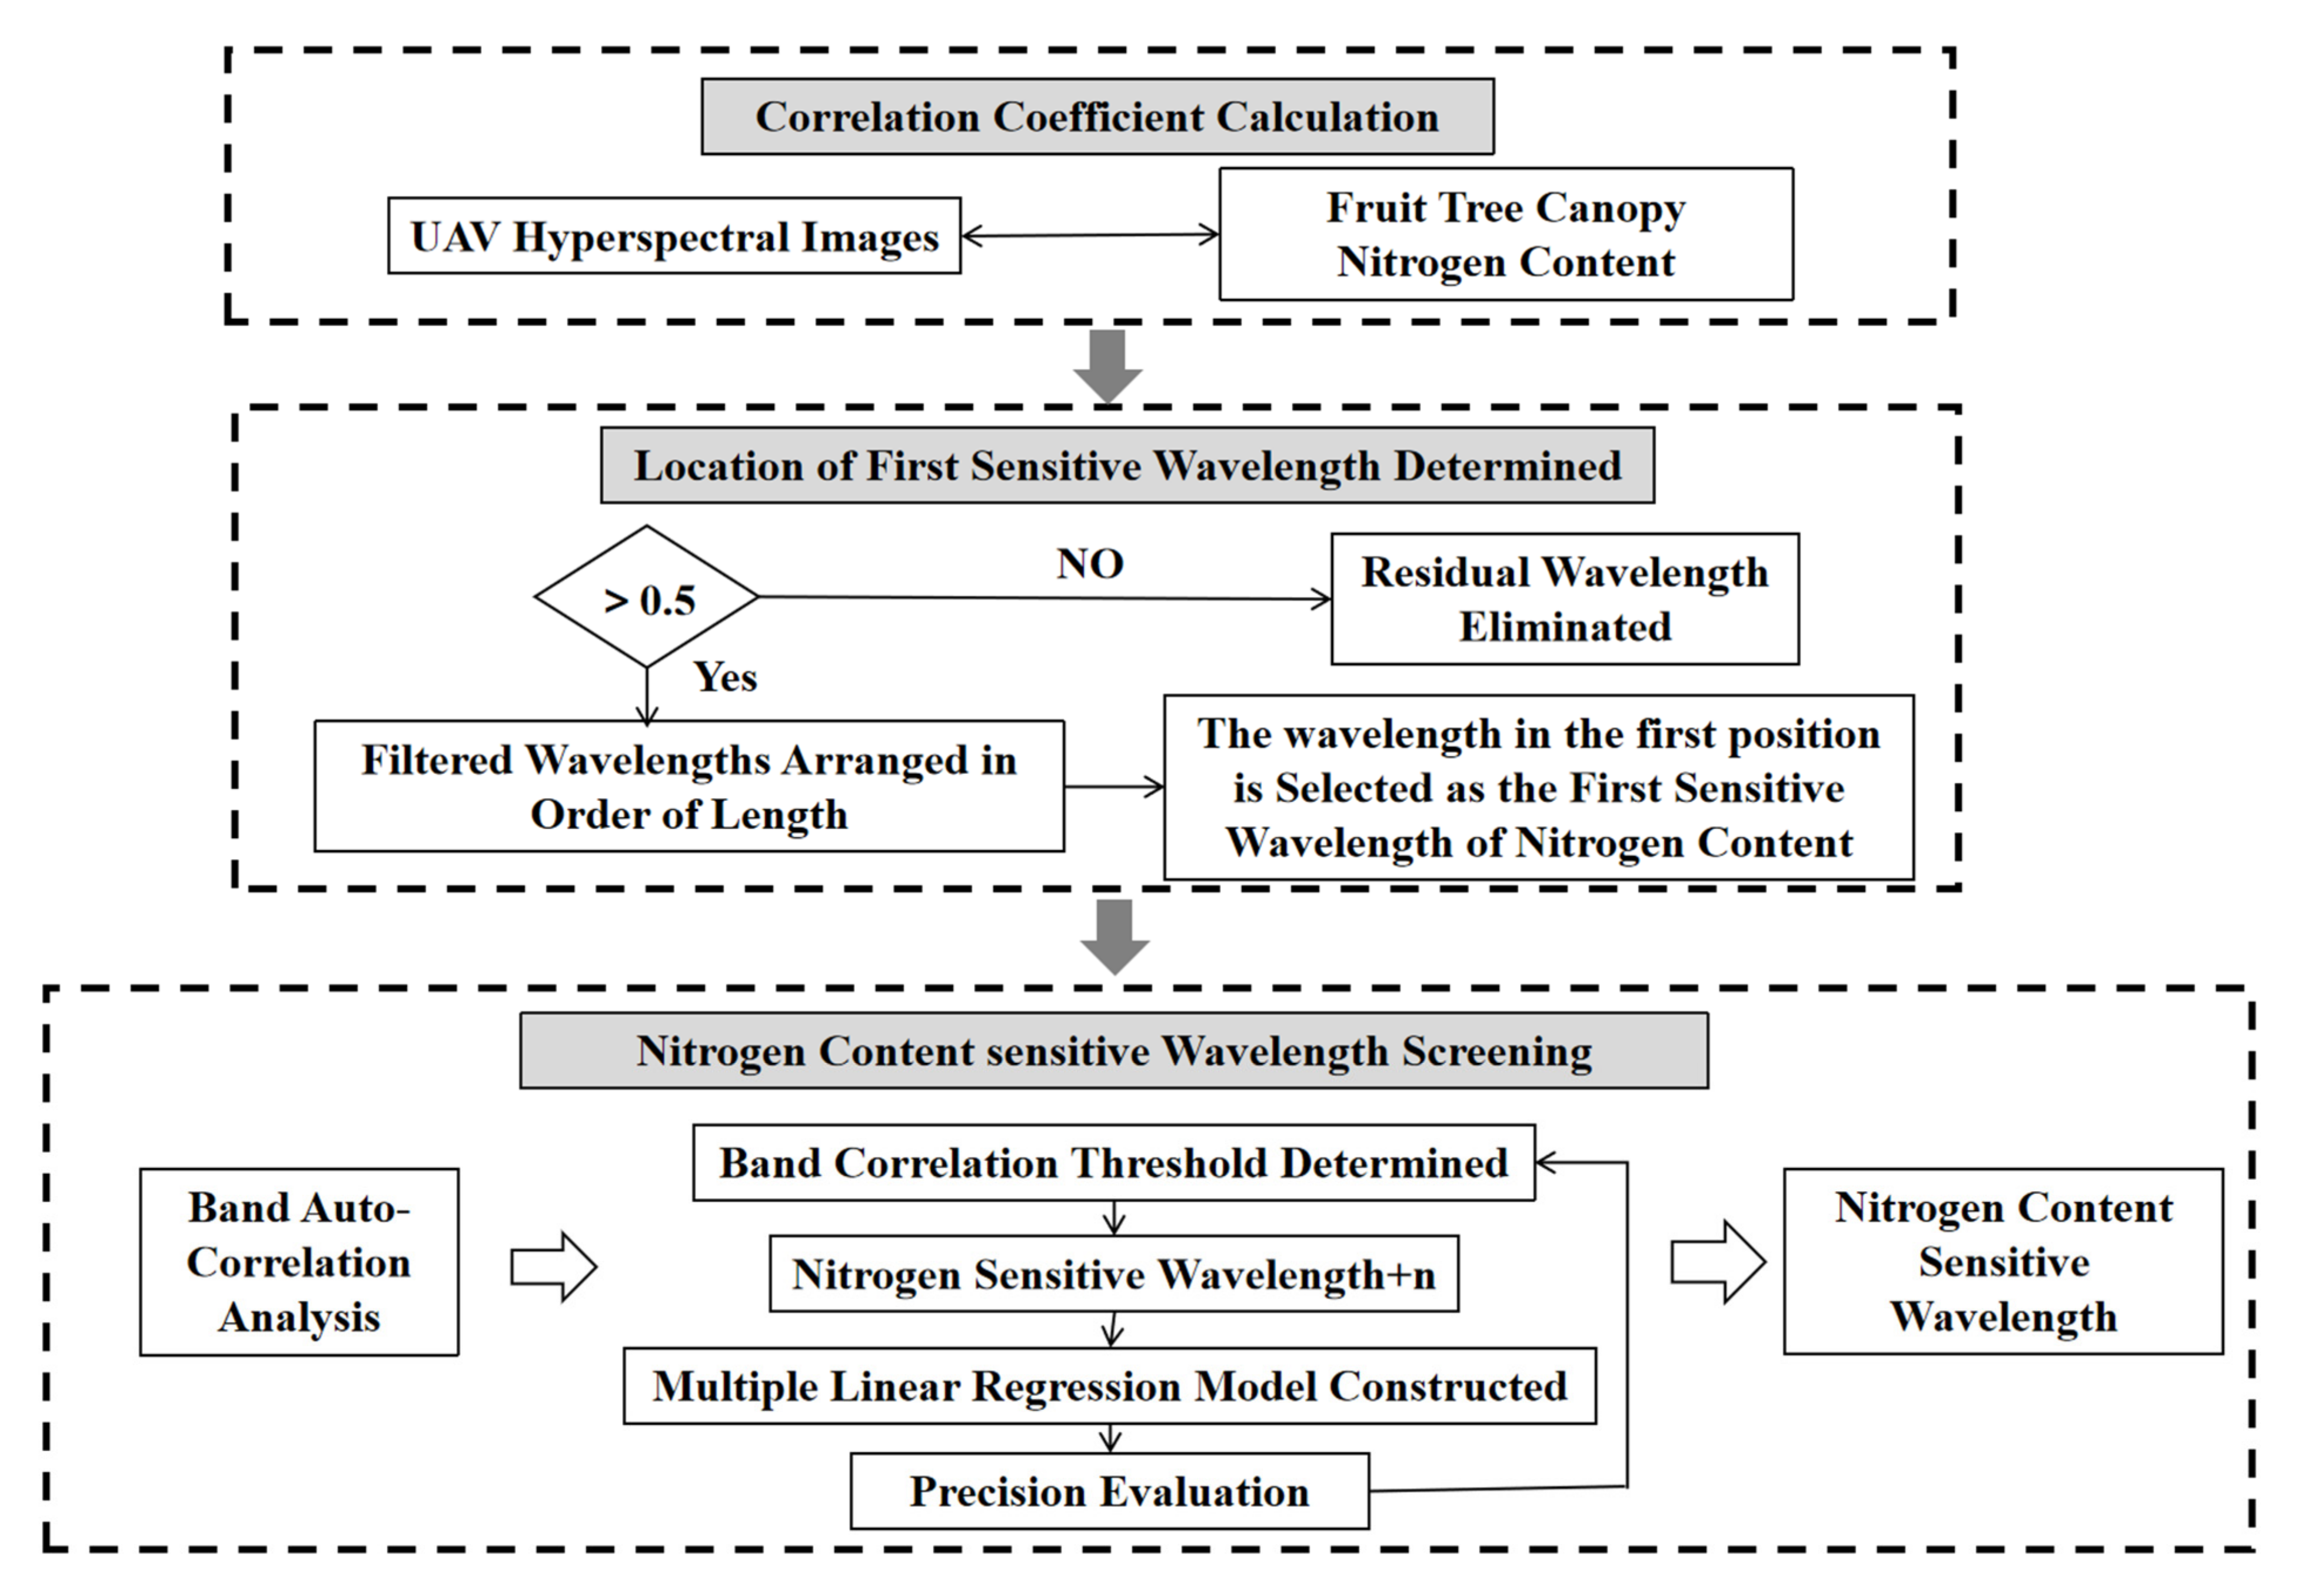
2.3.2. Screening of Sensitive Wavelengths Using MCCM Method

In previous studies, sensitive wavelengths were mostly screened according to the level of the correlation coefficient. However, the wavelength interval of hyperspectral images is small, which leads to a high correlation between adjacent wavelengths. Therefore, the correlation coefficient method cannot determine the sensitive wavelengths comprehensively and accurately.
Previous studies have found that wavelengths with correlation coefficients higher than 0.5 can be applied to model construction [27]. Based on this knowledge, this study proposed a Modified Correlation Coefficient Method (MCCM) to screen the sensitive wavelengths of nitrogen content in the hyperspectral images. The procedure diagram for selecting the sensitive band is shown in Figure 3. The specific operation process was as follows:
(1)
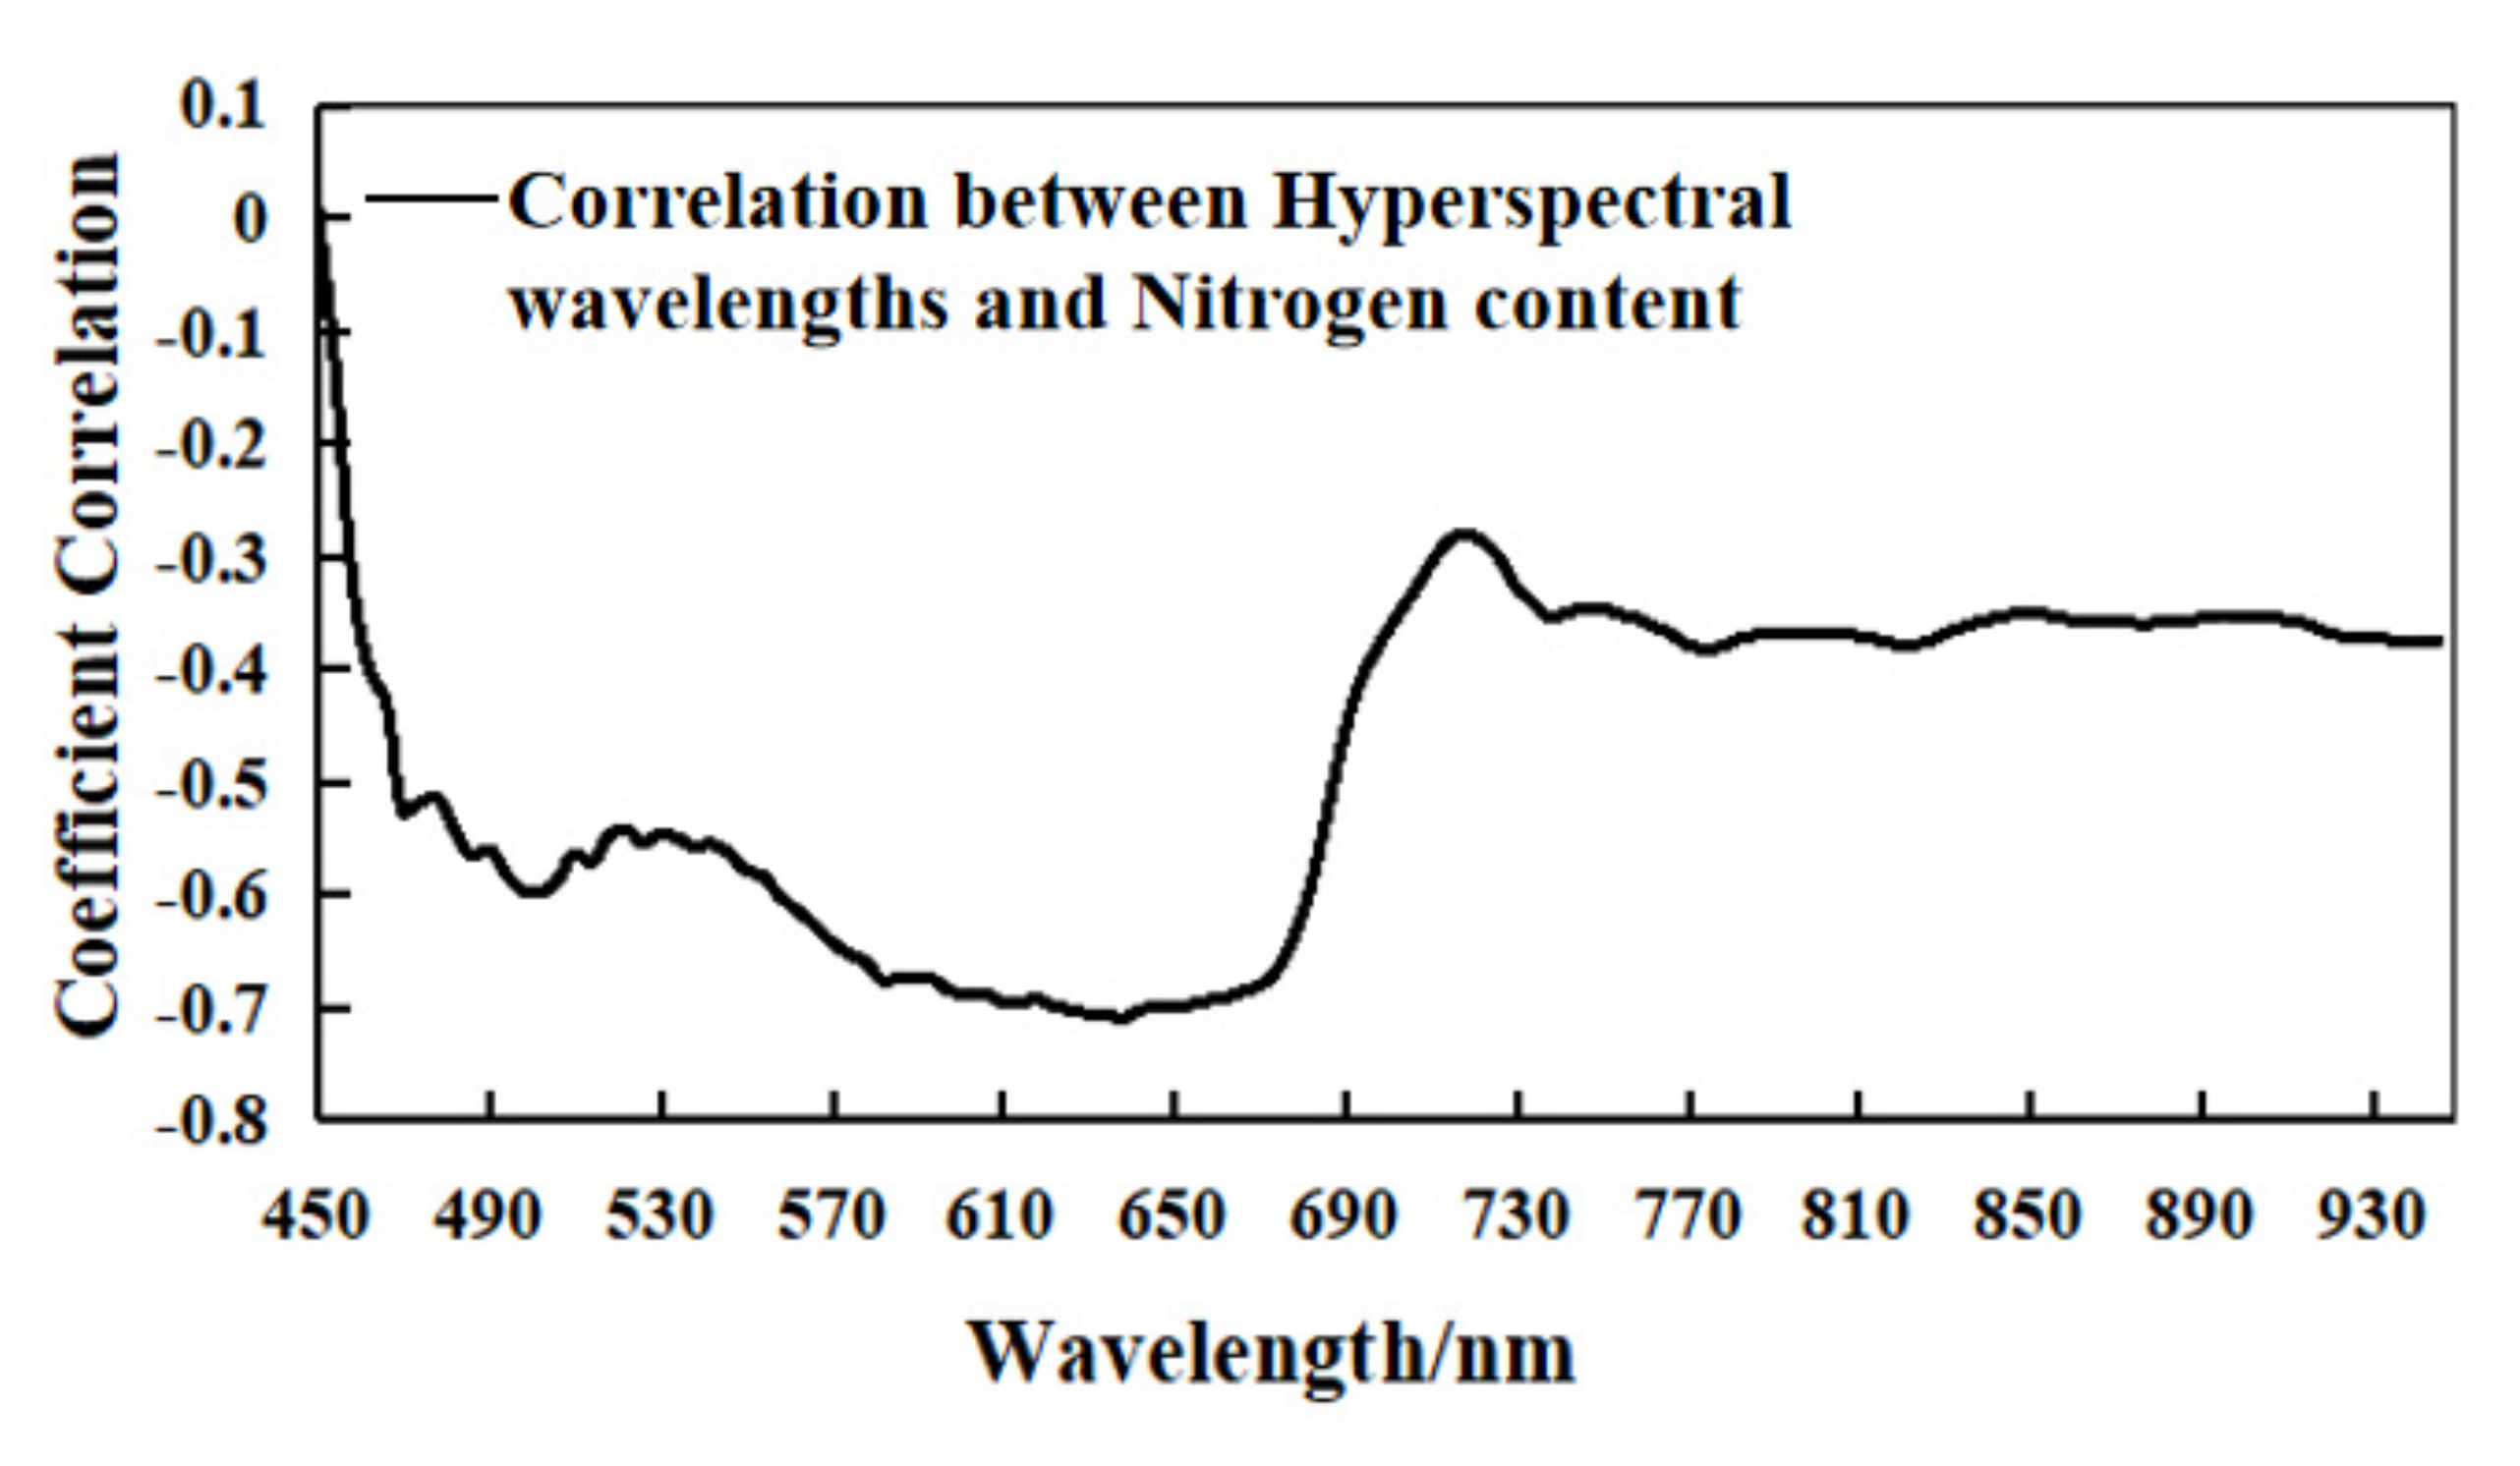
Correlation coefficient calculation: a correlation analysis was conducted among the spectral data from the UAV hyperspectral image and nitrogen content.
(2)
Location of first sensitive wavelength determined: the wavelengths that are higher than 0.5 were correlated with the nitrogen content, screened out and arranged according to the wavelength order. The first wavelength with correlation higher than 0.5 was identified as the first sensitive wavelength.
(3)
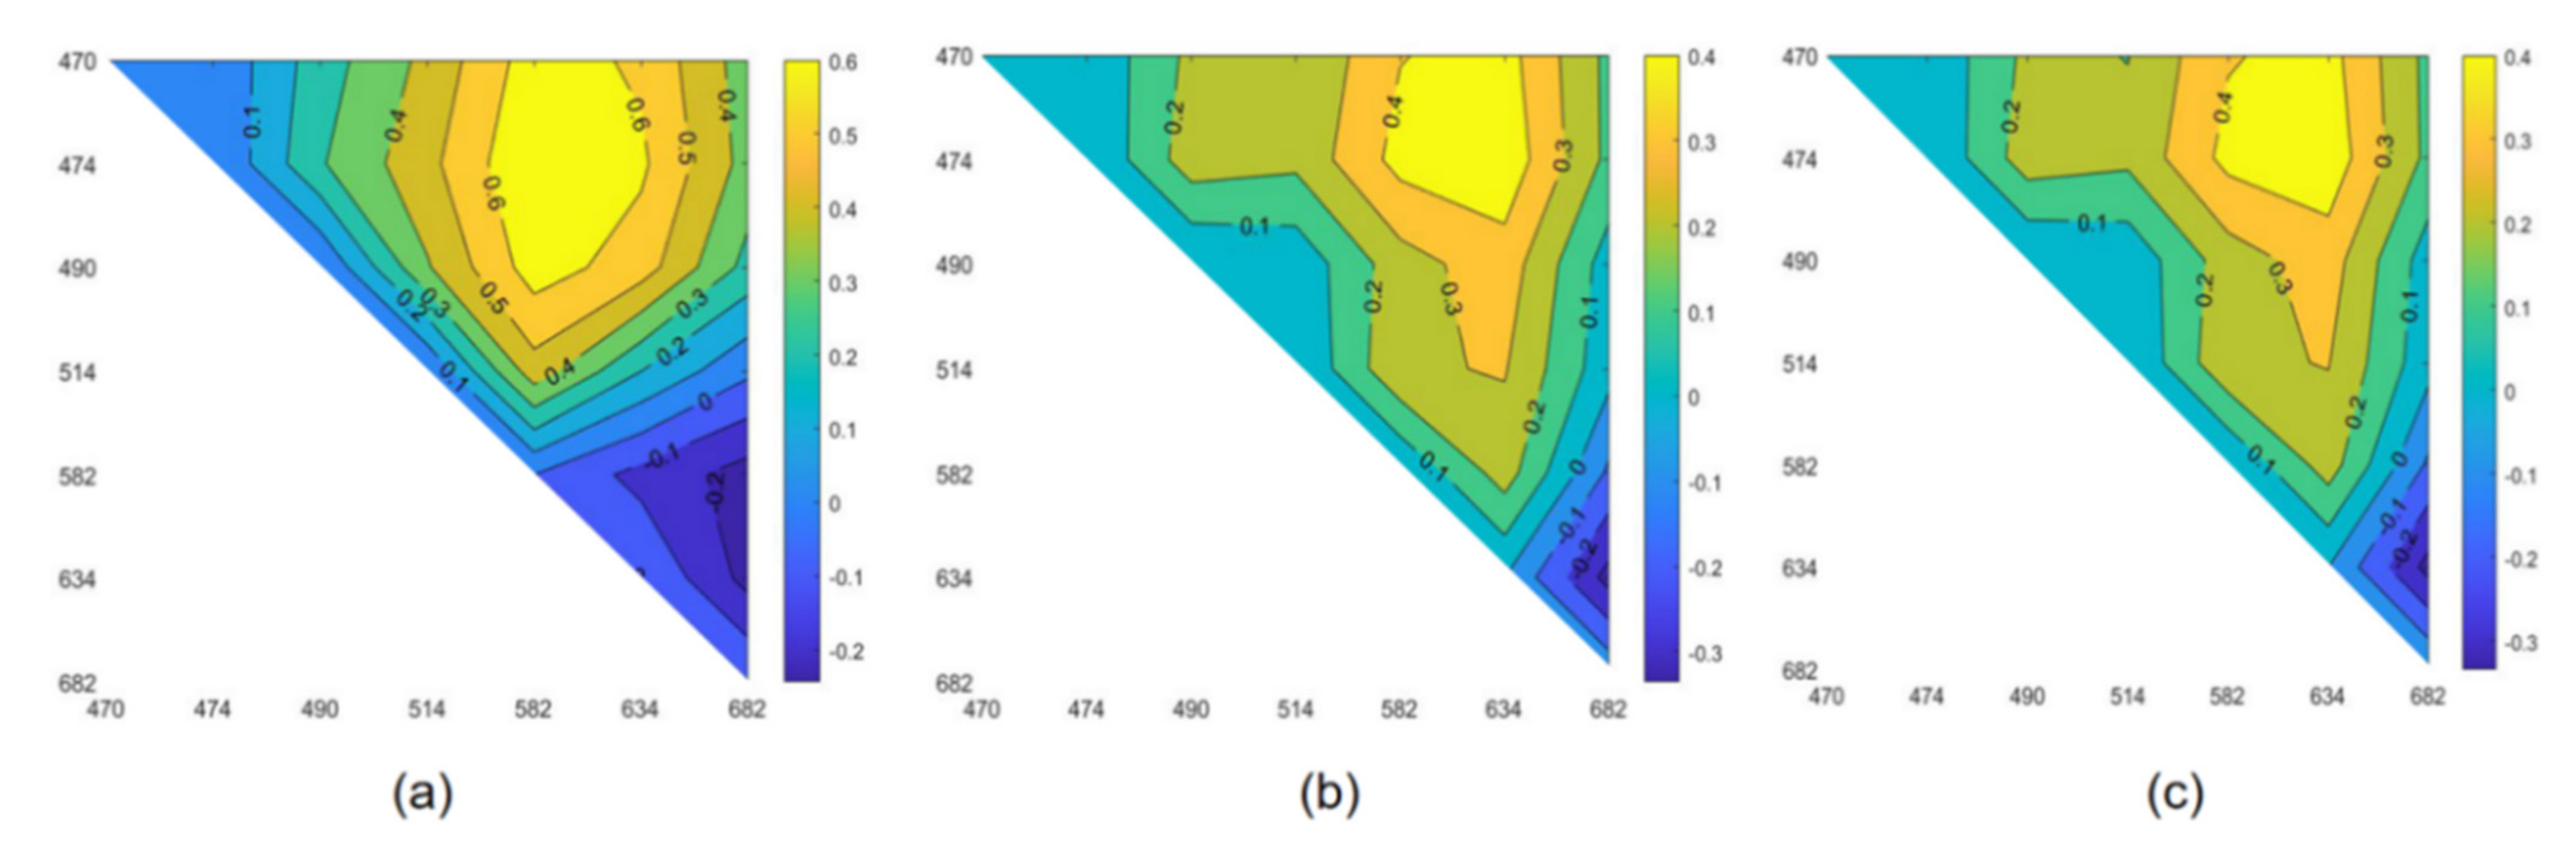
Nitrogen content sensitive wavelength screening: the wavelength autocorrelation threshold was set, the correlation between the first sensitive wavelength and the remaining wavelengths was analyzed, and the position of the second sensitive wavelength was determined according to the threshold. A correlation analysis was conducted among the spectral data of the determined second sensitive wavelength and those of other wavelengths, and the position of the third sensitive wavelength was determined according to the autocorrelation threshold between the wavelengths. This step was repeated until all bands were covered, and finally all sensitive wavelengths of nitrogen content within the band range of the hyperspectral data were determined.
The determination of the threshold of autocorrelation between wavelengths was the key parameter of the sensitive wavelength screening in this study. In this study, 0.05 was used as the threshold boundary to screen the sensitive wavelengths of nitrogen content in tree canopy under different thresholds. Based on the screened sensitive wavelengths, a Multiple Linear Regressions (MLR) was constructed to determine the optimal threshold values based on the accuracy of the model.

2.3.3. Construction of Spectral Characteristic Parameters

The spectral parameters were constructed by mathematical transformation of the selected sensitive wavelengths. In this study, two random sensitive wavelengths were selected and combined. Then Difference Spectral Index (DSI), Ratio Spectral Index (RSI), and Normalized Difference Spectral Index (NDSI) were constructed. The Double Difference Index (DDI) was constructed by a combination of any random three wavelengths. The calculation methods are shown in Equations (5)–(8) [28].
DSI(x,y) = RxRy
RSI ( x , y ) = R x R y
NDSI ( x , y ) = R y R x R y + R x
DDI(x,y,z) = RxRyRz
In Equations (5)–(8), x, y and z represent the corresponding spectral reflectance (Rx, Ry, Rz) of the x, y and z bands within the band range of 450~950 nm, respectively.

2.3.4. Model Establishment and Testing

In this study, Multiple Linear Regression (MLR), Partial Least Squares (PLS), Support Vector Machine (SVM), and BP Neural Network (BPNN) were used to construct the retrieval model of the canopy nitrogen content. SVM and BPNN were constructed using DPS. The specific parameters of the two models are shown in Table 2 and Table 3 [29,30,31].
The determination coefficient (R2), Root Mean Square Error (RMSE), normalized Root Mean Square Error (nRMSE), and mean absolute error (MAE) were used to verify the accuracy of the model. The calculation methods are shown in Equations (9)–(12). The accuracy of nitrogen content retrieval models was compared, and the optimal model was then selected [32,33].
R 2 = i = 1 n y ^ i y ¯ 2 i = 1 n y i y ¯ 2
RMSE = 1 n i = 1 n y i y ^ i 2
nRMSE = RMSE y ¯ 100 %
MAE = 1 n i = 1 n y ^ i y i
In Equations (9)–(12), y i is the measured reflectivity value, y ^ i is the anticipated value, y ¯ is the average value of the measured values, y ¯ i is the average value of the predicted values, and n is the number of samples. In Equation (11), y ¯ is the average value of measured values, and RMSE is the root mean square error.

3. Results

3.1. Determination of NDCSI Threshold and the Extraction of Apple Canopy Hyperspectral Images

The vegetation index, NDVI, NDCSI, and calculation results of the hyperspectral images of the apple canopy are shown in Figure 4. NDCSI had a stronger canopy shadow recognition ability compared with NDVI. Therefore, it could effectively identify the shadows inside the canopy. The gray values of the apple tree canopy, soil background, and shadow were compared, and the results are shown as follows: apple tree canopy > shadow > soil background. Based on NDCSI, a reasonable threshold value could be set to effectively remove soil and shadow from UAV hyperspectral images.
Figure 5 shows the canopy recognition of hyperspectral images of arbor and dwarf trees under different thresholds of NDCSI. When the NDCSI threshold of spectral images of the canopy of arbor trees was set at 0.03, some shadows inside the canopy were still unrecognized. When the threshold was set at 0.04, the canopy was over-fragmented. When the threshold value was set at 0.035, most of the shadows inside the canopy could be recognized, and the overall shape of the canopy was relatively intact. Therefore, 0.035 was set as the threshold value of NDCSI of the hyperspectral images of the arbor trees. When the NDCSI threshold of hyperspectral images of dwarf fruit trees was set at 0.035, some shadows in the canopy were still unrecognized. When the threshold was set at 0.045, the canopy was over-fragmented. When the threshold value was set at 0.04, most of the shadows inside the canopy could be recognized, and the overall shape of the canopy was relatively intact. Therefore, 0.04 was set as the threshold value of NDCSI in the hyperspectral images of the dwarf fruit trees.
The threshold of the NDCSI of the hyperspectral images of arbor trees was determined to be 0.035, and 0.04 was determined to be the threshold of the NDCSI of hyperspectral images of the dwarf trees. A mask was established to extract the canopy hyperspectral images, and the canopy hyperspectral spectral images resulting from shadow removal are shown in Figure 6.

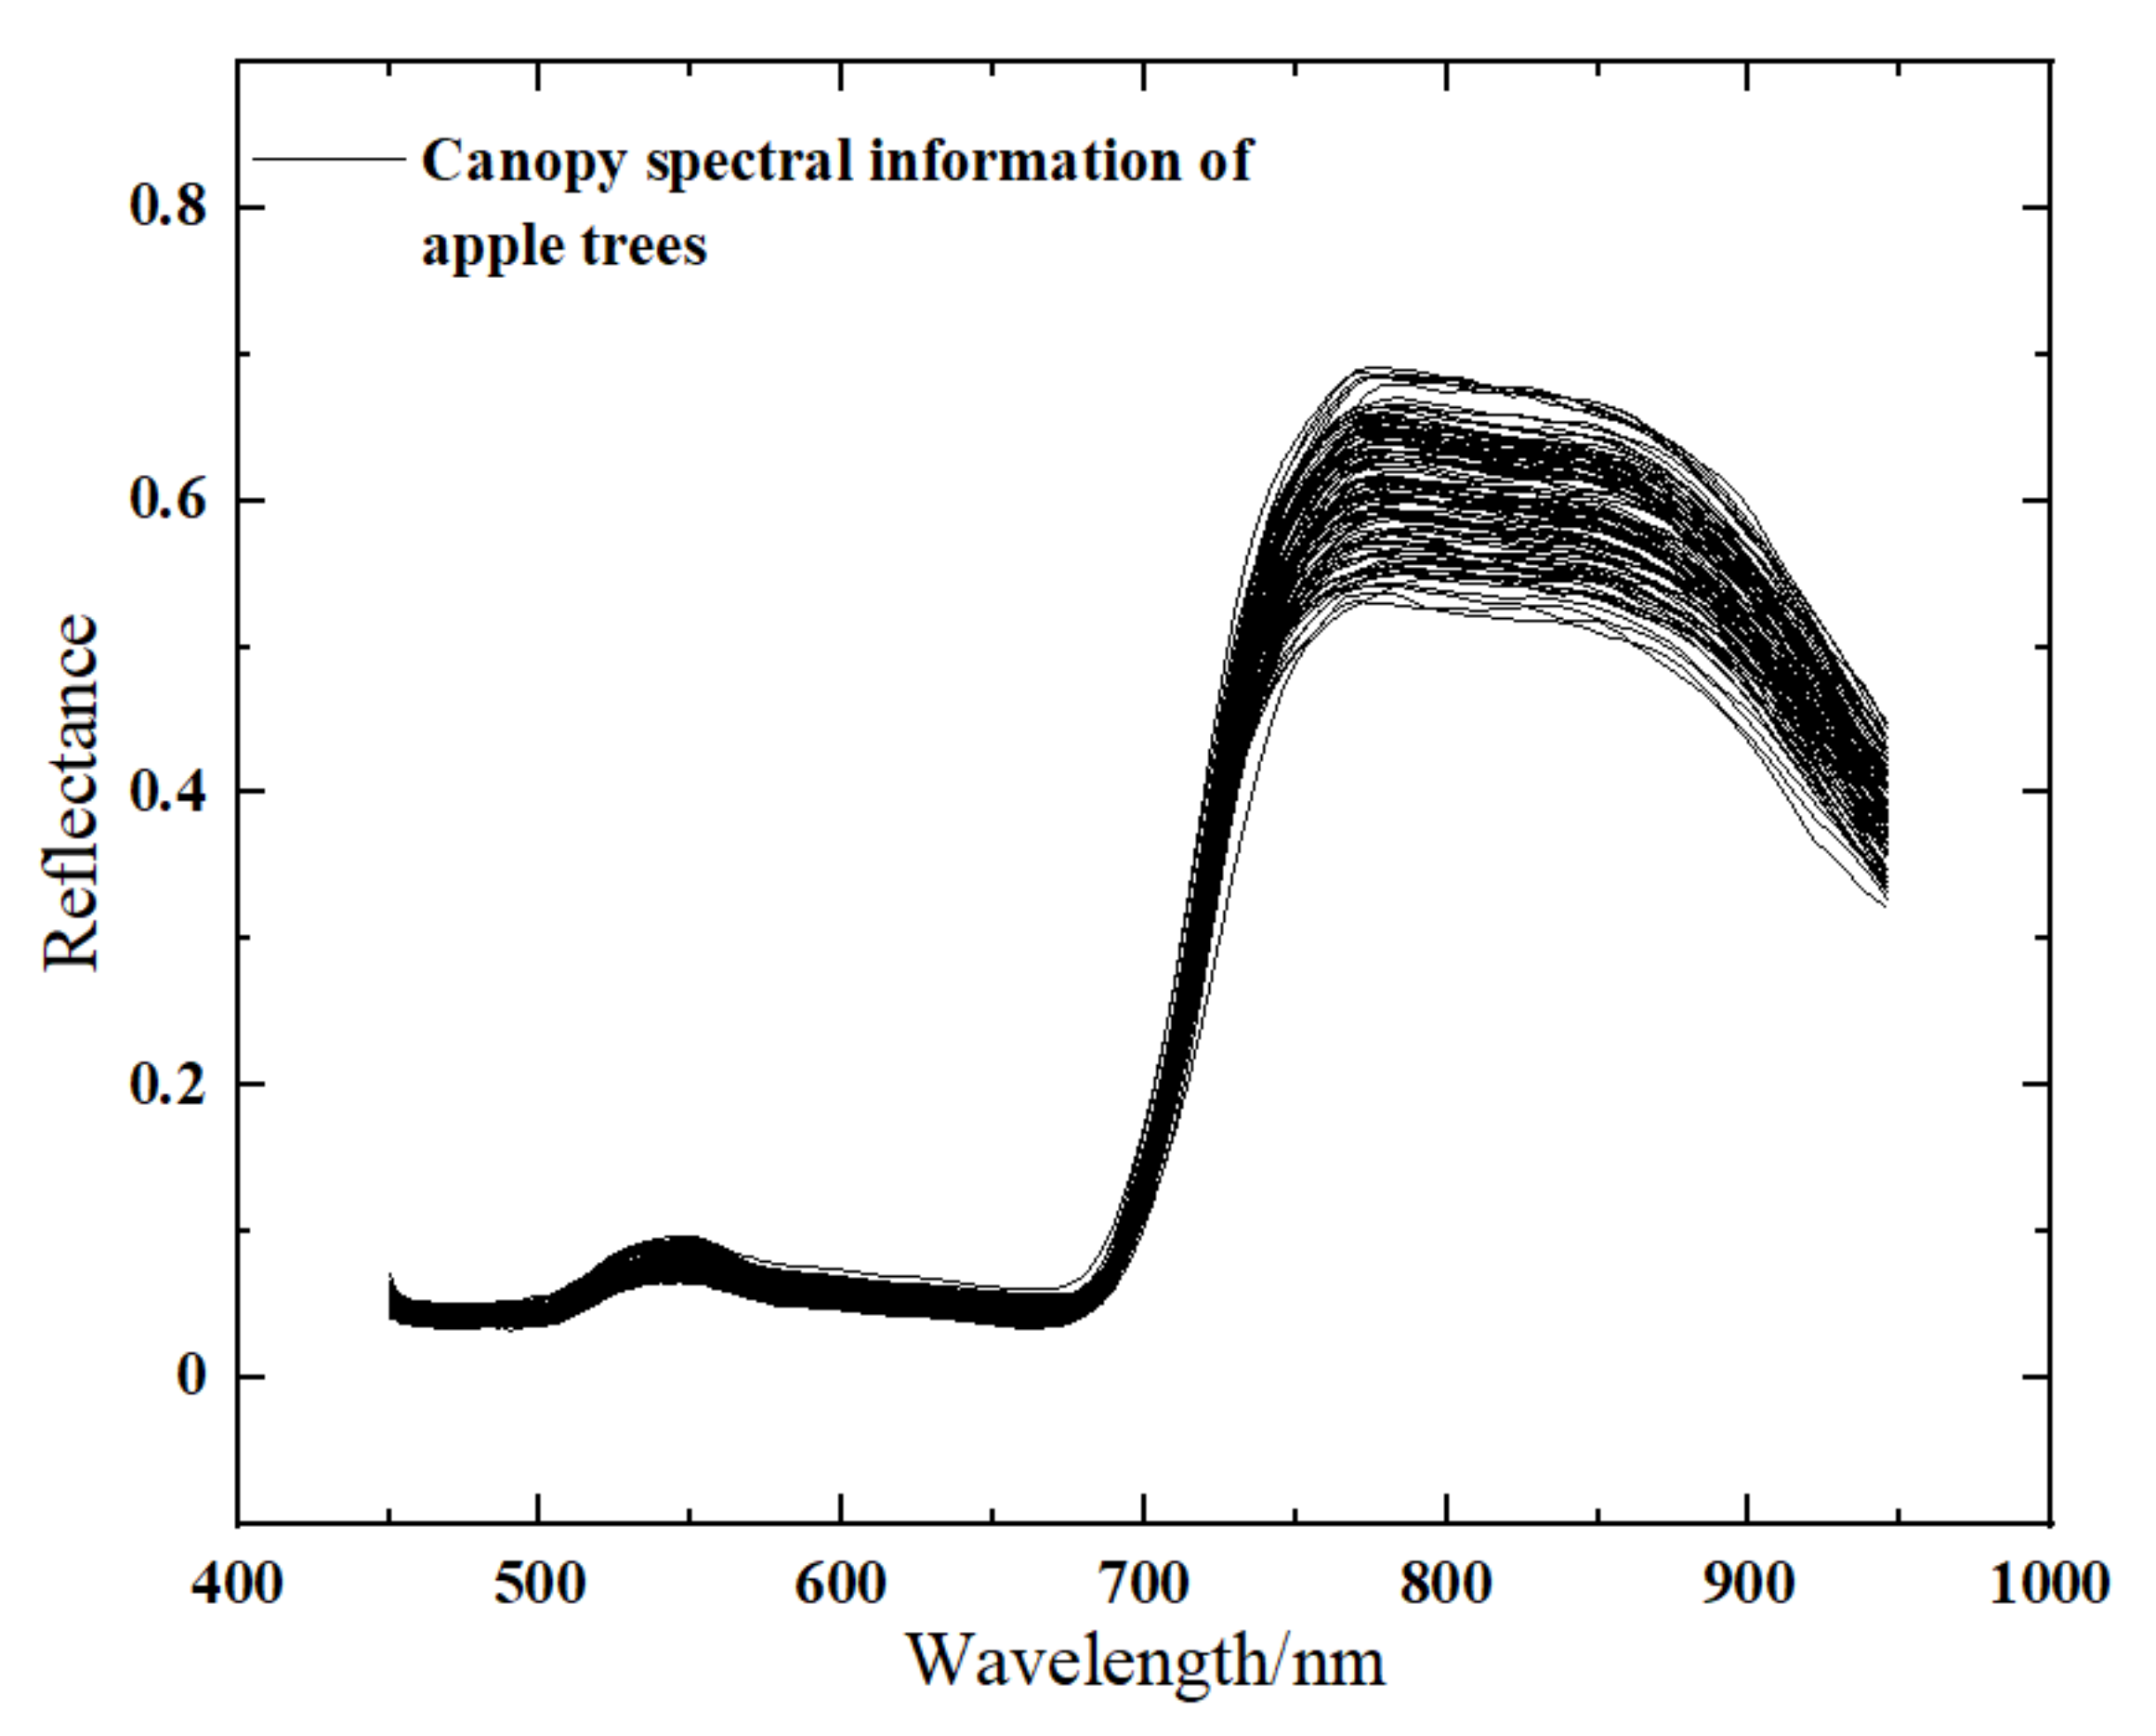
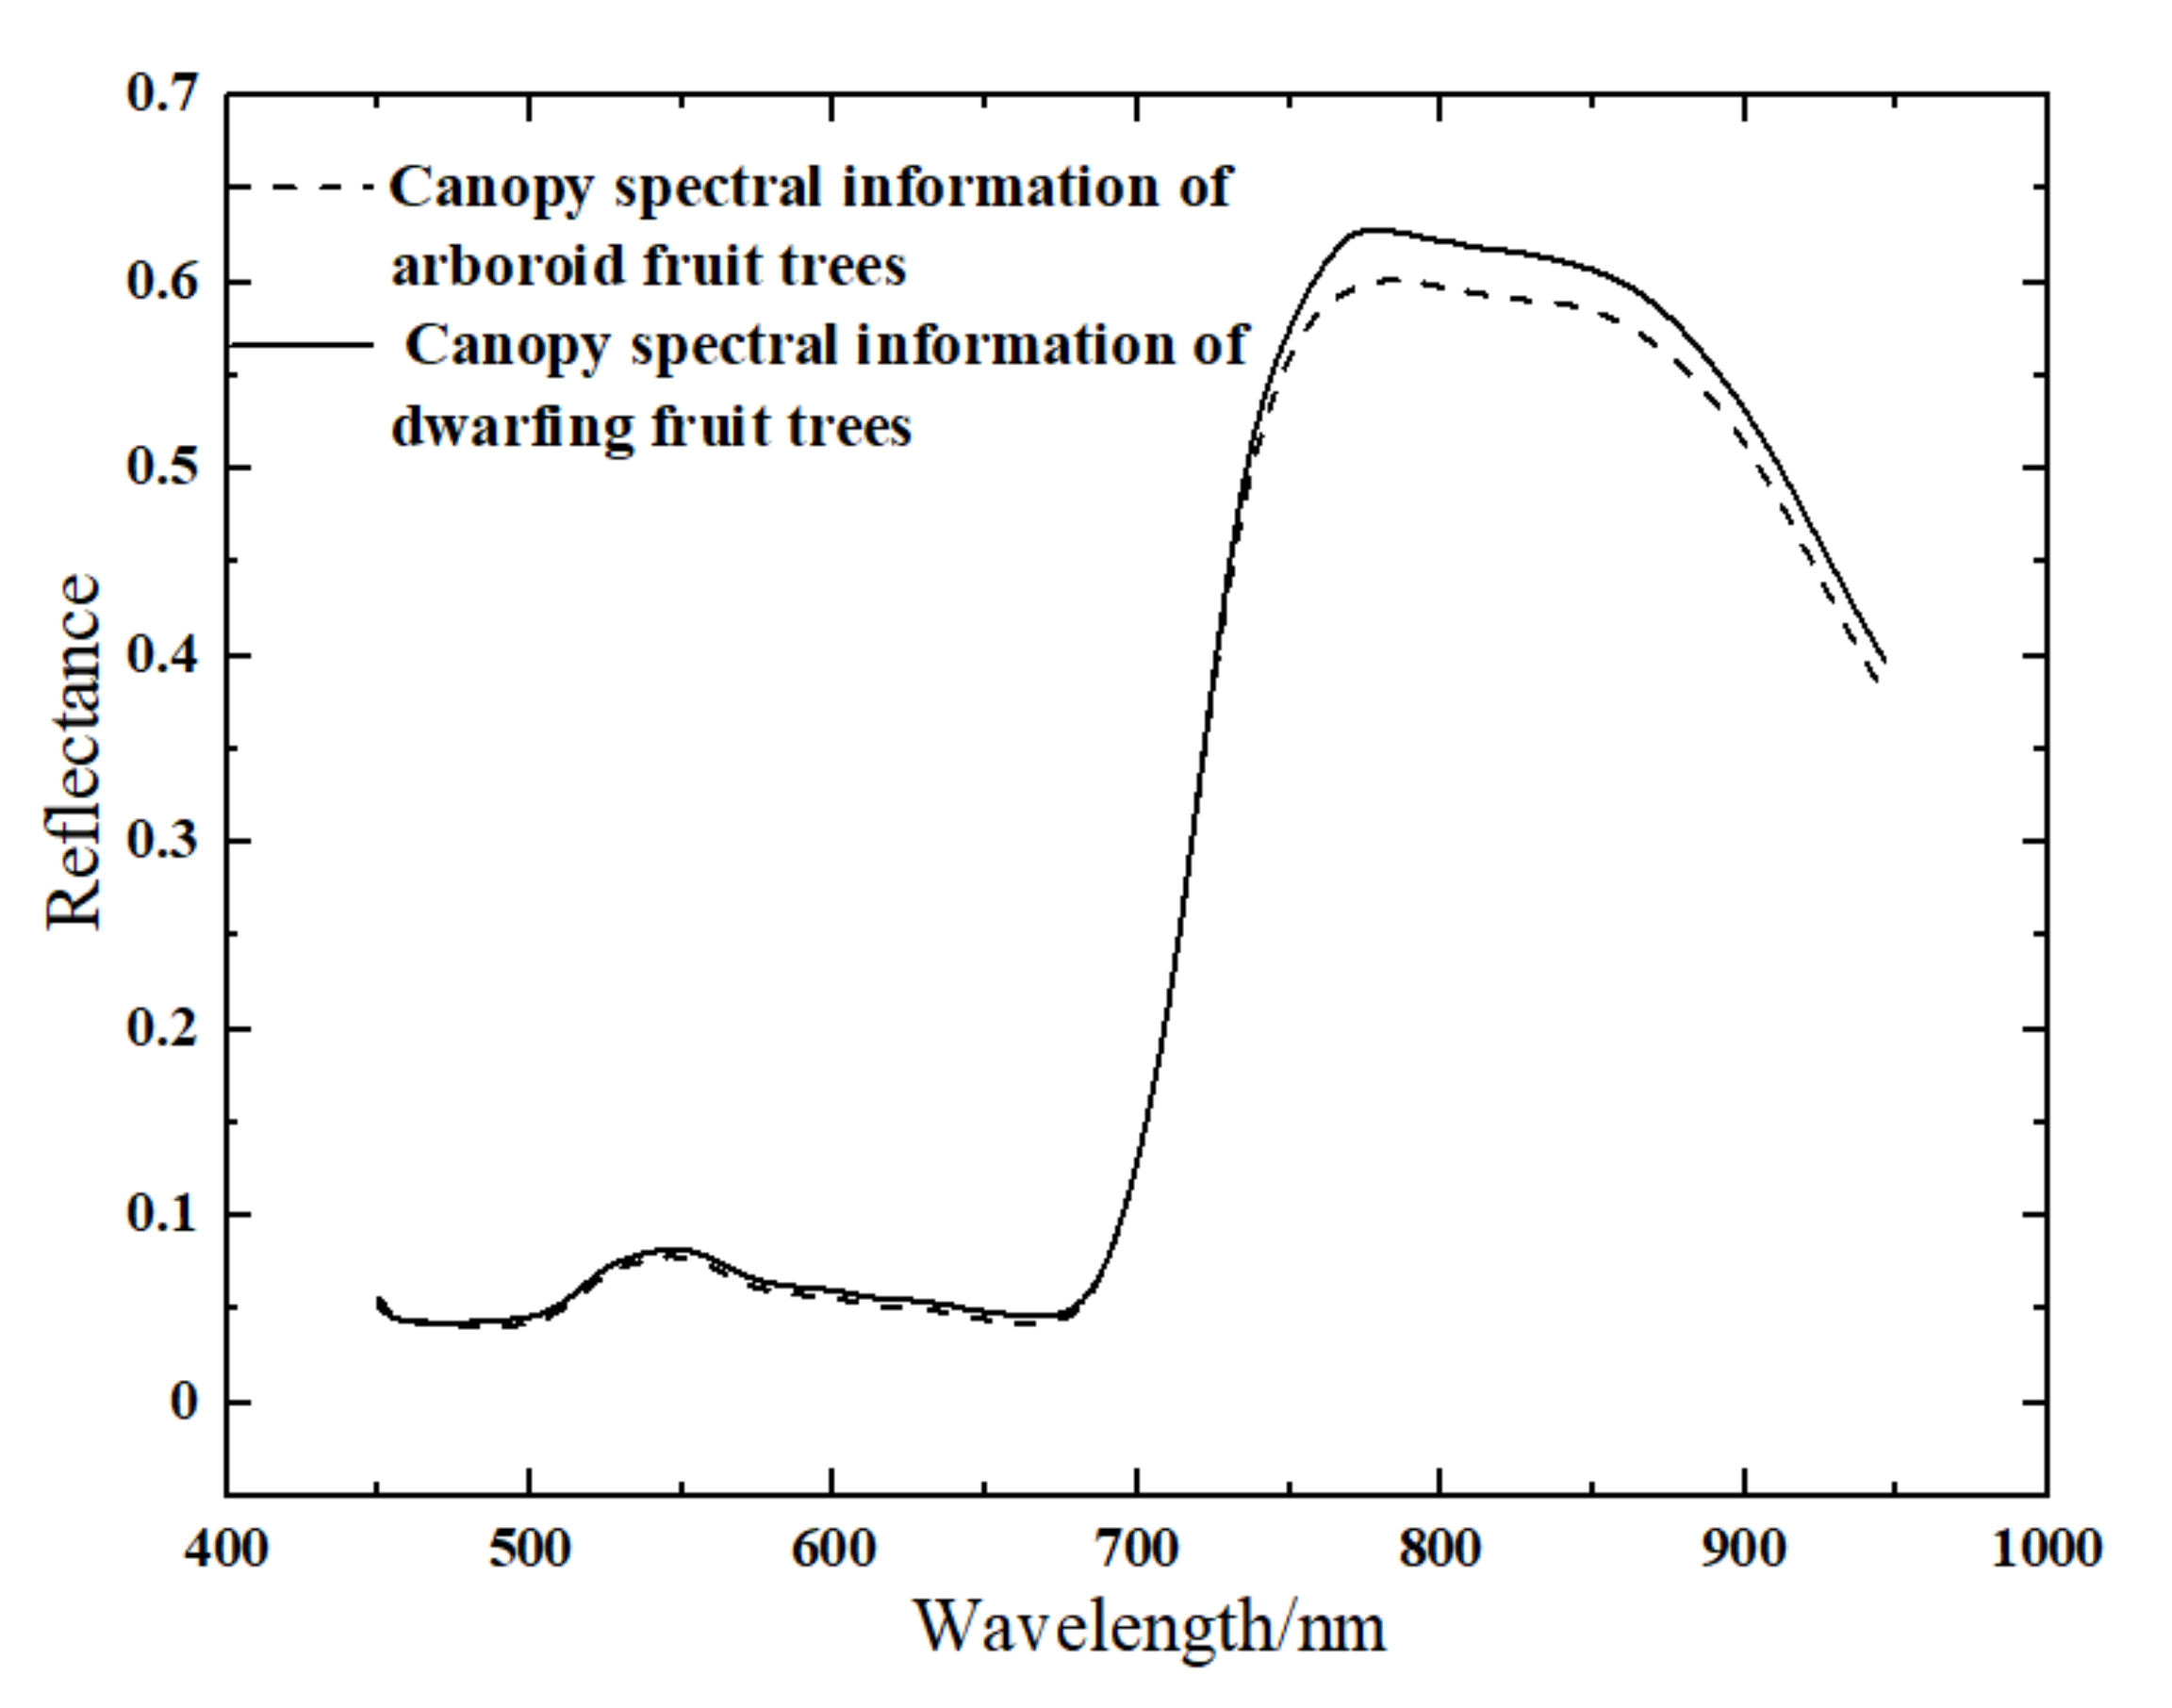
3.2. Spectral Characteristics Analysis of Tree Canopy

Canopy spectral information was extracted based on the UAV hyperspectral image after soil removal and shadow removal, and the spectral curve of the apple tree canopy is shown in Figure 7. In the band between 450 nm~500 nm and 650 nm~700 nm, the visible light radiation is absorbed by the chlorophyll in the canopy leaves and is applied to photosynthesis, so two absorption valleys are formed in this band. At 550 nm, the reflection effect is strong, and then a small reflection peak is formed. Spectral reflectance increases sharply at 700 nm–750 nm, and gradually flattens after entering the near-infrared region.
As shown in Figure 8, by comparing the canopy spectral information of arbor and dwarf trees, it was found that the canopy spectral reflectance of dwarf trees was higher than that of the arbor trees, especially in the near-infrared band. This was due to the different canopy structures of apple trees. Compared with dwarf trees, the canopy of arbor tree trees is denser, with more irregular surfaces and larger reflection dispersion. Therefore, the spectral reflectance of the arbor tree canopy was lower than that of dwarf trees. The differences in the spectral characteristics of vegetation caused by tree structure were mainly concentrated in the near-infrared band, with little difference in the overall hyper-spectrum band range. Therefore, the sensitive wavelength screening and nitrogen retrieval model construction process do not distinguish tree structure.

3.3. Sensitive Wavelength Screening and Spectral Parameter Construction of Nitrogen Content Based on MCCM

3.3.1. Correlation Analysis between Canopy Spectral Reflectance and Nitrogen Content

The correlation curve between hyperspectral reflectance of each wavelength and the nitrogen content of the apple tree canopy is shown in Figure 9. There is a negative correlation between the hyperspectral wavelengths and the nitrogen content in the tree canopy, and the correlation between the hyperspectral wavelengths and the nitrogen content was higher between 660 nm and 690 nm.

3.3.2. Threshold Determination and Sensitive Wavelength Screening Based on MCCM

MCCM was used to screen the sensitive wavelengths of nitrogen content in the tree canopy, and the results were shown in Table 4. To ensure a high level of accuracy of the threshold, MLR was applied to build a quantitative model and to evaluate the accuracy level. The accuracy level of the MLR based on the selected sensitive wavelengths under different thresholds was compared to determine the optimal threshold of the autocorrelation between wavelengths.
In this study, a reasonable threshold value of autocorrelation between wavelengths was explored, with a step size of 0.05. The results showed that when the threshold value was greater than 0.8, the sensitive wavelength of nitrogen content in the tree canopy could be obtained within the hyperspectral band range. By comparing the accuracy level of the MLR based on screening the sensitive wavelengths at different thresholds, it was found that the lower the threshold is, the fewer sensitive wavelengths were screened, and the accuracy level of the nutrient retrieval model was lowered. When the inter-band correlation threshold was set to 0.95, the sensitive wavelengths of canopy height spectral image screening were 470, 474, 490, 514, 582, 634 nm. At this time, the R2 of the training set and verification set of MLR constructed was the highest, and the RMSE was at its lowest. Therefore, 0.95 was taken as the threshold of inter-wavelength correlation.

3.3.3. Construction of Spectral Parameters

Four spectral parameters, DSI (x, y) RSI (x, y) NDSI (x, y) and DDI (x, y, z), were constructed by randomly combining two or three selected nitrogen content-sensitive wavelengths. A correlation analysis between spectral parameters and canopy nitrogen content was conducted, and the results were shown in Figure 10 and Table 5.
The correlation between RSI(x, y), NDSI(x, y) and nitrogen content was less than 0.5 in the spectral parameters constructed by the combination of two wavelengths. DSI(x, y) had a higher correlation with nitrogen content, and the correlation between DSI(470,582), DSI(470,634), DSI(474,582), DSI(474,634), DSI(490,582), DSI(490,634) and nitrogen content was higher than 0.5. The correlation between DSI(470,582), DSI(474,582), DSI(474,634), DSI(490,582) and nitrogen content were higher than 0.6.
The correlation coefficients between the spectral parameters and the nitrogen content based on three wavelengths were all higher than 0.5, and the highest correlation was DDI(474 nm; 582 nm; 634 nm). The correlation coefficient was 0.735, indicating that the correlation between the nitrogen content and the spectral parameters constructed based on the three sensitive wavelengths was higher than that constructed based on the two sensitive wavelengths.
Finally, six sensitive spectral parameters of nitrogen content were screened, namely DDI(474;514;634), DDI(474;582;634), DDI(490;582;634), DDI(514;582;634), DDI(470;582;634), and DDI(474;490;634); the correlation coefficients were 0.697, 0.735, 0.728, 0.716, 0.718 and 0.701, respectively.

3.4. Construction and Verification of Apple Tree Canopy Nitrogen Retrieval Model

Six spectral parameters, DDI(474;514;634), DDI(474;582;634), DDI(490;582;634), DDI(514;582;634), DDI(470;582;634), DDI(474;490;634), were used to construct the MLR, PLS, SVM and BPNN, and the results were shown in Table 6.
The results showed that the accuracy of the nonlinear model was higher than that of the linear model. The SVM was 0.09 higher than the MLR R2, 1.11% lower than RMSE, 2.53% lower than nRMSE, and 1.17% lower than MAE. The validation set R2 was 0.095 higher, RMSE was 1.69% lower, nRMSE was 11.4% lower, and MAE was 1.83% lower. Compared with PLS, the SVM R2 was 0.152 higher, RMSE was 1.31% lower, nRMSE was 5.85% lower, and MAE was 1.52% lower. The validation set R2 was 0.124 higher, RMSE was 0.8% lower, nRMSE was 6.1% lower, and MAE was 1.83% lower. Compared with MLR, the BPNN R2 was 0.038 higher, RMSE was 0.68% lower, nRMSE was 1.8% lower, and MAE was 0.45 lower. The validation set R2 was 0.094 higher, RMSE was 1.78% lower, nRMSE was 11.04% lower, and MAE was 2.21% lower. The BPNN was 0.1 higher than the PLS R2, 0.88% lower than RMSE, 1.52% lower than nRMSE, and 0.8% lower than MAE. The validation set R2 was 0.123 higher, RMSE was 0.89% lower, nRMSE was 5.74% lower, and MAE was 0.6% lower. The results show that the precision of the model based on machine learning was higher than that of the linear model.
The results showed that the R2 of SVM was 0.052 higher than that of BPNN, the RMSE was 0.43% lower, the nRMSE was 4.33% lower, and the MAE was 0.72% lower than that of BPNN. The validation set R2 was 0.001 higher, RMSE was 0.09% higher, nRMSE was 0.36% lower, and MAE was 0.38% higher. Therefore, SVM is the best retrieval model for nitrogen content.

4. Discussion

MCCM was proposed to solve the traditional problem of intensive distribution of sensitive wavelengths. It can filter out the most relative wavelengths within the entire band. The nitrogen retrieval model with sensitive wavelengths based on MCCM had a high accuracy level, it was feasible, and it can be used in the retrieval of nitrogen content in vegetation studies. However, the determination of the optimal threshold between wavelengths in this method needs to be further explored. In addition, the results show that spectral parameters constructed by mathematical transformation such as addition, subtraction, and division can enhance the correlation between spectral data and nitrogen content, and the correlation between spectral parameters constructed based on three wavelengths was higher than that based on two wavelengths, which was consistent with the results from previous studies [34,35,36].
The background information in the image will weaken the canopy spectral information and will reduce the model retrieval accuracy [37,38,39]. In previous studies, NDCSI was used to extract multi-spectral UAV dwarf tree canopy images, and the results showed that the nitrogen retrieval model constructed based on spectral data extracted from the NDCSI image had a higher accuracy level [40]. In this study, the extraction effect of NDCSI in UAV hyperspectral canopy imagery of apple trees with different planting methods was explored, which provides a reference for future vegetation nutrient retrieval based on UAV hyperspectral imagery. However, the threshold screening process is complicated. In the future, combined with the mixed pixel decomposition method, an effective method of canopy image extraction can be further explored.

5. Conclusions

In this study, a UAV hyperspectral image was used as the data source, NDCSI was used to extract the canopy hyperspectral image of apple trees, the MCCM was used to select the sensitive wavelength of nitrogen content in the canopy of apple trees, and the retrieval model of nitrogen content in UAV hyperspectral image was established. The sensitive wavelengths of nitrogen content screened based on MCCM were 470 nm, 474 nm, 490 nm, 514 nm, 582 nm, 634 nm, and 682 nm. The larger the autocorrelation threshold, the more sensitive wavelengths were screened and the higher the accuracy of the model constructed. A threshold of 0.95 was determined to be the optimal threshold of the correlation coefficient between wavelengths. Among the constructed MLR, PLS, SVM, and BPNN nitrogen content inversion models, the best model for nitrogen content retrieval was SVM, in which the R2, RMSE, nRMSE, and MAE were 0.733%, 6.00%, 12.76% and 4.49%, respectively. The validation set R2 was 0.671, RMSE was 4.73%, nRMSE was 14.83%, and MAE was 3.98%. This study can provide technical support for the quantitative retrieval of vegetation nutrients based on hyperspectral data. Further study will be conducted to explore the application of dimension reduction methods for hyperspectral images to improve the utilization efficiency of hyperspectral data.

Author Contributions

Conceptualization, M.L. and X.Z.; methodology, M.L. and X.Z.; software, M.L., W.L. and X.T.; validation, M.L., W.L., X.T. and X.Y.; formal analysis, M.L., X.Z., X.Y. and Y.J.; investigation, M.L., X.Z., W.L., X.T. and Y.J.; resources, X.Z. and Y.J.; data curation, M.L., W.L. and X.T.; writing—original draft preparation, M.L.; writing—review and editing, X.Z. and X.Y.; visualization, M.L. and X.Z.; supervision, X.Z. and Y.J.; funding acquisition, X.Z. All authors have read and agreed to the published version of the manuscript.

Funding

This research was supported by the National Natural Science Foundation of China (42171378), the National Key Research and Development Program of China (2017YFE0122500), the Major Science and Technology Innovation Project of Shandong Province (2018CXGC0209). and the Shandong Taishan Scholars Climbing Program.

Institutional Review Board Statement

Not applicable.

Informed Consent Statement

Not applicable.

Data Availability Statement

Not applicable.

Conflicts of Interest

The authors declare no conflict of interest of the study.

References

  1. Bergera, K.; Verrelst, J.; Féret, J.; Wang, Z.; Wocher, M.; Strathmann, M.; Danner, M.; Mauser, W.; Hank, T. Crop nitrogen monitoring: Recent progress and principal developments in the context of imaging spectroscopy missions. Remote Sens. Environ. 2020, 242, 11758–11775. [Google Scholar] [CrossRef]
  2. Bhadra, S.; Sagan, V.; Maimaitijiang, M.; Maimaitiyiming, M.; Newcomb, M.; Shakoor, N.; Mockler, T. Quantifying Leaf Chlorophyll Concentration of Sorghum from Hyperspectral Data Using Derivative Calculus and Machine Learning. Remote Sens. 2020, 12, 2082. [Google Scholar] [CrossRef]
  3. Padalia, H.; Sinha, S.K.; Bhave, V.; Trivedi, N.K.; Kumar, A.S. Estimating canopy LAI and chlorophyll of tropical forest plantation (North India) using Sentinel-2 data. Adv. Space Res. 2020, 65, 458–469. [Google Scholar] [CrossRef]
  4. Huang, Y.; Chen, Z.; Yu, T.; Huang, X.; Gu, X. Agricultural remote sensing big data: Management and applications. J. Int. Agric. 2018, 17, 1915–1931. [Google Scholar] [CrossRef]
  5. Hansen, P.M.; Schjoerring, J.K. Reflectance measurement of canopy biomass and nitrogen status in wheat crops using normalized difference vegetation indices and partial least squares regression. Remote Sens. Environ. 2003, 86, 542–553. [Google Scholar] [CrossRef]
  6. Cammarano, D.; Fitzgerald, G.; Basso, B.; O’Leary, G.; Chen, D.; Grace, P.; Fiorentino, C. Use of the Canopy Chlorophyll Content Index (CCCI) for the remote estimation of wheat nitrogen content in rainfed environments. Agron. J. 2011, 103, 1597–1603. [Google Scholar] [CrossRef]
  7. Zhao, C.; Wang, Z.; Wang, J.; Huang, W. Relationships of leaf nitrogen concentration and canopy nitrogen density with spectral features parameters and narrow-band spectral indices calculated from field winter wheat (Triticum aestivum L.) spectra. Int. J. Remote Sens. 2012, 33, 3472–3491. [Google Scholar] [CrossRef]
  8. Lee, H.; Wang, J.; Leblon, B. Intra-Field Canopy Nitrogen Retrieval from Unmanned Aerial Vehicle Imagery for Wheat and Corn Fields. Can. J. Remote Sens. 2020, 46, 454–472. [Google Scholar] [CrossRef]
  9. Amirruddin, A.D.; Muharam, F.M. Evaluation of linear discriminant and support vector machine classifiers for classification of nitrogen status in mature oil palm from SPOT-6 satellite images: Analysis of raw spectral bands and spectral indices. Geocarto Int. 2018, 34, 735–749. [Google Scholar] [CrossRef]
  10. Croft, H.; Arabian, J.; Chen, J.M.; Shang, J.; Liu, J. Mapping within-field leaf chlorophyll content in agricultural crops for nitrogen management using Landsat-8 imagery. Precis. Agric. 2020, 21, 856–880. [Google Scholar] [CrossRef] [Green Version]
  11. Zhou, X.; Zhang, J.; Chen, D.; Huang, Y.; Kong, W.; Yuan, L.; Ye, H.; Huang, W. Assessment of Leaf Chlorophyll Content Models for Winter Wheat Using Landsat-8 Multispectral Remote Sensing Data. Remote Sens. 2020, 12, 2574. [Google Scholar] [CrossRef]
  12. Mananze, S.; Pôças, I.; Cunha, M. Retrieval of Maize Leaf Area Index Using Hyperspectral and Multispectral Data. Remote Sens. 2018, 10, 1942. [Google Scholar] [CrossRef] [Green Version]
  13. Poblete-Echeverría, C.; Olmedo, G.; Ingram, B.; Bardeen, M. Detection and Segmentation of Vine Canopy in Ultra-High Spatial Resolution RGB Imagery Obtained from Unmanned Aerial Vehicle (UAV): A Case Study in a Commercial Vineyard. Remote Sens. 2017, 9, 268. [Google Scholar] [CrossRef] [Green Version]
  14. Zarco-Tejada, P.J.; Morales, A.; Testi, L.; Villalobos, F.J. Spatio-temporal patterns of chlorophyll fluorescence and physiological and structural indices acquired from hyperspectral imagery as compared with carbon fluxes measured with eddy covariance. Remote Sens. Environ. 2013, 133, 102–115. [Google Scholar] [CrossRef]
  15. Maes, W.H.; Steppe, K. Perspectives for Remote Sensing with Unmanned Aerial Vehicles in Precision Agriculture. Trends. Plant Sci. 2019, 24, 152–164. [Google Scholar] [CrossRef]
  16. Weiss, M.; Jacob, F.; Duveiller, G. Remote sensing for agricultural applications: A meta-review. Remote Sens. Environ. 2020, 236, 111402–111421. [Google Scholar] [CrossRef]
  17. Kalacska, M.; Lalonde, M.; Moore, T.R. Estimation of foliar chlorophyll and nitrogen content in an ombrotrophic bog from hyperspectral data: Scaling from leaf to image. Remote Sens. Environ. 2015, 169, 270–279. [Google Scholar] [CrossRef]
  18. Zheng, H.; Li, W.; Jiang, J.; Liu, Y.; Cheng, T.; Tian, Y.; Zhu, Y.; Cao, W.; Zhang, Y.; Yao, X. A Comparative Assessment of Different Modeling Algorithms for Estimating Leaf Nitrogen Content in Winter Wheat Using Multispectral Images from an Unmanned Aerial Vehicle. Remote Sens. 2018, 10, 2026. [Google Scholar] [CrossRef] [Green Version]
  19. Deng, L.; Mao, Z.; Li, X.; Hu, Z.; Duan, F.; Yan, Y. UAV-based multispectral remote sensing for precision agriculture: A comparison between different cameras. Isprs. J. Photogramm. 2018, 146, 124–136. [Google Scholar] [CrossRef]
  20. Li, Z.; Li, Z.; Fairbairn, D.; Li, N.; Xu, B.; Feng, H.; Yang, G. Multi-LUTs method for canopy nitrogen density estimation in winter wheat by field and UAV hyperspectral. Comput. Electron. Agric. 2019, 162, 174–182. [Google Scholar] [CrossRef]
  21. Cao, Y.; Jiang, K.; Wu, J.; Yu, F.; Du, W.; Xu, T. Inversion modeling of japonica rice canopy chlorophyll content with UAV hyperspectral remote sensing. PLoS ONE 2020, 15, e0238530. [Google Scholar] [CrossRef]
  22. Fu, Y.; Yang, G.; Li, Z.; Li, H.; Li, Z.; Xu, X.; Song, X.; Zhang, Y.; Duan, D.; Zhao, C.; et al. Progress of hyperspectral data processing and modelling for cereal crop nitrogen monitoring. Comput. Electron. Agric. 2020, 172, 105321–105334. [Google Scholar] [CrossRef]
  23. Zhang, J.; Rivard, B.; Rogge, D. The Successive Projection Algorithm (SPA), an Algorithm with a Spatial Constraint for the Automatic Search of Endmembers in Hyperspectral Data. Sensors 2008, 8, 1321–1342. [Google Scholar] [CrossRef] [Green Version]
  24. Sonobe, R.; Sano, T.; Horie, H. Using spectral reflectance to estimate leaf chlorophyll content of tea with shading treatments. Biosyst. Eng. 2018, 175, 168–182. [Google Scholar] [CrossRef]
  25. Zhu, H.; Liu, H.; Xu, Y.; Yang, G. UAV-based hyperspectral analysis and spectral indices constructing for quantitatively monitoring leaf nitrogen content of winter wheat. Appl. Opt. 2018, 57, 7722–7732. [Google Scholar] [CrossRef]
  26. Xu, N.; Tian, J.; Tian, Q.; Xu, K.; Tang, S. Analysis of Vegetation Red Edge with Different Illuminated/Shaded Canopy Proportions and to Construct Normalized Difference Canopy Shadow Index. Remote Sens. 2019, 11, 1192. [Google Scholar] [CrossRef] [Green Version]
  27. Yu, R.; Zhu, X.; Cao, S.; Xiong, J.; Wen, X.; Jiang, Y.; Zhao, G. Estimation of Chlorophyll Content in Apple Leaves Based on Imaging Spectroscopy. J. Appl. Spectrosc. 2019, 86, 457–464. [Google Scholar] [CrossRef]
  28. Feng, S.; Xu, T.; Yu, F.; Chen, C.; Yang, X.; Wang, N. Research of Method for Inverting Nitrogen Content in Canopy Leaves of Japonica Rice in Northeastern China Based on Hyperspectral Remote Sensing of Unmanned Aerial Vehicle. Spectrosc. Spect. Anal. 2019, 39, 3281–3287. [Google Scholar]
  29. Shah, S.; Angel, Y.; Houborg, R.; Ali, S.; McCabe, M. A Random Forest Machine Learning Approach for the Retrieval of Leaf Chlorophyll Content in Wheat. Remote Sens. 2019, 11, 920. [Google Scholar] [CrossRef] [Green Version]
  30. Lee, H.; Wang, J.; Leblon, B. Using linear regression, Random Forests, and Support Vector Machine with unmanned aerial vehicle multispectral images to predict canopy nitrogen weight in corn. Remote Sens. 2020, 12, 2071. [Google Scholar] [CrossRef]
  31. Roshani, G.H.; Nazemi, E.; Roshani, M.M. Flow regime independent volume fraction estimation in three-phase flows using dual-energy broad beam technique and artificial neural network. Neural Comput. Appl. 2017, 28, 1265–1274. [Google Scholar] [CrossRef]
  32. Sattari, M.A.; Roshani, G.H.; Hanus, R.; Nazemi, E. Applicability of time-domain feature extraction methods and artificial intelligence in two-phase flow meters based on gamma-ray absorption technique. Measurement 2021, 168, 108474. [Google Scholar] [CrossRef]
  33. Hasan, U.; Sawut, M.; Chen, S. Estimating the Leaf Area Index of Winter Wheat Based on Unmanned Aerial Vehicle RGB-Image Parameters. Sustainability 2019, 11, 6829. [Google Scholar] [CrossRef] [Green Version]
  34. Liu, H.; Zhu, H.; Wang, P. Quantitative modelling for leaf nitrogen content of winter wheat using UAV-based hyperspectral data. Int. J. Remote Sens. 2016, 38, 2117–2134. [Google Scholar] [CrossRef]
  35. Wang, X.; Zhang, J.; Meng, P.; Yang, H.; Sun, S. Estimation of Nitrogen Content in Walnut Canopy Based on UAV Remote Sensing Image. T Chin. Soc. Agric. Mach. 2021, 52, 178–187. [Google Scholar]
  36. Liu, T.; Shi, T.; Zhang, H.; Wu, C. Detection of Rise Damage by Leaf Folder (Cnaphalocrocis medinalis) Using Unmanned Aerial Vehicle Based Hyperspectral Data. Sustainability 2020, 12, 9343. [Google Scholar] [CrossRef]
  37. Noh, H.; Zhang, Q. Shadow effect on multi-spectral image for detection of nitrogen deficiency in corn. Comput. Electron. Agric. 2012, 83, 52–57. [Google Scholar] [CrossRef]
  38. Aboutalebi, M.; Torres-Rua, A.; Kustas, W.; Nieto, H.; Coopmans, C.; McKee, M. Assessment of different methods for shadow detection in high-resolution optical imagery and evaluation of shadow impact on calculation of NDVI, and evapotranspiration. Irrig. Sci. 2018, 37, 407–429. [Google Scholar] [CrossRef]
  39. Milas, A.; Arend, K.; Mayer, C.; Simonson, M.; Mackey, S. Different colours of shadows: Classification of UAV images. Int. J. Remote Sens. 2017, 38, 3084–3100. [Google Scholar] [CrossRef]
  40. Li, M.; Zhu, X.; Bai, X.; Peng, Y.; Tian, Z.; Jiang, Y. Remote Sensing Inversion of Nitrogen Content in Apple Canopy Based on Shadow Removal. Sci. Agric. Sin. 2021, 54, 2084–2094. [Google Scholar]
Figure 1. Schematic diagram of the study area. (a) Hyperspectral image of P1 arbor fruit trees. (b) Hyperspectral image of P2 dwarf fruit trees. (c) Hyperspectral image of P3 arbor fruit trees. (d) Hyperspectral image of P4 dwarf fruit trees. The UAV hyperspectral images are standard false-color composite images.
Sustainability 14 01992 g001
Figure 2. Technology roadmap.
Sustainability 14 01992 g002
Figure 3. Procedure diagram of selecting the sensitive band.
Sustainability 14 01992 g003
Figure 4. Calculation results of the vegetation index. (a) NDVI calculation results of the apple tree canopy. (b) NDCSI calculation results of the apple tree canopy image. (c) NDVI calculation results of the apple tree canopy image. (d) NDCSI calculation results of the apple tree canopy image.
Sustainability 14 01992 g004
Figure 5. Determination of NDCSI threshold of multispectral images of fruit trees under different planting patterns. (a) The NDCSI threshold of arbor fruit trees is 0.03. (b) The NDCSI threshold of arbor fruit trees is 0.035. (c) The NDCSI threshold of arbor fruit trees is 0.04. (d) The NDCSI threshold of dwarf fruit trees is 0.35. (e) The NDCSI threshold of dwarf fruit trees is 0.04. (f) The NDCSI threshold of dwarf fruit trees is 0.045.
Sustainability 14 01992 g005
Figure 6. Extracted canopy hyperspectral image. (a) Hyperspectral image of P1 arbor fruit trees after shadow removal. (b) Hyperspectral image of P2 dwarf fruit trees after shadow removal. (c) Hyperspectral image of P3 arbor fruit trees after shadow removal. (d) Hyperspectral image of P4 dwarf fruit trees after shadow removal. The hyperspectral images of the UAV are standard false-color composite images.
Sustainability 14 01992 g006
Figure 7. Hyperspectral curves of the apple tree canopy.
Sustainability 14 01992 g007
Figure 8. Spectral curves of apple trees planted in different ways.
Sustainability 14 01992 g008
Figure 9. Correlation analysis results of Hyperspectral bands and Nitrogen content.
Sustainability 14 01992 g009
Figure 10. Isopotential map of spectral parameters and canopy nitrogen content. (a) Correlation coefficient between DSI(x, y) constructed by sensitive wavelengths and nitrogen content. (b) Correlation coefficient between RSI(x, y) constructed by sensitive wavelengths and nitrogen content. (c) Correlation coefficient between NDSI(x, y) constructed by sensitive wavelengths and nitrogen content.
Sustainability 14 01992 g010
Table 1. Statistical description of nitrogen contents (%) in the leaves of the apple tree canopy.
SampleSample NumberMax Value/%Min Value/%Average Value/%Standard Deviation
Total1002.8822.3732.6280.104
Modelling Set672.8822.3732.6210.113
Validation Set332.7982.4502.6420.083
Table 2. Parameters of SVM.
DegreeGammaCoef0NuEpsilonCashe sizeCostShrinkingProbp
320.0010.50.0011001110.01
Table 3. Parameters of BPNN.
Implied Network LayersEnter the Number of Layer NodesMinimum Training SpeedDynamic ParameterSIGMOIDAllowable ErrorPermission Iterative Number
160.10.60.90.00011000
Table 4. Screening of nitrogen-sensitive bands and evaluation of model accuracy under different correlation thresholds.
Model Building
Correlation ThresholdSensitive Band/nmR2RMSER2RMSE
0.95470, 474, 490, 514, 582,
634, 682 nm
0.5710.0740.5870.052
0.9470, 510, 622, 686 nm0.5010.0800.5820.053
0.85470, 618, 686 nm0.5460.0810.4870.055
0.8470, 650 nm0.5300.0810.4780.056
Table 5. Correlation coefficients between DDI(x, y, z) and nitrogen content based on the MCCM method.
Spectral Characteristic
Parameter
Correlation CoefficientSpectral Characteristic
Parameter
Correlation Coefficient
DDI(470;474;490)0.525DDI(474;490;682)0.609
DDI(470,474;514)0.544DDI(474;514;582)0.657
DDI(470,474;582)0.649DDI(474;514;634)0.697
DDI(470,474;634)0.672DDI(474;514;682)0.624
DDI(470,474;682)0.569DDI(474;582;634)0.735
DDI(470;490;514)0.560DDI(474;582;682)0.678
DDI(470;490;582)0.659DDI(474;634;682)0.657
DDI(470;490;634)0.678DDI(490;514;582)0.647
DDI(470;490;682)0.591DDI(490;514;634)0.694
DDI(470;514;582)0.641DDI(490;514;682)0.609
DDI(470;514;634)0.677DDI(490;582;634)0.728
DDI(470;514;682)0.605DDI(490;582;682)0.664
DDI(470;582;634)0.718DDI(490;634;682)0.641
DDI(470;634;682)0.662DDI(514;582;634)0.716
DDI(470;634;682)0.642DDI(514;582;682)0.640
DDI(474;490;514)0.579DDI(514;634;682)0.577
DDI(474;490;582)0.678DDI(582;634;682)0.537
DDI(474;490;634)0.701
Table 6. Construction results of nitrogen inversion model.
MLRPLSSVMBPNN
Training Set R20.6430.5810.7330.681
RMSE/%7.117.316.006.43
nRMSE/%15.2918.6112.7617.09
MAE/%5.666.014.495.21
Validation setR20.5760.5470.6710.670
RMSE/%6.425.534.734.64
nRMSE/%26.2320.9314.8315.19
MAE/%5.814.203.983.60
Publisher’s Note: MDPI stays neutral with regard to jurisdictional claims in published maps and institutional affiliations.

