
Creating Shared Value and Strategic Corporate Social Responsibility through Outsourcing within Supply Chain Management

 ,
, 
 and
and
Abstract
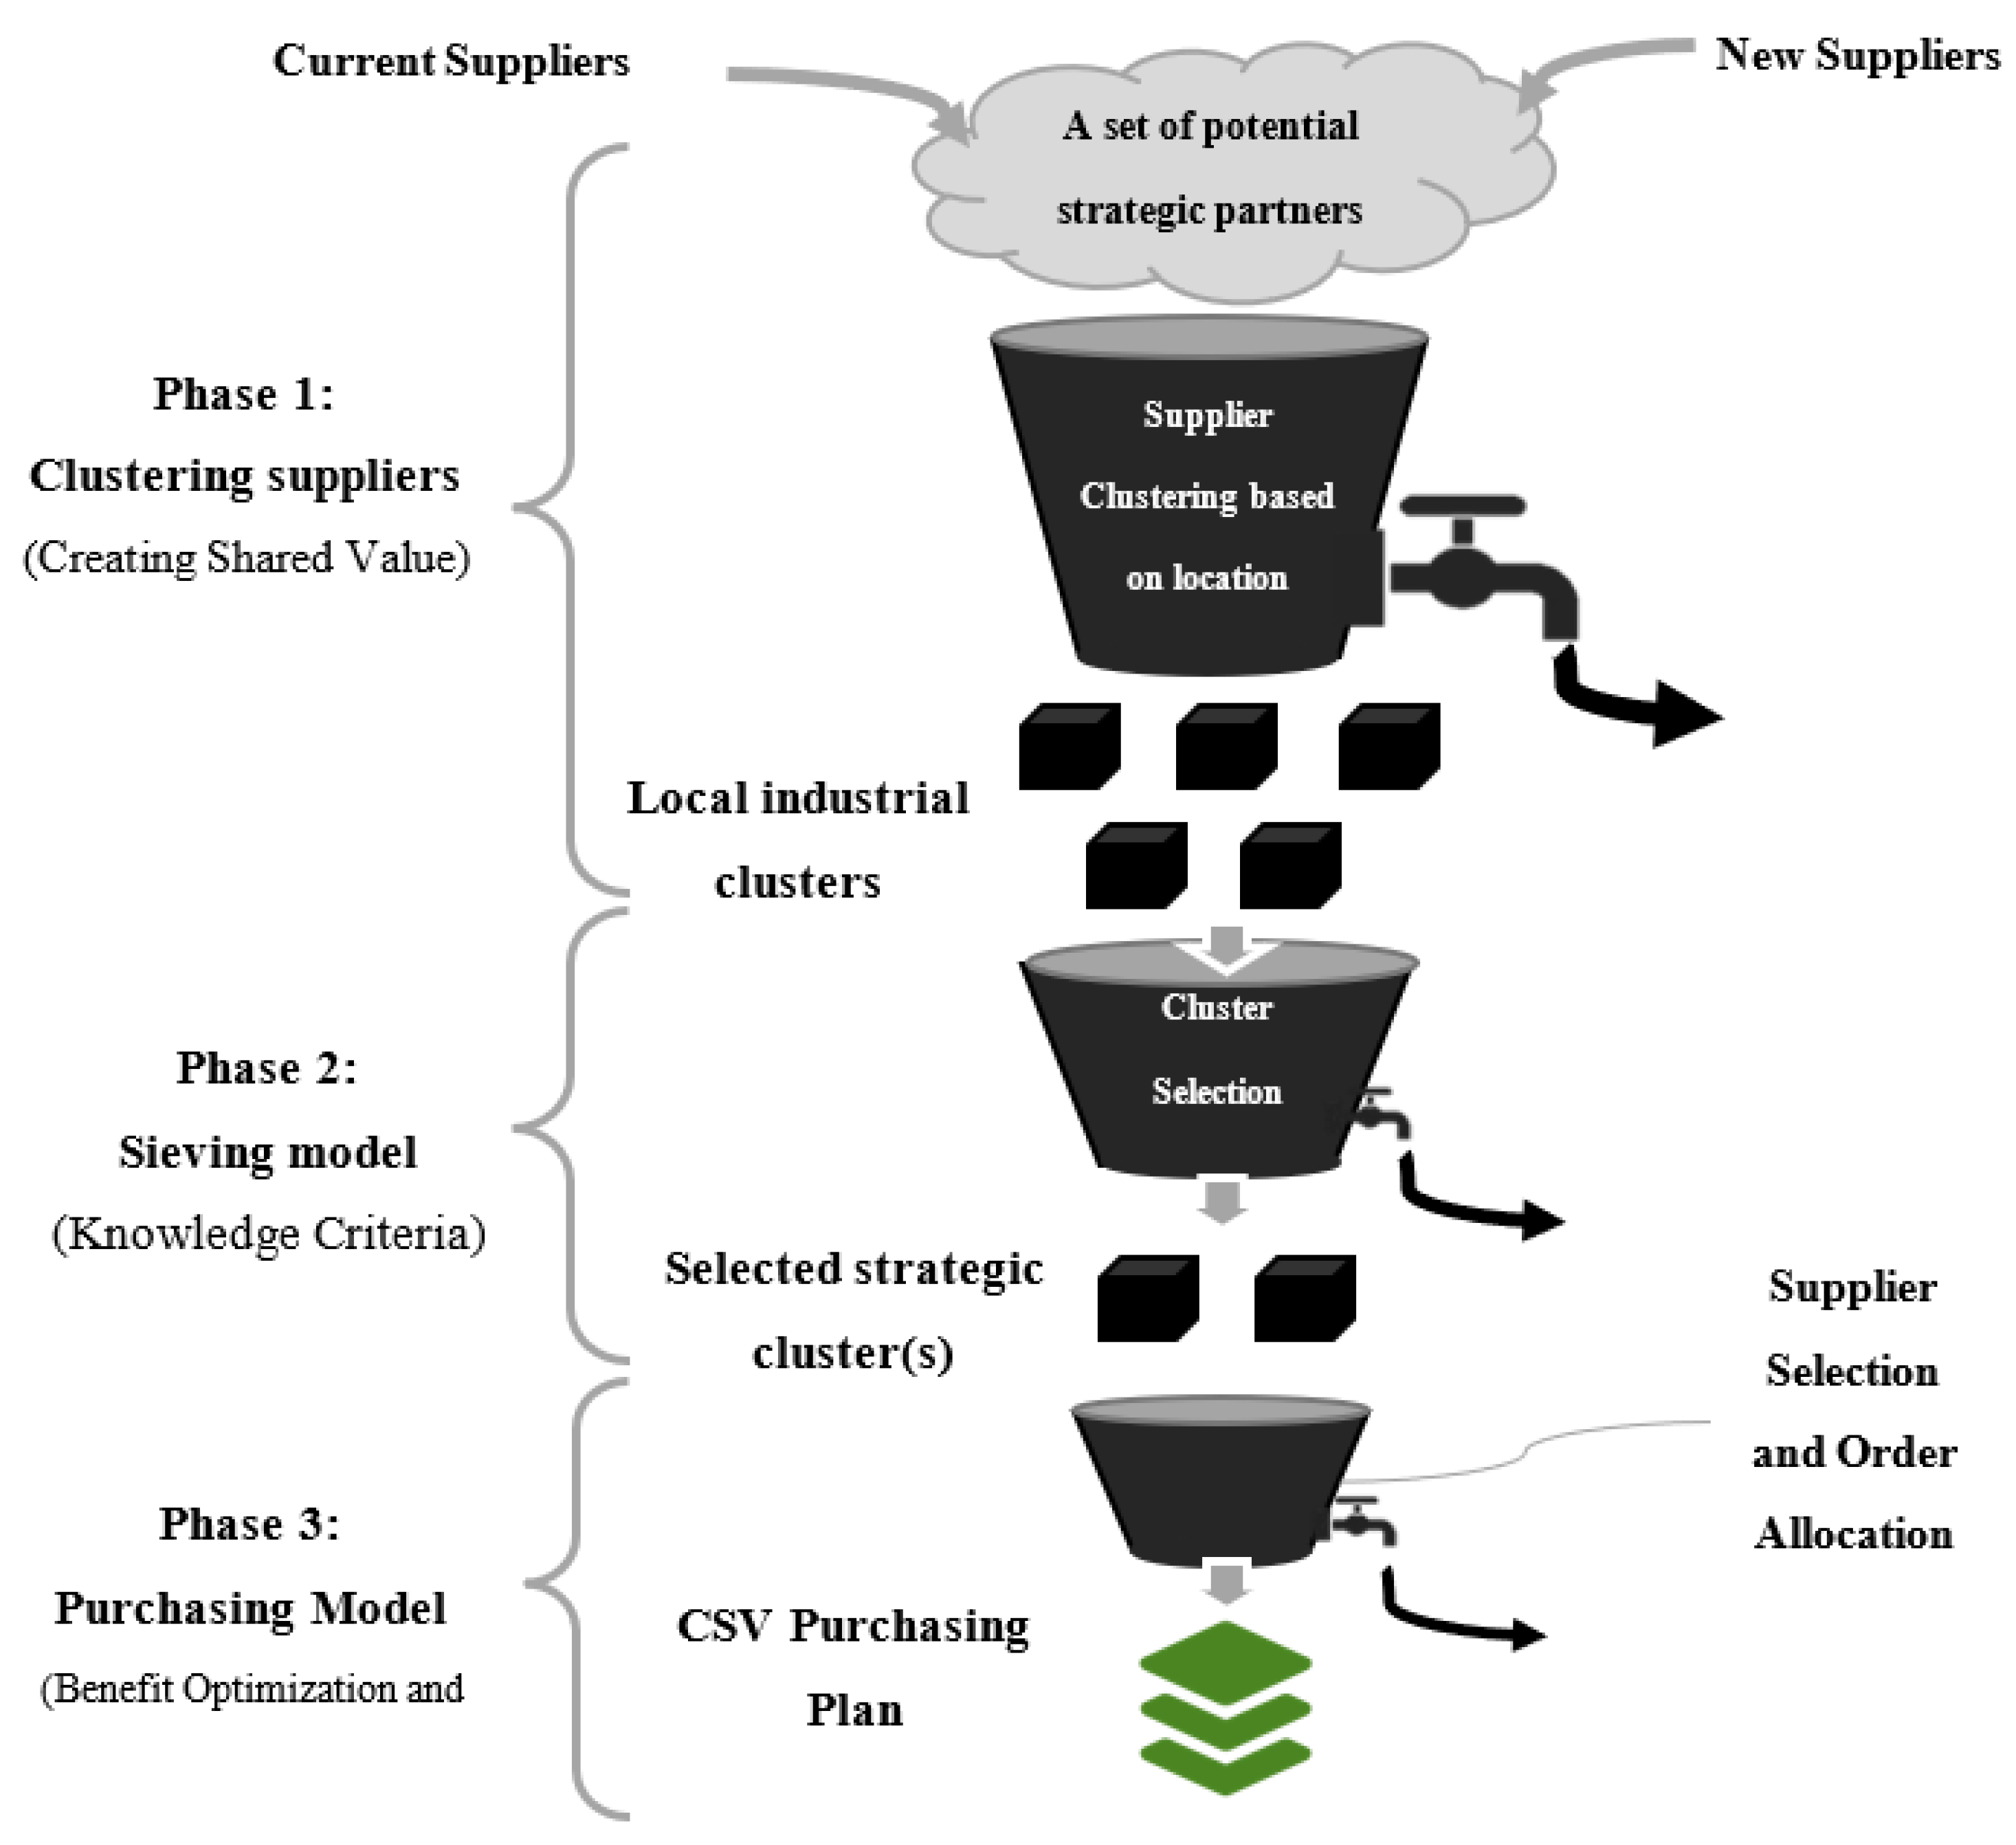
:1. Introduction
2. Literature Review
3. Methods and Materials
4. Results
4.1. Data Normalization of the Sieving Model
4.2. Selection of Clusters
4.3. Purchasing Model Data Collection
4.4. Genetic Algorithm Settings
4.5. Discussions and Managerial Insights
5. Conclusions
Author Contributions
Funding
Institutional Review Board Statement
Informed Consent Statement
Data Availability Statement
Conflicts of Interest
Appendix A. Purchasing Model Variables’ Results in Several GA Implementations
| Variable Name | Run #1 | Run #2 | Run #3 | Run #4 | Run #5 | Run #6 | Run #7 | Variable Name | Run #1 | Run #2 | Run #3 | Run #4 | Run #5 | Run #6 | Run #7 | Variable Name | Run #1 | Run #2 | Run #3 | Run #4 | Run #5 | Run #6 | Run #7 |
| U111 | 0 | 87 | 0 | 0 | 0 | 509 | 0 | U545 | 0 | 0 | 868 | 0 | 1202 | 0 | 2007 | Z327 | 0 | 0 | 1 | 0 | 0 | 0 | 0 |
| U112 | 907 | 0 | 0 | 0 | 1299 | 170 | 0 | U546 | 4022 | 4052 | 0 | 0 | 0 | 505 | 3857 | Z328 | 0 | 0 | 0 | 0 | 0 | 0 | 1 |
| U113 | 0 | 0 | 0 | 0 | 0 | 0 | 0 | U547 | 4155 | 0 | 0 | 0 | 2345 | 0 | 2059 | Z331 | 0 | 1 | 0 | 0 | 1 | 1 | 0 |
| U114 | 0 | 0 | 577 | 0 | 0 | 1277 | 873 | U548 | 0 | 0 | 3643 | 3773 | 523 | 0 | 3060 | Z332 | 1 | 0 | 1 | 0 | 0 | 0 | 0 |
| U115 | 0 | 1185 | 0 | 0 | 0 | 0 | 402 | Q11 | 0 | 697 | 463 | 0 | 764 | 162 | 561 | Z333 | 0 | 1 | 0 | 0 | 1 | 1 | 0 |
| U116 | 0 | 624 | 0 | 631 | 0 | 0 | 591 | Q12 | 0 | 1320 | 1110 | 0 | 0 | 0 | 0 | Z334 | 0 | 0 | 1 | 0 | 0 | 0 | 0 |
| U117 | 774 | 479 | 1300 | 0 | 1080 | 854 | 0 | Q13 | 1222 | 477 | 0 | 0 | 0 | 0 | 919 | Z335 | 0 | 0 | 1 | 1 | 1 | 0 | 0 |
| U118 | 0 | 0 | 1162 | 964 | 0 | 567 | 960 | Q14 | 583 | 804 | 0 | 1446 | 338 | 0 | 0 | Z336 | 0 | 1 | 0 | 0 | 0 | 0 | 1 |
| U121 | 0 | 101 | 0 | 2335 | 0 | 0 | 0 | Q15 | 0 | 0 | 305 | 808 | 662 | 0 | 1144 | Z337 | 1 | 1 | 0 | 1 | 1 | 0 | 0 |
| U122 | 451 | 0 | 133 | 0 | 0 | 0 | 1044 | Q16 | 710 | 0 | 648 | 447 | 1441 | 480 | 0 | Z338 | 0 | 1 | 0 | 0 | 0 | 0 | 0 |
| U123 | 1572 | 0 | 0 | 78 | 0 | 0 | 0 | Q17 | 0 | 0 | 0 | 966 | 0 | 0 | 0 | Z341 | 1 | 0 | 1 | 1 | 1 | 1 | 0 |
| U124 | 0 | 0 | 0 | 1988 | 0 | 0 | 2214 | Q18 | 342 | 0 | 0 | 0 | 0 | 0 | 0 | Z342 | 1 | 1 | 0 | 1 | 0 | 0 | 0 |
| U125 | 0 | 0 | 0 | 1288 | 1313 | 0 | 0 | Q21 | 1227 | 0 | 374 | 0 | 0 | 1770 | 2068 | Z343 | 0 | 1 | 1 | 0 | 0 | 1 | 1 |
| U126 | 1346 | 0 | 2509 | 0 | 0 | 0 | 0 | Q22 | 1561 | 2592 | 0 | 0 | 0 | 1183 | 0 | Z344 | 0 | 1 | 1 | 1 | 1 | 0 | 1 |
| U127 | 729 | 1539 | 0 | 0 | 0 | 0 | 1384 | Q23 | 1008 | 839 | 1532 | 0 | 0 | 0 | 0 | Z345 | 0 | 0 | 0 | 1 | 0 | 0 | 0 |
| U128 | 0 | 0 | 956 | 1115 | 0 | 0 | 0 | Q24 | 0 | 0 | 2600 | 0 | 0 | 753 | 0 | Z346 | 1 | 0 | 1 | 1 | 0 | 0 | 0 |
| U131 | 0 | 0 | 0 | 0 | 472 | 0 | 0 | Q25 | 0 | 448 | 2600 | 0 | 0 | 390 | 0 | Z347 | 0 | 0 | 0 | 1 | 0 | 0 | 0 |
| U132 | 0 | 175 | 1983 | 0 | 953 | 0 | 0 | Q26 | 0 | 0 | 947 | 0 | 0 | 0 | 1324 | Z348 | 1 | 1 | 1 | 1 | 1 | 0 | 0 |
| U133 | 0 | 0 | 0 | 0 | 0 | 0 | 0 | Q27 | 0 | 0 | 0 | 0 | 1929 | 255 | 1262 | Z411 | 0 | 0 | 1 | 1 | 0 | 0 | 0 |
| U134 | 0 | 1179 | 0 | 0 | 928 | 395 | 0 | Q28 | 1041 | 1537 | 0 | 278 | 1845 | 0 | 1287 | Z412 | 1 | 0 | 1 | 0 | 0 | 0 | 1 |
| U135 | 322 | 756 | 2010 | 809 | 0 | 0 | 0 | Q31 | 0 | 0 | 1182 | 421 | 0 | 0 | 767 | Z413 | 0 | 1 | 1 | 0 | 1 | 0 | 1 |
| U136 | 0 | 0 | 447 | 0 | 0 | 813 | 560 | Q32 | 0 | 1208 | 0 | 0 | 0 | 969 | 955 | Z414 | 0 | 0 | 0 | 0 | 0 | 0 | 1 |
| U137 | 370 | 0 | 0 | 1782 | 0 | 0 | 0 | Q33 | 0 | 531 | 2400 | 0 | 317 | 0 | 0 | Z415 | 0 | 0 | 1 | 1 | 1 | 0 | 0 |
| U138 | 0 | 0 | 1714 | 2020 | 1027 | 57 | 0 | Q34 | 1007 | 728 | 0 | 0 | 950 | 1274 | 0 | Z416 | 0 | 1 | 0 | 0 | 0 | 1 | 0 |
| U141 | 0 | 0 | 0 | 0 | 1992 | 1806 | 447 | Q35 | 1514 | 863 | 0 | 797 | 0 | 390 | 1454 | Z417 | 1 | 0 | 0 | 0 | 0 | 1 | 1 |
| U142 | 0 | 1794 | 0 | 0 | 3662 | 0 | 3394 | Q36 | 2070 | 470 | 0 | 1131 | 0 | 0 | 0 | Z418 | 1 | 0 | 0 | 0 | 0 | 0 | 0 |
| U143 | 3894 | 1963 | 3096 | 1239 | 2408 | 0 | 3626 | Q37 | 0 | 0 | 0 | 0 | 0 | 435 | 0 | Z421 | 1 | 0 | 0 | 0 | 0 | 0 | 0 |
| U144 | 4311 | 1666 | 2558 | 0 | 1652 | 383 | 0 | Q38 | 0 | 0 | 426 | 0 | 374 | 2104 | 0 | Z422 | 1 | 0 | 0 | 0 | 0 | 0 | 0 |
| U145 | 0 | 951 | 0 | 0 | 3077 | 3629 | 2805 | Q41 | 0 | 1762 | 0 | 2546 | 0 | 0 | 3817 | Z423 | 0 | 0 | 0 | 1 | 0 | 1 | 0 |
| U146 | 0 | 0 | 0 | 0 | 4374 | 1789 | 0 | Q42 | 3472 | 3165 | 3342 | 0 | 2349 | 0 | 0 | Z424 | 1 | 1 | 0 | 0 | 0 | 0 | 1 |
| U147 | 1484 | 1035 | 0 | 0 | 0 | 4148 | 902 | Q43 | 0 | 0 | 0 | 4319 | 0 | 1104 | 1882 | Z425 | 1 | 1 | 0 | 0 | 0 | 0 | 0 |
| U148 | 0 | 0 | 0 | 0 | 1309 | 0 | 0 | Q44 | 0 | 2891 | 0 | 3425 | 0 | 0 | 4360 | Z426 | 0 | 0 | 0 | 0 | 1 | 0 | 0 |
| U211 | 0 | 416 | 0 | 0 | 0 | 0 | 640 | Q45 | 1357 | 1672 | 0 | 1765 | 0 | 0 | 669 | Z427 | 0 | 1 | 0 | 1 | 1 | 0 | 0 |
| U212 | 0 | 0 | 0 | 166 | 0 | 80 | 1066 | Q46 | 58 | 0 | 448 | 1991 | 0 | 1061 | 0 | Z428 | 1 | 1 | 0 | 0 | 0 | 0 | 1 |
| U213 | 0 | 488 | 0 | 1680 | 889 | 0 | 0 | Q47 | 0 | 3851 | 1740 | 2718 | 3295 | 1486 | 0 | Z431 | 1 | 1 | 0 | 1 | 0 | 1 | 0 |
| U214 | 636 | 0 | 636 | 0 | 748 | 0 | 972 | Q48 | 3099 | 1792 | 0 | 0 | 0 | 2953 | 2339 | Z432 | 0 | 0 | 0 | 0 | 0 | 1 | 0 |
| U215 | 0 | 854 | 0 | 411 | 780 | 0 | 0 | Y11 | 0 | 1 | 1 | 0 | 1 | 1 | 1 | Z433 | 0 | 0 | 0 | 1 | 0 | 1 | 1 |
| U216 | 0 | 809 | 0 | 363 | 0 | 0 | 0 | Y12 | 0 | 1 | 1 | 0 | 0 | 0 | 0 | Z434 | 0 | 0 | 0 | 1 | 0 | 0 | 0 |
| U217 | 0 | 603 | 0 | 0 | 0 | 0 | 0 | Y13 | 1 | 1 | 0 | 0 | 0 | 1 | 1 | Z435 | 0 | 0 | 0 | 0 | 0 | 1 | 0 |
| U218 | 0 | 0 | 0 | 0 | 0 | 0 | 0 | Y14 | 1 | 1 | 0 | 1 | 1 | 1 | 0 | Z436 | 0 | 1 | 1 | 1 | 1 | 0 | 0 |
| U221 | 0 | 0 | 0 | 427 | 1604 | 991 | 0 | Y15 | 0 | 0 | 1 | 1 | 1 | 0 | 1 | Z437 | 1 | 1 | 0 | 1 | 0 | 0 | 1 |
| U222 | 0 | 0 | 2227 | 887 | 0 | 0 | 0 | Y16 | 1 | 0 | 1 | 1 | 1 | 1 | 0 | Z438 | 1 | 0 | 0 | 1 | 1 | 0 | 1 |
| U223 | 0 | 465 | 0 | 619 | 808 | 1321 | 477 | Y17 | 0 | 0 | 0 | 1 | 0 | 0 | 0 | Z441 | 0 | 0 | 0 | 0 | 1 | 0 | 0 |
| U224 | 896 | 1810 | 909 | 288 | 0 | 0 | 0 | Y18 | 1 | 0 | 0 | 0 | 0 | 0 | 0 | Z442 | 0 | 0 | 1 | 1 | 0 | 0 | 0 |
| U225 | 0 | 1662 | 0 | 1473 | 1452 | 0 | 0 | Y21 | 1 | 0 | 1 | 0 | 0 | 1 | 1 | Z443 | 1 | 0 | 1 | 1 | 1 | 0 | 0 |
| U226 | 1535 | 0 | 0 | 1884 | 0 | 0 | 0 | Y22 | 1 | 1 | 0 | 0 | 0 | 1 | 0 | Z444 | 1 | 1 | 0 | 0 | 1 | 1 | 0 |
| U227 | 0 | 0 | 0 | 0 | 0 | 0 | 0 | Y23 | 1 | 1 | 1 | 0 | 0 | 0 | 0 | Z445 | 1 | 0 | 1 | 1 | 1 | 1 | 1 |
| U228 | 510 | 0 | 1280 | 843 | 558 | 1020 | 0 | Y24 | 0 | 0 | 1 | 0 | 0 | 1 | 0 | Z446 | 0 | 1 | 1 | 1 | 1 | 0 | 1 |
| U231 | 0 | 0 | 0 | 0 | 0 | 0 | 0 | Y25 | 0 | 1 | 1 | 0 | 0 | 1 | 0 | Z447 | 0 | 0 | 0 | 1 | 0 | 0 | 0 |
| U232 | 895 | 524 | 0 | 2162 | 0 | 0 | 1204 | Y26 | 0 | 0 | 1 | 0 | 0 | 0 | 1 | Z448 | 1 | 1 | 0 | 0 | 1 | 0 | 0 |
| U233 | 2160 | 0 | 0 | 1639 | 0 | 92 | 742 | Y27 | 0 | 0 | 0 | 0 | 1 | 1 | 1 | Z511 | 0 | 0 | 0 | 0 | 1 | 1 | 0 |
| U234 | 1153 | 254 | 0 | 0 | 0 | 110 | 2162 | Y28 | 1 | 1 | 0 | 1 | 1 | 0 | 1 | Z512 | 0 | 0 | 0 | 0 | 0 | 1 | 1 |
| U235 | 0 | 0 | 0 | 0 | 0 | 0 | 711 | Y31 | 0 | 0 | 1 | 1 | 0 | 0 | 1 | Z513 | 1 | 1 | 0 | 0 | 1 | 0 | 1 |
| U236 | 0 | 0 | 0 | 0 | 886 | 0 | 0 | Y32 | 0 | 1 | 1 | 0 | 0 | 1 | 1 | Z514 | 1 | 1 | 1 | 0 | 1 | 1 | 0 |
| U237 | 0 | 0 | 0 | 0 | 0 | 1726 | 0 | Y33 | 0 | 1 | 1 | 0 | 1 | 0 | 0 | Z515 | 1 | 0 | 1 | 1 | 0 | 1 | 0 |
| U238 | 0 | 0 | 0 | 0 | 0 | 0 | 0 | Y34 | 1 | 1 | 0 | 0 | 1 | 1 | 0 | Z516 | 0 | 0 | 1 | 0 | 0 | 1 | 0 |
| U241 | 0 | 3171 | 2165 | 1803 | 1294 | 2390 | 0 | Y35 | 1 | 1 | 0 | 1 | 0 | 1 | 1 | Z517 | 0 | 0 | 0 | 0 | 0 | 0 | 1 |
| U242 | 0 | 0 | 0 | 0 | 0 | 1672 | 2607 | Y36 | 1 | 1 | 0 | 1 | 0 | 0 | 0 | Z518 | 1 | 0 | 0 | 0 | 0 | 1 | 0 |
| U243 | 1264 | 1247 | 0 | 0 | 0 | 1489 | 0 | Y37 | 0 | 0 | 0 | 0 | 0 | 1 | 0 | Z521 | 0 | 0 | 1 | 0 | 0 | 0 | 0 |
| U244 | 1522 | 0 | 307 | 239 | 0 | 2192 | 0 | Y38 | 0 | 0 | 1 | 0 | 1 | 1 | 0 | Z522 | 0 | 0 | 1 | 1 | 1 | 1 | 0 |
| U245 | 2787 | 3624 | 3699 | 1706 | 0 | 0 | 0 | Y41 | 0 | 1 | 0 | 1 | 0 | 0 | 1 | Z523 | 0 | 1 | 1 | 1 | 0 | 0 | 0 |
| U246 | 0 | 0 | 0 | 0 | 0 | 2657 | 932 | Y42 | 1 | 1 | 1 | 0 | 1 | 0 | 0 | Z524 | 0 | 0 | 0 | 0 | 1 | 1 | 0 |
| U247 | 0 | 762 | 3989 | 2251 | 0 | 0 | 2680 | Y43 | 0 | 0 | 0 | 1 | 0 | 1 | 1 | Z525 | 1 | 0 | 0 | 0 | 0 | 0 | 1 |
| U248 | 0 | 0 | 0 | 0 | 0 | 2468 | 0 | Y44 | 0 | 1 | 0 | 1 | 0 | 0 | 1 | Z526 | 0 | 1 | 0 | 1 | 0 | 0 | 1 |
| U311 | 1202 | 0 | 0 | 839 | 0 | 0 | 0 | Y45 | 1 | 1 | 0 | 1 | 0 | 0 | 1 | Z527 | 1 | 0 | 1 | 0 | 0 | 1 | 0 |
| U312 | 0 | 0 | 0 | 1153 | 0 | 0 | 0 | Y46 | 1 | 0 | 1 | 1 | 0 | 1 | 0 | Z528 | 0 | 0 | 1 | 1 | 0 | 1 | 0 |
| U313 | 0 | 0 | 1119 | 0 | 0 | 1654 | 0 | Y47 | 0 | 1 | 1 | 1 | 1 | 1 | 0 | Z531 | 1 | 1 | 1 | 0 | 1 | 1 | 1 |
| U314 | 0 | 0 | 0 | 836 | 0 | 0 | 0 | Y48 | 1 | 1 | 0 | 0 | 0 | 1 | 1 | Z532 | 0 | 1 | 1 | 0 | 1 | 0 | 0 |
| U315 | 1243 | 0 | 682 | 0 | 0 | 967 | 495 | D1 | 1 | 2 | 3 | 0 | 0 | 0 | 3 | Z533 | 0 | 0 | 0 | 0 | 1 | 1 | 0 |
| U316 | 732 | 0 | 0 | 0 | 0 | 0 | 850 | D2 | 2 | 3 | 2 | 1 | 0 | 3 | 3 | Z534 | 0 | 0 | 0 | 1 | 1 | 1 | 0 |
| U317 | 0 | 0 | 0 | 115 | 0 | 0 | 0 | D3 | 2 | 0 | 3 | 2 | 4 | 0 | 3 | Z535 | 1 | 1 | 0 | 0 | 1 | 1 | 0 |
| U318 | 0 | 955 | 0 | 0 | 960 | 0 | 0 | D4 | 3 | 4 | 1 | 2 | 2 | 5 | 0 | Z536 | 1 | 0 | 1 | 0 | 1 | 1 | 0 |
| U321 | 0 | 2660 | 0 | 0 | 1154 | 0 | 693 | D5 | 0 | 2 | 1 | 3 | 4 | 0 | 2 | Z537 | 0 | 1 | 1 | 0 | 0 | 0 | 1 |
| U322 | 0 | 0 | 0 | 0 | 1905 | 0 | 1598 | D6 | 0 | 0 | 0 | 0 | 0 | 0 | 0 | Z538 | 1 | 0 | 0 | 0 | 0 | 0 | 1 |
| U323 | 0 | 0 | 0 | 0 | 1772 | 0 | 2103 | D7 | 0 | 0 | 0 | 0 | 0 | 0 | 0 | Z541 | 1 | 1 | 0 | 1 | 0 | 1 | 1 |
| U324 | 0 | 0 | 0 | 244 | 0 | 358 | 0 | D8 | 0 | 0 | 0 | 0 | 0 | 0 | 0 | Z542 | 1 | 0 | 1 | 1 | 0 | 1 | 0 |
| U325 | 1142 | 0 | 0 | 0 | 0 | 2371 | 2497 | D9 | 0 | 0 | 0 | 0 | 0 | 0 | 0 | Z543 | 0 | 1 | 1 | 0 | 1 | 0 | 0 |
| U326 | 0 | 0 | 0 | 0 | 1301 | 2909 | 0 | D10 | 0 | 0 | 0 | 0 | 0 | 1 | 0 | Z544 | 0 | 0 | 0 | 0 | 1 | 1 | 0 |
| U327 | 0 | 0 | 1133 | 0 | 0 | 0 | 0 | Z111 | 0 | 1 | 0 | 0 | 0 | 1 | 0 | Z545 | 0 | 0 | 1 | 0 | 1 | 0 | 1 |
| U328 | 0 | 0 | 0 | 0 | 0 | 0 | 300 | Z112 | 1 | 0 | 0 | 0 | 1 | 1 | 0 | Z546 | 1 | 1 | 0 | 0 | 0 | 1 | 1 |
| U331 | 0 | 677 | 0 | 0 | 591 | 1788 | 0 | Z113 | 0 | 0 | 0 | 0 | 0 | 0 | 0 | Z547 | 1 | 0 | 0 | 0 | 1 | 0 | 1 |
| U332 | 1270 | 0 | 445 | 0 | 0 | 0 | 0 | Z114 | 0 | 0 | 1 | 0 | 0 | 1 | 1 | Z548 | 0 | 0 | 1 | 1 | 1 | 0 | 1 |
| U333 | 0 | 1629 | 0 | 0 | 1129 | 1572 | 0 | Z115 | 0 | 1 | 0 | 0 | 0 | 0 | 1 | I11 | 0 | 0 | 0 | 0 | 0 | 0 | 0 |
| U334 | 0 | 0 | 2170 | 0 | 0 | 0 | 0 | Z116 | 0 | 1 | 0 | 1 | 0 | 0 | 1 | I12 | 0 | 0 | 0 | 0 | 0 | 0 | 0 |
| U335 | 0 | 0 | 251 | 557 | 1011 | 0 | 0 | Z117 | 1 | 1 | 1 | 0 | 1 | 1 | 0 | I13 | 0 | 0 | 0 | 0 | 0 | 0 | 0 |
| U336 | 0 | 253 | 0 | 0 | 0 | 0 | 1603 | Z118 | 0 | 0 | 1 | 1 | 0 | 1 | 1 | I14 | 0 | 0 | 0 | 0 | 0 | 0 | 0 |
| U337 | 562 | 385 | 0 | 130 | 2161 | 0 | 0 | Z121 | 0 | 1 | 0 | 1 | 0 | 0 | 0 | I15 | 0 | 0 | 0 | 0 | 0 | 0 | 0 |
| U338 | 0 | 2160 | 0 | 0 | 0 | 0 | 0 | Z122 | 1 | 0 | 1 | 0 | 0 | 0 | 1 | I16 | 0 | 0 | 0 | 0 | 0 | 0 | 0 |
| U341 | 3429 | 0 | 3664 | 1093 | 421 | 1197 | 0 | Z123 | 1 | 0 | 0 | 1 | 0 | 0 | 0 | I17 | 0 | 0 | 0 | 0 | 0 | 0 | 0 |
| U342 | 2075 | 1043 | 0 | 1191 | 0 | 0 | 0 | Z124 | 0 | 0 | 0 | 1 | 0 | 0 | 1 | I18 | 0 | 0 | 0 | 0 | 0 | 0 | 0 |
| U343 | 0 | 1915 | 1148 | 0 | 0 | 3650 | 730 | Z125 | 0 | 0 | 0 | 1 | 1 | 0 | 0 | I21 | 0 | 0 | 0 | 0 | 0 | 0 | 0 |
| U344 | 0 | 1924 | 3859 | 2939 | 2241 | 0 | 2241 | Z126 | 1 | 0 | 1 | 0 | 0 | 0 | 0 | I22 | 0 | 0 | 0 | 0 | 0 | 0 | 0 |
| U345 | 0 | 0 | 0 | 2008 | 0 | 0 | 0 | Z127 | 1 | 1 | 0 | 0 | 0 | 0 | 1 | I23 | 0 | 0 | 0 | 0 | 0 | 0 | 0 |
| U346 | 1918 | 0 | 3165 | 2841 | 0 | 0 | 0 | Z128 | 0 | 0 | 1 | 1 | 0 | 0 | 0 | I24 | 0 | 0 | 0 | 0 | 0 | 0 | 0 |
| U347 | 0 | 0 | 0 | 320 | 0 | 0 | 0 | Z131 | 0 | 0 | 0 | 0 | 1 | 0 | 0 | I25 | 0 | 0 | 0 | 0 | 0 | 0 | 0 |
| U348 | 1396 | 1122 | 2335 | 1628 | 1099 | 0 | 0 | Z132 | 0 | 1 | 1 | 0 | 1 | 0 | 0 | I26 | 0 | 0 | 0 | 0 | 0 | 0 | 0 |
| U411 | 0 | 0 | 738 | 361 | 0 | 0 | 0 | Z133 | 0 | 0 | 0 | 0 | 0 | 0 | 0 | I27 | 0 | 0 | 0 | 0 | 0 | 0 | 0 |
| U412 | 413 | 0 | 261 | 0 | 0 | 0 | 124 | Z134 | 0 | 1 | 0 | 0 | 1 | 1 | 0 | I28 | 0 | 0 | 0 | 0 | 0 | 0 | 0 |
| U413 | 0 | 444 | 561 | 0 | 212 | 0 | 212 | Z135 | 1 | 1 | 1 | 1 | 0 | 0 | 0 | I31 | 0 | 0 | 0 | 0 | 0 | 0 | 0 |
| U414 | 0 | 0 | 0 | 0 | 0 | 0 | 437 | Z136 | 0 | 0 | 1 | 0 | 0 | 1 | 1 | I32 | 0 | 0 | 0 | 0 | 0 | 0 | 0 |
| U415 | 0 | 0 | 245 | 467 | 598 | 0 | 0 | Z137 | 1 | 0 | 0 | 1 | 0 | 0 | 0 | I33 | 0 | 0 | 0 | 0 | 0 | 0 | 0 |
| U416 | 0 | 9 | 0 | 0 | 0 | 215 | 0 | Z138 | 0 | 0 | 1 | 1 | 1 | 1 | 0 | I34 | 0 | 0 | 0 | 0 | 0 | 0 | 0 |
| U417 | 309 | 0 | 0 | 0 | 0 | 226 | 409 | Z141 | 0 | 0 | 0 | 0 | 1 | 1 | 1 | I35 | 0 | 0 | 0 | 0 | 0 | 0 | 0 |
| U418 | 182 | 0 | 0 | 0 | 0 | 0 | 0 | Z142 | 0 | 1 | 0 | 0 | 1 | 0 | 1 | I36 | 0 | 0 | 0 | 0 | 0 | 0 | 0 |
| U421 | 1537 | 0 | 0 | 0 | 0 | 0 | 0 | Z143 | 1 | 1 | 1 | 1 | 1 | 0 | 1 | I37 | 0 | 0 | 0 | 0 | 0 | 0 | 0 |
| U422 | 631 | 0 | 0 | 0 | 0 | 0 | 0 | Z144 | 1 | 1 | 1 | 0 | 1 | 1 | 0 | I38 | 0 | 0 | 0 | 0 | 0 | 0 | 0 |
| U423 | 0 | 0 | 0 | 636 | 0 | 1262 | 0 | Z145 | 0 | 1 | 0 | 0 | 1 | 1 | 1 | I41 | 0 | 0 | 0 | 0 | 0 | 0 | 0 |
| U424 | 1624 | 710 | 0 | 0 | 0 | 0 | 306 | Z146 | 0 | 0 | 0 | 0 | 1 | 1 | 0 | I42 | 0 | 0 | 0 | 0 | 0 | 0 | 0 |
| U425 | 989 | 650 | 0 | 0 | 0 | 0 | 0 | Z147 | 1 | 1 | 0 | 0 | 0 | 1 | 1 | I43 | 0 | 0 | 0 | 0 | 0 | 0 | 0 |
| U426 | 0 | 0 | 0 | 0 | 1578 | 0 | 0 | Z148 | 0 | 0 | 0 | 0 | 1 | 0 | 0 | I44 | 0 | 0 | 0 | 0 | 0 | 0 | 0 |
| U427 | 0 | 1104 | 0 | 2335 | 713 | 0 | 0 | Z211 | 0 | 1 | 0 | 0 | 0 | 0 | 1 | I45 | 0 | 0 | 0 | 0 | 0 | 0 | 0 |
| U428 | 849 | 872 | 0 | 0 | 0 | 0 | 816 | Z212 | 0 | 0 | 0 | 1 | 0 | 1 | 1 | I46 | 0 | 0 | 0 | 0 | 0 | 0 | 0 |
| U431 | 1350 | 865 | 0 | 1738 | 0 | 241 | 0 | Z213 | 0 | 1 | 0 | 1 | 1 | 0 | 0 | I47 | 0 | 0 | 0 | 0 | 0 | 0 | 0 |
| U432 | 0 | 0 | 0 | 0 | 0 | 1197 | 0 | Z214 | 1 | 0 | 1 | 0 | 1 | 0 | 1 | I48 | 0 | 0 | 0 | 0 | 0 | 0 | 0 |
| U433 | 0 | 0 | 0 | 520 | 0 | 188 | 1415 | Z215 | 0 | 1 | 0 | 1 | 1 | 0 | 0 | G11 | 0 | 1 | 1 | 1 | 1 | 0 | 1 |
| U434 | 0 | 0 | 0 | 1625 | 0 | 0 | 0 | Z216 | 0 | 1 | 0 | 1 | 0 | 0 | 0 | G12 | 1 | 1 | 1 | 0 | 1 | 1 | 1 |
| U435 | 0 | 0 | 0 | 0 | 0 | 1621 | 0 | Z217 | 0 | 1 | 0 | 0 | 0 | 0 | 0 | G13 | 1 | 0 | 1 | 1 | 1 | 1 | 0 |
| U436 | 0 | 1446 | 1314 | 1030 | 680 | 0 | 0 | Z218 | 0 | 0 | 0 | 0 | 0 | 0 | 0 | G14 | 0 | 0 | 0 | 1 | 1 | 0 | 0 |
| U437 | 1227 | 509 | 0 | 248 | 0 | 0 | 762 | Z221 | 0 | 0 | 0 | 1 | 1 | 1 | 0 | G15 | 1 | 1 | 0 | 0 | 0 | 1 | 1 |
| U438 | 1014 | 0 | 0 | 140 | 761 | 0 | 455 | Z222 | 0 | 0 | 1 | 1 | 0 | 0 | 0 | G16 | 0 | 0 | 0 | 1 | 1 | 1 | 0 |
| U441 | 0 | 0 | 0 | 0 | 2054 | 0 | 0 | Z223 | 0 | 1 | 0 | 1 | 1 | 1 | 1 | G17 | 1 | 0 | 0 | 1 | 0 | 1 | 0 |
| U442 | 0 | 0 | 1514 | 620 | 0 | 0 | 0 | Z224 | 1 | 1 | 1 | 1 | 0 | 0 | 0 | G18 | 1 | 1 | 0 | 1 | 1 | 1 | 0 |
| U443 | 1080 | 0 | 1744 | 685 | 1645 | 0 | 0 | Z225 | 0 | 1 | 0 | 1 | 1 | 0 | 0 | G21 | 0 | 1 | 1 | 1 | 0 | 1 | 0 |
| U444 | 770 | 135 | 0 | 0 | 1282 | 1456 | 0 | Z226 | 1 | 0 | 0 | 1 | 0 | 0 | 0 | G22 | 1 | 0 | 0 | 1 | 1 | 0 | 1 |
| U445 | 2097 | 0 | 1673 | 763 | 1964 | 2610 | 757 | Z227 | 0 | 0 | 0 | 0 | 0 | 0 | 0 | G23 | 1 | 0 | 0 | 1 | 1 | 0 | 1 |
| U446 | 0 | 1952 | 2389 | 1168 | 1633 | 0 | 1224 | Z228 | 1 | 0 | 1 | 1 | 1 | 1 | 0 | G24 | 0 | 0 | 1 | 0 | 0 | 1 | 0 |
| U447 | 0 | 0 | 0 | 351 | 0 | 0 | 0 | Z231 | 0 | 0 | 0 | 0 | 0 | 0 | 0 | G25 | 1 | 0 | 0 | 1 | 1 | 0 | 0 |
| U448 | 914 | 2476 | 0 | 0 | 2467 | 0 | 0 | Z232 | 1 | 1 | 0 | 1 | 0 | 0 | 1 | G26 | 1 | 0 | 1 | 0 | 1 | 1 | 0 |
| U511 | 0 | 0 | 0 | 0 | 436 | 528 | 0 | Z233 | 1 | 0 | 0 | 1 | 0 | 1 | 1 | G27 | 0 | 1 | 0 | 0 | 1 | 0 | 1 |
| U512 | 0 | 0 | 0 | 0 | 0 | 1070 | 131 | Z234 | 1 | 1 | 0 | 0 | 0 | 1 | 1 | G28 | 0 | 1 | 1 | 1 | 1 | 0 | 0 |
| U513 | 460 | 271 | 0 | 0 | 579 | 0 | 549 | Z235 | 0 | 0 | 0 | 0 | 0 | 0 | 1 | G31 | 1 | 1 | 0 | 1 | 0 | 1 | 0 |
| U514 | 1064 | 1481 | 1067 | 0 | 1194 | 877 | 0 | Z236 | 0 | 0 | 0 | 0 | 1 | 0 | 0 | G32 | 0 | 0 | 0 | 1 | 0 | 0 | 1 |
| U515 | 798 | 0 | 825 | 356 | 0 | 1073 | 0 | Z237 | 0 | 0 | 0 | 0 | 0 | 1 | 0 | G33 | 0 | 1 | 1 | 1 | 1 | 1 | 1 |
| U516 | 0 | 0 | 924 | 0 | 0 | 967 | 0 | Z238 | 0 | 0 | 0 | 0 | 0 | 0 | 0 | G34 | 1 | 1 | 0 | 1 | 0 | 0 | 1 |
| U517 | 0 | 0 | 0 | 0 | 0 | 0 | 671 | Z241 | 0 | 1 | 1 | 1 | 1 | 1 | 0 | G35 | 0 | 0 | 0 | 0 | 0 | 1 | 0 |
| U518 | 435 | 0 | 0 | 0 | 0 | 393 | 0 | Z242 | 0 | 0 | 0 | 0 | 0 | 1 | 1 | G36 | 1 | 1 | 0 | 0 | 0 | 1 | 0 |
| U521 | 0 | 0 | 2431 | 0 | 0 | 0 | 0 | Z243 | 1 | 1 | 0 | 0 | 0 | 1 | 0 | G37 | 1 | 1 | 1 | 0 | 1 | 1 | 0 |
| U522 | 0 | 0 | 272 | 1753 | 743 | 1458 | 0 | Z244 | 1 | 0 | 1 | 1 | 0 | 1 | 0 | G38 | 0 | 1 | 1 | 0 | 0 | 1 | 0 |
| U523 | 0 | 1279 | 1052 | 1252 | 0 | 0 | 0 | Z245 | 1 | 1 | 1 | 1 | 0 | 0 | 0 | G41 | 1 | 1 | 1 | 0 | 0 | 0 | 1 |
| U524 | 0 | 0 | 0 | 0 | 2520 | 1408 | 0 | Z246 | 0 | 0 | 0 | 0 | 0 | 1 | 1 | G42 | 0 | 0 | 1 | 1 | 0 | 1 | 0 |
| U525 | 631 | 0 | 0 | 0 | 0 | 0 | 267 | Z247 | 0 | 1 | 1 | 1 | 0 | 0 | 1 | G43 | 0 | 0 | 1 | 1 | 1 | 0 | 0 |
| U526 | 0 | 2879 | 0 | 1000 | 0 | 0 | 1556 | Z248 | 0 | 0 | 0 | 0 | 0 | 1 | 0 | G44 | 0 | 0 | 1 | 0 | 0 | 0 | 1 |
| U527 | 1912 | 0 | 1504 | 0 | 0 | 2389 | 0 | Z311 | 1 | 0 | 0 | 1 | 0 | 0 | 0 | G45 | 1 | 0 | 0 | 1 | 0 | 0 | 1 |
| U528 | 0 | 0 | 169 | 156 | 0 | 1386 | 0 | Z312 | 0 | 0 | 0 | 1 | 0 | 0 | 0 | G46 | 0 | 1 | 1 | 1 | 1 | 0 | 1 |
| U531 | 808 | 619 | 975 | 0 | 1098 | 135 | 1392 | Z313 | 0 | 0 | 1 | 0 | 0 | 1 | 0 | G47 | 0 | 0 | 0 | 0 | 1 | 0 | 1 |
| U532 | 0 | 250 | 1765 | 0 | 1210 | 0 | 0 | Z314 | 0 | 0 | 0 | 1 | 0 | 0 | 0 | G48 | 1 | 0 | 0 | 0 | 1 | 0 | 1 |
| U533 | 0 | 0 | 0 | 0 | 715 | 307 | 0 | Z315 | 1 | 0 | 1 | 0 | 0 | 1 | 1 | G51 | 1 | 0 | 1 | 1 | 1 | 1 | 1 |
| U534 | 0 | 0 | 0 | 533 | 283 | 385 | 0 | Z316 | 1 | 0 | 0 | 0 | 0 | 0 | 1 | G52 | 1 | 0 | 0 | 0 | 0 | 0 | 0 |
| U535 | 329 | 547 | 0 | 0 | 1151 | 153 | 0 | Z317 | 0 | 0 | 0 | 1 | 0 | 0 | 0 | G53 | 0 | 0 | 0 | 0 | 0 | 1 | 0 |
| U536 | 91 | 0 | 402 | 0 | 593 | 1347 | 0 | Z318 | 0 | 1 | 0 | 0 | 1 | 0 | 0 | G54 | 1 | 0 | 1 | 1 | 1 | 1 | 0 |
| U537 | 0 | 1270 | 1550 | 0 | 0 | 0 | 1397 | Z321 | 0 | 1 | 0 | 0 | 1 | 0 | 1 | G55 | 1 | 1 | 1 | 0 | 0 | 1 | 1 |
| U538 | 1151 | 0 | 0 | 0 | 0 | 0 | 1705 | Z322 | 0 | 0 | 0 | 0 | 1 | 0 | 1 | G56 | 1 | 1 | 0 | 0 | 0 | 1 | 1 |
| U541 | 2332 | 811 | 0 | 318 | 0 | 373 | 1499 | Z323 | 0 | 0 | 0 | 0 | 1 | 0 | 1 | G57 | 0 | 1 | 1 | 1 | 0 | 1 | 1 |
| U542 | 462 | 0 | 1152 | 4189 | 0 | 4333 | 0 | Z324 | 0 | 0 | 0 | 1 | 0 | 1 | 0 | G58 | 1 | 1 | 1 | 0 | 0 | 1 | 0 |
| U543 | 0 | 1116 | 251 | 0 | 2200 | 0 | 0 | Z325 | 1 | 0 | 0 | 0 | 0 | 1 | 1 | ||||||||
| U544 | 0 | 0 | 0 | 0 | 1428 | 2568 | 0 | Z326 | 0 | 0 | 0 | 0 | 1 | 1 | 0 |
References
- Chu, P.Y.; Chang, K.H.; Huang, H.F. How to increase supplier flexibility through social mechanisms and influence strategies? J. Bus. Ind. Mark. 2012, 27, 115–131. [Google Scholar] [CrossRef] [Green Version]
- Deng, W.; Feng, L.; Zhao, X.; Lou, Y. Effects of supply chain competition on firms’ product sustainability strategy. J. Clean. Prod. 2020, 275, 124061. [Google Scholar] [CrossRef]
- Ramanathan, U.; Ramanathan, R. Supply Chain Strategies, Issues and Models; Springer: Cham, Switzerland, 2014. [Google Scholar]
- Mosallanezhad, B.; Hajiaghaei-Keshteli, M.; Triki, C. Shrimp closed-loop supply chain network design. Soft Comput. 2021, 25, 7399–7422. [Google Scholar] [CrossRef]
- Borda, A.; Morales, O.; Teegen, H.; Rees, G.; Gonzalez-Perez, M.A. Addressing Sustainable Rural Development with Shared Value: A Peruvian Model from the Cacao Industry. Sustainability 2021, 13, 8028. [Google Scholar] [CrossRef]
- Kim, S.-S.; Baek, W.-Y.; Byon, K.K.; Ju, S.-B. Creating Shared Value to Enhance Customer Loyalty: A Case of a Sporting Goods Company in Korean Athletic Shoe Market. Sustainability 2021, 13, 7031. [Google Scholar] [CrossRef]
- Salehi-Amiri, A.; Zahedi, A.; Hajiaghaei-Keshteli, M.; Akbapour, N. Designing a sustainable closed-loop supply chain network for walnut industry. Renew. Sustain. Energy Rev. 2021, 141, 110821. [Google Scholar] [CrossRef]
- Tliche, Y.; Taghipour, A.; Canel-Depitre, B. An improved forecasting approach to reduce inventory levels in decentralized supply chains. Eur. J. Oper. Res. 2020, 287, 511–527. [Google Scholar] [CrossRef]
- Tsai, Y.L.; Yang, Y.J.; Lin, C.-H. A dynamic decision approach for supplier selection using ant colony system. Expert Syst. Appl. 2010, 37, 8313–8321. [Google Scholar] [CrossRef]
- Rezaei, J.; Ortt, R. A multi-variable approach to supplier segmentation. Int. J. Prod. Res. 2012, 50, 4593–4611. [Google Scholar] [CrossRef] [Green Version]
- Rezaei, J.; Wang, J.; Tavasszy, L. Linking supplier development to supplier segmentation using Best Worst Method. Expert Syst. Appl. 2015, 42, 9152–9164. [Google Scholar] [CrossRef]
- Senyigit, E. The optimization of lot sizing with supplier selection problem in multi-echelon defective supply chain network. Math. Comput. Model. Dyn. Syst. 2012, 18, 273–286. [Google Scholar] [CrossRef]
- Klasa, K.; Greer, S.L.; van Ginneken, E. Strategic Purchasing in Practice: Comparing Ten European Countries. Health Policy 2018, 122, 457–472. [Google Scholar] [CrossRef] [PubMed]
- Park, J.; Shin, K.; Chang, T.W.; Park, J. An integrative framework for supplier relationship management. Ind. Manag. Data Syst. 2010, 110, 495–515. [Google Scholar] [CrossRef]
- Heiskanen, A.; Newman, M.; Eklin, M. Control, trust, power, and the dynamics of information system outsourcing relationships: A process study of contractual software development. J. Strat. Inf. Syst. 2008, 17, 268–286. [Google Scholar] [CrossRef]
- Gold, S.; Awasthi, A. Sustainable global supplier selection extended towards sustainability risks from (1 + n)th tier suppliers using fuzzy AHP based approach. IFAC-PapersOnLine 2015, 48, 966–971. [Google Scholar] [CrossRef]
- Lopes, A.P.; Rodriguez-Lopez, N. A Decision Support Tool for Supplier Evaluation and Selection. Sustainability 2021, 13, 12387. [Google Scholar] [CrossRef]
- Kakabadse, A. Smart Sourcing: International Best Practice; Springer: Cham, Switzerland, 2001. [Google Scholar]
- Khazaei, M.; Ramezani, M.; Padash, A.; DeTombe, D. Creating shared value to redesigning IT-service products using SYRCS; Diagnosing and tackling complex problems. Inf. Syst. e-Bus. Manag. 2021, 19, 957–992. [Google Scholar] [CrossRef]
- Vosooghidizaji, M.; Taghipour, A.; Canel-Depitre, B. Supply chain coordination under information asymmetry: A review. Int. J. Prod. Res. 2020, 58, 1805–1834. [Google Scholar] [CrossRef]
- Yawar, S.A.; Seuring, S. Reviewing and conceptualizing supplier development. Benchmarking Int. J. 2020, 27, 2565–2598. [Google Scholar] [CrossRef]
- Khazaei, M.; Ramezani, M.; Padash, A.; DeTombe, D. The quantification role of BWM in problem structuring methods: SYRCS methodology. In Proceedings of the International Workshop on Best-Worst Method, Delft, The Netherlands, 10–11 June 2021; Springer: Cham, Switzerland, 2021; pp. 252–271. [Google Scholar]
- Porter, M.E.; Hills, G.; Pfitzer, M.; Patscheke, S.; Hawkins, E. Measuring Shared Value: How to Unlock Value by Linking Social and Business Results; Foundation Strategy Group: Boston, MA, USA, 2011. [Google Scholar]
- Lichtenthaler, U. Shared Value Innovation: Linking Competitiveness and Societal Goals in the Context of Digital Transformation. Int. J. Innov. Technol. Manag. 2017, 14, 1750018. [Google Scholar] [CrossRef]
- Von Liel, B. Creating Shared Value as Future Factor of Competition: Analysis and Empirical Evidence; Springer: Cham, Switzerland, 2016. [Google Scholar]
- Font, X.; Guix, M.; Bonilla-Priego, M.J. Corporate social responsibility in cruising: Using materiality analysis to create shared value. Tour. Manag. 2016, 53, 175–186. [Google Scholar] [CrossRef]
- Wieland, J. Creating Shared Value—Concepts, Experience, Criticism; Springer: Cham, Switzerland, 2017. [Google Scholar]
- Porter, M.E.; Kramer, M.R. The link between competitive advantage and corporate social responsibility. Harv. Bus. Rev. 2006, 84, 78–92. [Google Scholar] [PubMed]
- Porter, M.E.; Kramer, M.R. Creating shared value. In Managing Sustainable Business; Springer: Cham, Switzerland, 2019; pp. 323–346. [Google Scholar]
- Taghipour, A.; Hoang, P.; Cao, X. Just in Time/Lean Purchasing Approach: An Investigation for Research and Applications. J. Adv. Manag. Sci. 2020, 8, 43–48. [Google Scholar] [CrossRef]
- Goodarzian, F.; Wamba, S.F.; Mathiyazhagan, K.; Taghipour, A. A new bi-objective green medicine supply chain network design under fuzzy environment: Hybrid metaheuristic algorithms. Comput. Ind. Eng. 2021, 160, 107535. [Google Scholar] [CrossRef]
- Litow, S.S. The Challenge for Business and Society; John Wiley & Sons, Inc.: Hoboken, NJ, USA, 2018. [Google Scholar]
- Beschorner, T. Creating Shared Value: The One-Trick Pony Approach. Bus. Ethics J. Rev. 2014, 1, 106–112. [Google Scholar] [CrossRef]
- Alberti, F.G.; Belfanti, F. Creating shared value and clusters. Compet. Rev. Int. Bus. J. 2019, 29, 39–60. [Google Scholar] [CrossRef]
- Mendy, J. Supporting the creation of shared value. Strat. Chang. 2019, 28, 157–161. [Google Scholar] [CrossRef]
- Lenssen, G.G.; Smith, N.C. Managing Sustainable Business; Springer: Cham, Switzerland, 2019. [Google Scholar]
- Blakely, E.J.; Leigh, N.G. Planning Local Economic Development; SAGE: New York, NY, USA, 2013. [Google Scholar]
- Jose, P. Business and society: Creating shared value: In conversation with NR Narayana Murthy, Founder, Infosys. IIMB Manag. Rev. 2016, 28, 43–51. [Google Scholar]
- Lee, D.J.; Moon, J.; Cho, J.; Kang, H.-G.; Jeong, J. From corporate social responsibility to creating shared value with suppliers through mutual firm foundation in the Korean bakery industry: A case study of the SPC Group. Asia Pac. Bus. Rev. 2014, 20, 461–483. [Google Scholar] [CrossRef]
- Duan, Z.; Guo, P.; Li, W.; Yu, M.; Zhang, H.; Zou, J.; Zorn, M. Road to Transparency: Relationship to Risks and How It Is Perceived and Handled by Chinese Extractive Companies Involved in Overseas Investment. J. Int. Bus. Ethics 2015, 8, 44–65. [Google Scholar]
- Andelin, M.; Karhu, J.; Junnila, S. Creating shared value in a construction project—A case study. Procedia Econ. Financ. 2015, 21, 446–453. [Google Scholar] [CrossRef]
- Moon, H.-C.; Parc, J.; Yim, S.H.; Park, N. An extension of Porter and Kramer’s creating shared value (CSV): Reorienting strategies and seeking international cooperation. J. Int. Area Stud. 2011, 18, 49–64. [Google Scholar]
- Laudal, T. Measuring shared value in multinational corporations. Soc. Responsib. J. 2018, 14, 917–933. [Google Scholar] [CrossRef]
- Dehghan Nayeri, M.; Khazaei, M.; Alinasab-Imani, F. The Critical Heuristics of Iranian Banking Credit System: Analysis of the Antithetical Opinions of the Beneficiaries. Syst. Pract. 2020, 33, 363–392. [Google Scholar] [CrossRef]
- Ramezani, M.; Azar, A.; Khazaei, M. Gap analysis through a hybrid method: Critical systems heuristics and best worst method. In Proceedings of the International Workshop on Best-Worst Method, Delft, The Netherlands, 10–11 June 2021; Springer: Cham, Switzerland, 2021; pp. 272–286. [Google Scholar]
- Sinclair, S.; Rockwell, G. Teaching computer-assisted text analysis: Approaches to learning new methodologies. In Digital Humanities Pedagogy: Practices, Principles, and Politics; Open Book Publishers: Cambridge, UK, 2012; pp. 241–263. [Google Scholar]
- Welsh, M.E. Review of Voyant tools. Collab. Librariansh. 2014, 6, 96–98. [Google Scholar]
- Zhang, M.; Pawar, K.S.; Bhardwaj, S. Improving supply chain social responsibility through supplier development. Prod. Plan. Control 2017, 28, 500–511. [Google Scholar] [CrossRef]
- Xu, L.; Shi, X.; Xie, Y.; Tsai, S.-B. Corporate social responsibility-based supplier selection process in sustainable supply chains. In Green Production Strategies for Sustainability; IGI Global: Hershey, PA, USA, 2018; pp. 54–71. [Google Scholar]
- Chen, Y.; Wang, S.; Yao, J.; Li, Y.; Yang, S. Socially responsible supplier selection and sustainable supply chain development: A combined approach of total interpretive structural modeling and fuzzy analytic network process. Bus. Strat. Environ. 2018, 27, 1708–1719. [Google Scholar] [CrossRef]
- Yadlapalli, A.; Rahman, S.; Gunasekaran, A. Socially responsible governance mechanisms for manufacturing firms in apparel supply chains. Int. J. Prod. Econ. 2018, 196, 135–149. [Google Scholar] [CrossRef]
- Govindan, K.; Shankar, M.; Kannan, D. Supplier selection based on corporate social responsibility practices. Int. J. Prod. Econ. 2018, 200, 353–379. [Google Scholar] [CrossRef]
- Mani, V.; Gunasekaran, A.; Delgado, C. Enhancing supply chain performance through supplier social sustainability: An emerging economy perspective. Int. J. Prod. Econ. 2018, 195, 259–272. [Google Scholar] [CrossRef]
- Girdwichai, L.; Sriviboon, C. Is Supplier Social Sustainability Vital for Supplier’s Financial and Social Performance? Analyzing Mediating Role of Firm Reputation in Thailand. Int. J. Supply Chain Manag. 2019, 8, 369–379. [Google Scholar]
- Yaghin, R.G.; Sarlak, P. Joint order allocation and transportation planning under uncertainty within a socially responsible supply chain. J. Model. Manag. 2019, 15, 531–565. [Google Scholar] [CrossRef]
- Fontana, E.; Egels-Zandén, N. Non Sibi, Sed Omnibus: Influence of Supplier Collective Behaviour on Corporate Social Responsibility in the Bangladeshi Apparel Supply Chain. J. Bus. Ethics 2019, 159, 1047–1064. [Google Scholar] [CrossRef] [Green Version]
- Fontoura, P.; Coelho, A. The impact of Supply Chain Leadership and Followership on CSR: An empirical study about a Portuguese energy supplier. E + M Èkon. Manag. 2020, 23, 75–92. [Google Scholar] [CrossRef]
- Wen, D.; Sun, X.; Liu, Y. Bibliometric Analysis of Supplier Management: The Theme and Cluster Perspectives. Sustainability 2020, 12, 2572. [Google Scholar] [CrossRef] [Green Version]
- Hoque, I.; Rana, M.B. Buyer–supplier relationships from the perspective of working environment and organisational performance: Review and research agenda. Manag. Rev. Q. 2019, 70, 1–50. [Google Scholar] [CrossRef]
- Yang, T.-K.; Yan, M.-R. The Corporate Shared Value for Sustainable Development: An Ecosystem Perspective. Sustainability 2020, 12, 2348. [Google Scholar] [CrossRef] [Green Version]
- Chihambakwe, Z.J.; Grobbelaar, S.S.S.; Matope, S. Creating Shared Value in BoP Communities with Micro-Manufacturing Factories: A Systematized Literature Review. Sustainability 2021, 13, 10289. [Google Scholar] [CrossRef]
- Xu, L.; Kumar, D.T.; Shankar, K.M.; Kannan, D.; Chen, G. Analyzing criteria and sub-criteria for the corporate social responsibility-based supplier selection process using AHP. Int. J. Adv. Manuf. Technol. 2013, 68, 907–916. [Google Scholar] [CrossRef]
- Lindgreen, A.; Révész, B.; Glynn, M.; Svahn, S.; Westerlund, M. Purchasing strategies in supply relationships. J. Bus. Ind. Mark. 2009, 24, 173–181. [Google Scholar] [CrossRef]
- Hatipoglu, B.; Ertuna, B.; Salman, D. Corporate social responsibility in tourism as a tool for sustainable development. Int. J. Contemp. Hosp. Manag. 2019, 31, 2358–2375. [Google Scholar] [CrossRef]
- Haski-Leventhal, D. Strategic Corporate Social Responsibility: Tools and Theories for Responsible Management; SAGE: New York, NY, USA, 2018. [Google Scholar]
- Choy, K.; Lee, W.; Lau, H.C.; Choy, L. A knowledge-based supplier intelligence retrieval system for outsource manufacturing. Knowl.-Based Syst. 2005, 18, 1–17. [Google Scholar] [CrossRef]
- Yigitbasioglu, O.M. Information sharing with key suppliers: A transaction cost theory perspective. Int. J. Phys. Distrib. Logist. Manag. 2010, 40, 550–578. [Google Scholar] [CrossRef] [Green Version]
- Chae, S.; Yan, T.; Yang, Y. Supplier innovation value from a buyer–supplier structural equivalence view: Evidence from the PACE awards in the automotive industry. J. Oper. Manag. 2019, 66, 820–838. [Google Scholar] [CrossRef]
- Lee, C.C.; Yang, J. Knowledge value chain. J. Manag. Dev. 2000, 19, 783–793. [Google Scholar]
- Tranfield, D.; Denyer, D.; Smart, P. Towards a Methodology for Developing Evidence-Informed Management Knowledge by Means of Systematic Review. Br. J. Manag. 2003, 14, 207–222. [Google Scholar] [CrossRef]
- Patel, A.B.; Aran, H. Outsourcing Success: The Management Imperative; Springer: Cham, Switzerland, 2005. [Google Scholar]
- Wilhelm, M.; Sydow, J. Managing coopetition in supplier networks—A paradox perspective. J. Supply Chain Manag. 2018, 54, 22–41. [Google Scholar] [CrossRef] [Green Version]
- Çelen, A. Comparative Analysis of Normalization Procedures in TOPSIS Method: With an Application to Turkish Deposit Banking Market. Informatica 2014, 25, 185–208. [Google Scholar] [CrossRef] [Green Version]
- Bahadori-Chinibelagh, S.; Fathollahi-Fard, A.M.; Hajiaghaei-Keshteli, M. Two Constructive Algorithms to Address a Multi-Depot Home Healthcare Routing Problem. IETE J. Res. 2019, 1–7. [Google Scholar] [CrossRef]
- Amiri, S.A.S.H.; Zahedi, A.; Kazemi, M.; Soroor, J.; Hajiaghaei-Keshteli, M. Determination of the optimal sales level of perishable goods in a two-echelon supply chain network. Comput. Ind. Eng. 2020, 139, 106156. [Google Scholar] [CrossRef]
- Karampour, M.M.; Hajiaghaei-Keshteli, M.; Fathollahi-Fard, A.M.; Tian, G. Metaheuristics for a bi-objective green vendor managed inventory problem in a two-echelon supply chain network. Sci. Iran. 2020. [Google Scholar] [CrossRef]
- Ruggeri, G.; Orsi, L.; Corsi, S. A bibliometric analysis of the scientific literature on Fairtrade labelling. Int. J. Consum. Stud. 2019, 43, 134–152. [Google Scholar] [CrossRef] [Green Version]
- Meemken, E.-M.; Sellare, J.; Kouame, C.N.; Qaim, M. Effects of Fairtrade on the livelihoods of poor rural workers. Nat. Sustain. 2019, 2, 635–642. [Google Scholar] [CrossRef]

| Goals and Targets of the Purchasing | |||
|---|---|---|---|
| Efficiency | Effectiveness | ||
| Relationship Complexity between Buyer and Supplier | Transactional Exchange | Price Minimization | Adaptor |
| Relational Partnership | Bargaining | Projector | |
| Collaboration Network | Clockwise | Updater | |
| Printed Patents | Published Articles | Openness INDEX | R&D Personnel | Knowledge Infrastructure | Scientific Communities | New Products | Technology Levels | R&D Budget | ||
|---|---|---|---|---|---|---|---|---|---|---|
| Cluster A (Fars P.) | Company A1 | 2 | 12 | 8 | 4 | 1 | 5 | 10 | 4 | 120 |
| Company A2 | 1 | 14 | 4 | 3 | 2 | 4 | 6 | 3 | 230 | |
| Company A3 | 2 | 13 | 5 | 5 | 3 | 4 | 11 | 5 | 300 | |
| Company A4 | 4 | 16 | 5 | 4 | 5 | 3 | 6 | 6 | 250 | |
| Company A5 | 3 | 9 | 2 | 2 | 3 | 3 | 7 | 3 | 190 | |
| Company A6 | 7 | 10 | 4 | 5 | 2 | 4 | 10 | 4 | 200 | |
| Cluster B (Alborz P.) | Company B1 | 3 | 11 | 2 | 2 | 3 | 6 | 4 | 8 | 130 |
| Company B2 | 4 | 21 | 2 | 3 | 8 | 5 | 6 | 4 | 270 | |
| Company B3 | 2 | 12 | 5 | 2 | 4 | 3 | 4 | 2 | 120 | |
| Company B4 | 0 | 18 | 8 | 4 | 5 | 3 | 3 | 4 | 100 | |
| Company B5 | 8 | 28 | 1 | 6 | 7 | 7 | 14 | 5 | 320 | |
| Company B6 | 2 | 20 | 5 | 3 | 6 | 4 | 6 | 2 | 200 | |
| Cluster C (Markazi P.) | Company C1 | 4 | 32 | 4 | 5 | 8 | 9 | 20 | 6 | 360 |
| Company C2 | 5 | 18 | 5 | 2 | 4 | 6 | 12 | 7 | 200 | |
| Company C3 | 4 | 13 | 7 | 2 | 5 | 5 | 10 | 8 | 180 | |
| Company C4 | 6 | 12 | 6 | 3 | 3 | 3 | 4 | 6 | 220 | |
| Company C5 | 3 | 11 | 5 | 4 | 4 | 3 | 8 | 7 | 200 | |
| Company C6 | 2 | 16 | 7 | 4 | 5 | 2 | 9 | 4 | 250 |
| Value | |
|---|---|
| Negative goal variable penalty | 2 |
| Personnel constraint goal | 25 |
| Maximum selected clusters | 1 |
| Published Patents | Published Articles | Openness Index | R&D Personnel | Knowledge Infrastructure | Scientific Activities | New Products | Technology Levels | R&D Budget | |
|---|---|---|---|---|---|---|---|---|---|
| Comp. A1 | 0.25 | 0.375 | 1 | 0.666667 | 0.125 | 0.555556 | 0.5 | 0.5 | 0.333333 |
| Comp. A2 | 0.125 | 0.4375 | 0.5 | 0.5 | 0.25 | 0.444444 | 0.3 | 0.375 | 0.638889 |
| Comp. A3 | 0.25 | 0.40625 | 0.625 | 0.833333 | 0.375 | 0.444444 | 0.55 | 0.625 | 0.833333 |
| Comp. A4 | 0.5 | 0.5 | 0.625 | 0.666667 | 0.625 | 0.333333 | 0.3 | 0.75 | 0.694444 |
| Comp. A5 | 0.375 | 0.28125 | 0.25 | 0.333333 | 0.375 | 0.333333 | 0.35 | 0.375 | 0.527778 |
| Comp. A6 | 0.875 | 0.3125 | 0.5 | 0.833333 | 0.25 | 0.444444 | 0.5 | 0.5 | 0.555556 |
| Comp. B1 | 0.375 | 0.34375 | 0.25 | 0.333333 | 0.375 | 0.666667 | 0.2 | 1 | 0.361111 |
| Comp. B2 | 0.5 | 0.65625 | 0.25 | 0.5 | 1 | 0.555556 | 0.3 | 0.5 | 0.75 |
| Comp. B3 | 0.25 | 0.375 | 0.625 | 0.333333 | 0.5 | 0.333333 | 0.2 | 0.25 | 0.333333 |
| Comp. B4 | 0 | 0.5625 | 1 | 0.666667 | 0.625 | 0.333333 | 0.15 | 0.5 | 0.277778 |
| Comp. B5 | 1 | 0.875 | 0.125 | 1 | 0.875 | 0.777778 | 0.7 | 0.625 | 0.888889 |
| Comp. B6 | 0.25 | 0.625 | 0.625 | 0.6 | 0.75 | 0.444444 | 0.3 | 0.25 | 0.555556 |
| Comp. C1 | 0.5 | 1 | 0.5 | 1 | 1 | 1 | 1 | 0.75 | 1 |
| Comp. C2 | 0.625 | 0.5625 | 0.625 | 0.5 | 0.5 | 0.666667 | 0.6 | 0.875 | 0.555556 |
| Comp. C3 | 0.5 | 0.40625 | 0.875 | 0.5 | 0.625 | 0.555556 | 0.5 | 1 | 0.5 |
| Comp. C4 | 0.75 | 0.375 | 0.75 | 0.75 | 0.375 | 0.333333 | 0.2 | 0.75 | 0.611111 |
| Comp. C5 | 0.375 | 0.34375 | 0.625 | 1 | 0.5 | 0.333333 | 0.4 | 0.875 | 0.555556 |
| Comp. C6 | 0.25 | 0.5 | 0.875 | 1 | 0.625 | 0.222222 | 0.45 | 0.5 | 0.694444 |
| Description | Variable | Value | Description | Variable | Value | Description | Variable | Value | Description | Variable | Value |
|---|---|---|---|---|---|---|---|---|---|---|---|
| Companies of Cluster A | F1 | 0 | Companies of Cluster B | F7 | 0 | Companies of Cluster C * | F13 | 1 | Cluster no.1 | F19 | 0 |
| F2 | 0 | F8 | 0 | F14 | 0 | Cluster no.2 | F20 | 0 | |||
| F3 | 0 | F9 | 0 | F15 | 1 | Cluster no.3 | F21 | 1 | |||
| F4 | 0 | F10 | 0 | F16 | 1 | Deviation from negative goal | F22 | 5 | |||
| F5 | 0 | F11 | 0 | F17 | 1 | Deviation from positive goal | F23 | 0 | |||
| F6 | 0 | F12 | 0 | F18 | 1 |
| Com. C1 | Com. C3 | Com. C4 | Com. C5 | Com. C6 | |
|---|---|---|---|---|---|
| Supplement (1) unit price | 16,000 | 15,500 | 15,350 | 15,800 | 16,500 |
| Supplement (2) unit price | 21,200 | 22,700 | 20,900 | 22,150 | 21,800 |
| Supplement (3) unit price | 12,900 | 13,250 | 12,250 | 12,750 | 13,500 |
| Supplement (4) unit price | 36,700 | 36,000 | 35,000 | 37,300 | 35,650 |
| Supplement (1) capacity | 1300 | 2470 | 2860 | 780 | 1560 |
| Supplement (2) capacity | 2730 | 2990 | 3900 | 2340 | 2990 |
| Supplement (3) capacity | 2080 | 2600 | 3380 | 2600 | 1950 |
| Supplement (4) capacity | 5200 | 4550 | 3900 | 2860 | 5070 |
| Suppliers’ order cost | 4,400,000 | 5,478,000 | 4,840,000 | 5280,000 | 6,380,000 |
| Period 1 | Period 2 | Period 3 | Period 4 | Period 5 | Period 6 | Period 7 | Period 8 | |
|---|---|---|---|---|---|---|---|---|
| Supplement (1) | 1200 | 1320 | 1680 | 2280 | 2040 | 1440 | 1080 | 960 |
| Supplement (2) | 2760 | 2640 | 2580 | 2520 | 2760 | 2880 | 2640 | 2400 |
| Supplement (3) | 2160 | 2160 | 2160 | 2160 | 2160 | 2160 | 2160 | 2160 |
| Supplement (4) | 5760 | 6000 | 6240 | 6600 | 6240 | 6000 | 5640 | 5400 |
| Product Cost (Per Unit) | Set Up Cost | Company Capacity (Per Month) | Safety Stock % (Per Month) | Inventory Cost (Per Month) | |
|---|---|---|---|---|---|
| Supplement (1) | 14,000 | 7,200,000 | 1600 | 7 | 120 |
| Supplement (2) | 20,200 | 4,500,000 | 2600 | 7 | 240 |
| Supplement (3) | 11,400 | 6,500,000 | 2400 | 7 | 190 |
| Supplement (4) | 33,500 | 5,400,000 | 5600 | 7 | 300 |
| # | Crossover | Mutation | Pop-Size |
|---|---|---|---|
| 1 | Constraint Dependent | Constraint Dependent | 10,000 |
| 2 | Uniform | Constraint Dependent | 5000 |
| 3 | Constraint Dependent | Constraint Dependent | 10,000 |
| 4 | Adaptive Feasible | Two Point | 10,000 |
| 5 | Adaptive Feasible | Scattered | 20,000 |
| 6 | Constraint Dependent | Single Point | 10,000 |
| 7 | Constraint Dependent | Scattered | 10,000 |
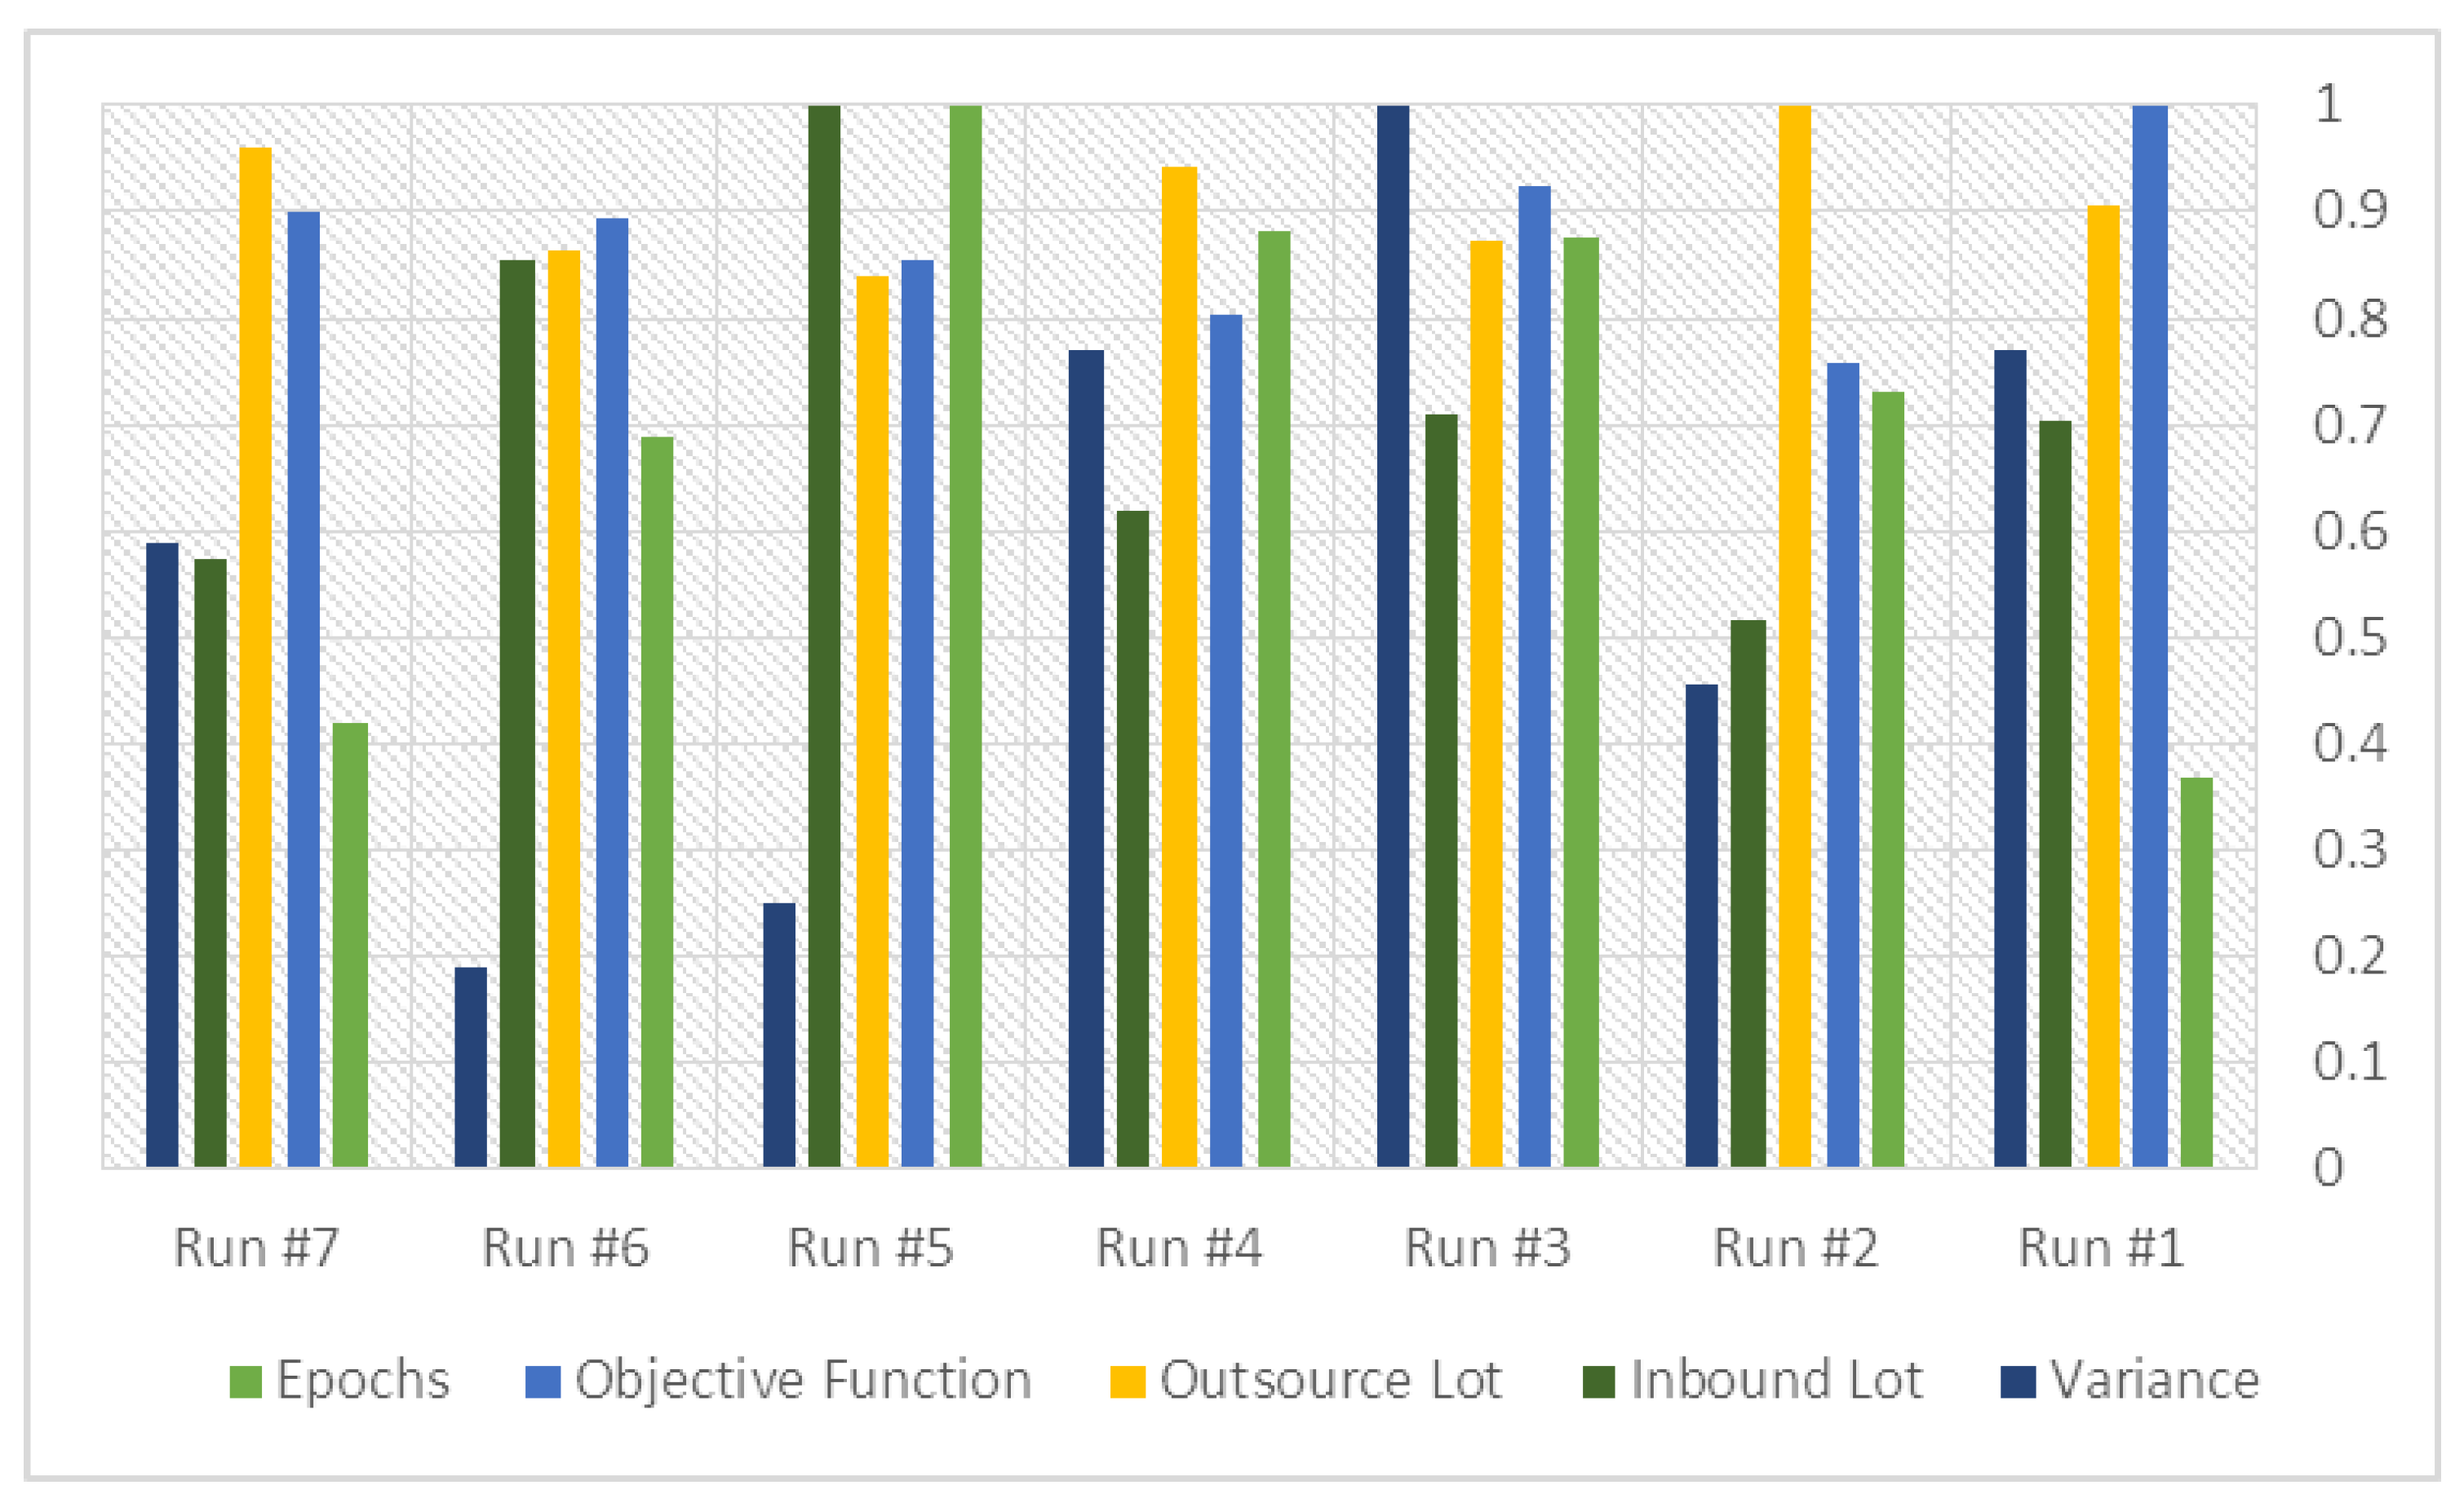
| Run #1 | Run #2 | Run #3 | Run #4 | Run #5 | Run #6 | Run #7 | |
|---|---|---|---|---|---|---|---|
| Crossover | Constraint Dependent | Uniform | Constraint Dependent | Adaptive Feasible | Adaptive Feasible | Constraint Dependent | Constraint Dependent |
| Mutation | Constraint Dependent | Constraint Dependent | Heuristic | Two Point | Scattered | Single Point | Scattered |
| D1 | 1 | 2 | 3 | 0 | 0 | 0 | 3 |
| D2 | 2 | 3 | 2 | 1 | 0 | 3 | 3 |
| D3 | 2 | 0 | 3 | 2 | 4 | 0 | 3 |
| D4 | 3 | 4 | 1 | 2 | 2 | 5 | 0 |
| D5 | 0 | 2 | 1 | 3 | 4 | 0 | 2 |
| Epochs | 2334 | 1176 | 982 | 975 | 860 | 1248 | 2057 |
| Objective Function | 1.59 × 10⁹ | 2.10 × 10⁹ | 1.72 × 10⁹ | 1.98 × 10⁹ | 1.86 × 10⁹ | 1.78 × 10⁹ | 1.77 × 10⁹ |
| Outsource Lot | 78,123 | 70,693 | 80,917 | 75,001 | 84,117 | 81,742 | 73,572 |
| Inbound Lot | 20,271 | 27,647 | 20,117 | 23,058 | 14,264 | 16,699 | 24,808 |
| Total | 98,394 | 98,340 | 101,034 | 98,059 | 98,381 | 98,441 | 98,380 |
| Long-Term Consequences | Benefit Level | |||
|---|---|---|---|---|
| Corporate | Suppliers | Employees | Society | |
| Investment focus in the industrial cluster geographic area | Low | Moderate | High | |
| The emergence of new service and manufacturing jobs and related companies | High | High | ||
| Creating shared value and strategic CSR replaces costly social responsibility | Very High | High | ||
| Reduce the risk of ordering | Very High | Moderate | ||
| Easy to access and cost reduction of raw materials | High | |||
| Strengthen knowledge sharing network | Very High | High | ||
| Improving product quality by learning about new technologies | High | High | Moderate | |
| Development of knowledge-based companies in the region | High | High | ||
| Development of pharmaceutical-related specialties | High | High | ||
| Focus on job search and ease of attracting human resources | Low | Very High | High | High |
| Empowering the people of the region and trying to eliminate unemployment | Moderate | High | ||
| Increase job security in the region and a more straightforward career path | Very High | Moderate | ||
| Development of education systems | High | Very High | ||
| Access to more support technical facilities and infrastructure | Moderate | High | ||
Publisher’s Note: MDPI stays neutral with regard to jurisdictional claims in published maps and institutional affiliations. |
© 2022 by the authors. Licensee MDPI, Basel, Switzerland. This article is an open access article distributed under the terms and conditions of the Creative Commons Attribution (CC BY) license (https://creativecommons.org/licenses/by/4.0/).
Share and Cite
Taghipour, A.; Khazaei, M.; Azar, A.; Rajabzadeh Ghatari, A.; Hajiaghaei-Keshteli, M.; Ramezani, M. Creating Shared Value and Strategic Corporate Social Responsibility through Outsourcing within Supply Chain Management. Sustainability 2022, 14, 1940. https://doi.org/10.3390/su14041940
Taghipour A, Khazaei M, Azar A, Rajabzadeh Ghatari A, Hajiaghaei-Keshteli M, Ramezani M. Creating Shared Value and Strategic Corporate Social Responsibility through Outsourcing within Supply Chain Management. Sustainability. 2022; 14(4):1940. https://doi.org/10.3390/su14041940
Chicago/Turabian StyleTaghipour, Atour, Moein Khazaei, Adel Azar, Ali Rajabzadeh Ghatari, Mostafa Hajiaghaei-Keshteli, and Mohammad Ramezani. 2022. "Creating Shared Value and Strategic Corporate Social Responsibility through Outsourcing within Supply Chain Management" Sustainability 14, no. 4: 1940. https://doi.org/10.3390/su14041940
APA StyleTaghipour, A., Khazaei, M., Azar, A., Rajabzadeh Ghatari, A., Hajiaghaei-Keshteli, M., & Ramezani, M. (2022). Creating Shared Value and Strategic Corporate Social Responsibility through Outsourcing within Supply Chain Management. Sustainability, 14(4), 1940. https://doi.org/10.3390/su14041940