
Investing in Urban Blue–Green Infrastructure—Assessing the Costs and Benefits of Stormwater Management in a Peri-Urban Catchment in Oslo, Norway

 , and
, and 
Abstract
:1. Introduction
2. Materials and Methods
2.1. BGI Strategies
2.2. Precipitation and CSO Volumes
2.3. Costs
2.4. Benefits
2.4.1. Direct Benefits
2.4.2. Co-Benefits
2.5. Cost–Benefit Calculations
3. Results
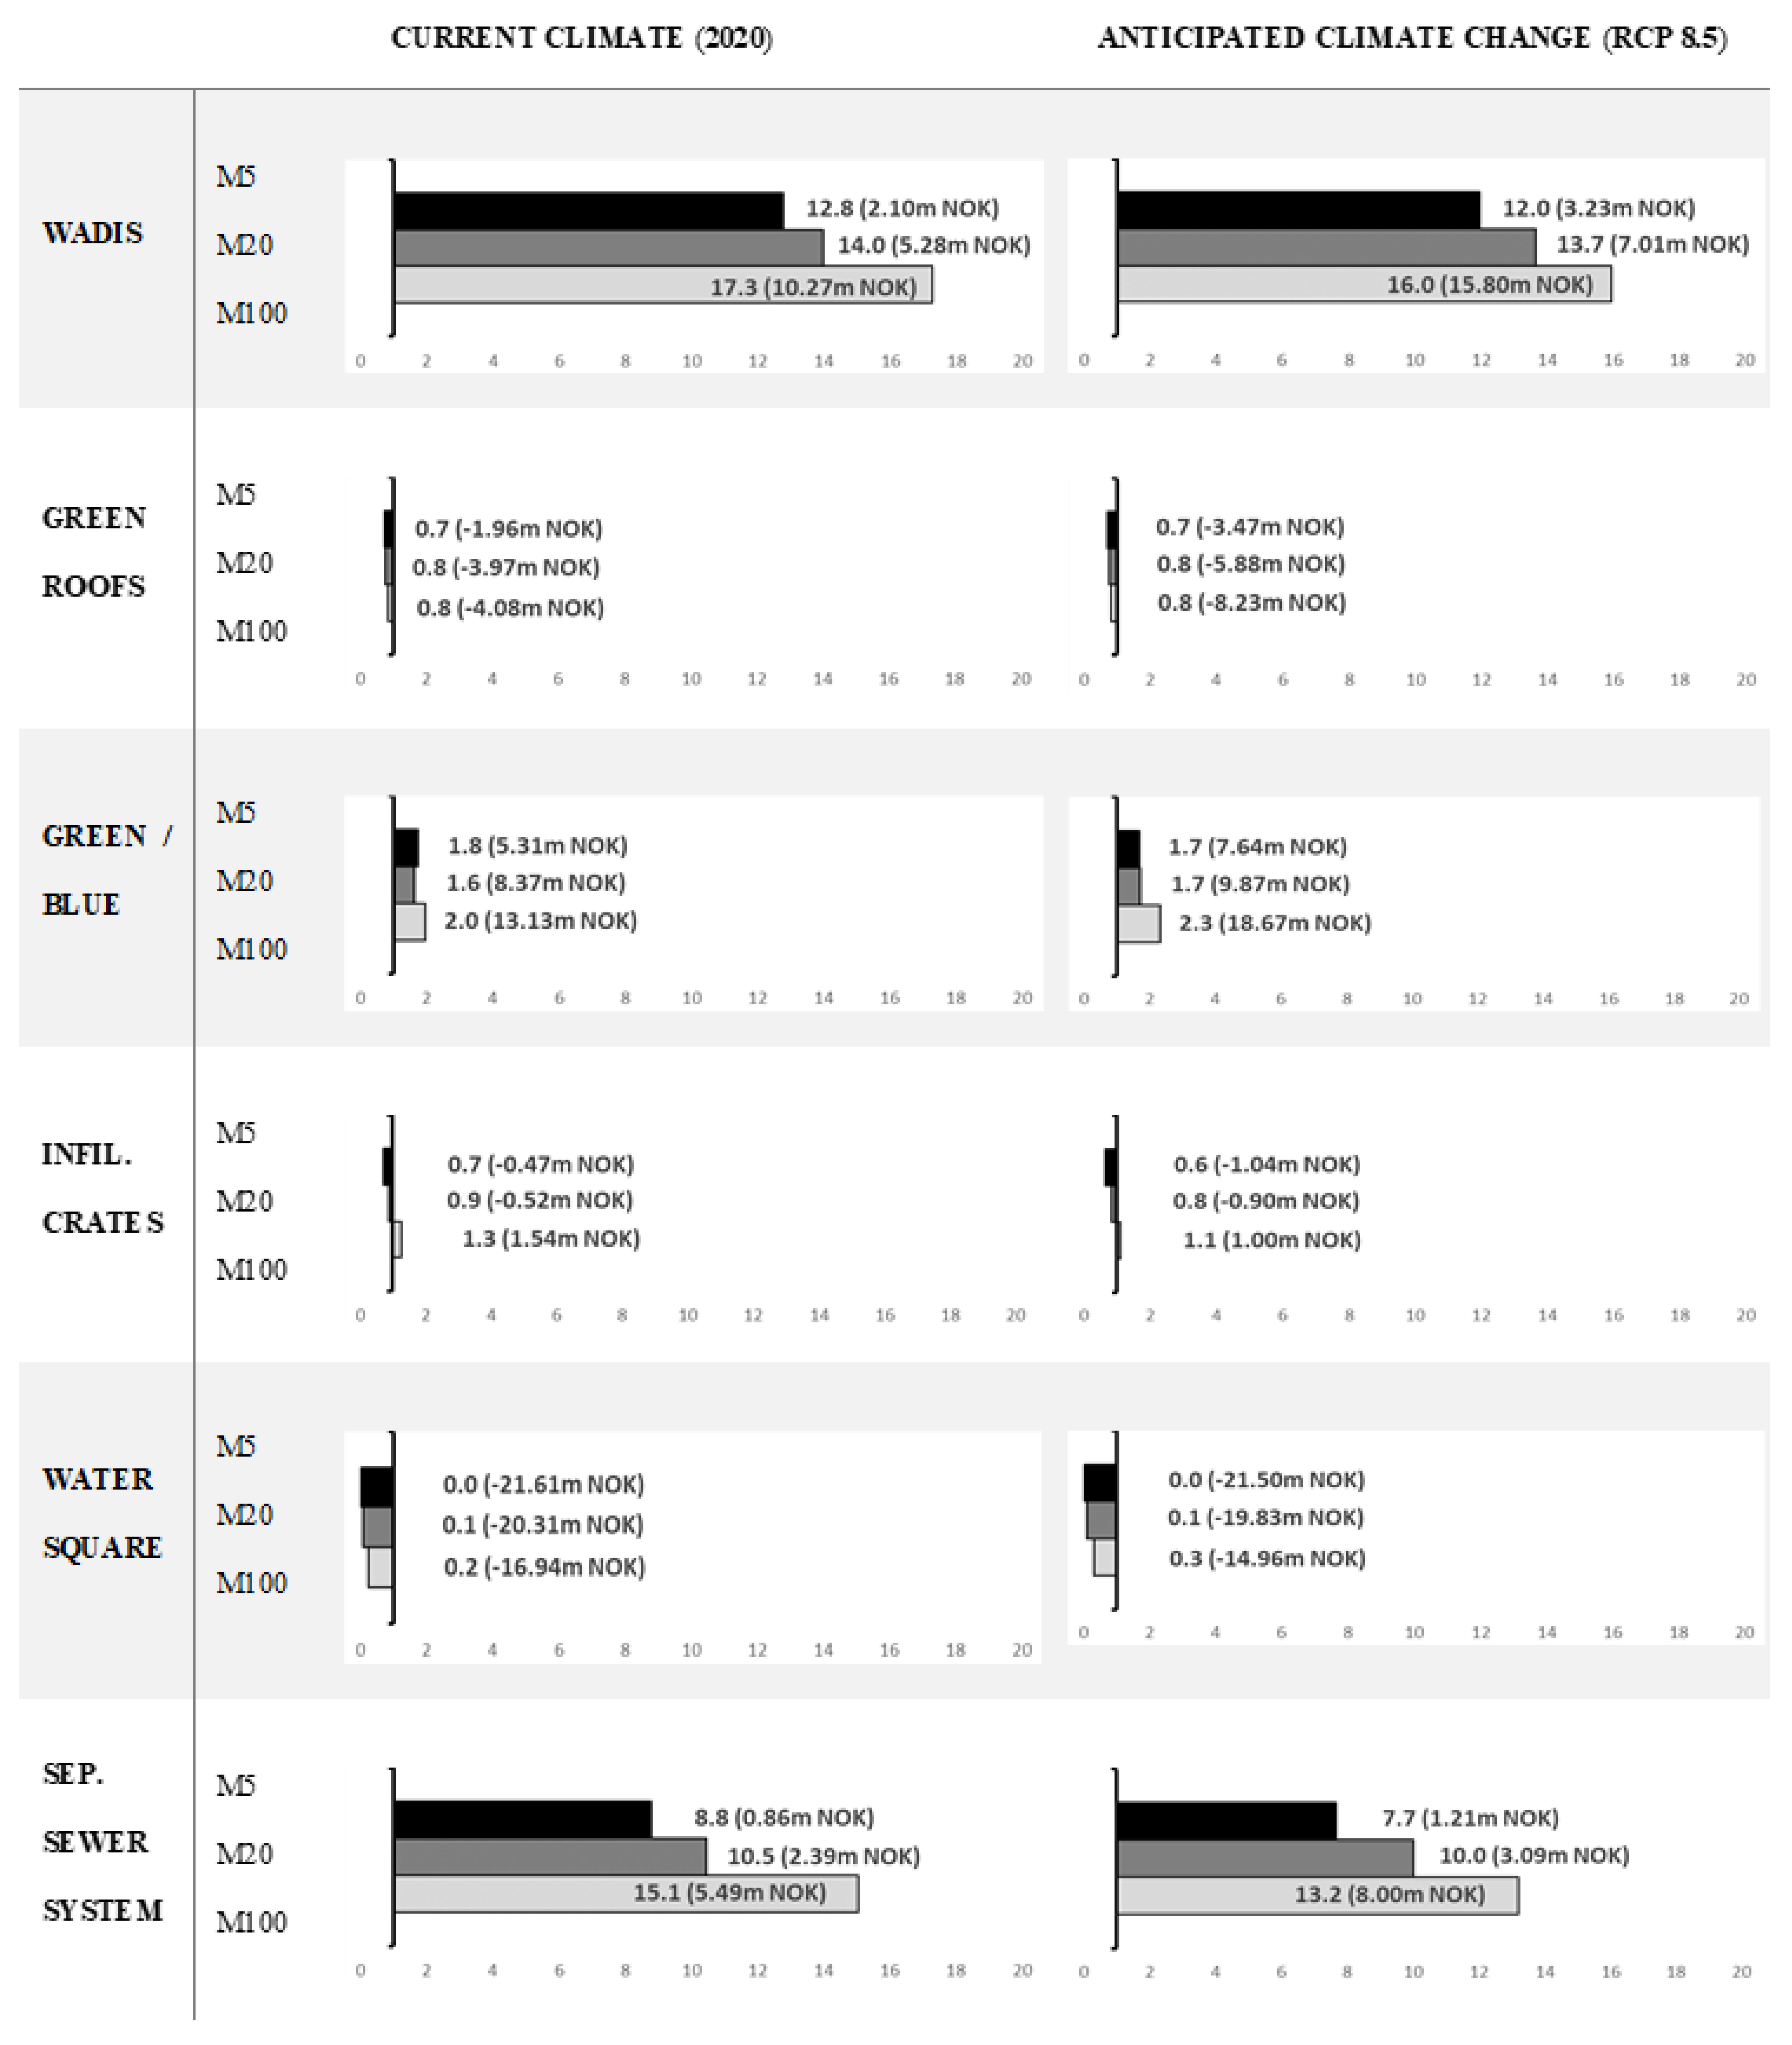
3.1. Costs
3.2. Direct and Co-Benefits
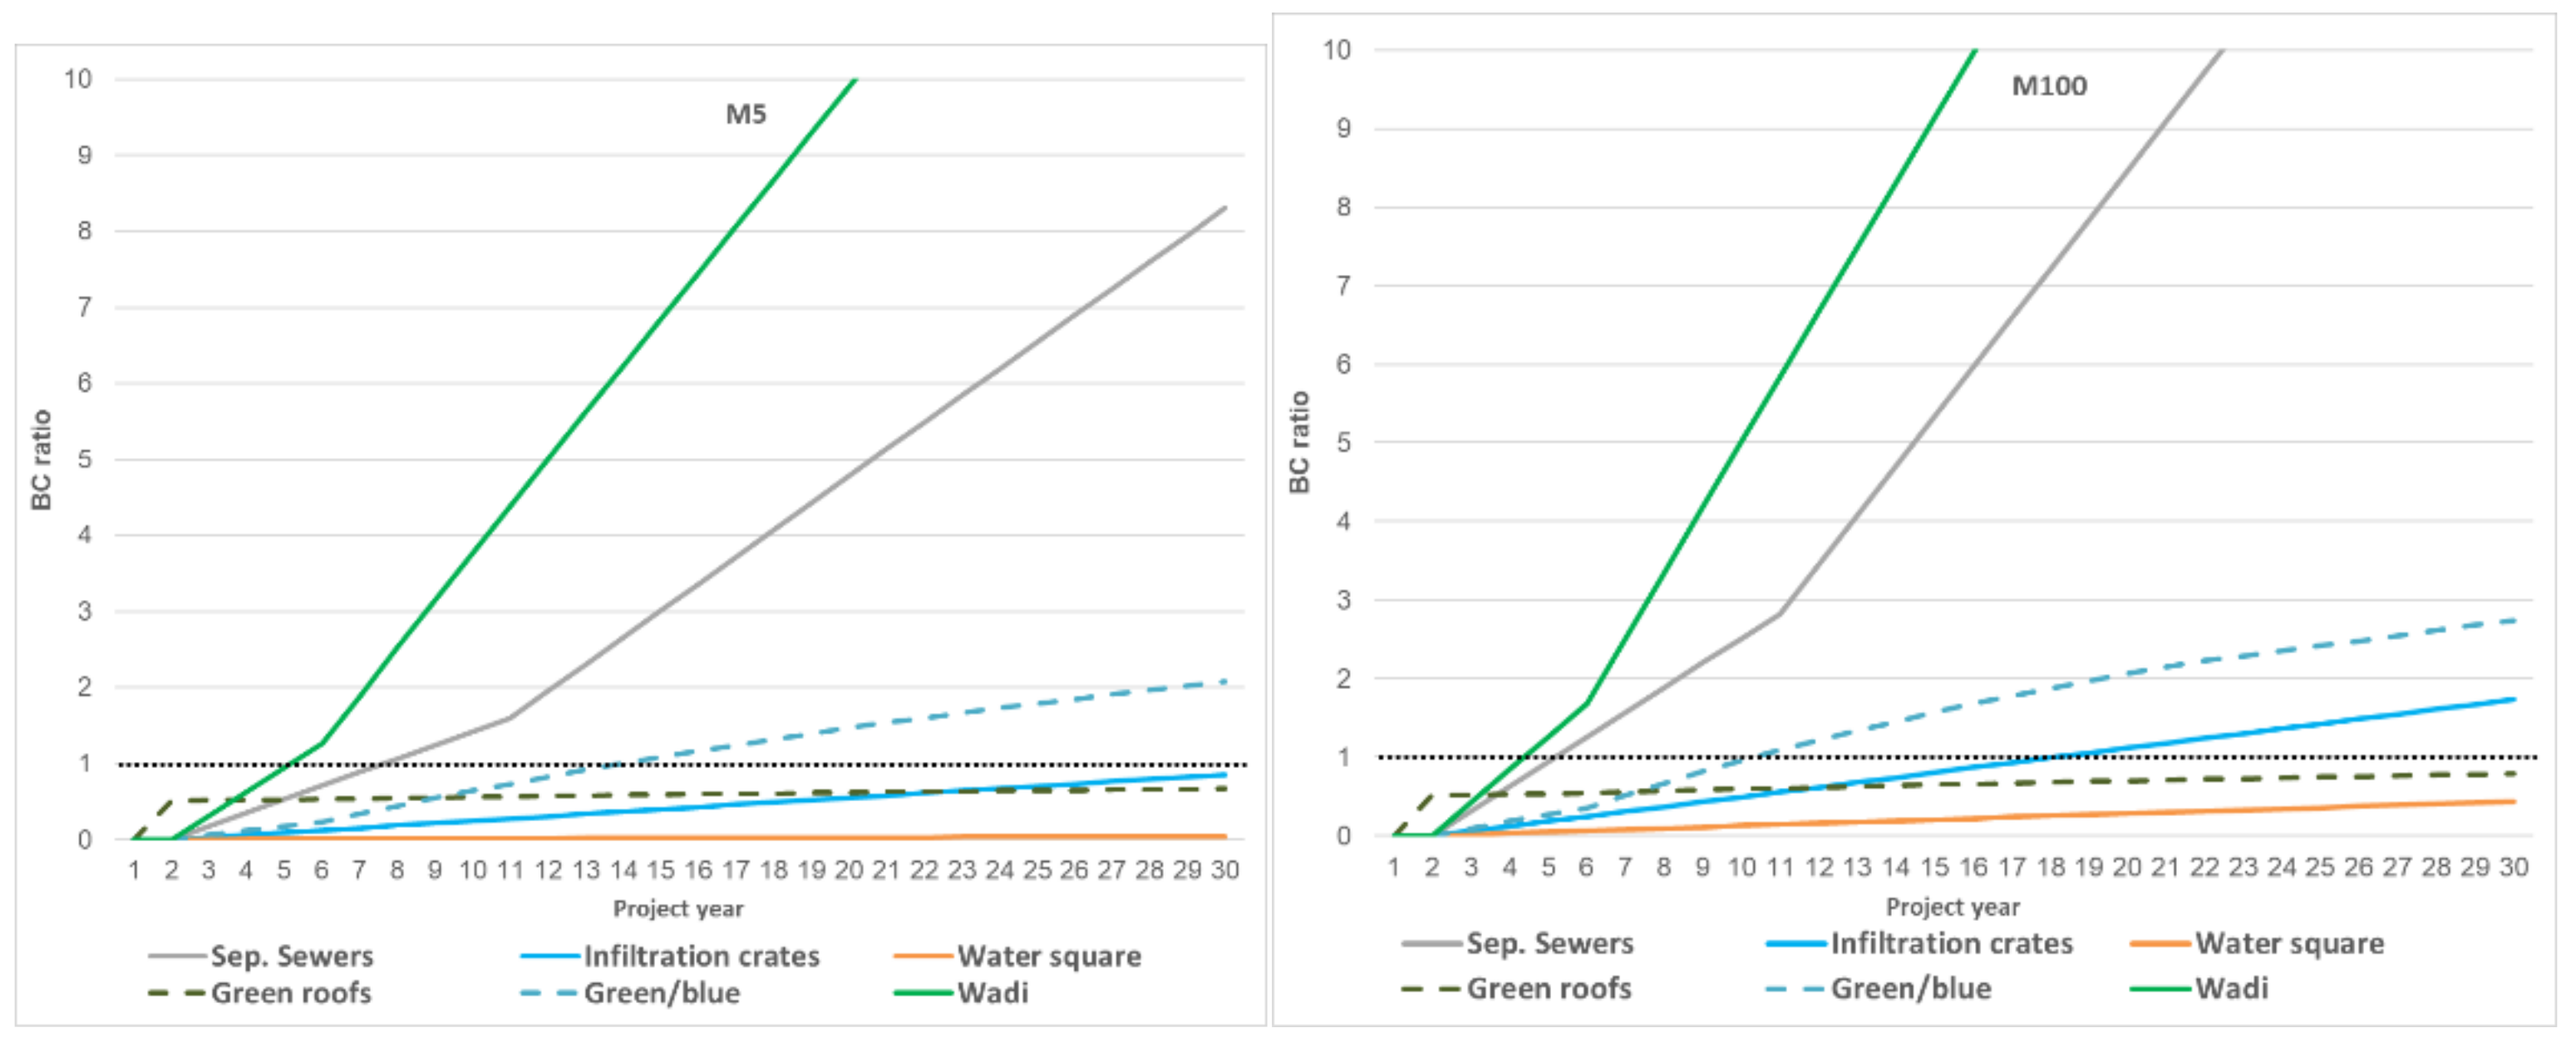
3.3. Net Benefits and Return on Investment
3.4. Sensitivity Analyses
4. Discussion
5. Conclusions
Supplementary Materials
Author Contributions
Funding
Institutional Review Board Statement
Informed Consent Statement
Acknowledgments
Conflicts of Interest
References
- Belčáková, I.; Świąder, M.; Bartyna-Zielińska, M. The Green Infrastructure in Cities as a Tool for Climate Change Adaptation and Mitigation: Slovakian and Polish Experiences. Atmosphere 2019, 10, 552. [Google Scholar] [CrossRef] [Green Version]
- Liu, L.; Jensen, M.B. Green infrastructure for sustainable urban water management: Practices of five forerunner cities. Cities 2018, 74, 126–133. [Google Scholar] [CrossRef]
- European Commission. The Forms and Functions of Green Infrastructure. Directorate-General for Environment. 2022. Available online: https://ec.europa.eu/environment/nature/ecosystems/index_en.htm (accessed on 13 January 2022).
- Vandermeulen, V.; Verspecht, A.; Vermeire, B.; Van Huylenbroeck, G.; Gellynck, X. The use of economic valuation to create public support for green infrastructure investments in urban areas. Landsc. Urban Plan. 2011, 103, 198–206. [Google Scholar] [CrossRef]
- Jayasooriya, V.M.; Ng, A.W.M. Tools for Modeling of Stormwater Management and Economics of Green Infrastructure Practices: A Review. Water Air Soil Pollut. 2014, 225, 1–20. [Google Scholar] [CrossRef] [Green Version]
- Werners, S.E.; Wise, R.M.; Butler, J.R.A.; Totin, E.; Vincent, K. Adaptation pathways: A review of approaches and a learning framework. Environ. Sci. Policy 2021, 116, 266–275. [Google Scholar] [CrossRef]
- Manso, M.; Teotónio, I.; Silva, C.; Cruz, C. Green roof and green wall benefits and costs: A review of the quantitative evidence. Renew. Sustain. Energy Rev. 2021, 135, 110111. [Google Scholar] [CrossRef]
- William, R.; Goodwell, A.; Richardson, M.; Le, P.V.V.; Kumar, P.; Stillwell, A.S. An environmental cost-benefit analysis of alternative green roofing strategies. Ecol. Eng. 2016, 95, 1–9. [Google Scholar] [CrossRef] [Green Version]
- Nurmi, V.; Votsis, A.; Perrels, A.; Lehvävirta, S. Cost-Benefit Analysis of Green Roofs in Urban Areas: Case Study in Helsinki; Ilmatieteen laitos: Helsinki, Finland, 2013; p. 58. [Google Scholar]
- Silva, C.M.; Cruz, C.O.; Teotónio, I. Project GENESIS: An All-inclusive Model to Perform Cost-Benefit Analysis of Green Roofs and Walls. Eur. J. Sustain. Dev. 2019, 8, 85. [Google Scholar] [CrossRef]
- Haggag, M.; Hassan, A. Cost-benefit analysis of living wall systems on school building skins in a hot climate. Energy Sustain. V Spec. Contrib. 2015, 206, 3–11. [Google Scholar] [CrossRef] [Green Version]
- Jianbing, Z.; Changming, L.; Hongxing, Z. Cost-benefit analysis for urban rainwater harvesting in Beijing. Water Int. 2010, 35, 195–209. [Google Scholar] [CrossRef]
- Kim, H.W.; Li, M.-H.; Kim, H.; Lee, H.K. Cost-benefit analysis and equitable cost allocation for a residential rainwater harvesting system in the city of Austin, Texas. Int. J. Water Resour. Dev. 2015, 32, 749–764. [Google Scholar] [CrossRef]
- Liu, W.; Chen, W.; Feng, Q.; Peng, C.; Kang, P. Cost-benefit analysis of green infrastructures on community stormwater reduction and utilization: A case of Beijing, China. Environ. Manag. 2016, 58, 1015–1026. [Google Scholar] [CrossRef] [PubMed] [Green Version]
- Johnson, D.; Geisendorf, S. Are Neighborhood-level SUDS Worth it? An Assessment of the Economic Value of Sustainable Urban Drainage System Scenarios Using Cost-Benefit Analyses. Ecol. Econ. 2019, 158, 194–205. [Google Scholar] [CrossRef]
- Locatelli, L.; Guerrero, M.; Russo, B.; Martínez-Gomariz, E.; Sunyer, D.; Martínez, M. Socio-economic assessment of green infrastructure for climate change adaptation in the context of urban drainage planning. Sustainability 2020, 12, 3792. [Google Scholar] [CrossRef]
- Oslo Commune. Action Plan for Stormwater Management in The City of Oslo—Executive Summary; City of Oslo: Oslo, Norway, 2016; p. 20. [Google Scholar]
- Oslo Commune. Commune Plan for Oslo 2018 (En Grønnere, Varmere Og Mer Skapende by Med Plass Til Alle); City of Oslo: Oslo, Norway, 2018; p. 46. (In Norwegian) [Google Scholar]
- Brinkhoff. City Population—Population Statistics for Countries, Administrative Divisions, Cities, Urban Areas and Agglomerations—Interactive Maps and Charts. 2021. Available online: https://www.citypopulation.de/en/norway/oslofjorden/admin/ (accessed on 13 July 2021).
- MAPLOGS. Worldwide Elevation Map Finder—Elevation of Oslo. 2021. Available online: https://elevation.maplogs.com/poi/oslo_norway.61029.html (accessed on 13 July 2021).
- Weather Atlas. Oslo, Norway—Detailed Climate Information and Monthly Weather Forecast. 2021. Available online: https://www.weather-atlas.com/en/norway/oslo-climate (accessed on 13 July 2021).
- Mallin, M.A.; Cahoon, L.B.; Toothman, B.R.; Parsons, D.C.; McIver, M.R.; Ortwine, M.L.; Harrington, R.N. Impacts of a raw sewage spill on water and sediment quality in an urbanized estuary. Mar. Pollut. Bull. 2007, 54, 81–88. [Google Scholar] [CrossRef] [PubMed]
- Oslo commune. Water Management Strategy; City of Oslo: Oslo, Norway, 2013; p. 14. (In Norwegian) [Google Scholar]
- Lekkerkerk. Opportunities to Make Grefsen Stormwater Proof: Developing Adaptation Pathways for the Grefsen District in Oslo, Norway; Water Systems and Global Change Group, Wageningen University and Research: Wageningen, The Netherlands, 2020; p. 68. [Google Scholar]
- Löwe, R.; Urich, C.; Kulahci, M.; Radhakrishnan, M.; Deletic, A.; Arnbjerg-Nielsen, K. Simulating flood risk under non-stationary climate and urban development conditions—Experimental setup for multiple hazards and a variety of scenarios. Environ. Model. Softw. 2018, 102, 155–171. [Google Scholar] [CrossRef] [Green Version]
- Ingebrightsen, M.C. Separering Av Overvann Med åPen Lokal Overvannsdisponering (Lod): Redusere Overløpsdrift Til Akerselva FRA Grefsen/Kjelsås I Oslo; Norwegian University of Oslo: Oslo, Norway, 2017; p. 114. [Google Scholar]
- Sorteberg, A.; Lawrence, D.; Dyrrdal, A.V.; Mayer, S.; Engeland, K. Climatic Changes in Short Duration Extreme Precipitation and Rapid Onset Flooding—Implications for Design Values. NCCS Report No. 1/2018; Norwegian Centre for Climate Services: Oslo, Norway, 2018; p. 144. [Google Scholar]
- Van Vuuren, D.P.; Edmonds, J.; Kainuma, M.; Riahi, K.; Thomson, A.; Hibbard, K.; Masui, T. The representative concentration pathways: An overview. Clim. Chang. 2011, 109, 5. [Google Scholar] [CrossRef]
- Dyrrdal, A.V.; Førland, E.J. Klimapåslag for korttidsnedbør-Anbefalte verdier for Norge. NCCS Rep. 2019, 5, 25. [Google Scholar]
- Sartori, D.; Catalano, G.; Genco, M.; Pancotti, C.; Sirtori, E.; Vignetti, S.; Del Bo, C. Guide to Cost-Benefit Analysis of Investment Projects: Economic Appraisal Tool for Cohesion Policy 2014–2020; European Commision: Brussels, Belgium, 2014; p. 342. [Google Scholar]
- Kim, D.; Song, S.-K. The Multifunctional Benefits of Green Infrastructure in Community Development: An Analytical Review Based on 447 Cases. Sustainability 2019, 11, 3917. [Google Scholar] [CrossRef] [Green Version]
- Coutts, C.; Hahn, M. Green Infrastructure, Ecosystem Services, and Human Health. Int. J. Environ. Res. Public Health 2015, 12, 9768–9798. [Google Scholar] [CrossRef] [Green Version]
- Li, H.; Gao, H.; Zhou, Y.; Xu, C.-Y.; Rengifo, Z.; Ortega, M.; Sælthun, N.R. Usage of SIMWE model to model urban overland flood: A case study in Oslo. Hydrol. Res. 2020, 51, 366–380. [Google Scholar] [CrossRef]
- Ramboll. Unit Price Table Damage Model—Buildings, Critical Infrastructure, Transport, Nature & Environment; Ramboll Denmark: Copenhagen, Denmark, 2020. [Google Scholar]
- Bianchini, F.; Hewage, K. Probabilistic social cost-benefit analysis for green roofs: A lifecycle approach. Build. Environ. 2012, 58, 152–162. [Google Scholar] [CrossRef]
- Mahdiyar, A.; Tabatabaee, S.; Sadeghifam, N.S.; Mohandes, S.R.; Abdullah, A.; Meynagh, M.M. Probabilistic private cost-benefit analysis for green roof installation: A Monte Carlo simulation approach. Urban For. Urban Green. 2016, 20, 317–327. [Google Scholar] [CrossRef]
- Statistics Norway. Statbank—Municipal Wastewater—Self Cost and Fees in Municipal Wastewater 2015–2020. 2021. Available online: https://www.ssb.no/en/statbank/table/12217/ (accessed on 13 July 2021).
- Broks, K.; Van Luijtelaar, H. Green Roofs Further Assessed (In Dutch: Groene Daken Nader Beschouwd. Stowa Stitching RIONED). 2015. Available online: https://www.greendealgroenedaken.nl/en-facts-values/ (accessed on 13 July 2021).
- BUMA. Frequently Asked Question on Infiltration Crates. 2021. Available online: https://buma.com/de-8-meest-gestelde-vragen-over-infiltratiekratten/ (accessed on 5 June 2021).
- City Population. Grefsen—Statistical Area of Oslofjord. 2021. Available online: http://www.citypopulation.de/en/norway/oslofjorden/admin/oslo/03014406g__grefsen/ (accessed on 4 May 2021).
- Seip, K.; Strand, J. Willingness to Pay for Environmental Goods in Norway: A Contingent Valuation Study with Real Payment. Environ. Res. Econ. 1992, 2, 91–106. [Google Scholar] [CrossRef]
- Statista. Average Price of Residential Housing in Norway in February 2021, by City. 2021. Available online: https://www.statista.com/statistics/1049493/average-price-residential-property-in-norway-by-city (accessed on 13 July 2021).
- Van de Ven, F.H.M.; Voortman, B.R. The water balance of an urban area: Experiences in two case studies in the Lelystad (in Dutch). H2O 1985, 8, 170–176. [Google Scholar]
- Norwegian Ministry of Finance. NOU 2012: 16 Cost-Benefit Analysis. 2012. Available online: https://www.regjeringen.no/en/dokumenter/nou-2012-16/id700821/?ch=6 (accessed on 4 May 2021).
- European Union. Guide to Cost-Benefit Analysis of Investment Projects—Economic Appraisal Tool for Cohesion Policy 2014–2020; European Commission, Directorate-General for Regional and Urban Policy: Brussels, Belgium, 2015; ISBN 978-92-79-34796-2. [Google Scholar] [CrossRef]
- Bush, J. The role of local government greening policies in the transition towards nature-based cities. Environ. Innov. Soc. Transit. 2020, 35, 35–44. [Google Scholar] [CrossRef]
- Nicklin, H.; Leicher, A.M.; Dieperink, C.; Van Leeuwen, K. Understanding the Costs of Inaction–An Assessment of Pluvial Flood Damages in Two European Cities. Water 2019, 11, 801. [Google Scholar] [CrossRef] [Green Version]
- Montalto, F.; Behr, C.; Alfredo, K.; Wolf, M.; Arye, M.; Walsh, M. Rapid assessment of the cost-effectiveness of low impact development for CSO control. Landsc. Urban Plan. 2007, 82, 117–131. [Google Scholar] [CrossRef]
- Blackhurst, M.; Hendrickson, C.; Matthews, H.S. Cost-Effectiveness of Green Roofs. J. Archit. Eng. 2010, 16, 136–143. [Google Scholar] [CrossRef]


| (a) | ||||||
| Strategies | Current Rainfall Events (2020) | Future Rainfall Events (RCP 8.5) | ||||
| M5 | M20 | M100 | M5 | M20 | M100 | |
| Wadis | 479 m2 Wadis | 1092 m2 Wadis | 1692 m2 Wadis | 791 m2 Wadis | 1486 m2 Wadis | 2835 m2 Wadis |
| Green roofs | 9685 m2 Green roofs | 22,063 m2 Green roofs | 34,185 m2 Green roofs | 15,970 m2 Green roofs | 22,063 m2 Green roofs | 57,275 m2 Green roofs |
| Green / blue | 459 Raingarden | 681 Raingarden 601 Rain barrels | 681 Raingarden 681 Rain barrels 343 m2 Wadis | 681 Raingarden 125 Rain barrels | 681 Raingarden 681 Rain barrels 343 m2 Wadis | 681 Raingarden 681 Rain barrels 1692 m2 Wadis |
| Infiltration crates | 151 Infiltration crates of 1 m3 | 344 Infiltration crates of 1 m3 | 533 Infiltration crates of 1 m3 | 249 Infiltration crates of 1 m3 | 468 Infiltration crates of 1 m3 | 893 Infiltration crates of 1 m3 |
| Water square | 1 Water square | 1 Water square | 1 Water square | 1 Water square | 1 Water square | 1 Water square |
| Separate sewer system | Separate sewer system (151 m3) | Separate sewer system (344 m3) | Separate sewer system (533 m3) | Separate sewer system (249 m3) | Separate sewer system (468 m3) | Separate sewer system (893 m3) |
| (b) | ||||||
| Measures | Description | Water Storage Potential for Grefsen, Oslo (m3) | ||||
| Rain garden (per garden) | Residential gardens with a top surface of 2 m2, bottom surface of 1 m2, a slope of 1:3, and an infiltration box of 1 m3 | 224 | ||||
| Green roofs | Suitable for all roofs with slope < 35 degrees. Storage capacity is 15.5 mm due to almost permanent moisture conditions | 2214 | ||||
| Wadis | Properties similar to rain gardens but without a slope, leaving a storage of 0.368 m3/m2 | 7490 | ||||
| Rain barrel | Storage capacity of a single rain barrel is 0.2 m3 | 136 | ||||
| Infiltration crates | Can be implemented under roads, pavements, and fields with maximum required discharge of 7 m3/s | 2769 | ||||
| Water squares | Two locations that can be transformed into a water square (football field and a green zone) | 15,694 | ||||
| Rainwater sewage pipes | Can be implemented under roads, pavements, and fields with maximum required discharge of 7 m3/s | 2769 | ||||
| Rainfall Event | Current Rainfall Events (2020) | Future Rainfall Events (RCP 8.5) | ||
|---|---|---|---|---|
| 60-min Precipitation (mm) | CSO Volume (m3) | 60-min Precipitation (mm) | CSO Volume (m3) | |
| M5 | 25.1 | 151 | 29.6 | 249 |
| M20 | 34.7 | 344 | 41.3 | 468 |
| M100 | 45.3 | 533 | 54.8 | 893 |
| Measures | CAPEX NOK (€) | OPEX per Year NOK (€) | Economic Lifetime (Years) |
|---|---|---|---|
| Wadis (per m2) | 505 (49) | 0.7 (0.06) | 50 |
| Green roofs (per m2) | 814 (78) | 12 (1.2) | 50 |
| Rain gardens (per garden) | 16,446 (1581) | 250 (24) | 50 |
| Rain barrels (per barrel) | 915 (88) | 250 (24) | 20 |
| Infiltration crates (per m3 storage capacity) | 14,301 (1375) | 1.4 (0.14) | 50 |
| Water square (11,525 m2 fixed) | 28.4 × 10⁶ (2.73 × 10⁶) | 48,000 (4615) | 70 |
| Rainwater sewage pipes (per m3 storage capacity) | 1235 (119) | 0.2 (0.02) | 70 |
| Costs | Direct Benefits | Co-Benefits | |||||||||
|---|---|---|---|---|---|---|---|---|---|---|---|
| Strategy | Precipitation Event | CAPEX | OPEX | Total Costs | River Biodiversity and Water Quality Effects ** | Prevented Flood Damage | Increased Aesthetical Value (Greener Oslo) | Increased House Prices | Prevented Sewage Water Treatment | Fresh Water Savings | Total Benefits |
| Wadis | M5 | 0.17 | 0.01 | 0.18 | + | 0.52 | 0.24 | 1.52 | 2.28 | ||
| M20 | 0.40 | 0.01 | 0.41 | ++ | 1.68 | 0.54 | 3.47 | 5.69 | |||
| M100 | 0.61 | 0.02 | 0.63 | +++ | 4.68 | 0.83 | 5.38 | 10.89 | |||
| Green roofs | M5 | 5.67 | 1.62 | 7.29 | + | 0.52 | 0.80 | 3.46 | 0.55 | 5.33 | |
| M20 | 12.93 | 3.70 | 16.63 | ++ | 1.68 | 1.82 | 7.89 | 1.26 | 12.65 | ||
| M100 | 20.05 | 5.73 | 25.78 | +++ | 4.68 | 2.82 | 12.22 | 1.96 | 21.68 | ||
| Green/blue | M5 | 5.43 | 1.61 | 7.04 | + | 0.52 | 7.88 | 3.94 | 0.00 | 12.34 | |
| M20 | 8.64 | 4.48 | 13.12 | ++ | 1.68 | 11.69 | 7.57 | 0.55 | 21.49 | ||
| M100 | 8.92 | 4.77 | 13.69 | +++ | 4.68 | 11.96 | 9.55 | 0.62 | 26.81 | ||
| Infiltration crates | M5 | 1.73 | 0.00 | 1.73 | ++ | 0.59 | 0.62 | 1.20 | |||
| M20 | 3.94 | 0.01 | 3.95 | +++ | 1.89 | 1.40 | 3.29 | ||||
| M100 | 6.10 | 0.01 | 6.11 | ++++ | 5.26 | 2.17 | 7.43 | ||||
| Water square | M5 | 21.45 | 0.75 | 22.20 | ++ | 0.59 | 0.59 | ||||
| M20 | 21.45 | 0.75 | 22.20 | +++ | 1.89 | 1.89 | |||||
| M100 | 21.45 | 0.75 | 22.20 | ++++ | 5.26 | 5.26 | |||||
| Separate sewer system | M5 | 0.11 | 0.00 * | 0.11 | 0/+ | 0.45 | 0.52 | 0.97 | |||
| M20 | 0.25 | 0.00 * | 0.25 | + | 1.45 | 1.19 | 2.64 | ||||
| M100 | 0.39 | 0.00 * | 0.39 | ++ | 4.05 | 1.84 | 5.89 |
| Costs | Direct Benefits | Co-Benefits | |||||||||
|---|---|---|---|---|---|---|---|---|---|---|---|
| Strategy | Precipitation Event | CAPEX | OPEX | Total Costs | Effects on CSO’s * | Prevented Flood Damage | Increased Aesthetical Value (Greener Oslo) | Increased House Prices | Prevented Sewage Water Treatment | Fresh Water Savings | Total Benefits |
| Wadis | M5 | 0.29 | 0.01 | 0.30 | + | 0.62 | 0.39 | 2.51 | 3.52 | ||
| M20 | 0.54 | 0.01 | 0.55 | ++ | 2.11 | 0.73 | 4.73 | 7.57 | |||
| M100 | 1.03 | 0.03 | 1.06 | +++ | 6.45 | 1.39 | 9.02 | 16.86 | |||
| Green roofs | M5 | 9.36 | 2.68 | 12.04 | + | 0.62 | 1.32 | 5.71 | 0.91 | 8.56 | |
| M20 | 17.59 | 5.03 | 22.62 | ++ | 2.11 | 2.47 | 10.73 | 1.72 | 17.03 | ||
| M100 | 33.56 | 9.59 | 43.15 | +++ | 6.45 | 4.72 | 20.48 | 3.28 | 34.93 | ||
| Green/blue | M5 | 8.18 | 2.82 | 11.00 | + | 0.62 | 11.69 | 6.21 | 0.11 | 18.63 | |
| M20 | 8.84 | 4.77 | 13.61 | ++ | 2.11 | 11.86 | 8.89 | 0.62 | 23.48 | ||
| M100 | 9.33 | 4.78 | 14.11 | +++ | 6.45 | 12.53 | 13.18 | 0.62 | 32.78 | ||
| Infiltration crates | M5 | 2.85 | 0.01 | 2.86 | ++ | 0.70 | 1.02 | 1.71 | |||
| M20 | 5.35 | 0.01 | 5.36 | +++ | 2.37 | 1.91 | 4.28 | ||||
| M100 | 10.22 | 0.02 | 10.24 | ++++ | 7.24 | 3.64 | 10.88 | ||||
| Water square | M5 | 21.45 | 0.75 | 22.20 | ++ | 0.70 | 0.70 | ||||
| M20 | 21.45 | 0.75 | 22.20 | +++ | 2.37 | 2.37 | |||||
| M100 | 21.45 | 0.75 | 22.20 | ++++ | 7.24 | 7.24 | |||||
| Seperate sewer system | M5 | 0.18 | 0.00 * | 0.18 | 0/+ | 0.54 | 0.86 | 1.40 | |||
| M20 | 0.34 | 0.00 * | 0.34 | + | 1.82 | 1.61 | 3.43 | ||||
| M100 | 0.65 | 0.00 * | 0.65 | ++ | 5.57 | 3.08 | 8.65 |
Publisher’s Note: MDPI stays neutral with regard to jurisdictional claims in published maps and institutional affiliations. |
© 2022 by the authors. Licensee MDPI, Basel, Switzerland. This article is an open access article distributed under the terms and conditions of the Creative Commons Attribution (CC BY) license (https://creativecommons.org/licenses/by/4.0/).
Share and Cite
Wilbers, G.-J.; de Bruin, K.; Seifert-Dähnn, I.; Lekkerkerk, W.; Li, H.; Budding-Polo Ballinas, M. Investing in Urban Blue–Green Infrastructure—Assessing the Costs and Benefits of Stormwater Management in a Peri-Urban Catchment in Oslo, Norway. Sustainability 2022, 14, 1934. https://doi.org/10.3390/su14031934
Wilbers G-J, de Bruin K, Seifert-Dähnn I, Lekkerkerk W, Li H, Budding-Polo Ballinas M. Investing in Urban Blue–Green Infrastructure—Assessing the Costs and Benefits of Stormwater Management in a Peri-Urban Catchment in Oslo, Norway. Sustainability. 2022; 14(3):1934. https://doi.org/10.3390/su14031934
Chicago/Turabian StyleWilbers, Gert-Jan, Karianne de Bruin, Isabel Seifert-Dähnn, Wiebe Lekkerkerk, Hong Li, and Monserrat Budding-Polo Ballinas. 2022. "Investing in Urban Blue–Green Infrastructure—Assessing the Costs and Benefits of Stormwater Management in a Peri-Urban Catchment in Oslo, Norway" Sustainability 14, no. 3: 1934. https://doi.org/10.3390/su14031934
APA StyleWilbers, G.-J., de Bruin, K., Seifert-Dähnn, I., Lekkerkerk, W., Li, H., & Budding-Polo Ballinas, M. (2022). Investing in Urban Blue–Green Infrastructure—Assessing the Costs and Benefits of Stormwater Management in a Peri-Urban Catchment in Oslo, Norway. Sustainability, 14(3), 1934. https://doi.org/10.3390/su14031934