Article

A Comprehensive Risk-Assessment Method for Prefabricated Buildings Using EPC: A Case Study from China

1
Research Center for Digitalized Construction and Knowledge Engineering, Institute of Engineering Management, School of Mechanics and Civil Engineering, China University of Mining and Technology, Xuzhou 221000, China
2
School of Architectural Engineering, Guangzhou Institute of Science and Technology, Guangzhou 510000, China
*
Author to whom correspondence should be addressed.
Sustainability 2022, 14(3), 1910; https://doi.org/10.3390/su14031910
Submission received: 17 December 2021 / Revised: 2 February 2022 / Accepted: 3 February 2022 / Published: 8 February 2022

Abstract

:
The prefabricated building has been proven to be an effective approach for enhancing the sustainability of the construction industry. In recent years, the Chinese government has promulgated a series of policy documents to promote the advancement of prefabricated buildings. However, in practice, there are still numerous problems related to design, production, and construction, as well as the coordination between various stages. This study aimed to fill the gap in research regarding the application of EPC (Engineering–Procurement–Construction) in prefabricated buildings in China. As most of the risks of projects are borne by general contractors in the EPC mode, the risks faced by prefabricated building projects using EPC were systematically analyzed in this study from the perspective of general contractors. After learning about the risks of assembly construction in different countries, this study conducted a questionnaire survey to establish an evaluation system, and a comprehensive evaluation method was put forward to determine the weight of each indicator. Furthermore, an evaluation model based on grey–fuzzy theory was developed in this study, which was applied to a real project in Nanjing, China. The results indicated the applicability of the established evaluation system and model and determined the risk level of the project. Additionally, in this case study, it was found that construction and design were the major factors determining the risk level of the project. This study contributes to the body of knowledge regarding the integration of EPC in prefabricated buildings, which has practical application value for general contractors when conducting risk assessments.

1. Introduction

Prefabricated building, also known as industrialized or modular building, has a wide range of connotations. On the one hand, it is an innovative method to move part of the work from a construction site to a factory [1,2]. The components are mass-produced and assembled on-site to form the final buildings. On the other hand, the assembly-built approach represents the integrated capabilities of the construction supply chain [3,4]. Compared with traditional cast-in-place buildings, it is universally acknowledged that prefabricated buildings can improve production efficiency, shorten project duration, and reduce energy consumption [2,5,6]. As one of the main pillar industries in China, the construction industry has been growing rapidly in recent years [7], while also posing great challenges such as overwhelming amounts of waste generation and increasing resource consumption [8,9]. As a result, prefabricated buildings have been considered a sustainable practice in the construction industry [10], which can benefit China by improving environmental sustainability, achieving higher quality, and enhancing construction innovation [11]. Since 2016, national and local governments have successively introduced policies to promote their advancement. For example, the Chinese government has required that the proportion of prefabricated buildings in new construction be increased to 30% by 2026 [12]. However, so far, it is striking to note that the proportion in existing building is still comparatively low, only about 5% [13].
In recent years, a growing number of practitioners in China’s construction industry have recommended integrating design and construction (e.g., DB) in projects [14]. In 2016, the “Several Opinions on Further Strengthening the Management of Urban Planning and Construction” issued by the State Council set important goals for promoting prefabricated buildings. It emphasized that the EPC mode should be the focus of construction project management, which provided a new direction for the innovation of prefabricated buildings [15]. EPC (Engineering–Procurement–Construction) is an internationally accepted construction project organization and implementation model [16]. The general contractor is responsible for the design, procurement, and construction of the whole project, and finally delivers it to the developer in good condition [17]. In other words, the general contractor has almost total management of a project. Different from other contracting modes, the EPC mode can effectively promote modernization, specialization, and integration, which can solve problems of cohesion difficulties (e.g., different stages, specialties, technology, and management) in the construction industry [16,17,18]. However, the supply chain involves multiple stages in prefabricated buildings, including design, production, transportation, and hoisting; any disruption that occurs at the upper part of the supply chain affects subsequent stages [19]. These construction activities form a complex system in the precast supply chain, leading to the need for a systematic management mode. Accordingly, the adoption of the EPC mode is a targeted way to solve the obstacles in the development process of prefabricated buildings. In this way, the manufacturing and assembly processes can be systematically considered from the design stage. Furthermore, the organization of general contract management guarantees the integration of prefabricated building design, production, and construction, which is conducive to the realization of lean construction [14,15]. Therefore, for prefabricated buildings, the application of the EPC mode is not only a national policy requirement but also an inevitable measure for them to achieve high-quality development in the future.
As a new construction method, prefabricated buildings have brought forth opportunities and challenges to the construction industry. As of today, the development of prefabricated buildings in China is still in its infancy [20]. A few barriers remain in promoting prefabricated buildings in China’s architecture, engineering, and construction (AEC) industry, such as incomplete policies and regulations, immature market cultivation, an imperfect industrial chain, and inadequate construction technology [21]. A review of the literature on prefabricated buildings in recent years has revealed several gaps, including: (1) existing studies have targeted the risks of prefabricated buildings in China and rarely linked them to the EPC mode; (2) the professional understanding of the risk perception of the EPC mode has been insufficient, despite many risks having been identified in previous studies; and (3) there have been limited assessment methods for prefabricated buildings using EPC.
Given these research gaps, this study aimed to investigate the risk perception of professionals regarding prefabricated buildings when adopting EPC in China, after referring to the situation in other countries (this study focuses on the prefabricated concrete structure, which is a very popular structural form in the development of prefabricated buildings in China). The main objectives of this study were: (1) to identify major risks involved in the adoption of EPC in prefabricated buildings; (2) to establish a relatively complete prefabricated building risk-assessment system for the EPC mode by obtaining the views of Chinese practitioners; (3) to construct a comprehensive risk-evaluation method with grey system theory. Moreover, the method was applied to a real project to conduct a risk assessment and determine its risk level. The risk-evaluation system applicable to prefabricated buildings using EPC that was established in this study can be used as a checklist for stakeholders to identify potential risks. Using the comprehensive evaluation method, the impact of different risks can be calculated, which fills a significant gap in the body of knowledge regarding risk assessment. Such a method has a practical application value, in that it can help general contractors focus on critical risks that may be encountered in actual assembly projects. Moreover, the findings may be useful for general contractors to seek ways to hedge the risks of prefabricated buildings under the EPC mode in both developed and developing countries.

2. Literature Review

2.1. Implementation of Prefabricated Buildings in China

The earliest research on assembly technology in China can be traced back to the 1950s, when a large number of prefabricated concrete frames were formed [22]. By the 1980s, the application of prefabricated concrete buildings reached its peak, and industrial construction models integrating design, production, and installation were implemented in many places [22]. However, due to limitations and deficiencies in their function and physical properties, they were gradually replaced by cast-in-place buildings in the mid-1990s. In recent years, the Chinese government has put forward modernized, productive, and environmentally sustainable concepts in its new urbanization movement [4]. In 2016, in addition to determining the proportion of prefabricated buildings in new construction in the following ten years, the State Council also required that their implementation should be accelerated according to the conditions of the local area (key promotion areas—cities in the Yangtze River Delta; active promotion areas—cities with a permanent population of more than 3 million; and encouraged promotion areas—other cities). For example, a pilot residential construction project has reached a prefabrication rate of between 50% and 70% in Shanghai [23]. Although the government has taken active measures to promote it, the development of prefabricated buildings in China is still in its infancy, as indicated by Hong et al. [20]. According to Jiang et al. [1,2], there are obstacles to the adoption of prefabricated buildings in China, for example, the lack of codes and standards, as well as incomplete policies and regulations.

2.2. Implementation of EPC in Prefabricated Buildings

Assembly construction is a complicated engineering system, which involves many participants (e.g., developer, designer, manufacturer, and contractor) from the initial design of the components to final installation [24]. There is no doubt that multistakeholder interaction will increase the difficulties of management. Besides, adopting assembly construction is more prone to the problem of the information transmission chain being too long to share enough information among multiple project parties [5]. Therefore, integrated project delivery (e.g., EPC) could be a potential approach to overcome these barriers in fragmented construction [25].
In contrast with the traditional project management mode, EPC is suggested by many scholars as a managerial strategy that could enhance prefabricated building practice [14,15]. It is an effective way to promote full-process management and improve the multistakeholder collaboration in prefabricated buildings [26]. Furthermore, Jin et al. [27] posited that this mode could integrate the upstream and downstream labor divisions and connect the project’s whole construction process into a complete chain. By adopting the EPC mode in an assembly project, the developer only focuses on achieving the intended goals. Functional planning, delivery standards, design, manufacture, procurement, assembly, and other tasks are all completed by the EPC general contractor, indicating that this method can provide systematic support to prefabricated building implementation [27,28]. The general contractor takes on the leading role in the design and comprehensively coordinates the manufacture and assembly as it pertains to the overall objective of the project [29], which can avoid the split construction of prefabricated buildings.

2.3. Risks Involved in Prefabricated Buildings

With the continuous development of prefabricated buildings, the barriers encountered in their implementation have also attracted extensive attention. More and more scholars have carried out research on prefabricated buildings in both developed and developing countries. For example, Razkenari et al. [30] provided an understanding of the development of the offsite construction industry in the United States. They used a SWOT framework to analyze the strengths and weaknesses of adopting assembly construction as well as the opportunities and threats. Nadim and Goulding [31] argued that the European construction industry’s reluctance to adopt the assembly method is largely due to past unsuccessful experiences. In several developing countries, 30 constraints on prefabricated buildings were considered by interviewing 75 construction practitioners in the Cambodian context (including six categories: methodology, cost, culture, skill, supply chain, and site operations) [32]. Rahimian et al. [33] elaborated on offsite construction in Nigeria and concluded that the implementation rate in the local area was still quite low. They pointed out that this had been affected by a lot of risks, such as negative local perceptions of prefabricated buildings, resistance, and insufficient technical capacity.
After observing the current development of prefabricated buildings in other countries, a number of studies have been launched to reveal the problems facing the promotion of prefabricated buildings in China. Jiang et al. [2] performed a SWOT analysis to gain a deeper understanding of the status quo of prefabricated buildings in China by conducting a detailed literature review and semistructured interviews. Similarly, Jiang et al. [1] also laid emphasis on the main factors hindering the development of prefabricated buildings in China. They all generically analyzed the risks of implementing prefabricated buildings in China. Additionally, several studies have looked at the risks in more detail. According to previous research works, prefabricated buildings could incur a total additional cost of about 300–500 RMB per square meter in the design and prefabrication stage compared to conventional construction methods [22,34]. Hence, the higher initial investment is one of the most noticeable risks for prefabricated buildings [20,34]. As Jiang et al. [1,2] argued, the adoption of prefab constructions is a significant revolution in the construction industry, which has an impact on technology, management, and organization [3,4,5]. Currently, there are only a few practitioners with professional knowledge among participants. The lack of highly skilled personnel has become a bottleneck restricting the spread of prefabricated buildings in China [35,36,37]. In addition, the traditional project process has taken center stage in the construction industry, which is unsuitable for constructing prefabricated buildings. Gan et al. [3,4] suggested that stakeholder collaboration is one of the key risks of promoting prefabricated building development. Xue et al. [6] attempted to explore the relationship between stakeholder cooperative management and the cost performance of prefabricated buildings. Stakeholder collaborative management has a positive effect on cost performance, which is, in turn, the driving force of stakeholder cooperation [3,4,5,6]. Table 1 shows most (though not all) of the risks involved in prefabricated buildings.
Accordingly, it is easy to ascertain the current condition of China’s prefabricated buildings by referring to the literature. Like other developing countries, the government still plays a pivotal role in the whole construction process, and taking any action may bring uncertainties to projects [38,39]. Due to the lack of expertise and experience, and the huge investment required, participants are unable to inspire enthusiasm for the prefabrication method and they prefer to adopt the traditional cast-in-place method to reduce costs [20,21]. Meanwhile, assembly projects have not formed a complete construction supply chain because of these aforementioned factors, and stakeholders are separated from each other thanks to difficulties achieving adequate communication. In conclusion, the risks of the development of China’s prefabricated buildings mainly center on policy, the market, and enterprise capacity.

2.4. Risks Encountered in EPC
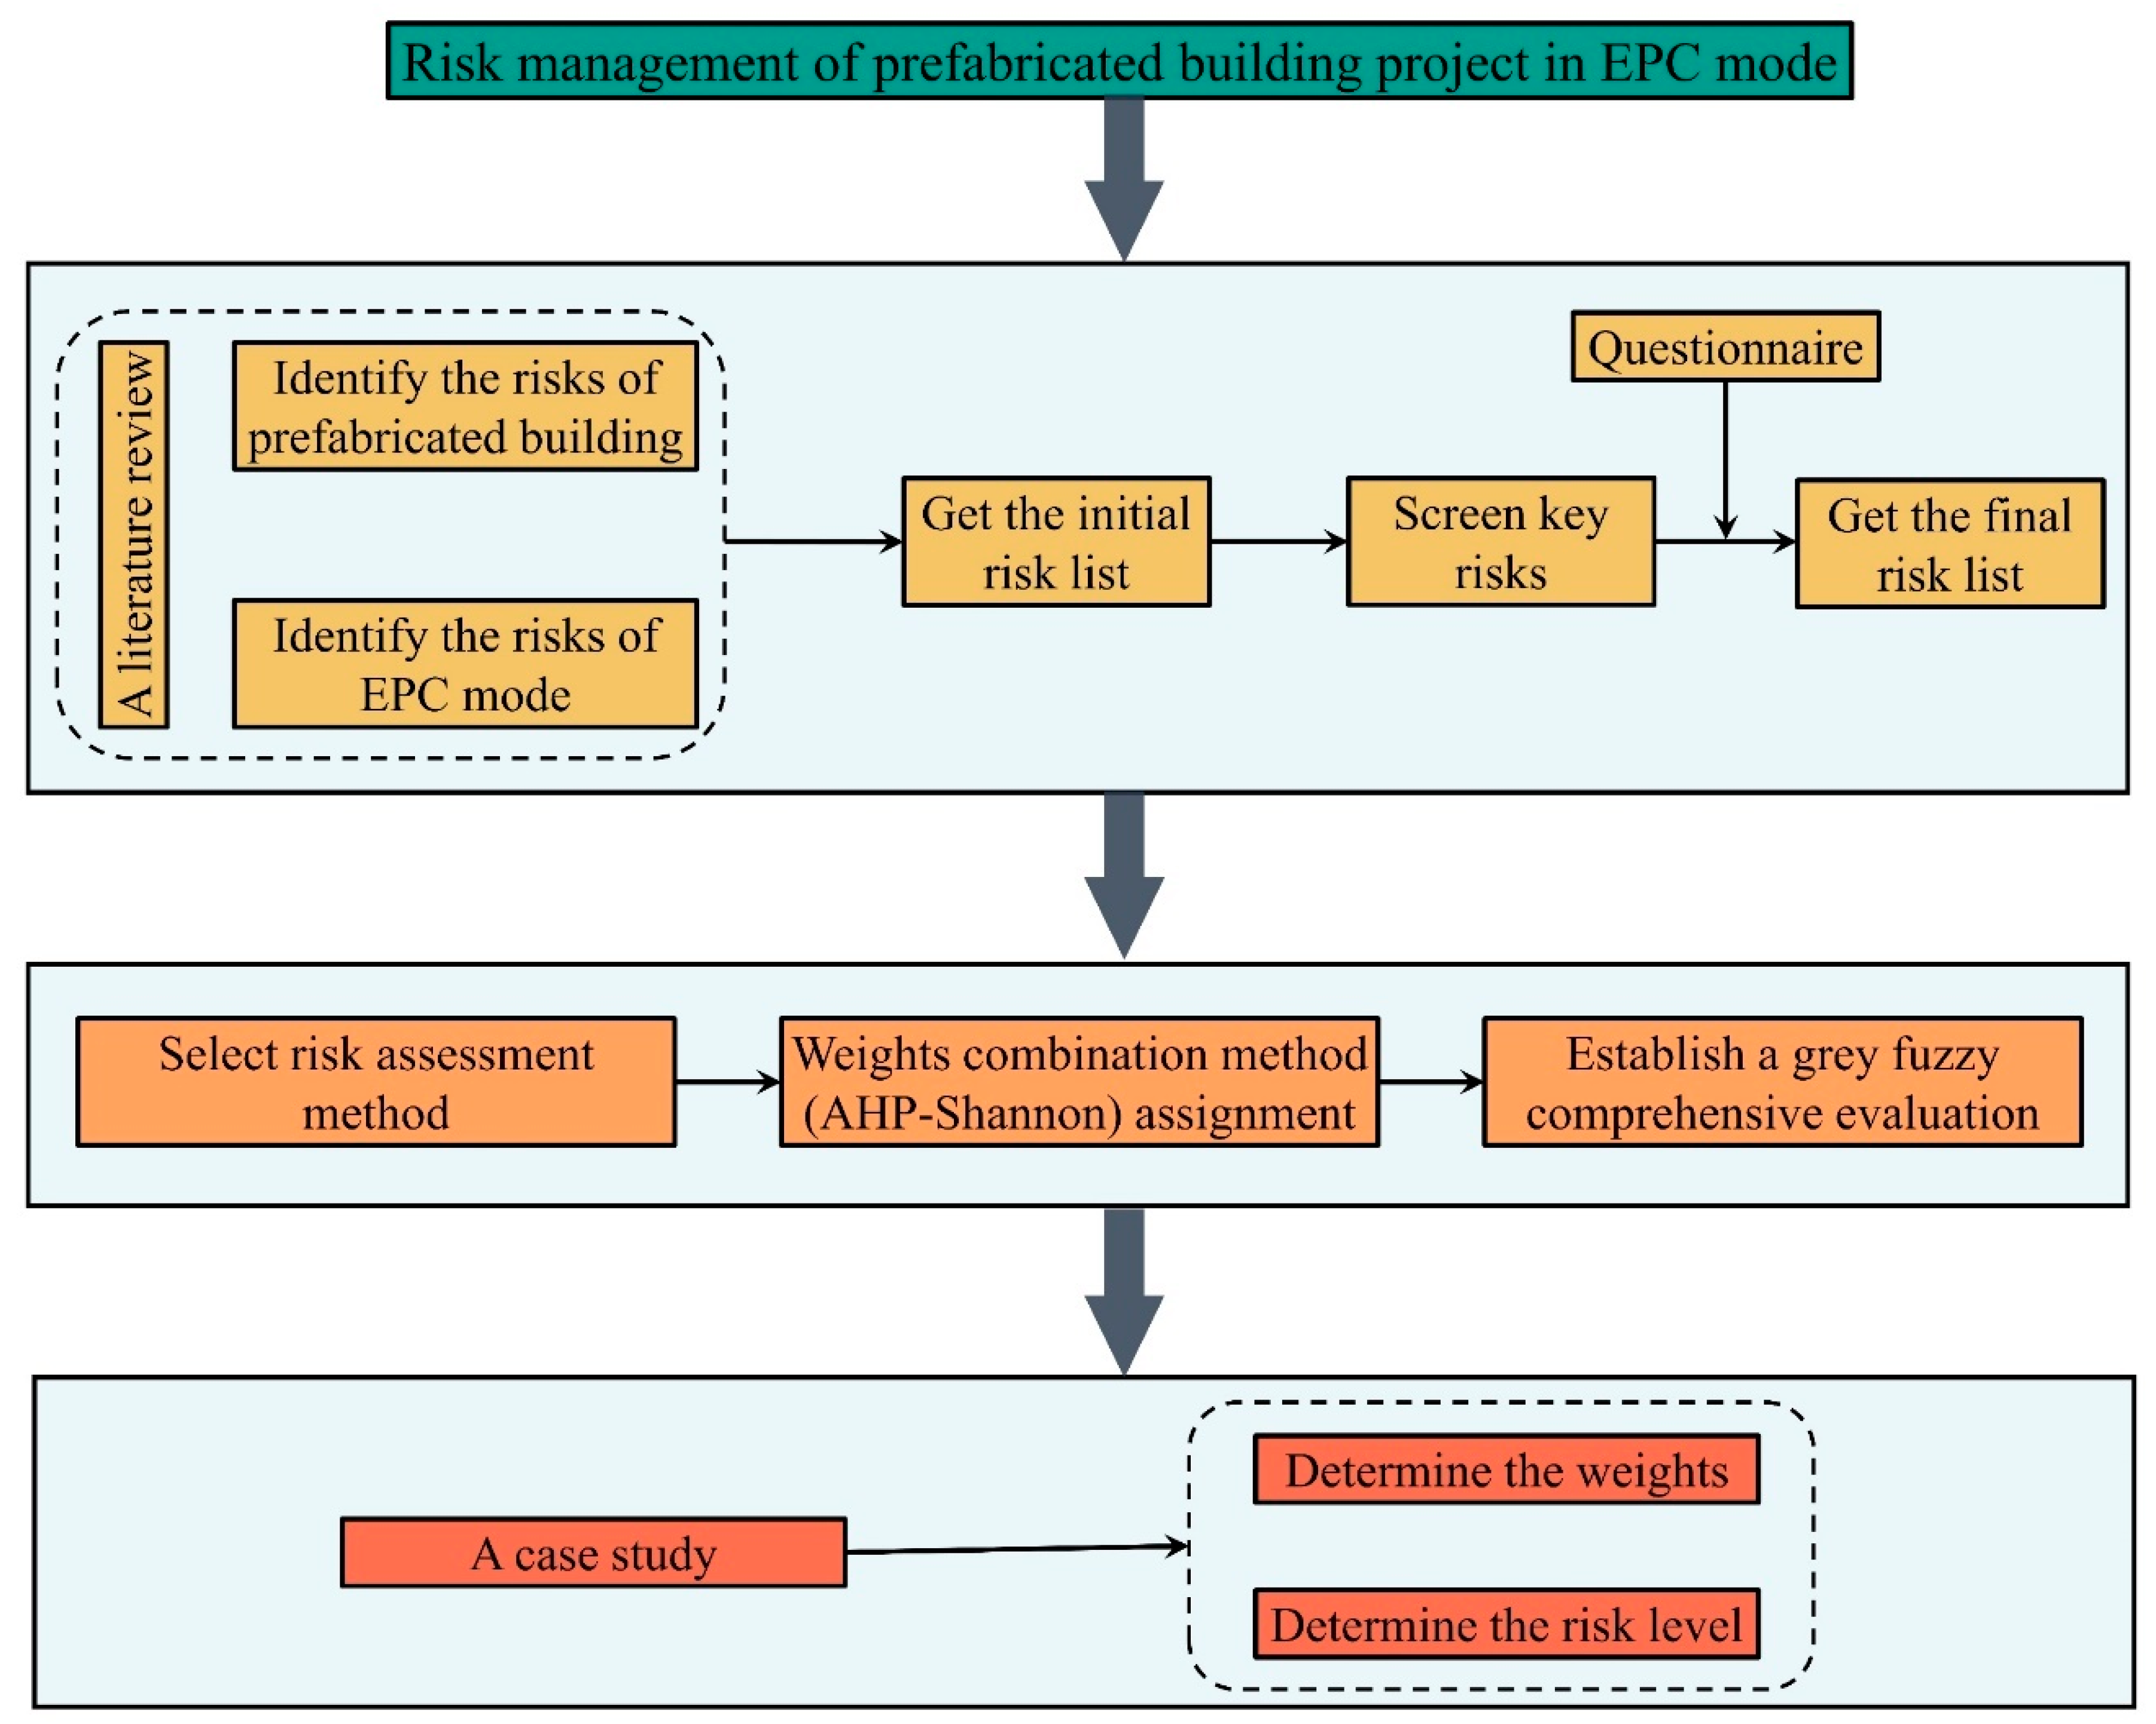
EPC is a general contracting mode developed in practice, which is suitable for large industrial and infrastructure projects [40]. Despite the potential benefits of adopting EPC in construction projects, such as high investment efficiency, low total cost, and guaranteed project duration [41,42,43], its potential risks (e.g., large investment scale, high proportion of procurement cost, time overrun, and greater workload in the early stage) should also be noticed.
Compared with the traditional contract mode, where the owners provide the design and the contractors carry out the construction activities alone, the general contractor under the EPC mode undertakes almost all the responsibilities, from the design and procurement to the construction [44,45]. In terms of risks, the number borne by the general contractor increases significantly. Pekings [46] and Hale et al. [18] pointed out that EPC projects typically encounter risks in the course of their evaluation, financing, design, procurement, construction, and the interfaces of these components. As there are multiple subcontractors in EPC projects, Pal et al. [47] investigated how various relationships with subcontractors can affect project performance. They believed that cooperation, trust, and continuous improvement across different relationships are critical factors that can decide the success of EPC projects to a great extent.
The adoption of the EPC contracting mode in China came later than in some developed countries. Moreover, Chinese enterprises lack general EPC project contracting experience and risk-control systems in theory and practice. On the basis of the literature, Gao and Wang [48] determined the main risks faced by general contractors through case analysis and proposed specific prevention measures for the four stages of bidding, design, procurement, and construction. Additionally, interface management (IM) has appeared as an effective strategy that can promote communication and coordination between diverse parties in EPC projects [42,49,50]. Given the complexity and uncertainty, Yang et al. [43] conducted a path analysis using data from the construction industry. The results indicate that partnering both systems can directly enable IM to improve project performance and exert a positive influence on risk management in EPC projects. Moreover, previous studies have shown that about 80 to 90 percent of construction projects face delays [51], and those adopting EPC models are usually more complex. Therefore, delays are one of the most important risks that EPC projects must consider. Accordingly, the risks of EPC projects are displayed in Table 2.
In fact, as an international management mode, EPC projects involve more risks than those mentioned above. The EPC mode transfers most of the risks in the project from the owner to the general contractor [52]. In terms of risk management, the general contractor mainly undertakes risks at different levels. Therefore, for contractors, information technology should be applied to establish a management system to realize dynamic risk management based on the database.

3. Methodology

As Fellows and Liu [53] pointed out, triangulated studies involve two or more research techniques. For example, the combination of qualitative and quantitative approaches to study a topic can produce persuasive insights and results. Therefore, this study adopted a combination of several methods. The methodology framework for the study is shown in Figure 1.
  • Task 1: Ascertain the risks of prefabricated building with EPC. Firstly, risk indicators were identified based on relevant literature. Secondly, questionnaires were sent to personnel with engineering-related experience to optimize these indicators. The details of Task 1 are presented in Section 4.1.
  • Task 2: Establish a comprehensive risk-assessment method (AHP–EWM). Firstly, this study illustrated a method for determining weights, which considered both subjective (AHP) and objective (entropy) weight information. Secondly, a risk-assessment method was constructed based on the principles of grey–fuzzy comprehensive evaluation. Section 4.2 demonstrates the details of Task 2.
  • Task 3: Based on the risk-assessment method obtained in Task 2, this study determined the combined weight of the indicator in Task 1 in a real project and used grey–fuzzy theory to assess its risk level. The details of Task 3 are presented in Section 5.

4. Implementation Risk Assessment

4.1. Risk-Assessment System

The risk-assessment system is a systematic group composed of many interrelated indicators that can help EPC project general contractors gain a clear insight into different risks. With the available information provided by the system, general contractors tend to make more scientific decisions. In addition, the risks of prefabricated buildings using EPC are diverse and complex, making it hard to establish an indicator system. Whether the risk-assessment system can be established reasonably and accurately plays a significant role in the evaluation results. In light of this, before creating the system, a relatively rigorous thought process was required in this study. Figure 2 illustrates a holonomic plan for setting up this risk index system. Based on an exhaustive review of the literature, an initial risk list was developed in this study. Next, through the investigation of front-line practitioners and data analysis, the initial risk list was revised to obtain a more reasonable risk-evaluation system.

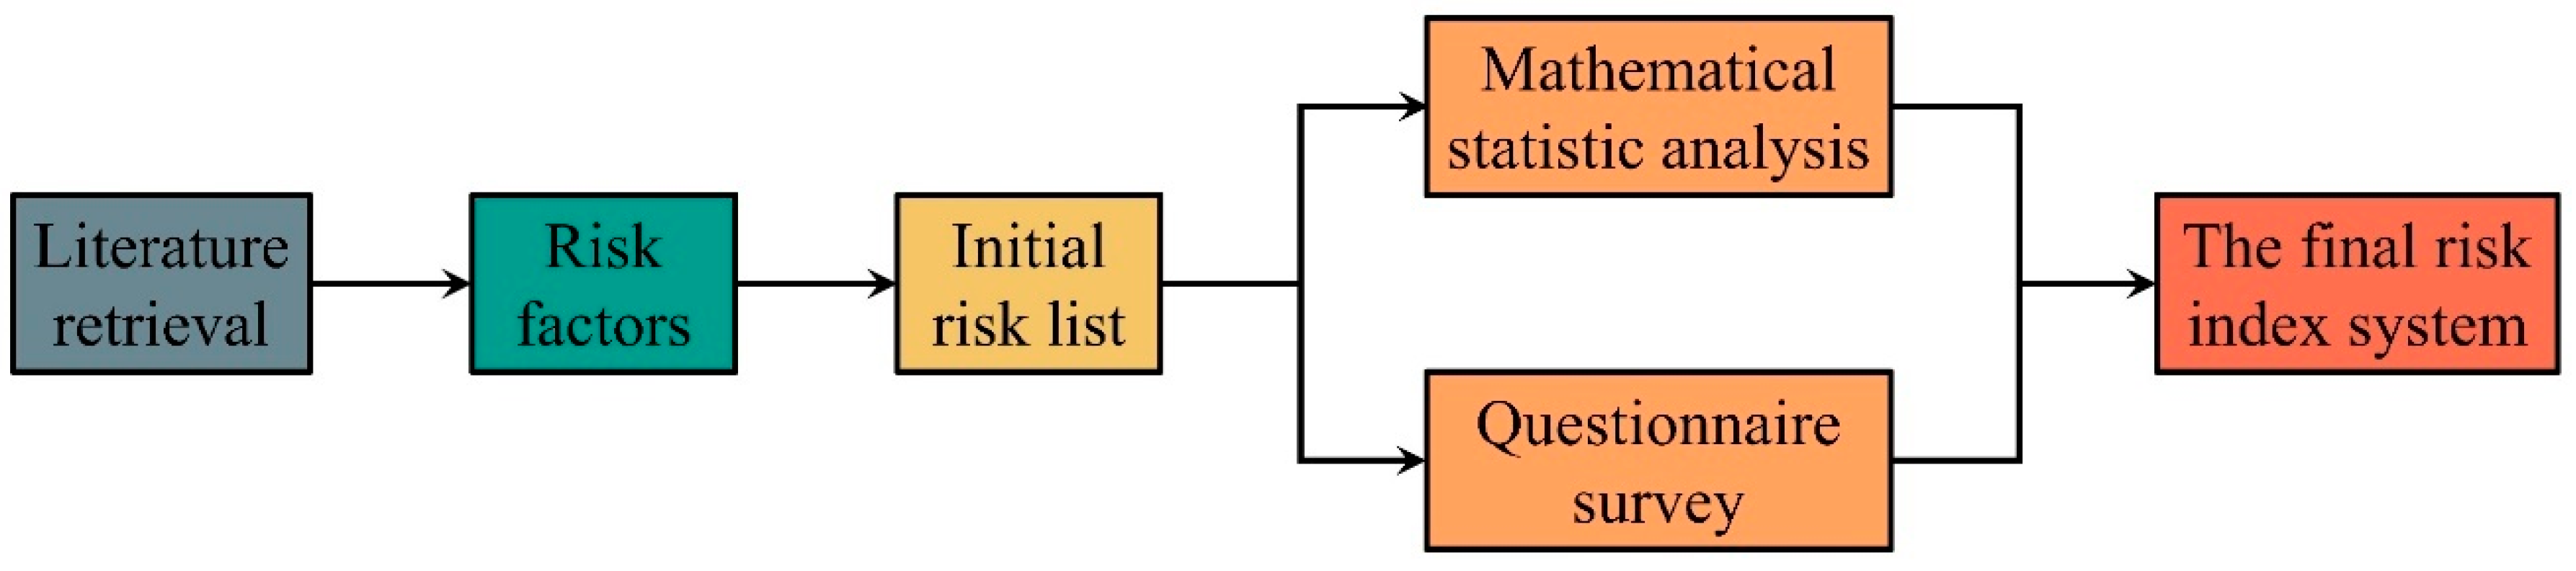
4.1.1. Risk Identification for Prefabricated Buildings with EPC

The risks involved in prefabricated buildings with EPC are of a dual nature. Hence, during risk identification, not only the project risks of prefabricated buildings but also the special attributes of the EPC system should be considered.
Based on the abovementioned literature, there are few studies directly related to the risks of prefabricated buildings with EPC. Two types of literature were mainly referred to in this study to ensure quality: the first concerned EPC general contractors, while the second was related to prefabricated buildings. Keywords such as “EPC”, “Prefabricated”, “Risk”, “Factor”, and “General contractor” were selected from the relevant literature published in the “Web of Science”, “Scopus”, and “EI” resource databases. In order to limit the search criteria, a 10-year publication window was set. After looking up these references, the identified risks were extracted. Because of the varying risk classification standards of each piece of literature, some risks were expressed differently but referred to the same concepts. For example, “insufficient strength of precast components” and “dimensional deviation of precast components” were merged into “quality defect of precast components”. Therefore, these risks needed to be further sorted out. After addressing this problem, a total of 30 related risk indicators were obtained, as shown in Table 3.

4.1.2. Finalization of Risks for Prefabricated Buildings with EPC

After the literature analysis to identify the risk indicators, it was found that the number was still quite large. Theoretically, any risk that can cause a failure to achieve some, but not all, of the desired objectives is meaningful. If all these risks are taken into consideration, the assessment process will become relatively complicated, affecting the accuracy of evaluation results to a certain extent. Furthermore, with its continuous advancement, some risks identified in the literature may come to affect prefabricated buildings. An approach to sifting the key risks from the initial list is therefore needed to ensure the final assessment system is more scientific and persuasive. In this study, questionnaires were used to consult front-line engineers who could authentically understand the current development difficulties and help to achieve the optimization of these indicators.
The questionnaire consisted of two parts: the first part was conducted to collect basic information about respondents, including their organizational background, work experience, and project participation; while the other part included items that were composed of each indicator obtained above. All perceptual items were assessed on five-point Likert scales ranging from one (strongly disagree) to five (strongly agree).
These questionnaires were mainly distributed online, with a few coming from field surveys. The participants were randomly chosen from the AEC (Architecture, Engineering, and Construction) industry located in the Yangtze Delta in China. This region is a pioneering area in the advancement of prefabricated buildings. In light of this, the sample could well capture the status quo of China’s assembly construction. The total number of questionnaires distributed was 159, and 145 survey responses were gathered, with a recovery rate of 91.19%. Before the collected data could be processed, a preliminary test needed to be carried out on them. Finally, 137 valid questionnaires were obtained, after deleting some invalid questionnaires (e.g., short answer time, all items with the same option, or no work and project experience). Figure 3 presents the basic information of the respondents.
Reliability is an important issue in social investigations. It is used to test the stability of the measurement process, although the reliability itself is not affected by the measurement results (whether correct or not) [61]. Based on previous studies, Cronbach’s α coefficient is usually considered as the reliability index. Its value varies from 0 to 1, and the closer it gets to 1, the more reliable the data [62]. Table 4 shows the relationship between reliability and Cronbach’s α coefficient. On top of this, it is generally believed that a value greater than 0.70 should be set as the evaluation criterion for the reliability of listed items [62]. In this study, the data collected from questionnaires was input into SPSS 25.0 for the reliability test. The Cronbach’s α value of the original data collected from the questionnaires was 0.774 (over 0.70), which proved that the 137 valid questionnaires were reasonable and could be used for subsequent analysis.
SPSS 25.0 software was used for the mathematical statistical analysis of the collected data. In this study, the mean value μ, standard deviation σ, key index R, and discrete value δ were calculated, which reflected the average level, degree of variation, importance of each indicator, and the consistency of the respondents’ opinions, respectively. Bajjou and Chafi [63] believed that the larger the σ, the greater the variation in the indicator score. The discrete value δ is the ratio of standard deviation to mean value. The smaller the value, the lower the dispersion of the score, indicating that the responses are more concentrated around a point. Table 5 exhibits the statistical results of the questionnaire survey.
As can be seen from Table 5, among the 30 indicators, the discrete values of three indicators were greater than 0.25: tax rate fluctuations, inadequacy of component purchasing staff, and supplier designated by developers. Compared with other indicators, these had a greater dispersion, meaning that the respondents had different views on them. Moreover, as for the key index, these indicators were lower than the others, all three being below 75. According to Bajjou and Chafi [63] and Liu et al. [61], the importance of these three indicators was considered to be relatively small, and they could be excluded from the initial risk list. In addition, to make the evaluation system clearer, the remaining indicators were classified based on their attributes. Ultimately, a prefabricated building risk-assessment system for the EPC method was finalized in this study, including 7 first-level and 27 second-level indicators, as shown in Table 6.

4.2. Risk-Assessment Method

After identifying the risks, risk assessment is a process that can quantify an exact figure to describe the impact of each indicator [64]. The widely used mainstream method is still based on the AHP. Since AHP is a typical multicriteria decision-making method, the traditional AHP (especially the expert scoring table) has an obvious level of subjectivity regarding factor weighting, which is likely to cause deviations in the calculation results [65]. As a matter of fact, some assessment methods and techniques vary in sophistication and capabilities [66,67]. It is necessary to select a method suitable for the characteristics of the evaluated object in accordance with the requirements of the tasks. The risk indicators of prefabricated buildings using EPC are all conceptual and difficult study quantitatively. However, both fuzzy mathematics and grey system theory (GST) can solve problems related to these uncertainties [68]. Fuzzy evaluation can be used to mathematically quantify conditions for which it is not easy to demarcate a border, while GST is a systematic method that focuses on how to deal with missing data and poor information [69]. Consequently, a comprehensive risk-assessment method combining GST and fuzzy evaluation was proposed in this study. The membership matrix was constructed based on the grey number, grey number equation, and grey number matrix in the grey system, and then the fuzzy algorithm was used to carry out a multilevel evaluation, so as to solve the ambiguity of the evaluation criteria and the prejudices among the evaluators and make the results more scientific and reasonable.

4.2.1. AHP–Entropy Optimized Combination Weight

Analytic Hierarchy Process (AHP)
The AHP involves summarizing and sorting out factors related to decision-making according to a certain decomposition form [70]. It can hierarchize a complex system and calculate a factor’s weight by hierarchical analysis and intercomparison [64], which provides assistance to decision-makers when trying to determine the best option. The specific steps of the AHP method are as follows:
  • Step 1: Build a hierarchical model.
In order to reflect the relationships between the indicators, the evaluation system is decomposed into a three-level structural model with a target layer, criterion layer, and factor layer.
  • Step 2: Construct a judgment matrix.
The relevant experts are invited to provide scores based on the 1–9 scale method (1—equally important; 9—absolutely more important), starting from the first level of the hierarchical structure model. The judgment matrix P is constructed by the pair comparison of the indicators of a certain level.
  • Step 3: Calculate the relative importance.
The weight vector w 1 of each judgment matrix is calculated according to the square root method and is normalized to obtain the subjective weight vector of each indicator. The calculation formulas can be attained by Equations (1)–(3).
m i = j = 1 n a i j , ( i = 1 , 2 , , n )
w 1 = m i n
w 1 = w 1 i = 1 n w 1
  • Step 4: Perform a consistency check.
Next, the maximum eigenvalue is calculated by Equation (4) and is used to carry out the consistency check via Equations (5) and (6).
λ max = i = 1 n ( P × W ) i n w 1
C R = C I R I
C I = ( λ max n ) / ( n 1 )
where:
C I is the consistency index and R I is the random consistency index, whose value has a certain corresponding relationship with the rank of the judgment matrix (Table 7). In addition, when C R < 0.10 , the judgment matrix is considered acceptable; otherwise, it should be reassigned to make corrections until it passes the consistency test [71].
Entropy weight method
The concept of “entropy” originated from thermodynamics and was later introduced into information technology to represent the uncertainty surrounding a system [72]. The entropy weight is an objective assignment method. The smaller the entropy value of an indicator, the greater the dispersion degree and the more information it provides [73]. The specific steps of the entropy weight method (EWM) are as follows:
  • Step 1: Normalize the judgment matrix and obtain the standard matrix P.
P = ( p i j ) n × n
p i j = k i j i = 1 n k i j
  • Step 2: Calculate information entropy.
e j = 1 ln n i = 1 n p i j ln p i j ( i , j = 1 , 2 , 3 , , n )
where:
e j (0 ≤ e j ≤ 1) is the value of the j t h indicator and 1 ln n is the information entropy coefficient.
  • Step 3: Calculate the indicator information entropy weight w 2 .
w 2 = 1 e j n j = 1 n e j
Combination weight method
In order to ensure that the weights of each indicator took into account both the subjective cognition of the evaluators and the information of the indicators, this study optimized the weights obtained by EWM and AHP, respectively, to obtain the combined weights of each indicator, as shown in Equation (11).
w = w 1 w 2 w 1 w 2

4.2.2. Multilevel Grey Evaluation Method

Establishment of a comprehensive evaluation matrix
The indicators finalized above form a more scientific and thorough risk-evaluation system that was applied to prefabricated buildings using EPC to determine the risk level. The target layer of the system in this study is represented by X , including first-level X i ( i = 1 , 2 , 3 , , m ) and second-level X i j ( i = 1 , 2 , 3 , , m ; j = 1 , 2 , 3 , , n ) .
The score corresponding to each indicator could be obtained by the expert scoring method. Furthermore, the evaluation matrix was derived based on their scores:
D = [ d 11 1 d 11 2 d 11 p d 12 1 d 12 2 d 12 p d i j 1 d i j 2 d i j p ]
where:
d i j k is an expert’s score for an indicator.
Determination of grey class and whitening weight functions
The following equations assume that there are g grey groups and that f 1 ( x ) , f 2 ( x ) , f 3 ( x ) , , f g ( x ) are the corresponding whitening weight functions. The specific methods for determining the grade interval of the evaluation program, which can define the whitening weight function of each grey group, are as follows.
Upper level, grey number [ d 1 , ) , whitening weight function:
f a ( d i j k ) = { d i j k / d 1 d i j k [ 0 , d 1 ] 1 d i j k [ d 1 , ] 0 d i j k [ 0 , ]
Middle level, grey number [ 0 , d 2 , 2 d 2 ] , whitening weight function:
f b ( d i j k ) = { d i j k / d 2 d i j k [ 0 , d 2 ] 2 d i j k / d 2 d i j k ( d 2 , 2 d 2 ] 0 d i j k [ 0 , 2 d 2 ]
Lower level, grey number [ 0 , d 3 , 2 d 3 ] , whitening weight function:
f c ( d i j k ) = { 1 d i j k [ 0 , d 3 ] 2 d i j k / d 3 d i j k ( d 3 , 2 d 3 ] 0 d i j k [ 0 , 2 d 3 ]
Calculation of the grey evaluation weight and comprehensive evaluation value
For X i j , the scoring results are d i j 1 , d i j 2 , d i j 3 , , d i j p , and the grey evaluation coefficient of each indicator belonging to the e t h class can be obtained by Equation (15). Next, Equation (16) can further deduce the total grey evaluation coefficient.
x i j e = k = 1 p f e ( d i j k )
x i j = e = 1 g x i j e
Based on Equations (15) and (16), the grey evaluation weight can be obtained, as shown in Equation (17).
r i j e = x i j e x i j
As a result, the grey evaluation weight matrix of X i can be attained.
R i = [ r i 1 r i 2 r i n ] = [ r i 1 1 r i 1 2 r i 1 g r i 2 1 r i 2 2 r i 2 g r i n 1 r i n 2 r i n g ]
The weight vector of X i is W i = ( W i 1 , W i 2 , W i 3 , , W i n ) , and the grey comprehensive evaluation weight vector of X i is:
Z i = W i R i = ( z i 1 , z i 2 , z i 3 , , z i g )
Simultaneously, the weight vector of X is W = ( w 1 , w 2 , w 3 , , w m ) , and the grey comprehensive evaluation weight vector of X is:
B = W Z = ( b 1 , b 2 , b 3 , , b g )
Within this, the matrix Z is composed of Z 1 , Z 2 , Z 3 , , Z m .
Z = [ Z 1 Z 2 Z m ] = [ z 11 z 12 z 1 g z 21 z 22 z 2 g z m 1 z m 2 z m g ]
Through the above steps, the comprehensive evaluation weight vector (B) can be obtained. In essence, this is a matrix describing the grey degree of risk. In order to further determine the comprehensive evaluation value of a project risk, the single value calculation of vector B was also needed in the last step, based on different grey classes, which could produce the assignment vector C = ( 5 , 4 , 3 , 2 , 1 ) . Accordingly, the grey comprehensive evaluation value (the risk evaluation value) is calculated by Equation (20):
F = B C T

5. Case Study

5.1. Background Information

In this study, a new middle school project was selected to illustrate the application of the comprehensive assessment method. This project was located in Nanjing, China, and was funded by Nanjing North Park Investment Property Co., Ltd. The total project cost was 380 million RMB and the total floor area was more than 50,000 m2. This project adopted the EPC management mode, with China Construction Eighth Bureau No.3 Construction Co., Ltd. as the general contractor, and required an assembly rate of over 40% (prefabricated concrete structure). The ground buildings were divided into three parts, teaching building, complex building, and student canteen, and the teaching building was made up of four independent buildings connected as a whole, for a total of six buildings. These buildings all had a frame structure. Both onsite and offsite construction methods were applied in this project. The standard floors were constructed using assembly structures, including precast beams, stairs, slabs, and non-load-bearing external walls. The basements and nonstandard floors still adopted traditional construction technology.
The general contractor was affiliated with China State Construction Engineering Corporation Limited, which is the largest contractor in China’s construction industry. The contract scope in this project included the design (conceptual design, shop drawing design, and in-depth design of components); construction; and procurement (materials, mechanical equipment, and tools). Since the EPC contractor undertook almost all of the tasks with a fixed price, it was a great challenge for them to take all or most of the risks.

5.2. Project Implementation Risk Assessment

Due to the lack of databases related to prefabricated buildings, the data for this case was collected by interviewing key members of the project. The selection criteria for the interviewees stated that they should have a senior position or play an important role in the project. A total of 12 managers or engineers (two groups) from the design, procurement, and construction divisions were invited to complete the risk assessment.
Prior to determining the risk level of the project, one group was interviewed to score the indicators in the risk-assessment system proposed above. The scale for scoring (Table 8) is widely used by scholars to study project management [71,74]. After obtaining a score for each indicator, their weights could be calculated based on Section 4.2. The scores of this group are listed in the Appendix A and Appendix B.
Through the equations in Section 4 above, the risk level of the selected case could be determined. Due to the limited space, the detailed calculation procedure is not described here but is shown in Appendix B.

6. Results and Discussion

The procedure outlined in the above section allowed us to calculate the risk level of the project based on the comprehensive evaluation method. Table 9 summarizes the findings of this study. The evaluation value was 3.3203, suggesting that the project risk was at a medium level. Furthermore, the AHP–EWM approach was adopted to assess and rank the weights of different indicators regarding the final performance of this project. As a result, the ranking of the primary indicators in the evaluation system was as follows: construction (0.4814); design (0.2298); procurement (0.0885); management (0.0864); nature (0.0570); and policy (0.0251). These results could help general contractors to identify critical factors that might incur heavy losses for a project, and thus they should pay more attention to these factors and take targeted measures to avoid the occurrence of these risks.
Management risk
The results of the case in this study indicate that the impact of management risk is relatively small but that it is an aspect that cannot be ignored. As a first step, to promote EPC general contracting in prefabricated buildings, the management ability of general contractors should be continuously improved. It can be found from the aforementioned results that U11 accounted for a large weight (0.5451) within the management risk category. The strategic positioning of the general contractor should be intensively intelligent and technological. It is difficult to deliver effective supply chain management of prefabricated buildings by simply adopting a general contracting mode based on “design + production + assembly construction”. EPC general contracting management is not simply the superposition of design, production, procurement, and hoisting. It goes beyond the project to the level of business operation and development strategy. Therefore, the EPC mode should highlight the significance and essence of prefabricated building supply chain management, emphasizing its integration and coordination capabilities, mastery of market resources, and integrated management of various specialties to achieve greater benefits.
Design risk
The design risk reflects the scale and structure of a prefabricated building, which can determine the components and materials required. In this case, the weight of the design risk ranked second. Therefore, the control of the design was comparatively necessary to manage the risk of the whole project. The quality and cost must be strictly controlled from the beginning of the design, and the design needs to play a leading role in realizing the systematic construction requirements [23]. In the meantime, the design units should carry out an overall analysis of the project from design to procurement, production, and assembly, aiming to ensure the coordination of each step [39]. The results of this case reflected that the design risk mainly lay in the in-depth design, which had a weight of 0.3420, ranking first in the design risk category. The in-depth design is constructed by collecting the final version of the construction drawings and the technical data of various professions (architecture, structure, equipment, and refined decoration). After checking the drawings, communication with the relevant professionals is undertaken to confirm any unclear or contradictory details [75]. However, in practice, professionals rarely list the key points of components in the in-depth design. In the design of prefabricated buildings, errors and omissions of precast components can only be avoided by close cooperation between various professionals and participants.
Procurement risk
Unlike in the traditional management mode, design and procurement in EPC can intersect reasonably, since the materials required for the whole process of a construction project are also determined in the design stage. The purchasing personnel can share the product model, market price, and supplier information with designers and engineers so that the three parties are able to jointly choose the best option to meet the procurement needs [15]. Procurement procedures include purchase, transportation, transfer, and delivery, so a detailed procurement plan is required during the construction process. The calculation results revealed that the procurement risk focused on the quality defects and transportation damage of prefabricated buildings. Since the quality defects of raw materials are an obstacle to the smooth delivery of a project, the general contractor should establish a sound material supplier review system to ensure that their qualifications meet the requirements of the project. Meanwhile, the general contractor should also offer appropriate incentives (e.g., exclusive supply, quality exemption, and technical support) to outstanding suppliers. Furthermore, the precast component transportation problem has also become a major focus for general contractors. Due to the wide variety and large size of precast components, if they are not placed in the transport vehicle correctly, and the protection measures of the vehicles on both sides of the guardrail are insufficient, component damage is likely to occur.
Construction risk
In this project, construction risk occupied the largest weight, which means that it was the biggest obstacle to the smooth implementation of the project. This is a peak investment stage for EPC general contractors, so more attention should be paid to the cohesive management of the design, procurement, and construction, and the coordination between various professionals should be conducted effectively. For prefabricated buildings, the Gordian knot of the construction stage is the lifting of the precast components, which requires elevated machinery and strong connections. The results of the selected case study can also verify this conclusion. Among the construction risk indicators, U46 (temporary support system with poor stability) held the largest proportion of weight (0.4956), far greater than the others. It is well known that assembly is a new method and that components are put together onsite. The temporary support system is a necessary tool for the installation, fixation, and adjustment of components [57]. After the precast components are hoisted in place, they are fixed to the completed structure through temporary supports [58]. The location and quantity of temporary supports ought to be set based on the specially designed plan, and the shape of the components and other factors should be considered thoroughly to form a stable triangular support system. Temporary supports, precast components, and completed structures need to be anchored with reserved bolts rather than temporary frills. In addition, the choice of machinery in construction is also a key risk to consider, according to the results of this project. The precast components are usually relatively large, requiring more extensive safety precautions and a greater reliability of lifting machinery when they are hoisted on site, which is a dangerous risk in construction management. To solve this problem, it is necessary to develop a reasonable scheme for lifting. In this case study, it should be explicitly determined whether it is the choice of machinery or the disclosure of technical quality and safety information that needs to be addressed.
Economic risk
The economic risk runs through the whole construction process in EPC assembly projects. Moreover, the distribution of risks between the developers and general contractors is quite different from other management modes, with the general contractors taking on almost all the risks. On this occasion, it was found that the weight of economic risk associated with the developers was the largest. In practice, in the EPC mode some developers may deliberately delay payment for completed engineering tasks or force contractors to bring money into the contract and drive the price down excessively. Furthermore, the cost of prefabricated buildings is higher than that of traditional cast-in-place buildings. Therefore, the relevant behaviors of developers should be considered seriously by the general contractors at the beginning of a project.
Policy risk
In the case study, policy had the least impact on the final determination of the risk level, which is inconsistent with the findings of previous studies by Jiang et al. [76]. The main reason for this may be that the project was based in Jiangsu, which is one of the provinces selected to demonstrate the assembly construction method in China. Compared to other provinces, Jiangsu has more beneficial policies, in terms of both technology and management, which provide a guarantee for the advancement of prefabricated buildings. For the comprehensive development of prefabricated construction in China, different provinces should learn from the examples of these demonstration provinces and employ appropriate policies as well as measures to promote high-quality growth in combination with their advantages.
Natural risk
Natural risks are inescapable and unstable. Even if they present a relatively low probability of occurrence, they can have a terrible impact on the progress of a project. Therefore, general contractors should devise emergency plans in advance. The natural risks of EPC prefabricated building projects mainly include geological and climate risks. General contractors should consider the geology and conduct a thorough survey before the commencement of the building on the site. With regard to the climate, it is necessary to master the meteorological data of the site. Taking into account the rainfall, temperature, and seasonal characteristics, general contractors should implement different targeted measures to succeed in their projects.

7. Conclusions

Despite the fact that the implementation of the EPC mode in prefabricated buildings has been emphasized by the Chinese government, there have been few studies to address the risks of combining prefabricated buildings with EPC. Accordingly, this study took the risks of EPC assembly projects as its research target, and “risk identification/evaluation/handling” was the central focus. After summarizing the research situation at present, the risks of EPC prefabricated buildings were identified and analyzed through a literature review and questionnaire survey. On this basis, this study established a relatively suitable risk-evaluation system that can provide references for general contractors to carry out risk assessments. In order to effectively obtain the weight of each risk and complete the comprehensive evaluation, an improved weighting algorithm (AHP–EWM) was established, combining subjectivity and objectivity. In addition, using the grey system theory, this study also proposed a risk-assessment model that was applied in a real project. In this case study, a grey–fuzzy comprehensive evaluation method was used to calculate the risk level. Additionally, the AHP–EWM analysis found that the construction and design risks had greater impacts. In conclusion, this study contributes to the body of knowledge on adopting EPC in prefabricated buildings, which has practical application value for general contractors in risk management. Specifically, the current study points out the typical risks that arise when implementing prefabricated buildings in a country (e.g., China). It serves as a foundational work that can be extrapolated on to further investigate the adoption of the EPC mode for prefabricated buildings.
Of course, some limitations to this study must be acknowledged. In fact, there are still few assembly-type projects using EPC, which meant that our research lacked a certain amount of data support. This study only investigated the current risks in China, and so the results are limited by region. In addition, the subjective views of interviewees also had an impact on the results of the data collection. Hence, a relevant database should be established to include more case studies in future works, which could enable practitioners to benefit from big-data analysis to obtain more reasonable results.

Author Contributions

Conceptualization, L.Z. (Lemeng Zhao) and L.Z. (Li Zhao); methodology, M.X.; software, M.X.; investigation, L.Z. (Lemeng Zhao); writing—original draft preparation, M.X.; writing—review and editing, L.Z. (Lemeng Zhao); supervision, L.Z. (Li Zhao); funding acquisition, M.X. and L.Z. (Li Zhao). All authors have read and agreed to the published version of the manuscript.

Funding

This research was funded by Postgraduate Research & Practice Innovation Program of Jiangsu Province, grant number SJCX21_0981. The APC was paid by China University of Mining and Technology, Xuzhou, China.

Institutional Review Board Statement

Not applicable.

Informed Consent Statement

Not applicable.

Data Availability Statement

The datasets used and analyzed during the current study are available from the corresponding author on reasonable request.

Conflicts of Interest

The authors declare no conflict of interest.

Appendix A

Table A1. Scoring results of the first group of experts.
First-LevelSecond-LevelExpert
1
Expert
2
Expert
3
Expert 4Expert 5Expert 6
Management risk U1Insufficient project management experience and ability U11828579868385
Insufficient communication and coordination between various units U12878483858182
Unreasonable organization U13848187848482
Design risk U2Design changes U21817679838081
Unreasonable component split U22898984879194
Insufficiently in-depth design U23766971787675
Immature standardized design techniques U24848380887982
Poor design coordination U25848390858387
Procurement risk U3Poor supplier credit and contract performance U31818384818685
Quality defects of precast components U32727870766973
Incorrect transportation plan U33787981818385
Untimely delivery U34808582818178
Transport damage of precast components U35908593899291
Construction risk U4Unreasonable specialized construction plan U41857981848685
Inadequate disclosure of technical quality and safety information U42737568697475
Immature hoisting technology U43847980817974
Inappropriate mechanical equipment selection U44858689838184
Improper site stacking and protection of components U45788173758279
Temporary support system with poor stability U46817270797572
Economic risk U5Inflation U51878583818483
Rising prices U52838486868581
Insufficient developer credibility and payment ability U53778075797681
Interest rate fluctuations U54878586908789
Policy risk U6Unsound specifications U61747375787672
Changes in industry-related laws and policies U62807978797681
Natural risk U7Adverse geological conditions U71828285868282
Adverse weather conditions U72837880838385
Table A2. Scoring results of the second group of experts.
First-LevelSecond-LevelExpert
1
Expert
2
Expert
3
Expert 4Expert 5Expert 6
Management risk U1Insufficient project management experience and ability U1122.521.52.51.5
Insufficient communication and coordination between various units U121.511.5211.5
Unreasonable organization U1311.511.51.51
Design risk U2Design changes U2111.51.521.52
Unreasonable component split U22222.522.52
Insufficiently in-depth design U2333.5333.53
Immature standardized design techniques U242.522.5232.5
Poor design coordination U2521.5221.52
Procurement risk U3Poor supplier credit and contract performance U311.521.5221.5
Quality defects of precast components U323.5343.533
Incorrect transportation plan U3322.5221.52
Untimely delivery U3421.5221.52
Transport damage of precast components U3533.532.533
Construction risk U4Unreasonable specialized construction plan U412222.522.5
Inadequate disclosure of technical quality and safety information U42232.522.53
Immature hoisting technology U432.522.5332
Inappropriate mechanical equipment selection U443221.522.5
Improper site stacking and protection of components U452.532.522.52
Temporary support system with poor stability U463.543.53.533.5
Economic risk U5Inflation U5121.5221.51.5
Rising prices U52221.51.511.5
Insufficient developer credibility and payment ability U5321.51.51.521.5
Interest rate fluctuations U54211.5111
Policy risk U6Unsound specifications U6121.51.521.51.5
Changes in industry-related laws and policies U62111.511.51
Natural risk U7Adverse geological conditions U711.521.51.522
Adverse weather conditions U72221.5222

Appendix B

Computational procedure:
1.
The subjective weights of first-level and second-level indicators determined by AHP were as follows:
  • First-level indicators:
w 1 = ( 0.1513 , 0.2143 , 0.0912 , 0.3131 , 0.0650 , 0.0508 , 0.1143 )
  • Second-level indicators:
w 11 = ( 0.4407 , 0.3398 , 0.2195 ) w 12 = ( 0.1343 , 0.2070 , 0.2324 , 0.2288 , 0.1795 ) w 13 = ( 0.1235 , 0.3232 , 0.1701 , 0.1559 , 0.2273 ) w 14 = ( 0.1699 , 0.1107 , 0.0780 , 0.1251 , 0.2071 , 0.3092 ) w 15 = ( 0.2524 , 0.2249 , 0.3446 , 0.1781 ) w 16 = ( 0.5556 , 0.4444 ) w 17 = ( 0.58335 , 0.41665 )
2.
The objective weights of first-level and second-level indicators determined by EWM were as follows:
  • First-level indicators:
w 2 = ( 0.0718 , 0.2249 , 0.1817 , 0.3529 , 0.0802 , 0.0422 , 0.0462 )
  • Second-level indicators:
w 21 = ( 0.4318 , 0.2967 , 0.2716 ) w 22 = ( 0.1245 , 0.2090 , 0.3077 , 0.2130 , 0.1450 ) w 23 = ( 0.1084 , 0.3963 , 0.1756 , 0.1436 , 0.1761 ) w 24 = ( 0.0968 , 0.1658 , 0.1550 , 0.0944 , 0.1802 , 0.3060 ) w 25 = ( 0.2396 , 0.2132 , 0.3678 , 0.1802 ) w 26 = ( 0.6351 , 0.3649 ) w 27 = ( 0.3355 , 0.6645 )
Next, the combined weights of the first-level and second-level indicators in the evaluation system could be obtained by Equation (11).
  • First-level indicators:
W = ( 0.0864 , 0.2298 , 0.0885 , 0.4814 , 0.0318 , 0.0251 , 0.0570 )
  • Second-level indicators:
W 1 = ( 0.5451 , 0.2894 , 0.1655 ) W 2 = ( 0.0805 , 0.2071 , 0.3420 , 0.2333 , 0.1371 ) W 3 = ( 0.0576 , 0.5480 , 0.1277 , 0.0961 , 0.1706 ) W 4 = ( 0.0877 , 0.0962 , 0.0633 , 0.0619 , 0.1953 , 0.4956 ) W 5 = ( 0.2233 , 0.1793 , 0.4748 , 0.1226 ) W 6 = ( 0.6853 , 0.3147 ) W 7 = ( 0.4140 , 0.5960 )
Subsequently, another group of respondents gave each indicator a risk level. Suppose the project risk was U; the evaluation class was divided into five kinds (1 indicating “very low”, 2 meaning “low”, 3 being “medium”, 4 referring to “high”, and 5 indicating “very high”); and the values between the two levels were 4.5, 3.5, 2.5, and 1.5. The criteria were sent to the invited experts, and the evaluation matrix D i for each indicator of the project could be obtained, where i = 1 , 2 , 3 , 4 , 5 , 6 , 7 . The results are shown in the Appendix A and Appendix B.
According to the abovementioned risk categories, the risks can be divided into five grey scales ( e = 1 , 2 , 3 , 4 , 5 ) from low to high. Table A3 illustrates the relation between the whitening weight function and the grey scale.
Table A3. Whitening weight function table.
Grey NumberWhitening Weight Function
1 1 [ 5 , ) f 1 ( d i j k ) = { d i j k / 5 d i j k [ 0 , 5 ] 1 d i j k ( 5 , ) 0 d i j k [ 0 , )
2 2 [ 0 , 4 , 8 ] f 2 ( d i j k ) = { d i j k / 4 d i j k [ 0 , 4 ] 2 d i j k / 4 d i j k ( 4 , 8 ] 0 d i j k [ 0 , 8 ]
3 3 [ 0 , 3 , 6 ] f 3 ( d i j k ) = { d i j k / 3 d i j k [ 0 , 3 ] 2 d i j k / 3 d i j k ( 3 , 6 ] 0 d i j k [ 0 , 6 ]
4 4 [ 0 , 2 , 4 ] f 4 ( d i j k ) = { d i j k / 2 d i j k [ 0 , 2 ] 2 d i j k / 2 d i j k ( 2 , 4 ] 0 d i j k [ 0 , 4 ]
5 5 [ 0 , 1 , 2 ] f 5 ( d i j k ) = { 1 d i j k [ 0 , 1 ] 2 d i j k d i j k ( 1 , 2 ] 0 d i j k [ 0 , 2 ]
Taking U 1 as an example, the evaluation coefficient of the second-level indicators ( U 1 j ) belonging to management risk could be calculated based on Table 6, where j = 1 , 2 , 3 ; e = 1 , 2 , 3 , 4 , 5 .
For U 11 , when e = 1 , the grey evaluation coefficient X 11 1 was:
X 11 1 = k = 1 6 f 1 ( d 11 k ) = f 1 ( d 11 1 ) + f 1 ( d 11 2 ) + f 1 ( d 11 3 ) + f 1 ( d 11 4 ) + f 1 ( d 11 5 ) + f 1 ( d 11 6 ) = f 1 ( 2 ) + f 1 ( 2.5 ) + f 1 ( 2 ) + f 1 ( 1.5 ) + f 1 ( 2.5 ) + f 1 ( 1.5 ) = 2.4
When e = 2 , the grey evaluation coefficient X 11 2 was:
X 11 2 = k = 1 6 f 2 ( d 11 k ) = f 2 ( d 11 1 ) + f 2 ( d 11 2 ) + f 2 ( d 11 3 ) + f 2 ( d 11 4 ) + f 2 ( d 11 5 ) + f 2 ( d 11 6 ) = f 2 ( 2 ) + f 2 ( 2.5 ) + f 2 ( 2 ) + f 2 ( 1.5 ) + f 2 ( 2.5 ) + f 2 ( 1.5 ) = 3
When e = 3 , the grey evaluation coefficient X 11 3 was:
X 11 3 = k = 1 6 f 3 ( d 11 k ) = f 3 ( d 11 1 ) + f 3 ( d 11 2 ) + f 3 ( d 11 3 ) + f 3 ( d 11 4 ) + f 3 ( d 11 5 ) + f 3 ( d 11 6 ) = f 3 ( 2 ) + f 3 ( 2.5 ) + f 3 ( 2 ) + f 3 ( 1.5 ) + f 3 ( 2.5 ) + f 3 ( 1.5 ) = 4
When e = 4 , the grey evaluation coefficient X 11 4 was:
X 11 4 = k = 1 6 f 4 ( d 11 k ) = f 4 ( d 11 1 ) + f 4 ( d 11 2 ) + f 4 ( d 11 3 ) + f 4 ( d 11 4 ) + f 4 ( d 11 5 ) + f 4 ( d 11 6 ) = f 4 ( 2 ) + f 4 ( 2.5 ) + f 4 ( 2 ) + f 4 ( 1.5 ) + f 4 ( 2.5 ) + f 4 ( 1.5 ) = 5
When e = 5 , the grey evaluation coefficient X 11 5 was:
X 11 5 = k = 1 6 f 5 ( d 11 k ) = f 5 ( d 11 1 ) + f 5 ( d 11 2 ) + f 5 ( d 11 3 ) + f 5 ( d 11 4 ) + f 5 ( d 11 5 ) + f 5 ( d 11 6 ) = f 5 ( 2 ) + f 5 ( 2.5 ) + f 5 ( 2 ) + f 5 ( 1.5 ) + f 5 ( 2.5 ) + f 5 ( 1.5 ) = 1
For U 11 , the total grey evaluation coefficient X 11 was:
X 11 = X 11 1 + X 11 2 + X 11 3 + X 11 4 + X 11 5 = 2.4 + 3 + 4 + 5 + 1 = 15.4
Additionally, each grey-scale evaluation weight was:
r 11 1 = X 11 1 X 11 = 0.1558 r 11 2 = X 11 2 X 11 = 0.1948 r 11 3 = X 11 3 X 11 = 0.2598 r 11 4 = X 11 4 X 11 = 0.3247 r 11 5 = X 11 5 X 11 = 0.0649
Therefore, the grey evaluation weight vector r 11 for U 11 was:
r 11 = ( 0.1558 , 0.1948 , 0.2598 , 0.3247 , 0.0649 )
Similarly, the grey evaluation weight vectors r 12 and r 13 for U 12 and U 13 could be obtained:
r 12 = ( 0.1180 , 0.1475 , 0.1966 , 0.2950 , 0.2429 )
r 13 = ( 0.1062 , 0.1327 , 0.1770 , 0.2655 , 0.3186 )
Then, the grey evaluation weight matrix R 1 of U 1 was:
R 1 = [ r 11 r 12 r 13 ] = [ 0.1558 0.1948 0.2598 0.3247 0.0649 0.1180 0.1475 0.1966 0.2950 0.2429 0.1062 0.1327 0.1770 0.2655 0.3186 ]
Along the same lines, the grey evaluation weight matrix of the remaining indicators could be obtained:
R 2 = [ r 21 r 22 r 23 r 24 r 25 ] = [ 0.1293 0.1617 0.2155 0.3233 0.1702 0.1658 0.2072 0.2763 0.3507 0.0000 0.2273 0.2841 0.3390 0.1496 0.0000 0.1800 0.2250 0.3001 0.2949 0.0000 0.1455 0.1819 0.2426 0.3638 0.0662 ]
R 3 = [ r 31 r 32 r 33 r 34 r 35 ] = [ 0.1402 0.1753 0.2337 0.3506 0.1002 0.2449 0.3061 0.3265 0.1225 0.0000 0.1558 0.1948 0.2597 0.3572 0.0325 0.1455 0.1819 0.2426 0.3638 0.0662 0.2147 0.2684 0.3380 0.1789 0.0000 ]
R 4 = [ r 41 r 42 r 43 r 44 r 45 r 46 ] = [ 0.1559 0.1948 0.2597 0.3896 0.0000 0.1846 0.2308 0.3077 0.2796 0.0000 0.1846 0.2308 0.3077 0.2796 0.0000 0.1658 0.2072 0.2763 0.3188 0.0319 0.1800 0.2250 0.3001 0.2949 0.0000 0.2633 0.3292 0.3135 0.0940 0.0000 ]
R 5 = [ r 51 r 52 r 53 r 54 ] = [ 0.1402 0.1753 0.2337 0.3506 0.1002 0.1293 0.1617 0.2155 0.3233 0.1702 0.1348 0.1686 0.2247 0.3371 0.1348 0.1062 0.1282 0.1709 0.2564 0.3419 ]
R 6 = [ r 61 r 62 ] = [ 0.1348 0.1686 0.2247 0.3371 0.1348 0.1001 0.1251 0.1669 0.2503 0.3576 ]
R 7 = [ r 71 r 72 ] = [ 0.1402 0.1753 0.2337 0.3506 0.1002 0.1507 0.1884 0.2512 0.3769 0.0328 ]
From Equation (18), the first-level indicators U i , i = 1 , 2 , 3 , 4 , 5 , 6 , 7 could be comprehensively evaluated by the grey theory, and the grey evaluation weight vectors ( Z ) could be obtained as follows:
Z 1 = W 1 R 1 = ( 0.1367 , 0.1708 , 0.2278 , 0.3063 , 0.1584 ) Z 2 = W 2 R 2 = ( 0.1844 , 0.2305 , 0.2938 , 0.2685 , 0.0228 ) Z 3 = W 3 R 3 = ( 0.2128 , 0.2660 , 0.3065 , 0.1984 , 0.0163 ) Z 4 = W 4 R 4 = ( 0.2190 , 0.2738 , 0.3029 , 0.2022 , 0.0020 ) Z 5 = W 5 R 5 = ( 0.1311 , 0.1639 , 0.2185 , 0.3277 , 0.1588 ) Z 6 = W 6 R 6 = ( 0.1239 , 0.1549 , 0.2065 , 0.3098 , 0.2049 ) Z 7 = W 7 R 7 = ( 0.1479 , 0.1849 , 0.2465 , 0.3698 , 0.0610 )
Z = [ Z 1 Z 2 Z 3 Z 4 Z 5 Z 6 Z 7 ] = [ 0.1367 0.1708 0.2278 0.3063 0.1584 0.1844 0.2305 0.2938 0.2685 0.0228 0.2128 0.2660 0.3065 0.1984 0.0163 0.2190 0.2738 0.3029 0.2022 0.0020 0.1311 0.1639 0.2185 0.3277 0.1588 0.1239 0.1549 0.2065 0.3098 0.2049 0.1479 0.1849 0.2465 0.3698 0.0610 ]
Next, for U , the grey comprehensive evaluation weight vector ( B ) was calculated, based on Equation (19):
B = W Z = ( 0.1942 , 0.2427 , 0.2863 , 0.2423 , 0.0350 )
In this case, there were five grey scales, and the values assigned to each were 5, 4, 3, 2, and 1, respectively ( C = ( 5 , 4 , 3 , 2 , 1 ) ). Therefore, the risk level of the selected case in this study could be determined by Equation (20):
F = B C T = 3.3203

References

  1. Jiang, L.; Li, Z.F.; Li, L.; Gao, Y.L. Constraints on the Promotion of Prefabricated Construction in China. Sustainability 2018, 10, 2516. [Google Scholar] [CrossRef] [Green Version]
  2. Jiang, R.; Mao, C.; Hou, L.; Wu, C.K.; Tan, J.J. A SWOT analysis for promoting off-site construction under the backdrop of China’s new urbanisation. J. Clean. Prod. 2018, 173, 225–234. [Google Scholar] [CrossRef]
  3. Gan, X.L.; Chang, R.D.; Wen, T. Overcoming barriers to off-site construction through engaging stakeholders: A two-mode social network analysis. J. Clean. Prod. 2018, 201, 735–747. [Google Scholar] [CrossRef]
  4. Gan, X.L.; Chang, R.D.; Zuo, J.; Wen, T.; Zillante, G. Barriers to the transition towards off-site construction in China: An Interpretive structural modeling approach. J. Clean. Prod. 2018, 197, 8–18. [Google Scholar] [CrossRef]
  5. Li, C.Z.; Hong, J.; Xue, F.; Shen, G.Q.; Xu, X.; Mok, M.K. Schedule risks in prefabrication housing production in Hong Kong: A social network analysis. J. Clean. Prod. 2016, 134 Pt B, 482–494. [Google Scholar] [CrossRef] [Green Version]
  6. Xue, H.; Zhang, S.; Su, Y.; Wu, Z. Effect of stakeholder collaborative management on off-site construction cost performance. J. Clean. Prod. 2018, 184, 490–502. [Google Scholar] [CrossRef]
  7. Ji, Y.B.; Zhu, F.D.; Li, H.X.; Al-Hussein, M. Construction Industrialization in China: Current Profile and the Prediction. Appl. Sci. 2017, 7, 180. [Google Scholar] [CrossRef]
  8. Wang, Q.; Zeng, Y.E.; Wu, B.W. Exploring the relationship between urbanization, energy consumption, and CO2 emissions in different provinces of China. Renew. Sustain. Energy Rev. 2016, 54, 1563–1579. [Google Scholar] [CrossRef]
  9. Yuan, H. A SWOT analysis of successful construction waste management. J. Clean. Prod. 2013, 39, 1–8. [Google Scholar] [CrossRef]
  10. Ma, L.; Le, Y.; Li, H.; Jin, R.; Piroozfar, P.; Liu, M. Regional comparisons of contemporary construction industry concepts in the Chinese Context. Sustainability 2018, 10, 3831. [Google Scholar] [CrossRef] [Green Version]
  11. Mao, C.; Xie, F.; Hou, L.; Wu, P.; Wang, J.; Wang, X. Cost analysis for sustainable off-site construction based on a multiple-case study in China. Habitat Int. 2016, 57, 215–222. [Google Scholar] [CrossRef]
  12. Li, Z.; Zhang, S.; Meng, Q.; Hu, X. Barriers to the development of prefabricated buildings in China: A news coverage analysis. Eng. Constr. Archit. Manag. 2020, 28, 2884–2903. [Google Scholar] [CrossRef]
  13. Wang, Z.L.; Shen, H.C.; Zuo, J. Risks in Prefabricated Buildings in China: Importance-Performance Analysis Approach. Sustainability 2019, 11, 3450. [Google Scholar] [CrossRef] [Green Version]
  14. Zhao, Q. Key points of precast structure construction deep design. Constr. Technol. 2017, 46, 21–24. (In Chinese) [Google Scholar]
  15. Ye, H.W.; Zhou, C.; Wang, B. Promoting the Development of Assembly Building with EPC Mode. J. Eng. Manag. 2017, 31, 17–22. (In Chinese) [Google Scholar]
  16. Wang, T.; Tang, W.; Du, L.; Duffield, C.F.; Wei, Y. Relationships among Risk Management, Partnering, and Contractor Capability in International EPC Project Delivery. J. Manag. Eng. 2016, 32, 04016017. [Google Scholar] [CrossRef]
  17. Guo, Q.; Xu, Z.P.; Zhang, G.F.; Tu, T. Comparative analysis between the EPC contract mode and the traditional mode based on the transaction cost theory. In Proceedings of the 2010 IEEE 17th International Conference on Industrial Engineering and Engineering Management, Xiamen, China, 20–31 October 2010; pp. 91–195. [Google Scholar]
  18. Hale, D.R.; Shrestha, P.P.; Gibson, G.E.; Migliaccio, G.C. Empirical Comparison of Design/Build and Design/Bid/Build Project Delivery Methods. J. Constr. Eng. Manag. 2009, 135, 579–587. [Google Scholar] [CrossRef] [Green Version]
  19. Hussein, M.; Eltoukhy, A.E.E.; Karam, A.; Shaban, I.A.; Zayed, T. Modelling in off-site construction supply chain management: A review and future directions for sustainable modular integrated construction. J. Clean. Prod. 2021, 310, 127503. [Google Scholar] [CrossRef]
  20. Hong, J.; Shen, G.Q.P.; Li, Z.; Zhang, B.; Zhang, W. Barriers to promoting prefabricated construction in China: A cost-benefit analysis. J. Clean. Prod. 2018, 172, 649–660. [Google Scholar] [CrossRef]
  21. Mao, C.; Shen, Q.; Shen, L.; Tang, L. Comparative study of greenhouse gas emissions between off-site prefabrication and conventional construction methods: Two case studies of residential projects. Energy Build. 2013, 66, 165–176. [Google Scholar] [CrossRef] [Green Version]
  22. Zhang, X.; Skitmore, M.; Peng, Y. Exploring the challenges to industrialized residential building in China. Habitat Int. 2014, 41, 176–184. [Google Scholar] [CrossRef] [Green Version]
  23. Wu, P.; Xu, Y.; Jin, R.; Lu, Q.; Madgwick, D.; Hancock, C.M. Perceptions towards risks involved in off-site construction in the integrated design & construction project delivery. J. Clean. Prod. 2019, 213, 899–914. [Google Scholar]
  24. Li, Z.D.; Shen, G.Q.; Xue, X.L. Critical review of the research on the management of prefabricated construction. Habitat Int. 2014, 43, 240–249. [Google Scholar] [CrossRef] [Green Version]
  25. Nawi, M.N.M.; Haron, A.T.; Hamid, Z.A.; Kamar, K.A.M.; Baharuddin, Y. Improving integrated practice through building information modeling integrated project delivery (BIM-IPD) for Malaysian industrialised building system (IBS) construction projects. Malays. Constr. Res. J. 2014, 15, 29–38. [Google Scholar]
  26. Osman, W.N.; Nawi, M.N.; Anuar, H.S.; Radzuan, K.; Osman, N.N. Readiness assessment for implementation of integrated project delivery (IPD) in industrialised building system (IBS) projects. J. Teknol. 2015, 77, 91–95. [Google Scholar] [CrossRef] [Green Version]
  27. Jin, R.; Gao, S.; Cheshmehzangi, A.; Aboagye-Nimo, E. A holistic review of offsite construction literature published between 2008 and 2018. J. Clean. Prod. 2018, 202, 1202–1219. [Google Scholar] [CrossRef] [Green Version]
  28. Bogus, S.M.; Migliaccio, G.C.; Jin, R. Study of the relationship between procurement duration and project performance in Design-Build Projects: Comparison between water/wastewater and transportation Sectors. J. Manag. Eng. 2013, 29, 382–391. [Google Scholar] [CrossRef]
  29. Mostafa, S.; Chileshe, N.; Zuo, J. A synergistic supply chain enhancing offsite manufacturing uptake in Australian house building. In Proceedings of the 30th Annual ARCOM Conference, Portsmouth, UK, 1–3 September 2014; pp. 1143–1152. [Google Scholar]
  30. Razkenari, M.; Fenner, A.; Shojaei, A.; Hakim, H.; Kibert, C. Perceptions of offsite construction in the United States: An investigation of current practices. J. Build. Eng. 2020, 29, 101138. [Google Scholar] [CrossRef]
  31. Nadim, W.; Goulding, J.S. Offsite production: A model for building down barriers. Eng. Constr. Archit. Manag. 2011, 18, 82–101. [Google Scholar] [CrossRef]
  32. Durdyev, S.; Ismail, S. Offsite Manufacturing in the Construction Industry for Productivity Improvement. Eng. Manag. J. 2019, 31, 35–46. [Google Scholar] [CrossRef]
  33. Rahimian, F.P.; Goulding, J.; Akintoye, A.; Kolo, S. Review of Motivations, Success Factors, and Barriers to the Adoption of Offsite Manufacturing in Nigeria. Procedia Eng. 2017, 196, 512–519. [Google Scholar] [CrossRef] [Green Version]
  34. Mao, C.; Shen, Q.P.; Pan, W.; Ye, K.H. Major Barriers to Off-Site Construction: The Developer’s Perspective in China. J. Manag. Eng. 2015, 31, 04014043. [Google Scholar] [CrossRef]
  35. Zhai, X.; Reed, R.; Mills, A. Factors impeding the offsite production of housing construction in China: An investigation of current practice. Constr. Manag. Econ. 2014, 32, 40–52. [Google Scholar] [CrossRef]
  36. Cao, X.Y.; Li, Z.F.; Liu, S. Study on factors that inhibit the promotion of SI housing system in China. Energy Build. 2015, 88, 384–394. [Google Scholar] [CrossRef]
  37. Luo, L.Z.; Mao, C.; Shen, L.Y.; Li, Z.D. Risk factors affecting practitioners’ attitudes toward the implementation of an industrialized building system A case study from China. Eng. Constr. Archit. Manag. 2015, 22, 622–643. [Google Scholar] [CrossRef]
  38. Wang, T.; Gao, S.; Li, X.; Ning, X. A meta-network-based risk evaluation and control method for industrialized building construction projects. J. Clean. Prod. 2018, 205, 552–564. [Google Scholar] [CrossRef]
  39. Pozin, M.A.A.; Nawi, M.N.M.; AzmanM, N.A.; Lee, A. Improving communication in managing industrialised building system (IBS) projects: Virtual environment. Malays. Constr. Res. J. 2017, 2, 1–13. [Google Scholar]
  40. Galloway, P. Design-Build/EPC contractor’s heightened Risk-changes in a changing world. J. Leg. Aff. Disput. Resolut. Eng. Constr. 2009, 1, 7–15. [Google Scholar] [CrossRef]
  41. Mesa, H.A.; Molenaar, K.R.; Alarcón, L.F. Exploring performance of the integrated project delivery process on complex building projects. Int. J. Proj. Manag. 2016, 34, 1089–1101. [Google Scholar] [CrossRef]
  42. Shen, W.; Choi, B.; Lee, S.; Tang, W.; Haas, C.T. How to Improve Interface Management Behaviors in EPC Projects: Roles of Formal Practices and Social Norms. J. Manag. Eng. 2018, 34, 04018032. [Google Scholar] [CrossRef]
  43. Yang, Y.; Tang, W.; Shen, W.; Wang, T. Enhancing Risk Management by Partnering in International EPC Projects: Perspective from Evolutionary Game in Chinese Construction Companies. Sustainability 2019, 11, 5332. [Google Scholar] [CrossRef] [Green Version]
  44. Votto, R.; Lee, H.L.; Berssaneti, F. Applying and Assessing Performance of Earned Duration Management Control Charts for EPC Project Duration Monitoring. J. Constr. Eng. Manag. 2020, 146, 04020001. [Google Scholar] [CrossRef]
  45. Aldhaheri, M.; Bakchan, A.; Sandhu, M.A. A structural equation model for enhancing effectiveness of engineering, procurement and construction (EPC) major projects. Eng. Constr. Archit. Manag. 2018, 25, 1226–1252. [Google Scholar] [CrossRef]
  46. Pekings, R.A. Sources of Changes in Design-Build Contracts for a Governmental Owner. J. Constr. Eng. Manag. 2011, 135, 588–593. [Google Scholar]
  47. Pal, R.; Wang, P.; Liang, X. The critical factors in managing relationships in international engineering, procurement, and construction (IEPC) projects of Chinese organizations. Int. J. Proj. Manag. 2017, 35, 1225–1237. [Google Scholar] [CrossRef]
  48. Gao, H.; Wang, Z.J. The general contractor’s risk prevention measures under EPC mode. J. Eng. Manag. 2016, 30, 114–119. (In Chinese) [Google Scholar]
  49. Shen, W.X.; Tang, W.Z.; Wang, S.L.; Duffield, C.F.; Hui, F.K.P.; You, R.C. Enhancing Trust-Based Interface Management in International Engineering-Procurement-Construction Projects. J. Constr. Eng. Manag. 2017, 143. [Google Scholar] [CrossRef]
  50. Shen, W.X.; Tang, W.Z.; Yu, W.Y.; Duffield, C.F.; Hui, F.K.P.; Wei, Y.P.; Fang, J. Causes of contractors’ claims in international engineering-procurement-construction projects. J. Civ. Eng. Manag. 2017, 23, 727–739. [Google Scholar] [CrossRef] [Green Version]
  51. Fallahnejad, M.H. Delay causes in Iran gas pipeline projects. Int. J. Proj. Manag. 2013, 31, 136–146. [Google Scholar] [CrossRef]
  52. Zhang, Y.; Sun, K. Top 225 international contractors in 2011 ENR report. J. Eng. Manag. 2011, 25, 584–590. (In Chinese) [Google Scholar]
  53. Fellows, R.; Liu, A. Research Methods for Construction, 3rd ed.; Blackwell Publishing Ltd.: Hoboken, NJ, USA, 2008. [Google Scholar]
  54. Duan, S.X.; Xu, M. Research on procurement risk assessment of EPC engineering project based on structural equation model. Financ. Account. Mon. 2019, 852, 138–146. (In Chinese) [Google Scholar]
  55. Qi, B.K.; Zhu, Y.; Fan, W.Y. Risk factor identification method of the whole life cycle in prefabricated construction. J. Shenyang Jianzhu Univ. 2016, 18, 257–261. (In Chinese) [Google Scholar]
  56. Alanjari, P.; Razavialavi, S.; Abourizk, S. A simulation-based approach for material yard laydown planning. Autom. Constr. 2014, 40, 1–8. [Google Scholar] [CrossRef]
  57. Jaillon, L.; Poon, C.S. The evolution of prefabricated residential building systems in Hong Kong: A review of the public and the private sector. Autom. Constr. 2009, 18, 239–248. [Google Scholar] [CrossRef]
  58. Fard, M.M.; Terouhid, S.A.; Kibert, C.J.; Hakim, H. Safety concerns related to modular/prefabricated building construction. Int. J. Inj. Control. Saf. Promot. 2017, 24, 10–23. [Google Scholar] [CrossRef] [PubMed]
  59. Ji, Y.; Jiao, R.J.; Chen, L.; Wu, C. Green modular design for material efficiency: A leader-follower joint optimization model. J. Clean. Prod. 2013, 41, 187–201. [Google Scholar] [CrossRef]
  60. Li, C.Z.; Hong, J.; Xue, F.; Shen, G.Q.; Xu, X.; Luo, L.Z. SWOT analysis and Internet of Things-enabled platform for prefabrication housing production in Hong Kong. Habitat Int. 2016, 57, 74–87. [Google Scholar] [CrossRef]
  61. Liu, B.; Huo, T.; Meng, J.; Gong, J.; Shen, Q.; Sun, T. Identification of Key Contractor Characteristic Factors That Affect Project Success under Different Project Delivery Systems: Empirical Analysis Based on a Group of Data from China. J. Manag. Eng. 2016, 32, 05015003. [Google Scholar] [CrossRef]
  62. Xia, M.M.; Zhao, L.; Qiao, Y.N.; Yuan, Z.M.; Cui, Y.L.; Zhao, L.M.; Li, J.L. Analysis of Factors Affecting the Quality of Precast Components Based on Structural Equation Modeling. Arab. J. Sci. Eng. 2021. [Google Scholar] [CrossRef]
  63. Bajjou, M.S.; Chafi, A. Identifying and Managing Critical Waste Factors for Lean Construction Projects. Eng. Manag. J. 2019, 32, 2–13. [Google Scholar] [CrossRef]
  64. Liu, C.; Yang, S.; Cui, Y.; Yang, Y. An improved risk assessment method based on a comprehensive weighting algorithm in railway signaling safety analysis. Saf. Sci. 2020, 128, 104768. [Google Scholar] [CrossRef]
  65. Karasan, A.; Ilbahar, E.; Kahraman, C. A novel pythagorean fuzzy AHP and its application to landfill site selection problem. Soft Comput. 2019, 23, 10953–10968. [Google Scholar] [CrossRef]
  66. Chang, T.; Deng, X.; Hwang, B.G. Investigating political risk paths in international high-speed railway projects: The case of Chinese international contractors. Sustainability 2019, 11, 4157. [Google Scholar] [CrossRef] [Green Version]
  67. Cho, T.; Lee, J.B.; Kim, S.S. Probabilistic risk assessment for the construction phases of a PSC box girder railway bridge system with six sigma methodology. KSCE J. Civ. Eng. 2011, 15, 119–130. [Google Scholar] [CrossRef]
  68. Liu, X.T.; Rao, S.S. Vibration Analysis in the Presence of Uncertainties Using Universal Grey System Theory. J. Vib. Acoust. Trans. Asme 2018, 140, 031009. [Google Scholar] [CrossRef]
  69. Han, L.F.; Tang, W.Y.; Liu, Y.M.; Wang, J.; Fu, C.F. Evaluation of measurement uncertainty based on grey system theory for small samples from an unknown distribution. Sci. China Technol. Sci. 2013, 56, 1517–1524. [Google Scholar] [CrossRef]
  70. Feng, S.X.; Lei, H.Y.; Wan, Y.F.; Jin, H.Y.; Han, J. Influencing factors and control measures of excavation on adjacent bridge foundation based on analytic hierarchy process and finite element method. Front. Struct. Civ. Eng. 2021, 15, 461–477. [Google Scholar] [CrossRef]
  71. Lee, D.; Lee, D.; Lee, M.; Kim, M.; Kim, T. Analytic Hierarchy Process-Based Construction Material Selection for Performance Improvement of Building Construction: The Case of a Concrete System Form. Materials 2020, 13, 1738. [Google Scholar] [CrossRef] [Green Version]
  72. Feng, J.H.; Gong, Z.R. Integrated linguistic entropy weight method and multi-objective programming model for supplier selection and order allocation in a circular economy: A case study. J. Clean. Prod. 2020, 227, 122597. [Google Scholar] [CrossRef]
  73. Wang, C.Y.; Xu, M.; Olsson, G.; Liu, Y. Characterizing of water-energy-emission nexus of coal-fired power industry using entropy weighting method. Resour. Conserv. Recycl. 2020, 161, 104991. [Google Scholar] [CrossRef]
  74. Eskander, R.F.A. Risk assessment influencing factors for Arabian construction projects using analytic hierarchy process. Alex. Eng. J. 2018, 57, 4207–4218. [Google Scholar] [CrossRef]
  75. Yan, M.; Zhao, F.; Tian, J.; Li, C.; Guo, N. Introduction of construction organization management and technology system of assembly concrete structure. Eng. Qual. 2014, 32, 13–18. (In Chinese) [Google Scholar]
  76. Jiang, W.; Huang, Z.; Peng, Y.; Fang, Y.; Cao, Y. Factors affecting prefabricated construction promotion in China: A structural equation modeling approach. PLoS ONE 2020, 15, e0227787. [Google Scholar] [CrossRef] [PubMed] [Green Version]
Figure 1. Methodology framework of risk assessment for prefabricated building using EPC.
Sustainability 14 01910 g001
Figure 2. Process of constructing risk indicators of prefabricated buildings with EPC.
Sustainability 14 01910 g002
Figure 3. Basic information about the respondents.
Sustainability 14 01910 g003
Table 1. Risks involved in prefabricated buildings.
Risk DescriptionResource
Lack of government incentives, directives, and promotion; inadequate policies and regulations[22,30,31,32,33,34]
Immature development leading to a lack of market acceptance[1,2,3,4]
Lack of knowledge and expertise and low levels of skilled labor[3,4,22]
Higher initial investment[20,21,22]
Inappropriate design codes and standards for prefabricated buildings[32]
Dependence on traditional construction methods[30,32,33]
Lack of a quality-monitoring mechanism[34]
Poor cooperation between internal and external stakeholders[3,4,5,6,35]
Table 2. Risks of EPC projects.
Risk DescriptionResource
Uncertain circumstances; complex economic and political environment[37,38,39,40]
The strengths of EPC contractors are mainly in construction, whereas their capability gaps are usually related to engineering and procurement[39,40]
Rising price of materials and equipment[16,41,42]
Exchange rate fluctuation[40,42]
Complicated interfaces and concurrent engineering, procurement, and construction make it more challenging[38,42,43,44]
Some factors contribute to delays[51]
Table 3. Risk items associated with implementing prefabricated buildings with EPC.
NumberRisk IndicatorDescriptionReferences
1InflationThe effects of price level and currency purchasing power decline[39,40,54]
2Quality defects of precast componentsIncluding size deviation, insufficient strength, and reserved embedded parts; specifications do not meet the requirements[55]
3Design changesOwner’s requirements, insufficient design capabilities, or distortion of survey data leading to design modifications[6,14]
4Adverse weather conditionsFloods, rainstorms, typhoons, and other natural disasters[46]
5Interest rate fluctuationsThe effects of a change in interest rates caused by policy changes[40,41,42,47,48]
6Adverse geological conditionsEarthquakes, landslides, karsts, seepage deformation, and other undesirable geological phenomena[47]
7Poor design coordinationInsufficient coordination between electromechanical, pipeline, and other major systems, as well as between procurement and construction[14,33,34]
8Unreasonable component splitPrecast component split does not meet the design, construction, and other requirements[48]
9Insufficiently in-depth designThe design does not provide sufficiently in-depth details for the components to meet the requirements of the specification standards, construction technology, and conflict with other professions[14,20]
10Immature hoisting technologyConstruction personnel involved in the hoisting and connection technology are not skilled[1,2,3,4]
11Transport damage of precast componentsDamage caused by the lack of scientific protection[21]
12Unreasonable organizationThe responsibilities of each department are not clear and the power division is not equal[3,4,5,31,32,33,34]
13Improper site stacking and protection of componentsFailure to provide essential protection for components and unreasonable stacking methods and areas[56,57]
14Temporary support system with poor stabilityThe hoisting support system is not firm and displays insufficient strength and poor safety[52,55]
15Inappropriate mechanical equipment selectionThe main parameters such as lifting weight, height, and moment of mechanical equipment can not meet the requirements[58]
16Untimely deliveryWhen raw materials are in short supply, equipment malfunctions or inventory turnover is untimely, supplies often fail to be delivered on time[39,44]
17Rising pricesAn increase in the price of labor, materials, and equipment caused by supply and demand[16,39,47]
18Immature standardized design techniquesThe designers do not adopt the standardized methods of prefabricated building[7,12,13]
19Poor supplier credit and contract performanceThe supplier’s capital, debt, production capacity, and business reputation are damaged[38,39,40]
20Insufficient developer credibility and payment abilityThe developer breaches the contract and project funds can not be in place on time[38,41]
21Tax rate fluctuationsChanges caused by national macroeconomic regulation and control[17,39]
22Unsound specificationsConflicts in all aspects of assembly construction and a lack of a unified standard system[1,2]
23Insufficient communication and coordination between various unitsLack of communication between design units, component manufacturers, contractors, and other participating units[3,4,5,6]
24Insufficient project management experience and abilityThe general contractor and subcontractors lack experience in prefabricated building project management[1,2,3,4]
25Changes in industry-related laws and policiesThe relevant laws and policies are changed during the process of construction[22,38]
26Unreasonable specialized construction planSpecialized schemes are not appropriate for prefabricated buildings[33]
27Incorrect transportation planMainly includes unreasonable transportation routes and protective measures[54,59]
28Inadequate disclosure of technical quality and safety informationThe communication of technical information between professional personnel and the first line of the operation personnel is not comprehensive[60]
29Inadequacy of competent purchasing staffThe purchasing staff are not familiar with the market environment and have insufficient experience[40,41,47]
30Supplier designated by developersThe developer appoints suppliers to the general contractor during the procurement process of the project[39,59]
Table 4. Relationship between Cronbach’s α coefficient and reliability.
Cronbach’s α CoefficientReliability
Cronbach’s α coefficient < 0.3Unreliable
0.3 ≤ Cronbach’s α coefficient < 0.4Barely reliable
0.4 ≤ Cronbach’s α coefficient < 0.5Reliable
0.5 ≤ Cronbach’s α coefficient < 0.7Reliable (most common)
0.7 ≤ Cronbach’s α coefficient < 0.9Reliable (second most common)
0.9 ≤ Cronbach’s α coefficientPerfectly reliable
Table 5. Descriptive statistical analysis of the risk indicators.
Risk IndicatorSurvey ResultsCalculation Results
12345μσδR
Inflation093065333.890.840.2277.81
Quality defects of precast components014950373.900.800.2177.96
Design changes015944333.800.810.2175.91
Adverse weather conditions051881334.040.720.1880.73
Interest rate fluctuations0104550323.760.890.2475.18
Adverse geological conditions024559313.870.770.2077.37
Poor design coordination025248353.850.820.2176.93
Unreasonable component split035060243.770.760.2075.33
Insufficiently in-depth design045840353.770.860.2375.47
Immature hoisting technology006047303.780.780.2175.62
Transport damage of precast components033579203.850.680.1876.93
Unreasonable organization065346323.760.860.2375.18
Improper site stacking and protection of components055046363.820.860.2376.50
Temporary support system with poor stability004348464.020.810.2080.44
Inappropriate mechanical equipment selection01352474.060.800.2081.17
Rising prices083660333.860.850.2277.23
Untimely delivery025254293.800.780.2176.06
Immature standardized design techniques0111368454.070.860.2181.46
Poor supplier credit and contract performance0104648333.760.900.2475.18
Insufficient developer credibility and payment ability034748393.900.840.2277.96
Tax rate fluctuations01795163.450.590.2769.05
Unsound specifications006344303.760.790.2175.18
Insufficient communication and coordination between various units561368454.040.960.2480.73
Insufficient project management experience and ability032476344.030.710.1880.58
Changes in industry-related laws and policies0153163283.760.900.2475.13
Unreasonable specialized construction plan024340524.040.870.2180.73
Incorrect transportation plan024250433.980.820.2179.56
Inadequate disclosure of technical quality and safety information051280404.130.710.1782.63
Inadequacy of component purchasing staff3133169213.670.920.2673.43
Supplier designated by developers442523272.970.930.3159.42
Table 6. Risk-assessment indicators of prefabricated buildings using EPC.
First-LevelSecond-Level
Management risk U1Insufficient project management experience and ability U11
Insufficient communication and coordination between various units U12
Unreasonable organization U13
Design risk U2Design changes U21
Unreasonable component split U22
Insufficiently in-depth design U23
Immature standardized design techniques U24
Poor design coordination U25
Procurement risk U3Poor supplier credit and contract performance U31
Quality defects of precast components U32
Incorrect transportation plan U33
Untimely delivery U34
Transport damage of precast components U35
Construction risk U4Unreasonable specialized construction plan U41
Inadequate disclosure of technical quality and safety information U42
Immature hoisting technology U43
Inappropriate mechanical equipment selection U44
Improper site stacking and protection of components U45
Temporary support system with poor stability U46
Economic risk U5Inflation U51
Rising prices U52
Insufficient developer credibility and payment ability U53
Interest rate fluctuations U54
Policy risk U6Unsound specifications U61
Changes in industry-related laws and policies U62
Natural risk U7Adverse geological conditions U71
Adverse weather conditions U72
Table 7. Correspondence between rank of judgment matrix and R I .
Rank123456789
R I 000.520.891.121.261.361.411.46
Table 8. Expert scoring standard.
CriteriaLevel
[90,100]Absolutely important
[80,89]Important
[70,79]Generally important
[60,69]Unimportant
Under 60Extremely unimportant
Table 9. The findings of the studied case.
Risk LevelFirst-Level IndicatorsWeightSecond-Level IndicatorsInterlayer Weight
3.3203Management risk U10.0864Insufficient project management experience and ability U110.5451
Insufficient communication and coordination between various units U120.2894
Unreasonable organization U130.1655
Design risk U20.2298Design changes U210.0805
Unreasonable component split U220.2071
Insufficiently in-depth design U230.3420
Immature standardized design techniques U240.2333
Poor design coordination U250.1371
Procurement risk U30.0885Poor supplier credit and contract performance U310.0576
Quality defects of precast components U320.5480
Incorrect transportation plan U330.1277
Untimely delivery U340.0961
Transport damage of precast components U350.1706
Construction risk U40.4814Unreasonable specialized construction plan U410.0877
Inadequate disclosure of technical quality and safety information U420.0962
Immature hoisting technology U430.0633
Inappropriate mechanical equipment selection U440.0619
Improper site stacking and protection of components U450.1953
Temporary support system with poor stability U460.4956
Economic risk U50.0318Inflation U510.2233
Rising prices U520.1793
Insufficient developer credibility and payment ability U530.4748
Interest rate fluctuations U540.1226
Policy risk U60.0251Unsound specifications U610.6853
Changes in industry-related laws and policies U620.3147
Natural risk U70.0570Adverse geological conditions U710.4140
Adverse weather conditions U720.5960
Publisher’s Note: MDPI stays neutral with regard to jurisdictional claims in published maps and institutional affiliations.

