Abstract
To assess the impact of the online car-hailing services on the environment in China, in this paper, we develop a model to evaluate greenhouse gas (GHG) emissions and emission reduction during the production and use of car-hailing, as a result of increased online bookings. Since energy use differs according to type of vehicle, this paper also contains different scenarios that depict degrees in the regulation stringency according to the Chinese Preliminary Rules on the Management of Online Car-Hailing, regional differences, and development of electric vehicles. The results show that, under the three different scenarios, the online car-hailing service would have the highest GHG emissions of 325, 413, or 160 MtCO2 and the highest reduction in emissions of 19.46, 25.1, or 9.48 MtCO2 by 2030. The government needs to encourage the development of online car-hailing to reduce the purchase of private cars, avoid compulsory actions to shut down online car-hailing platforms, and mandate that only electric vehicles (EVs) can be used for online car-hailing.
1. Introduction
Climate change, caused by anthropogenic greenhouse gas (GHG) emissions, will continue to pose a threat to human society and natural ecosystems. China, as the world’s largest energy consumer and carbon emitter, with an energy consumption that is projected to grow much more rapidly than in many countries in the Organization for Economic Cooperation and Development (OECD), will play a significant role in dealing with global climate change [1]. According to the World Bank database, CO2 emissions from China’s transport sector from 2005 to 2014 increased from 262.54 to 885.01 million tons in 2014, with an average annual increase of 14.46% [2]. Determining the economic feasibility of low-carbon transformations and developing the emission reduction of business traffic activities, such as online car-hailing, is crucial.
Recently, numerous procedures to reduce vehicle emissions have been discussed, including the proper use of road congestion information for traffic forecasting [3], optimizing traffic structure, improving energy efficiency, improving infrastructure [4], implementing the systemic thinking philosophy into practice [5], enhancing bus and rail systems, transforming taxi systems [6], optimizing routing and scheduling operations [7], and introducing a charging and subsidy mechanism [8].
The rapid development of online car-hailing platforms has led to an efficient way to mitigate GHG emissions [9]. According to some studies (e.g., [10,11,12]), these business models can be considered a type of sharing-based product service system (PSS) that provides environmental benefits [4,13,14]. Online car-hailing reduces vehicle vacancy rates by matching demand and idle supply [15], thereby reducing demand for private vehicles by providing a cheap and fast service [16], especially for low-income families [17], resulting in a reduction in traffic flow, fuel consumption, and emissions. The literature has mainly focused on how the emergence of online car-hailing has affected personal travel [18,19], the sales of new cars [20], taxi operations [21], and social security governance [22]. There is a lack of knowledge, though, on the specific energy-saving emission reduction capacity of online car-hailing. In addition, carbon monoxide (CO), hydrocarbons (HC), and nitric oxide (NOx) from the incomplete combustion of gasoline also have a significant environmental impact. Current research on the reduction of environmental pollution from fuels has focused on the use of biodiesel and gasoline blends [23] and exhaust gas catalysts [24,25,26]. In our study, we analyzed the impact of net-vehicles on reducing the emissions of various pollutants from a macroscopic perspective.
In China, the Preliminary Rules on the Management of Online Car-Hailing (PRMOCH) regulates the online booking of taxi-operating services and ensures the operational safety and the legitimate rights and interests of passengers. Government departments promulgated PRMOCH on 28 July 2016, so as to regulate contract cars with regard to wheelbase, displacement, and the driver’s age, their education level, the quantity of vehicles, and the number of drivers. The PRMOCH will also influence the emission reduction contribution of online car-hailing services [27]. First of all, PRMOCH vehicle age indicators affect the supply of vehicles [28]. Second, the PRMOCH vehicle displacement and wheelbase indicators affect the type of online car-hailing, which further affects the supply of vehicles. Finally, a driver’s driving record, age, and household registration allow the PRMOCH to affect the supply of car-hailing drivers. A large body of literature has explored the influence of the PRMOCH on safety, service quality [29,30], and the use of electric vehicles (EVs) [31], though there is still a significant gap surrounding its effect on energy-saving and emission reduction.
In addition, choosing between the PRMOCH, or the region, as a research object was not considered for this research, because the degree and implementation of the PRMOCH varies from region to region, as does the stock of vehicles [32,33,34]. At present, many regions strictly introduced the PRMOCH, which will limit the number of network cars to less than 1% [35]. The PRMOCH, in many local areas, has still not been implemented. For example, one of the indicators requires all online cab platforms to have a local business license. However, as of July 2018, the number of operating licenses for major online cab platforms, such as China Tricycle, Shenzhou Taxi, Shou Taxi, and E-Car, was far from adequate. This reflects the inadequate implementation of local government policies. The current situation stipulates that even though 99% of the drivers or platforms do not meet the PRMOCH standards, they continue to operate. This shows that the local governments’ efforts to implement the PRMOCH are not working. Many regions, such as Guangzhou and Foshan (Government, 2016), explicitly require car-hailing vehicles to be BVEs, which directly affects the type of car allowed. Therefore, it is necessary to show the regional impact of different PRMOCH standards on the emission reduction contribution of online car-hailing services.
Based on the analysis of the PRMOCH in 249 local areas, as well as market supply and GHG emissions, a comprehensive analysis model was designed to answer the following questions: (1) How are the GHG emissions of online car-hailing services to be quantified under the evaluation policy? (2) Considering the energy and material consumption in vehicle production, what are the long-term GHG emissions and emission reductions of online car-hailing services, and how do the PRMOCH standards affect them? (3) How does the COVID-19 epidemic affect greenhouse gas emissions and emission reductions from online car-hailing services?
The main contributions of this research are as follows: (1) This paper constructs a GHG emissions assessment model of online car-hailing services under an evaluation policy, (2) it considers the energy and material consumption in the production stage of online car-hailing when estimating GHG emissions, and (3) it analyzes the long-term development and the market penetration of online car-hailing, based on different scenarios, including different degrees of PRMOCH stringency, regional differences, and future developments of EVs.
2. Module and Scenario Design
Based on the GHG emissions assessment model, we estimate, in this paper, how regulatory stringency and policy implementations affect the market supply of online car-hailing, GHG emissions, and the reduction of online car-hailing services mandated by the PRMOCH. The comprehensive analysis model includes three parts: A restricted index selection module, a vehicle inventory calculation module, and a carbon emission calculation module (see Figure 1). In the restricted index selection module, we evaluated the use of EC and vehicle emission levels by policy and environmental factors. Finally, in the carbon emission calculation module, we evaluated carbon emissions and vehicle emission reductions.
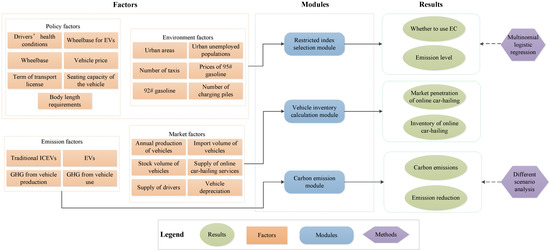
Figure 1.
Framework of the GHG emissions assessment model of an online car-hailing service.
The purpose of the restricted index selection module was to calculate the selection probability of car-hailing types, by 2030, in three scenarios. The vehicle inventory calculation module was used to calculate the market penetration and inventory of online car-hailing by 2030, and the carbon emission calculation module calculated the carbon emission and emission reductions.
The variables used in the equations are shown in Table 1, including parameters, symbols, parameter values, and variable explanations.

Table 1.
Variable description.
Table 1.
Variable description.
| Parameter (Unit) | Symbol | Value | Explanation and References |
|---|---|---|---|
| Selection probability (%) | P | / | Retrieved from multivariate logit (mlogit) selection model |
| Multivariate logit regression | V | / | From our calculation |
| Sales of vehicles (unit) | Sales | / | Reference [36] |
| Stock of vehicles (unit) | stock | / | Retrieved from CEIC database and different PRMOCH requirements |
| Private vehicle survival rate (%) | Sr | / | The coefficients were derived from research by Han et al. (2011) |
| Well-to-tank stage (L) | WTT | / | Reference [37] |
| Tank-to-wheel stage (L) | TTW | / | Reference [37] |
| Replacement coefficient of online car-hailing | Pre | 0.06 | Retrieved from the research report of China International Capital Corporation Limited (CICC) |
| Average annual mileage (km) | VKT | 18,000 | Reference (China’s Technical Guidelines for the Preparation of Air Pollutant Emission Inventory for Road Vehicles) |
| GHG emission reduction | ER | / | From our calculation |
| GHG emissions of online car-hailing | EC | / | From our calculation |
2.1. Restricted Index Selection Module
The restricted index selection module used the multivariate logit (mlogit) selection model to calculate the probability of selecting alternatives. The module extracted two explained variables from the PRMOCH: the fuel vehicle displacement type (1–1.6 L, 1.6–2 L, or >2 L) and whether or not to use EVs (dummy = 1 if it is an EV; otherwise, dummy = 0). The explanatory variable for this paper included policy factors and control variables. Using stepwise regression, we extracted the following seven key policy indicators from 31 PRMOCH standards, as shown in Appendix A. The 249 local PRMOCHs reflected different levels of regulation stringency. This paper invited 25 policy review experts, including five staff members of DiDi, who work in cooperation with government departments, and 20 online car-hailing drivers, to evaluate the directionality of the strictness of the seven indicators. Then, the PRMOCH standards of 249 cities were compared in order to find the stringency levels of each indicator. The more favorable the policy was for reducing the number of online vehicles, the more stringent the regulation was. For instance, some city policies required vehicles with a wheelbase of 2700 mm to register, which greatly reduced the market supply of online cars. This kind of policy is stricter than a policy of specifying a wheelbase of 2200 mm. The policy factors included driver requirements (health conditions) and vehicle requirements (wheelbase, EV wheelbase, price, term of transport license, seating capacity, and body length). The control variables were the urban areas, the unemployed urban populations, the number of taxis, prices of 95- and 92-octane (95# and 92#) gasoline, and the number of charging piles.
The probability P(j) is the selection probability and refers to the probability that the consumer selects the j displacement type of vehicle. The probability P(j) was calculated by a binomial distribution, with the assumptions that the probability term in the discrete choice model obeys a mean of 0 and that the variance is , as shown in Equation (1) [38,39,40].
The calculation formula of is shown in Equation (2). refers to the weight of explanatory variables j.
2.2. Vehicle Inventory Calculation Module
The vehicle inventory calculation module uses the vehicle survival formula to calculate the annual stock of vehicles of different ages and displacements according to the annual production and import volume of each displacement type. Then, combined with the market supply of drivers and the selection probability, the market penetration of online car-hailing is calculated. It is worth noting that policy has restricted the age of the online cars to one year, three years, and six years. Finally, this module calculates the inventory of the online car-hailing market for each year. The supply probability of drivers was estimated by the ratio of car-hailing drivers to city drivers, the data for which were provided by the research report and the companies’ annual reports.
The annual stock of cars was influenced by the survival and purchase rates of cars, which gave dynamic stock functions for two different cars:
represents the stock of fuel vehicles with a level j displacement in year z, and represents the stock of pure electric vehicles in year z. The private vehicle survival rate is calculated by , where t represents the vehicle age. The vehicle age is an important indicator regarding application constraints. According to the PRMOCH standards, the online car-hailing market has a classification of one year (the policy share of a one-year-old vehicle is 12%), two years (6.5%), three years (34%), six years (27%), and eight years (1.7%) for the vehicle age. Based on the perspective of the regulatory stringency of the policy, the policy requiring the vehicle age of one year is the most stringent, which means that only new cars can be used as online car-hailing vehicles; the policy requiring a vehicle age of eight years is the least stringent. Therefore, in this paper, we chose three categories with a large number of policies: strict (vehicle age is one year), moderate (vehicle age is three year), and less strict (vehicle age is six years. T and k represent the characteristic parameters, and the coefficients were derived from research by Han et al. (2011) for the Chinese market [41]. If represents the share of online car-hailing in year z, then the number of call orders for all types of cars is:
2.3. Carbon Emission Impact Module
This module calculates the carbon emissions of online car-hailing services by estimating the market penetration of EVs under the influence of the PRMOCH.
In measuring the amount of annual energy consumption, the well-to-wheel method is used to study fuel consumption in the production phase, as well as the driving phase of the vehicle. Well-to-wheel (WTW) studies review the life cycles of energy carriers (gas or electricity) and the WTW life cycle can be subdivided into two stages: well-to-tank (WTT), which focuses on the fuel supply chain, and tank-to-wheel (TTW), which covers the vehicle operation [37].
ECθ,z,t is the amount of annual energy consumption due to online car-hailing in year y, and θ refers to the type of vehicle (gas or EV). S(new)z,t denotes the number of new online car-hailing vehicles across t years in year z. Salesz denotes the sales of new cars in year z. Stockz,t denotes the number of minibuses used across t years in year z. Sz,t denotes the number of online car-hailing vehicles used across t years in year z. WTTθ,z denotes the GHG emissions in the production links of vehicles of type θ. TTWθ,z denotes the GHG emissions in the production links of vehicles of type θ in year z. VKT represents the average annual mileage due to online car-hailing, which is the same as the amount for taxis. China’s Technical Guidelines for the Preparation of Air Pollutant Emission Inventory for Road Vehicles show that the annual average mileage of a taxi is 18,000 km.
2.4. Equivalent Computing
Online car-hailing platforms will increasingly reduce the number of low-income families who plan to purchase cars [42] as it offers an alternative that can reduce the car purchase demand by shifting that demand to sharing [43]. According to the report of the China International Capital Corporation Limited (CICC), 6% of non-vehicle owners agreed that online car-hailing replaced private cars, but among vehicle owners, the percentage was 30%. In this paper, which only concerns non-vehicle owners, the non-purchase of private cars was due to the appearance of online car-hailing. We define the conversion rate of the car as:
where Sre indicates the number of online cars that have been reduced due to the replacement effect, Pre indicates the replacement coefficient of online car-hailing, and Pre = 0.06. Therefore, we obtained the GHG emission reduction of the ERz and GHG emissions of online car-hailing ECz:
3. Data
3.1. Explanatory Variables
The strictness of the seven policy indicators is shown in Table 2. The forecast for policy indicators, up to 2030, follows these principles: the later the policy is promulgated, the stricter it is usually applied; some corrected PRMOCH standards were also stricter than the original policies. Accordingly, the trend of regulation stringency is expected to increase over the years. For example, the PRMOCH standards of Wuhan and Changsha were released on 31 October 2016, and 11 April 2017, respectively. The PRMOCH of Wuhan does not require car insurance, but the PRMOCH of Changsha requires car insurance that costs over CNY 1,000,000. The average strictness of policies issued before June 2017 was 48.12. After June 2017, the average was 36.15).
Table 2.
Policy requirement under different levels of regulatory stringency.
3.2. Control Variables
3.2.1. Urban Registered Unemployment
The new economic model of online car-hailing has slowed the urban unemployment rate, which ultimately affects the PRMOCH. The higher the rate, the less likely the government is to enforce supervision [28] because online car-hailing has created a large number of new jobs. According to data provided by [44], Uber creates about 50,000 new jobs every month. Considering the amount of registered urban unemployed from 2014 to 2017 in 249 cities (see Table 3, third row), the average annual growth rate is 1.7%, and the registered urban unemployed are estimated to reach an average of 21,090 people per city by 2030.
Table 3.
Main driving factors of the market environment.
3.2.2. Number of Taxis
As a natural competitor, taxis play a vital role in the development of the online car-hailing market. Even though this market was legalized over the objections of taxi drivers, they continue to pressure the government through strikes, which results in stricter policies affecting online car-hailing [28]. Strict policy regulation requires various indicators, such as vehicle displacement, to control the number of net car restrictions. By the end of 2014, 8428 taxi enterprises were in operation nationwide with 126,292 self-employed taxi drivers and 2.6 million employees. Although the number of private cars is increasing, insufficient parking spaces and license plate rationing make taxis an urban necessity. Considering the number of taxis in the 249 cities (see Table 3, third row), the average annual growth rate was between 3 and 4%. We estimate that in 2030, 4390 taxis per city will be in operation.
3.2.3. Gasoline Price
The gasoline price is an important factor affecting the decision to purchase cars [45,46], and vehicle displacement is related to vehicle fuel consumption, where the larger the displacement, the more fuel is consumed, and the higher the carbon dioxide emissions. We estimate that the price of oil in China will climb steadily higher, which will do the same to the price of gasoline [47]. After analyzing the trend from 2015 to 2018, we determined that the 95- and 92-octane gasoline price growth rate was 1.01%, which suggests that prices will be CNY 8.8/L for 95 and CNY 8.3L for 92 in 2030 [48].
3.2.4. Numbers of Charging Piles
The charging power and battery size of EVs determines their development [49], which further affects the stock of online cars and policy requirements. Fast charging may become economically viable very quickly, and according to data from the Star Charge app, the 249 cities had a total of 18,540 charging piles, with an average of 86 per city, as of August 2018. Furthermore, the China Electric Vehicle Charging Infrastructure Promotion Alliance reported that from July 2017 to June 2018, the number of charging piles increased by 58.4% [50]. However, the charging infrastructure is far behind EV sales. The ratio of BCs to charging piles is about 10:1, which is far from meeting demand. Therefore, central and local governments have formulated policies to encourage the construction of charging pile infrastructure. Based on the environment, we estimated a 12% annual growth rate, and by 2030, these 249 Chinese cities should each have an average of 888 charging piles.
3.3. Predetermination Factors
3.3.1. Automobile Stock
Most online car-hailing services are registered and operated by private car owners, the stock of which directly affects market penetration. By 2030, China’s car sales and stock will have grown rapidly. Auto sales are divided into two types: new purchases and replacements [51]. A greater share of replacements increases the maturity of the automotive market. In the United States, where the market is mature, more than 99% of car sales are replacements. China’s auto market is still dominated by new purchases, but more replacement consumption is expected. Wu et al. (2014) used the Gompertz function of GDP per capita and vehicle stock to forecast vehicle ownership through to 2030, and the results showed that China’s vehicle stock will be 5.13 times what it was in 2012 [52]. By sorting the sales data of private cars from 2009 to 2015, we estimated that the survival time of each car is six years and that, by 2030, China’s vehicle stock will be 246,563,120.
3.3.2. Market Supply of Drivers
The probability of driver availability in the online car-hailing market was measured by the ratio of the number of active online car drivers to the total number of community drivers per year from 2014 to 2017, when online car-hailing was already popular. During this period, most PRMOCH standards had not been fully enacted, so there was no need to consider their impact, and, thus, using the abovementioned ratio was reasonable. As a popular peer-to-peer platform with strong network externality, DiDi has attracted many users through the Internet’s fast feedback mechanism [53]. According to [20], more people will join the platform to become network drivers and loyal passengers. Some even buy cars specifically to become drivers [54]. In 2016 and 2018, the number in China was 310 million [55] and 328 million [56], respectively. The numbers of drivers registered with the online services were 21.08 million [57] and 30.66 million [57,58], respectively, accounting for 4.84 and 9.35% of all drivers.
However, the registered drivers for online car-hailing are not active enough, and their mileage does not reach the average annual mileage of taxi drivers. Beijing had 1.1 million registered drivers and 200,000 active drivers for DiDi in 2017 [59]. In addition, frequent deaths, because of hitchhiking, caused the number of drivers to decrease (e.g., the Zhengzhou and Wenzhou murders) [60]. However, we estimated that the total market supply of DiDi drivers will increase from 4.8% in 2018 to 8% in 2030, and the total supply of online car-hailing drivers should increase by 6.4% per year.
3.3.3. EV Sales
The government vigorously advocates for the popularization of EVs, but some local governments only allow EVs to register as online vehicles. Therefore, the development of EVs directly affects the stock of vehicles and the market penetration of online car-hailing.
Because of government subsidies, business model innovations, and trends in global energy conservation and emission reduction, the development of EVs in China is expected to grow significantly [61], and EV sales are expected to reach 2 million by 2020 [53] (see Table 4). Huge subsidies from central and local governments, and non-monetary incentives (e.g., restrictions on vehicle ownership in Beijing and elsewhere), are major reasons for the rapid leap. Meanwhile, business innovations and vastly expanding supplies have helped accelerate EV sales and infrastructure. Since EVs are cheaper to run than gasoline vehicles, the global EV stock will reach 30 million by 2030, and China will lead this transformation. By 2030, its auto sales should account for nearly 50% of the global EV market, which is currently 15 million [62].
Table 4.
Data regarding the predetermined factors.
3.3.4. GHG Emissions
In this paper, GHG emissions were mainly taken from [37,63,64,65,66,67]. It was assumed that the life cycle of a vehicle was 14.1 years, with an annual driving distance of 14,865 km [37]. Combined with the above data, it was concluded that in the WTT stage, the amount of carbon dioxide emitted by EVs and gasoline vehicles were, respectively, 8.38 and 10.48 t. The emissions of EVs in the TTW stage differed based on different modes of electric power production. Emissions generated by coal, liquefied natural gas, wind, and diesel were 175, 104, 2, and 145 g/km, respectively. In the TTW stage, emissions of gasoline vehicles were 139.6 g/km, based on the European emission standards for passenger cars.
4. Results
4.1. Calculating the Selection Probability of the Displacement Type of Vehicle
In this study, we used a multivariate logistic regression model to analyze the choice of behavior of the displacement type of vehicles based on the PRMOCH of online car-hailing, and we calculated the selection probability. Table 5 lists the regression results that used Level 1 (1–1.6 L), Level 2 (1.7–2 L), and Level 3 (>2 L) as control groups. The IIA results show that each λ2 was non-negative, and the model passed the Hausman test; thus, the use of a multivariate logistic regression model was appropriate. Because of the large sample size of Level 1, we used it as a reference item and focused on analyzing the first set of regression results. The sensitivity analysis of multivariate logit regression is shown in Table A2 (see Appendix B).
Table 5.
The result of the selection of displacement type of vehicles by PRMOCH.
The estimation results showed that strict PRMOCH standards increases the probability of market selection for large displacement vehicles. For example, PRMOCH standards that require drivers to be healthy directly increase the buying probability for large displacement vehicles. More specifically, policies that require drivers to have health certificates increase the probability of selection by 77% for Level 2 and by 76% for Level 3 vehicles at a significance of 10%. With an increase of CNY 10,000 in price, the selection probabilities of Level 2 and Level 3 vehicles would fall by 75.34 and 21.17%, respectively. In addition, an increase in the number of unemployed people and taxis can promote the choice of small displacement vehicles in the market. For each additional unemployed population or taxi, the probability of choosing a Level 1 vehicle increases by 0.017% and 0.020%, respectively. Because stricter PRMOCH standards and regulations promote large displacement vehicles, they affect GHG emissions.
4.2. Market Penetration and Changes under Different Policy Implementations
In Scenario 1, local PRMOCH convergence was assumed to be uniform. Although local PRMOCH standards differ somewhat, they essentially converge with the country’s PRMOCH. For example, the national PRMOCH requires seven seats or fewer, and 217 local governments apply the same standards. However, 23 local governments set the policy at five to seven seats; nine local governments have not yet come up with detailed policies; and 87.14% of cities have the same policies as the PRMOCH. Although 9.23% of the policy texts seem different, they all refer to common, small, private vehicles.
In Scenario 2, we introduced the condition in which the PRMOCH for first- and second-tier cities was stricter than for those of the third, fourth, and fifth tiers. We distinguished three different levels of regulatory stringencies in first- and second-tier cities, (strict, moderate, and less-strict). For the third- and fourth-tier cities, only one level of regulatory stringency (moderate) was adopted. Among the 249 cities, 48 were first- and second-tier, and 201 were third-, fourth-, and fifth-tier. According to the distribution of the certified drivers announced on the Wheel Violation website for 2016, drivers in the first two tiers accounted for 57% nationwide, and those in the other three tiers accounted for 43%.
In Scenario 3, first- and second-tier cities gradually adopted the EV replacement policy, which meant that only EVs could be used. A city that encouraged or advocated the use of EVs in the PRMOCH was regarded as a city that chose EVs as its form of online car. It is expected that, by 2030, these 49 first- and second-tier cities will operate online car-hailing businesses with EVs.
4.2.1. Market Penetration of Online Car-Hailing
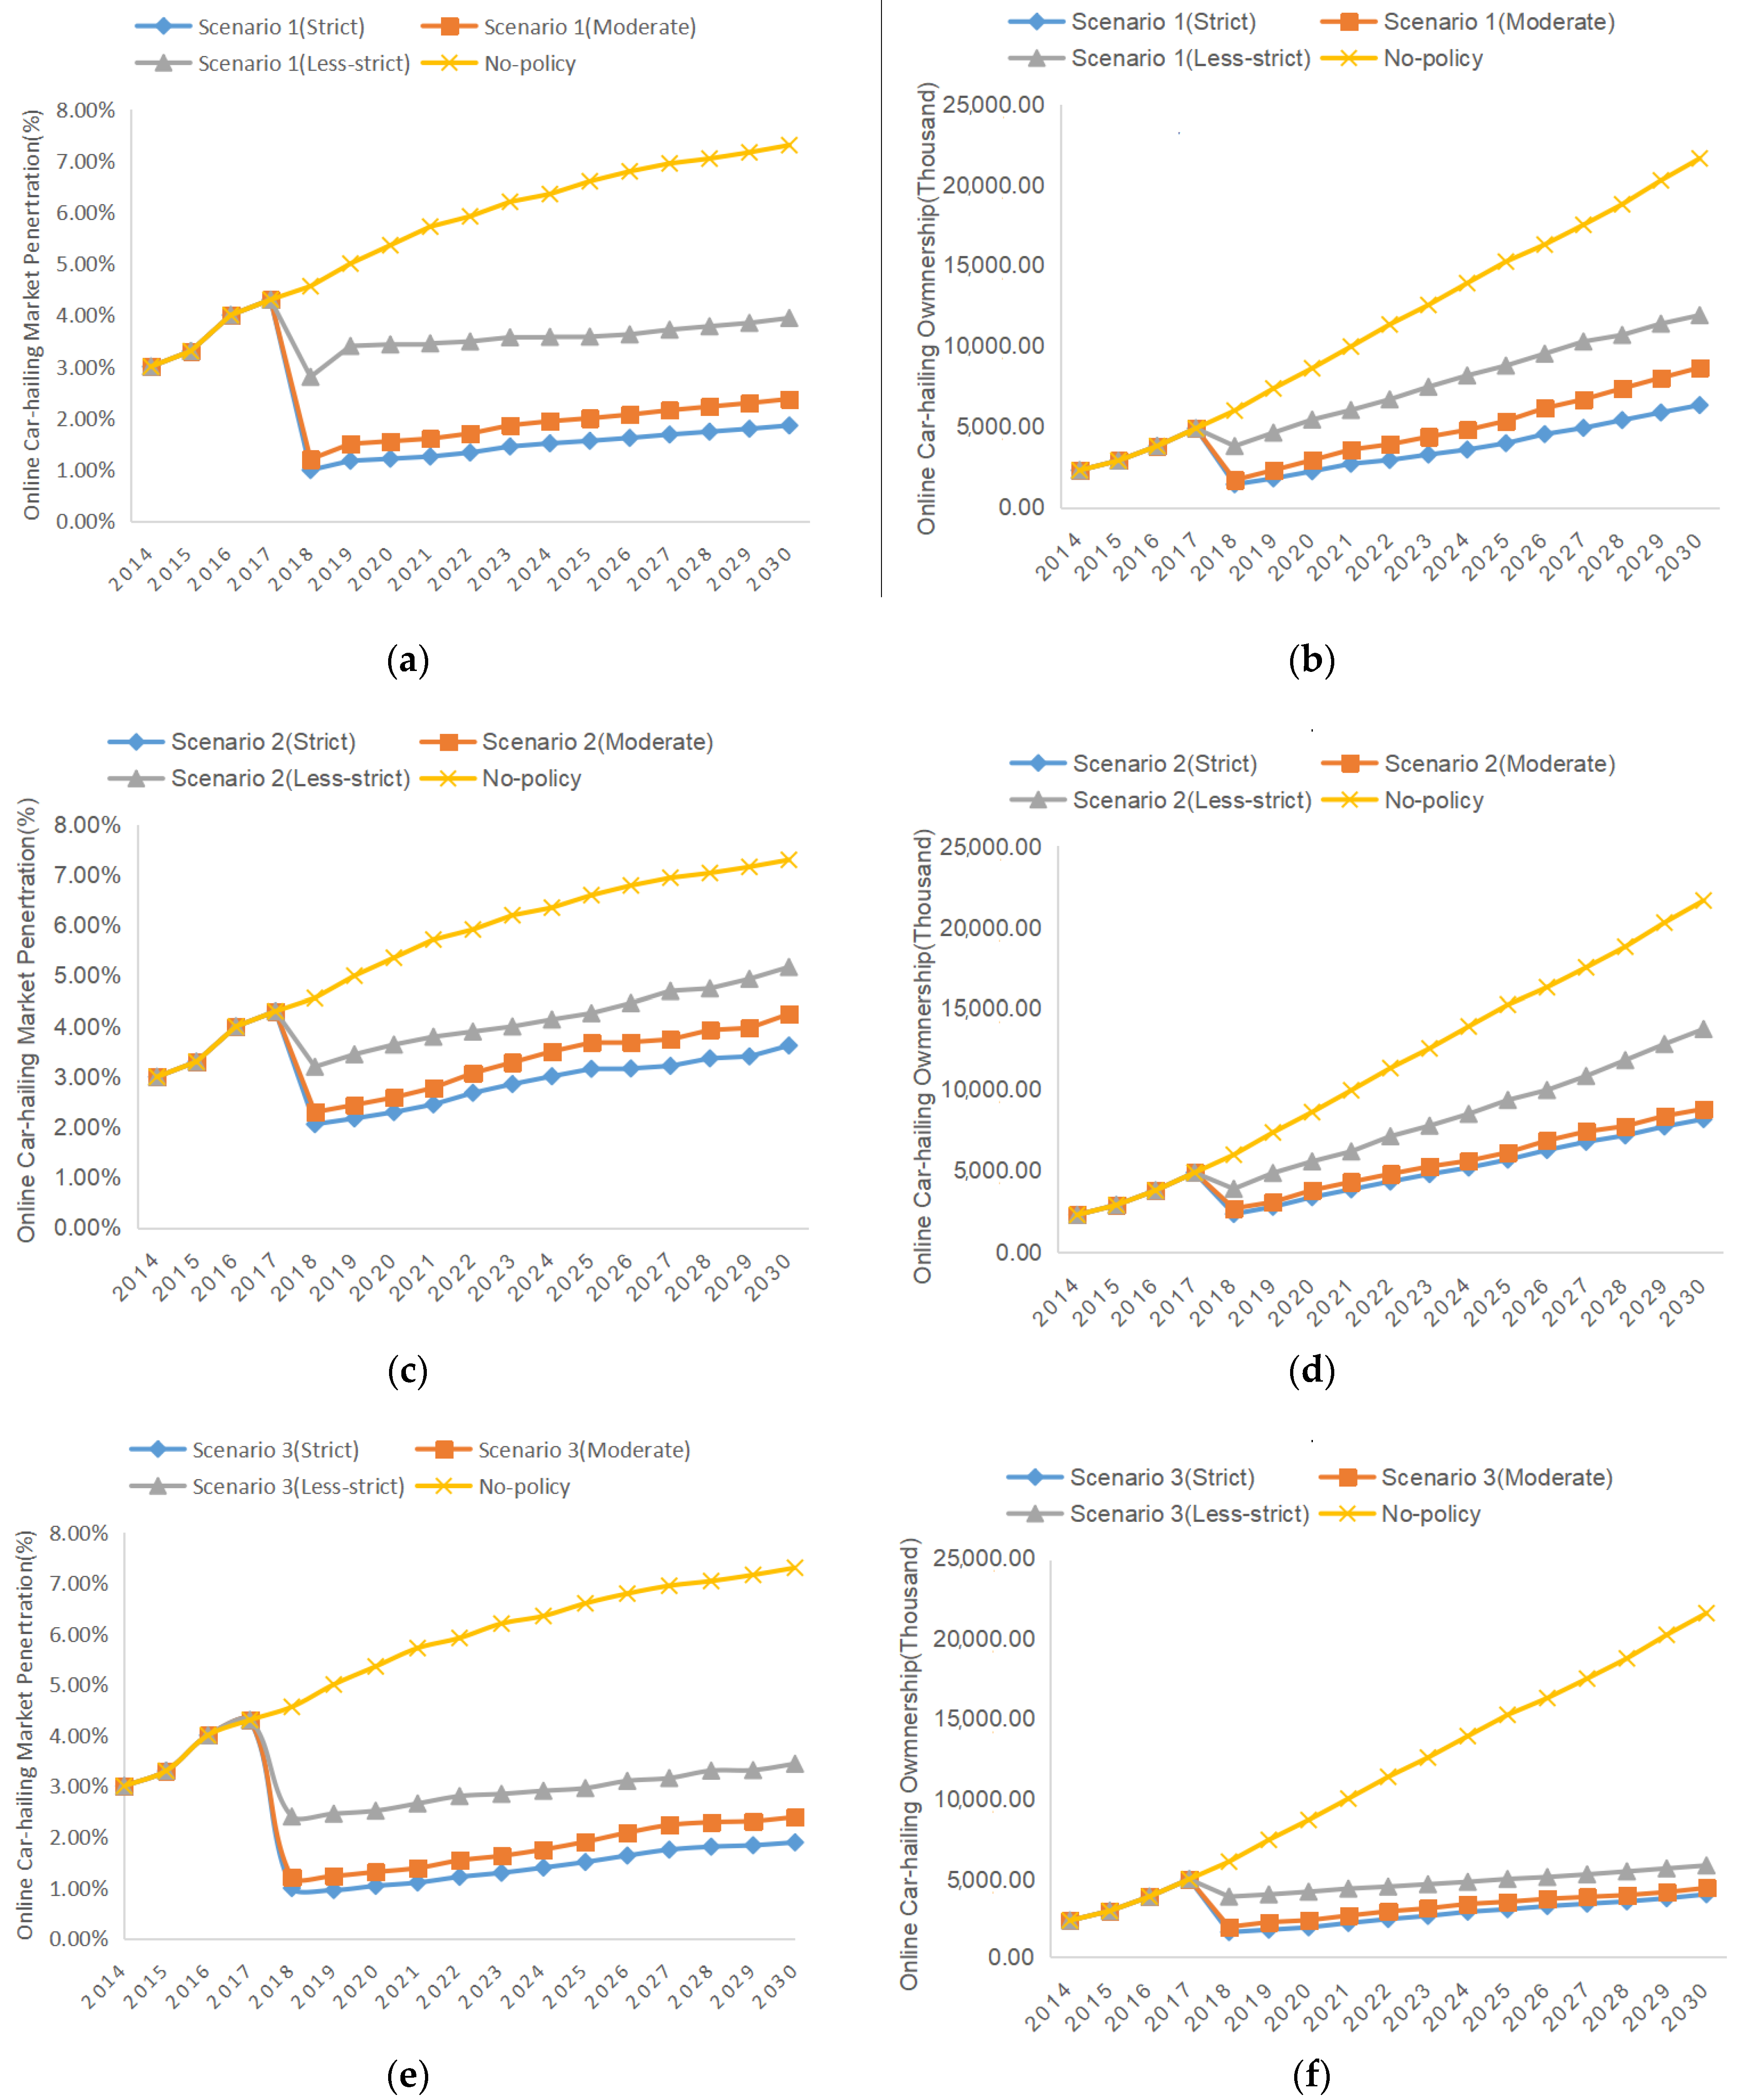
Based on the annual online car-hailing stock and displacement selection probability, a vehicle inventory calculation module was used to calculate the market penetration from 2014 to 2030, as shown in Figure 2, which depicts the market penetration of online car-hailing in different scenarios. Regulatory stringencies had the greatest impact on the market. Since Uber entered the Chinese market in 2014, when no policy regulations existed, their market penetration increased by 6.4% annually (the top line of each image in Figure 2). In Scenario 1, under the strict policy, market penetration was close to 0. In this case, the average number of online car-hailing units in each city was below 10,000 (see Figure 2a,b) because fewer vehicles were compliant, resulting in lower market penetration. Moreover, most car owners quit because of the high cost of violations.
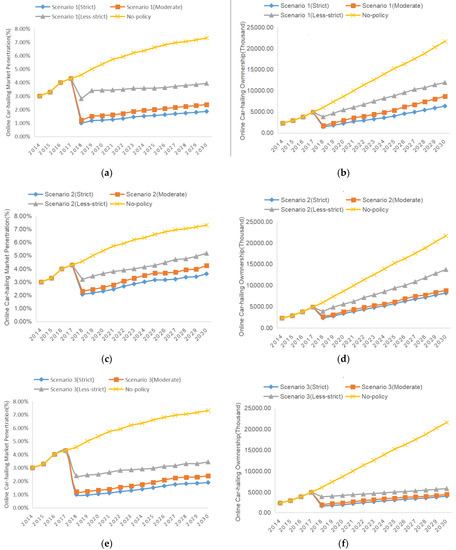
Figure 2.
(a) Annual market penetration of online car-hailing in Scenario 1, (b) Ownership of online car-hailing vehicles in Scenario 1, (c) Annual market penetration of online car-hailing in Scenario 2, (d) Ownership of online car-hailing vehicles in Scenario 2, (e) Annual market penetration of online car-hailing in Scenario 3, (f) Ownership of online car-hailing vehicles in Scenario 3.
A comparison of Figure 2a,c shows that the difference in market penetration among the three regulatory categories in Scenario 2 was less than for Scenario 1. The reason is that people in the first- and second-tier cities were more inclined to choose a vehicle with a displacement greater than 3L under the strict policy regulation, while the vehicle’s share of stock at this emission level in China is 0.1%. On the other hand, in Scenario 2, implementing strict policies in the first- and second-tier cities moderately affected the energy consumption of online car-hailing across the country.
In Scenario 3, under the less-strict policy, the online car-hailing penetration rate gradually increased by 2020 and then progressively decreased from 2020 to 2030 (see Figure 2e). Under the strict EV replacement policy, people had to choose EVs for online car-hailing. Furthermore, under the other EV subsidy policies, the increasing number of EVs provided protection for the public’s choice. However, the strict EV replacement policy had positive external incentives to increase the number of EVs and charging piles. On the other hand, under the less-strict policy, inconvenient charging and low subsidy levels led to a rise in EV purchase costs, which led to drivers rejecting EVs for online car-hailing. Therefore, the market penetration rate of the online car-hailing market gradually decreased.
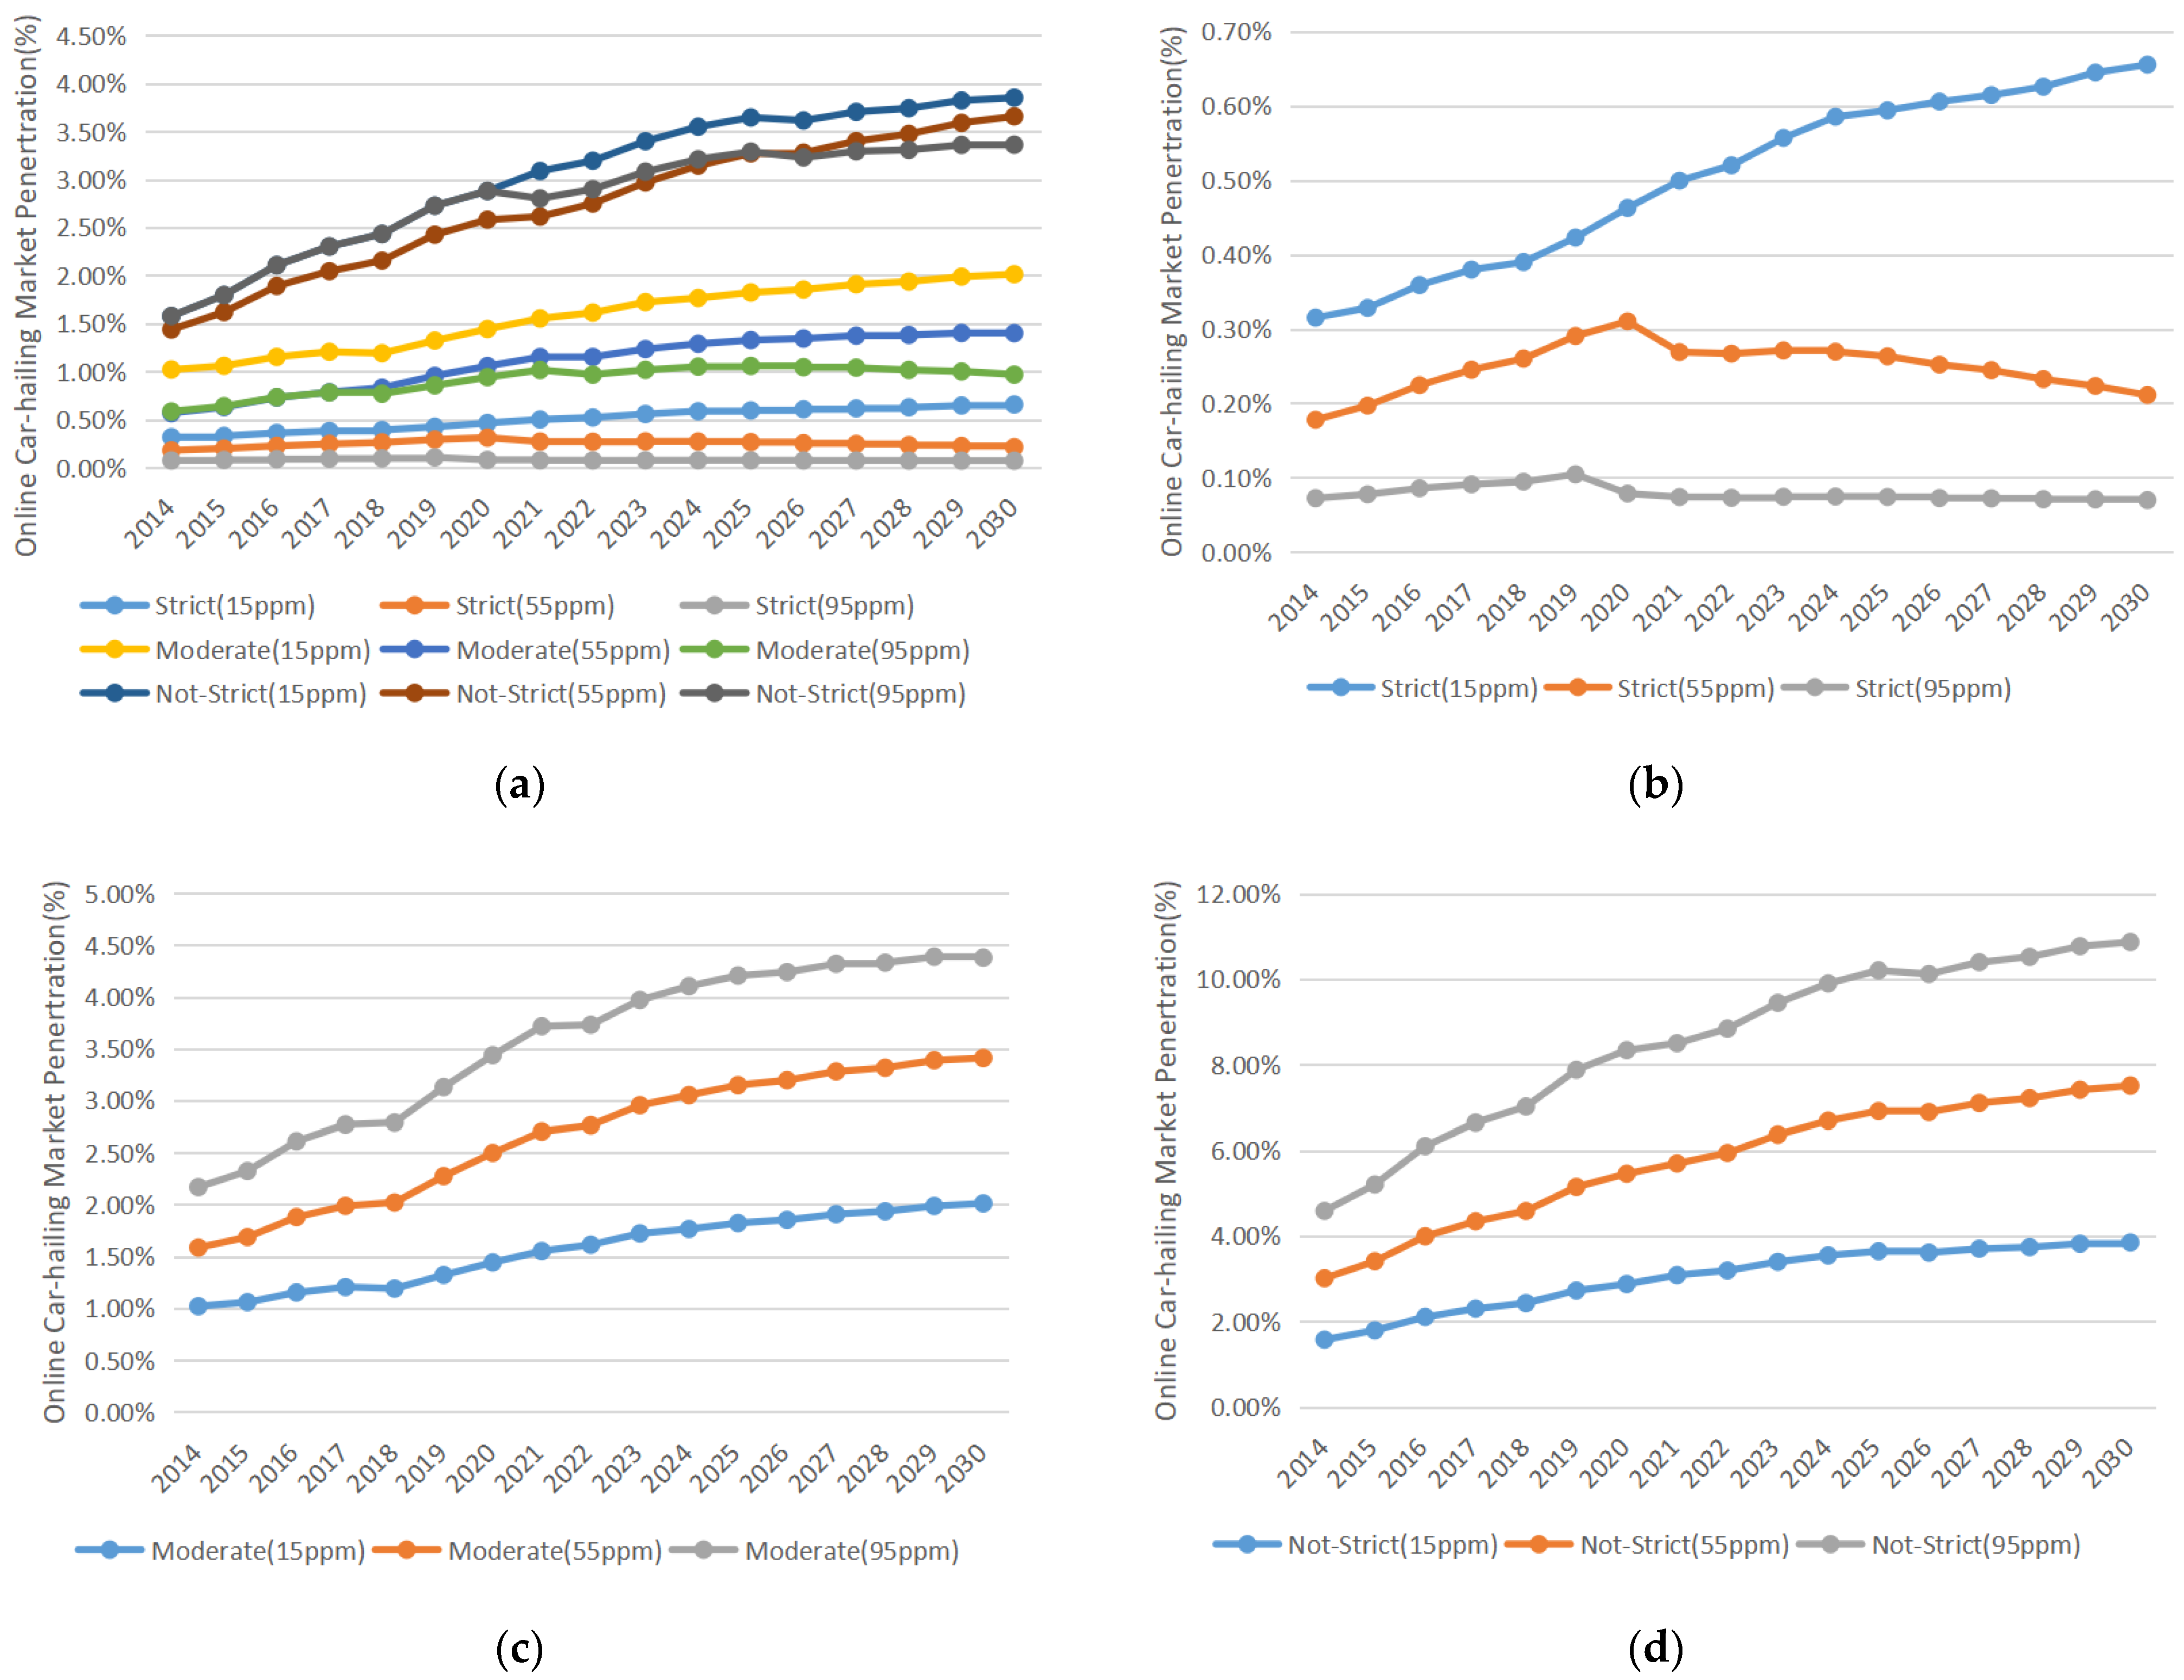
4.2.2. Changes in Market Penetration under Different Policies
As shown in Figure 3, we considered policy alignment across the nation and compared three levels of regulatory stringencies containing three types of policy implementations, such as the 15 ppm policy (implementing one policy indicator: driver health requirement), the 55 ppm policy (implementing four policy indicators: driver health, vehicle seating capacity, driving license term, and the new energy vehicle wheelbase), and the 95 ppm policy (implementing all six policy indicators, with the addition of vehicle price and body length to the 55 ppm policy).
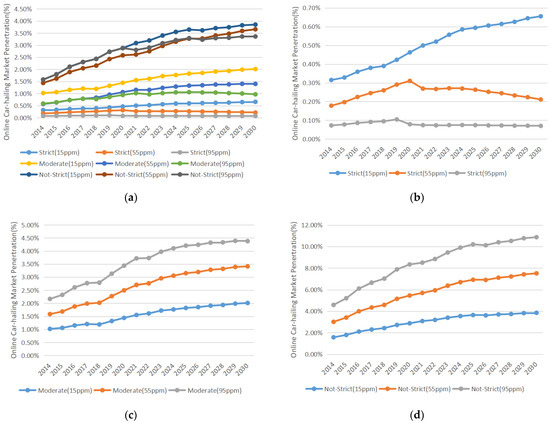
Figure 3.
(a) Annual market penetration of online car-hailing based on varying degrees of policy imple-mentation in Scenario 1, (b) Annual market penetration of online car-hailing based on strict policy implementation in Scenario 1, (c) Annual market penetration of online car-hailing based on mod-erate policy implementation in Scenario 1, (d) Annual market penetration of online car-hailing based on not strict policy implementation in Scenario 1.
When more policy indicators are implemented, the market penetration of online car-hailing gradually decreased. This phenomenon was more obvious under the moderate- and strict-policy conditions (see Figure 3b,c). This change could be as much as 1.1% of market penetration.
Different policy implementations have obvious effects on the management and control of the number of online car-hailing units, but these are less evident than those from regulatory stringencies, as depicted in Figure 3. If the policy enforcement rises from 15 ppm to 95 ppm, then the maximum market penetration rate will decrease by 0.5 percentage points, 1.1 percentage points, and 0.5 percentage points in the strict, moderate, and less-strict markets, respectively. However, on the whole, the strict market policy is more effective for reducing the market penetration of online car-hailing.
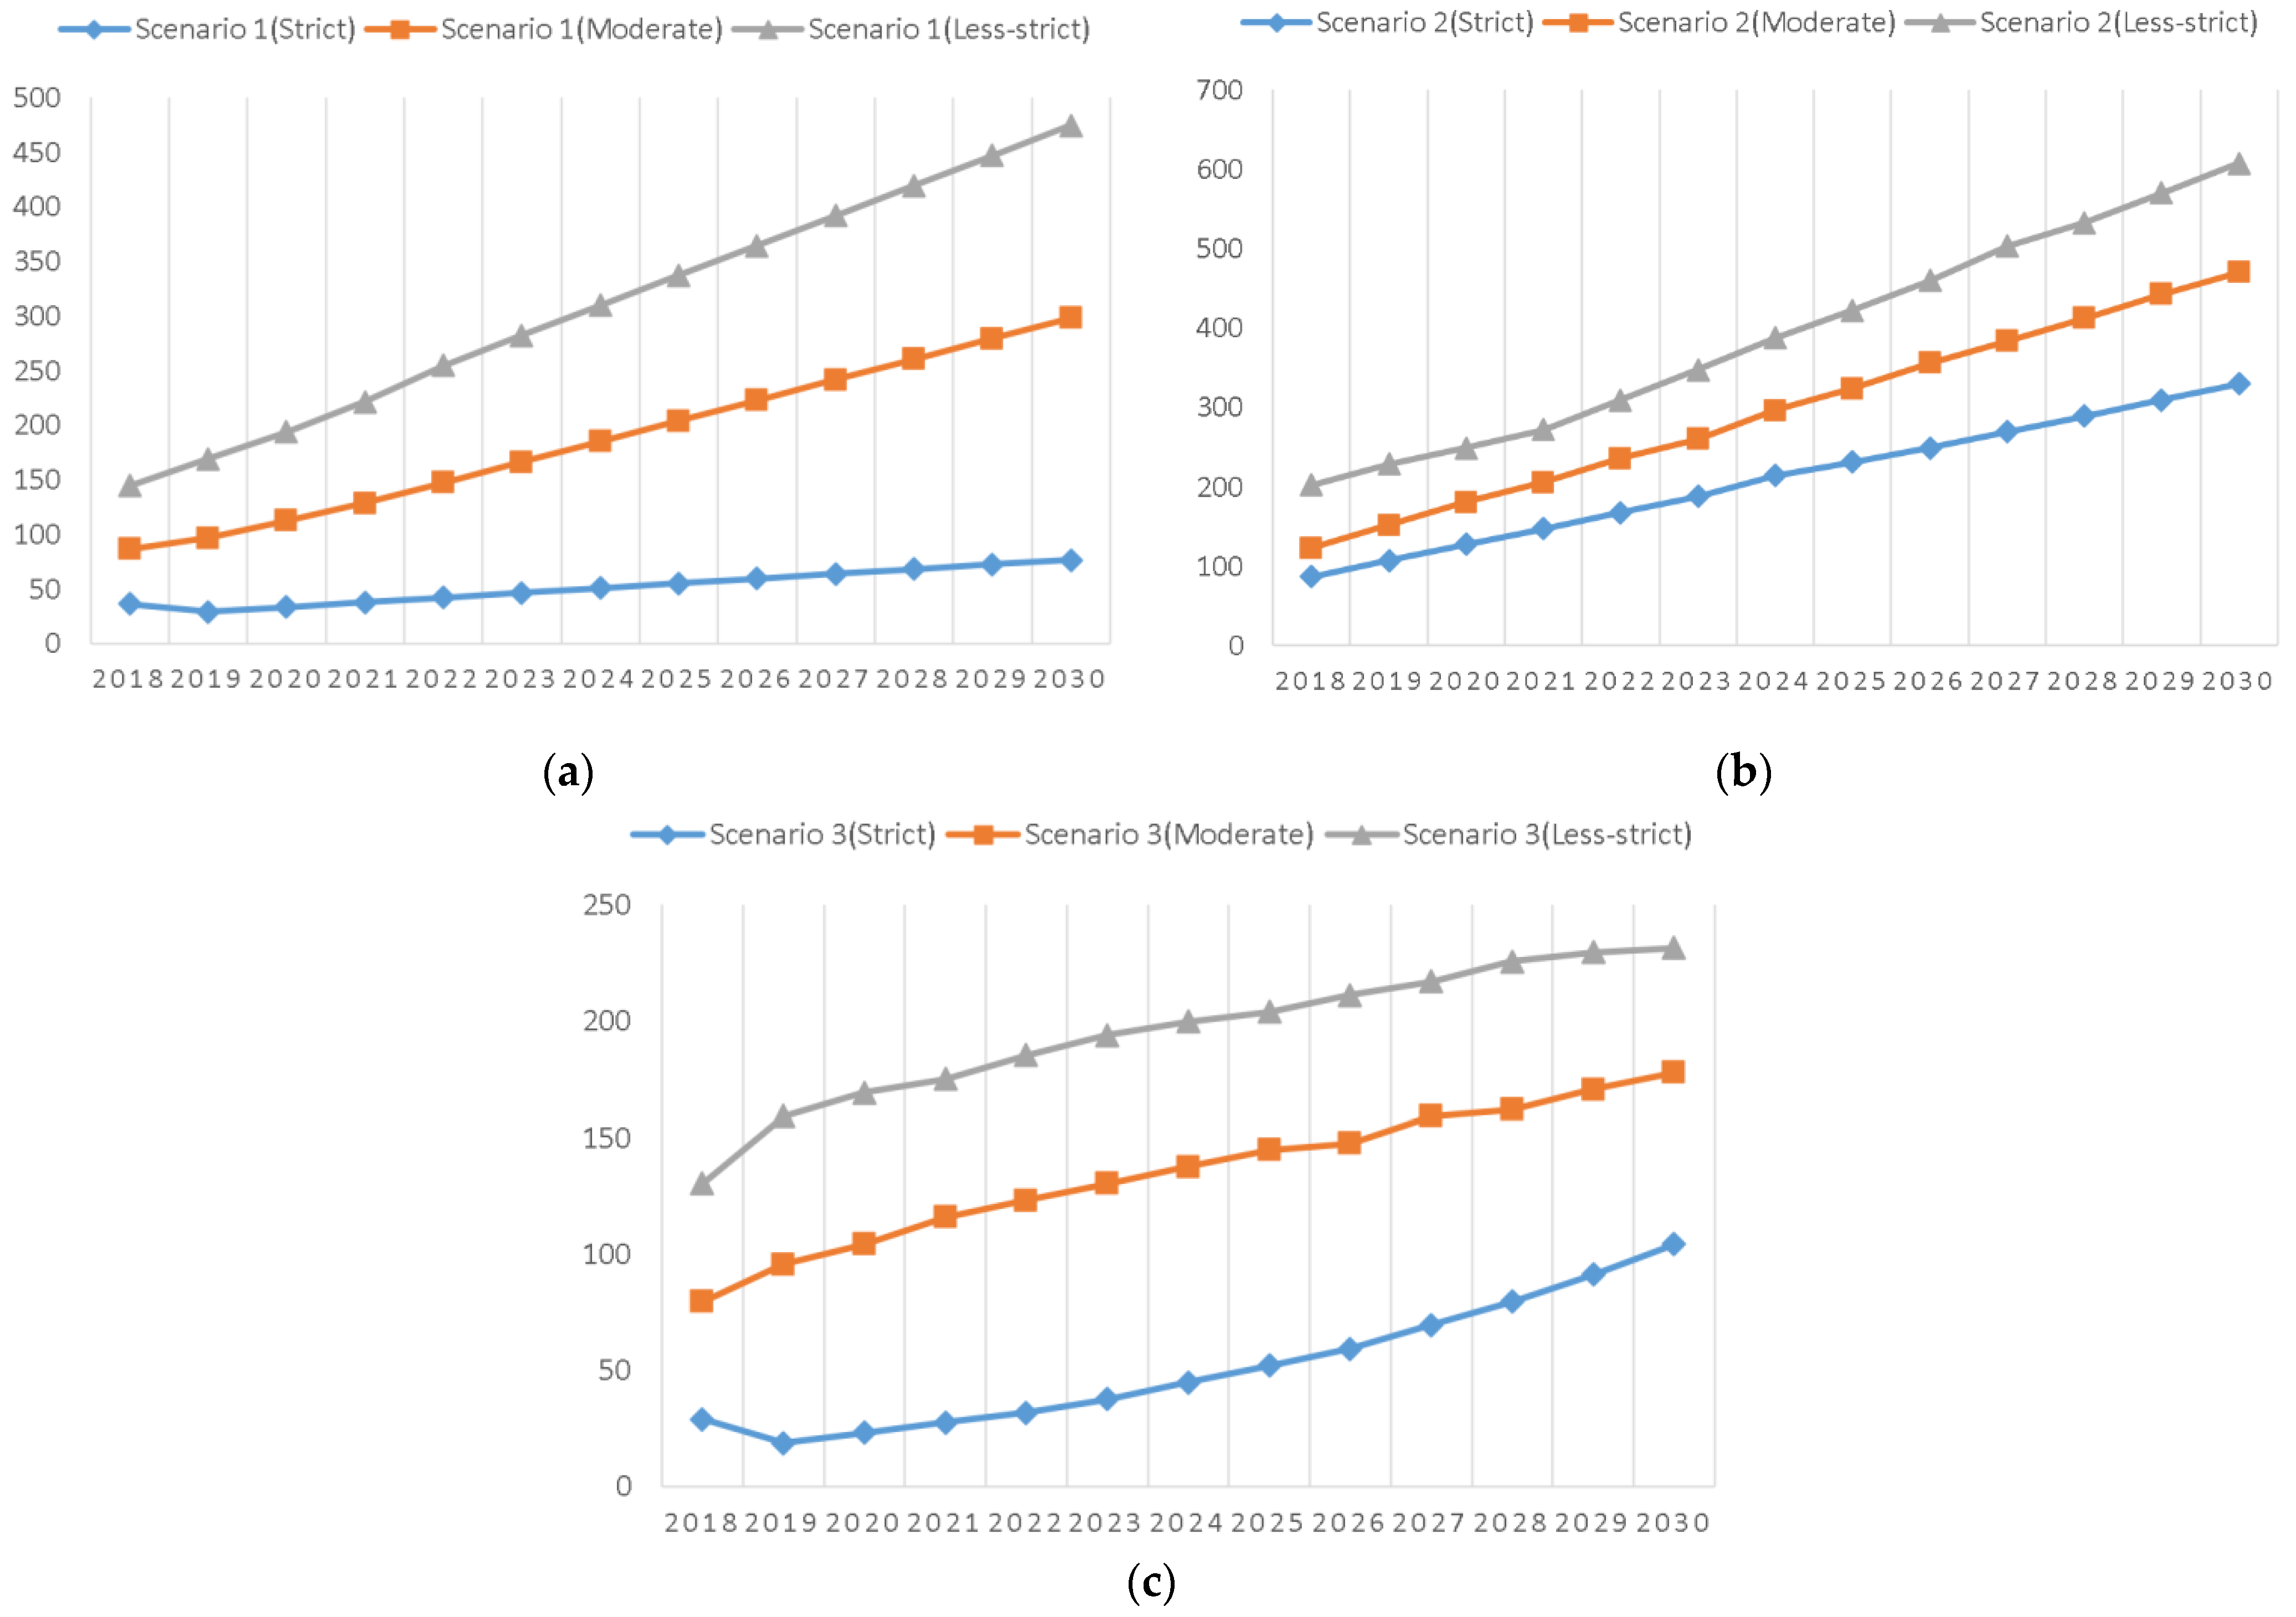
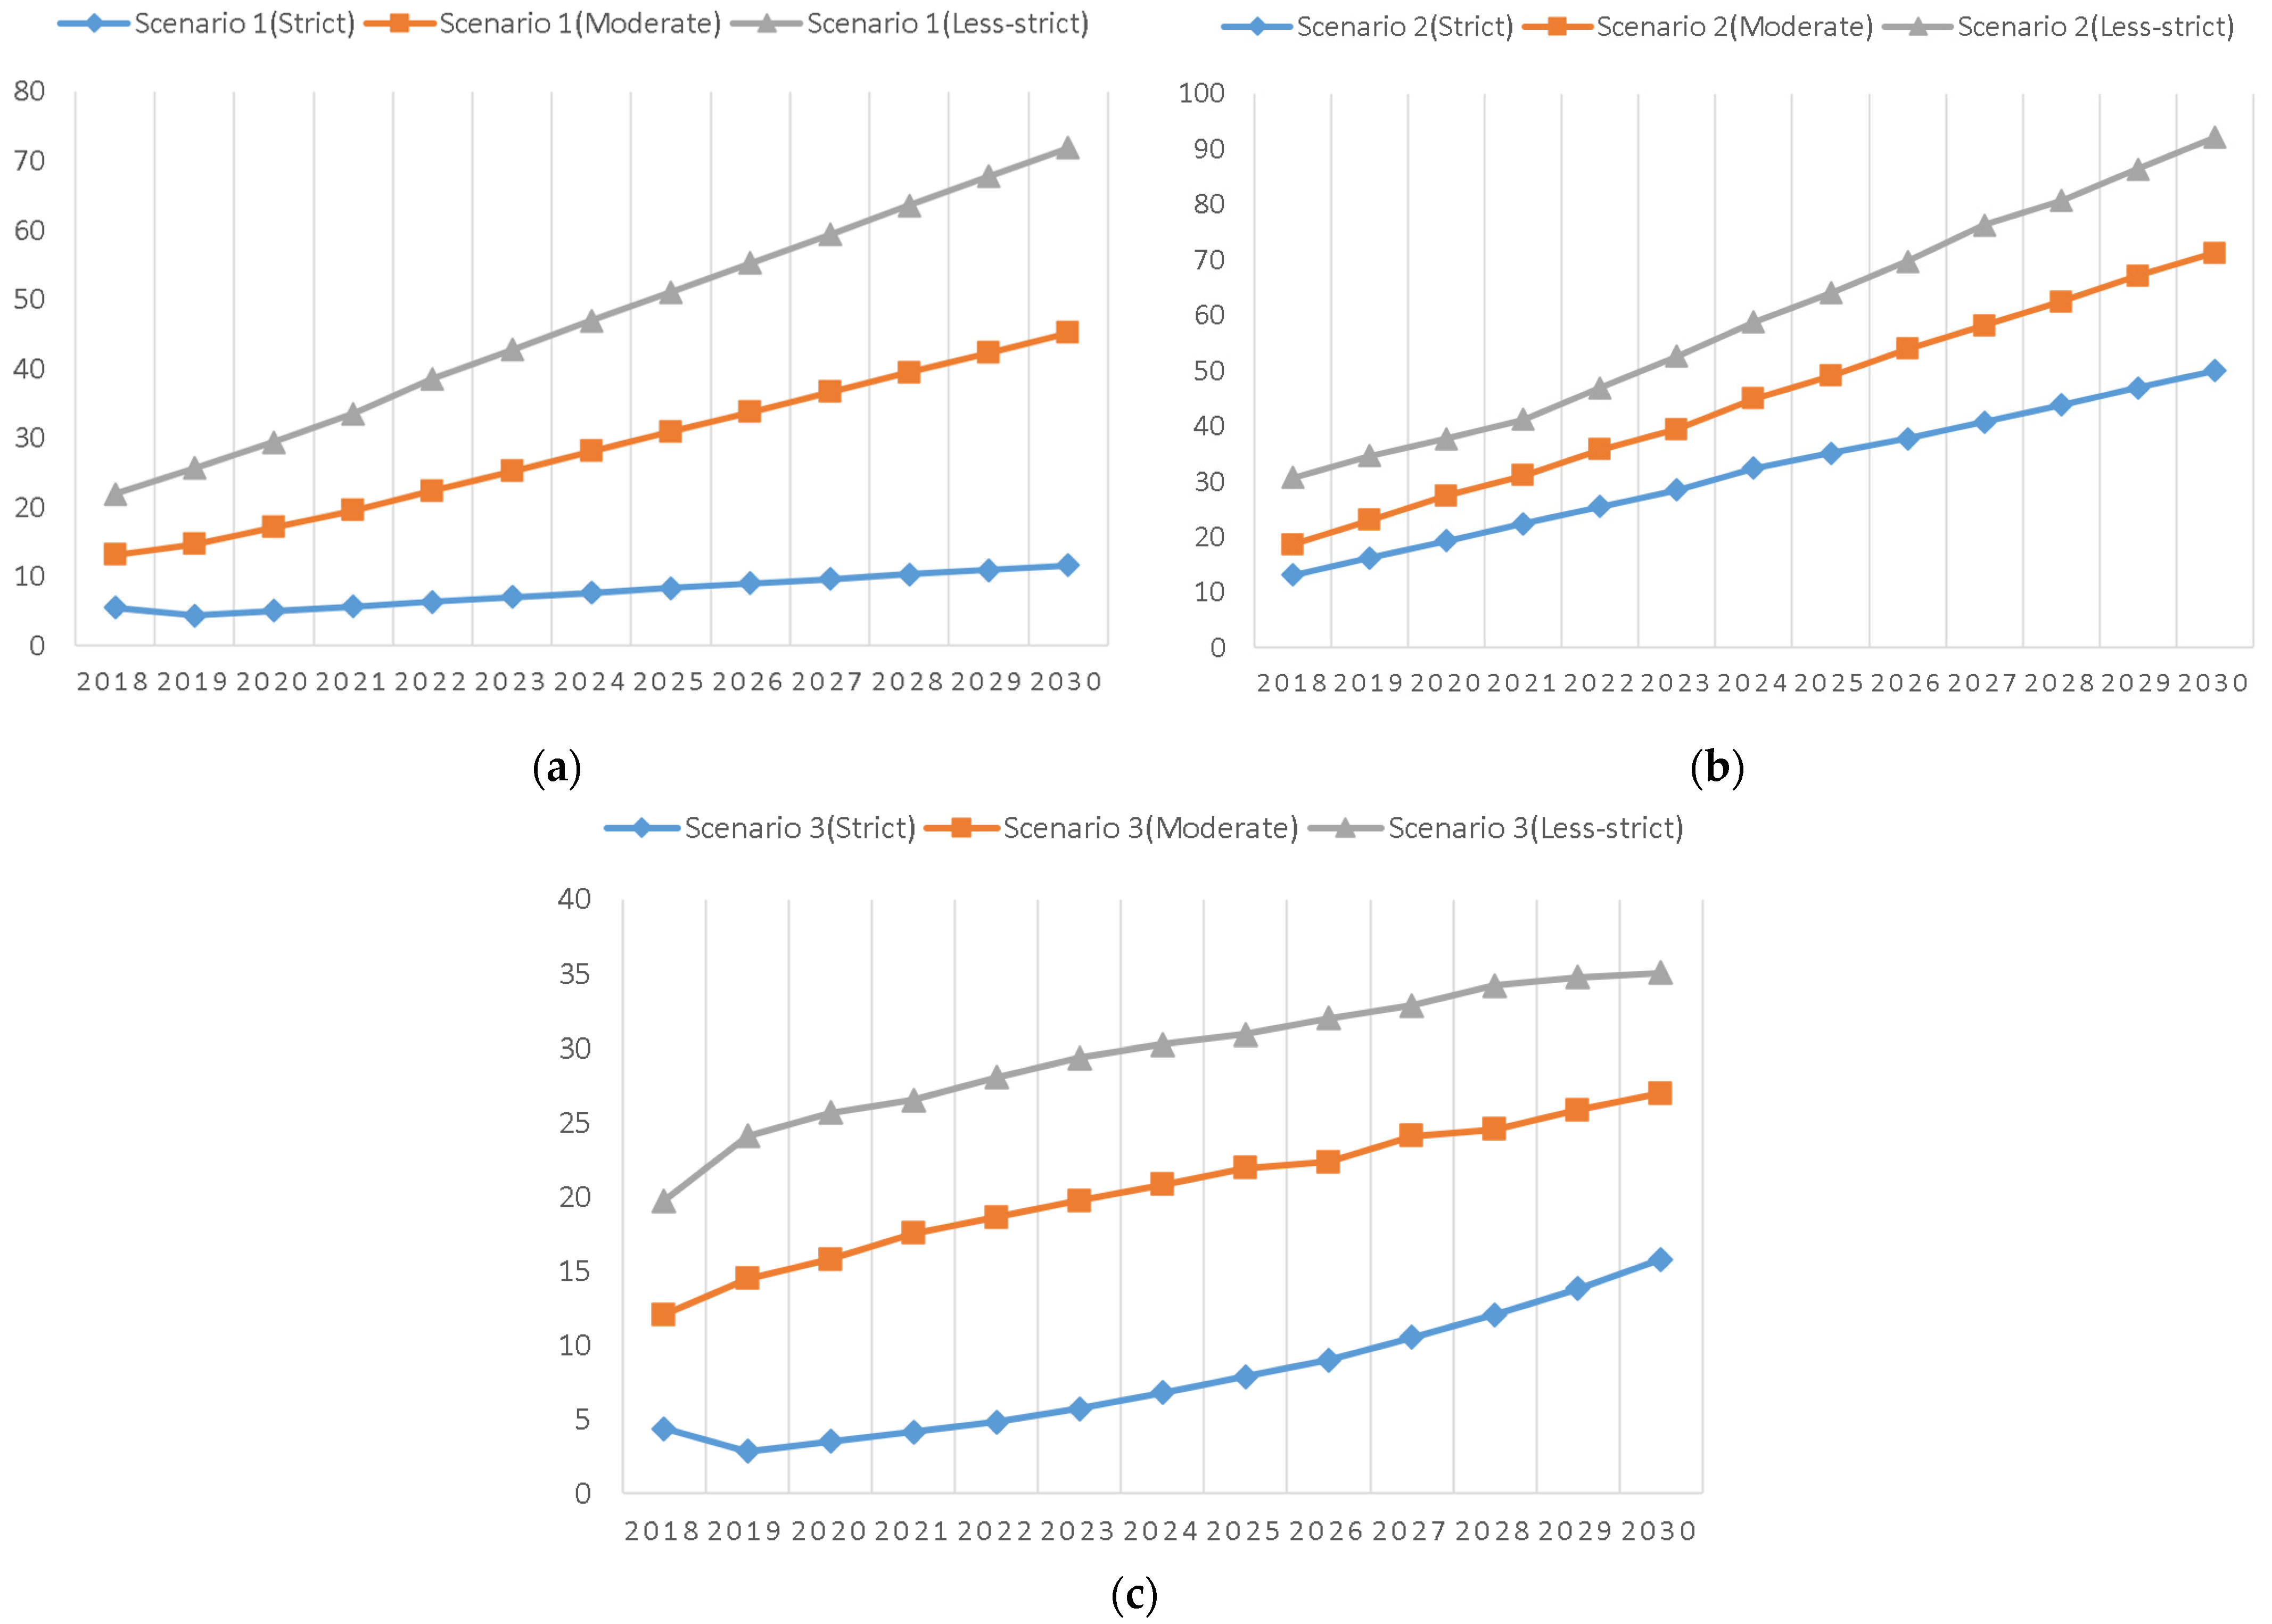
4.3. GHG Emissions from Online Car-Hailing
Based on the market penetration of small passenger vehicles, the energy impact module was used to calculate the GHG emissions during 2014–2030, as shown in Figure 4. From 2014 to 2017, local PRMOCH standards were not implemented, so online car-hailing services appeared and became popular, resulting in annual GHG emissions of 63.17, 81.84, 110.25, and 140.42 MtCO2, respectively.
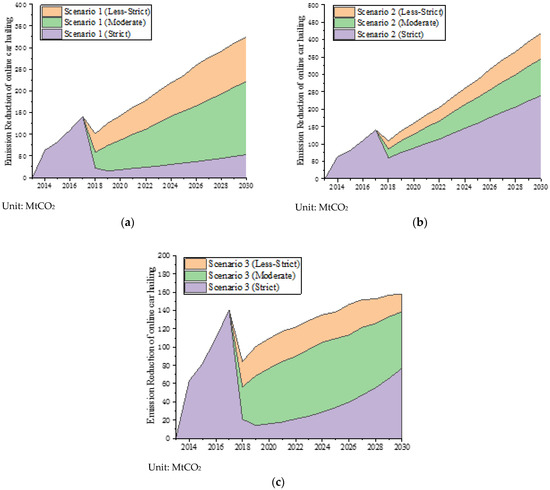
Figure 4.
(a) Energy consumption of online car-hailing in Scenario 1, (b) Energy consumption of online car-hailing in Scenario 2, (c) Energy consumption of online car-hailing in Scenario 3.
Based on the figures, we found that overall GHG emissions from online vehicles will increase, year by year, from 2020 to 2030. The total GHG emissions in the three scenarios of strict policies are about 50 MtCO2, 225 MtCO2, and 70 MtCO2 in 2030. In the less-strict policy, the GHG emissions increase significantly, and the total GHG emissions in the three scenarios will be about 325 MtCO2, 413 MtCO2, and 160 MtCO2 in 2030.
A comparison between Figure 4a,b shows that total energy consumption in Scenario 2 was greater than in Scenario 1 under the moderate- and strict-policy situations. The main reason was that, compared to Scenario 1, the first- and second-tier cities were not controlled sufficiently to affect the national online car-hailing market in Scenario 2.
Energy consumption in Scenario 3 exhibited an upward trend during 2018–2019 (see Figure 4c) mainly because the EV replacement policy started in 2018 and was complete by 2019 in certain cities, leading to less energy consumption.
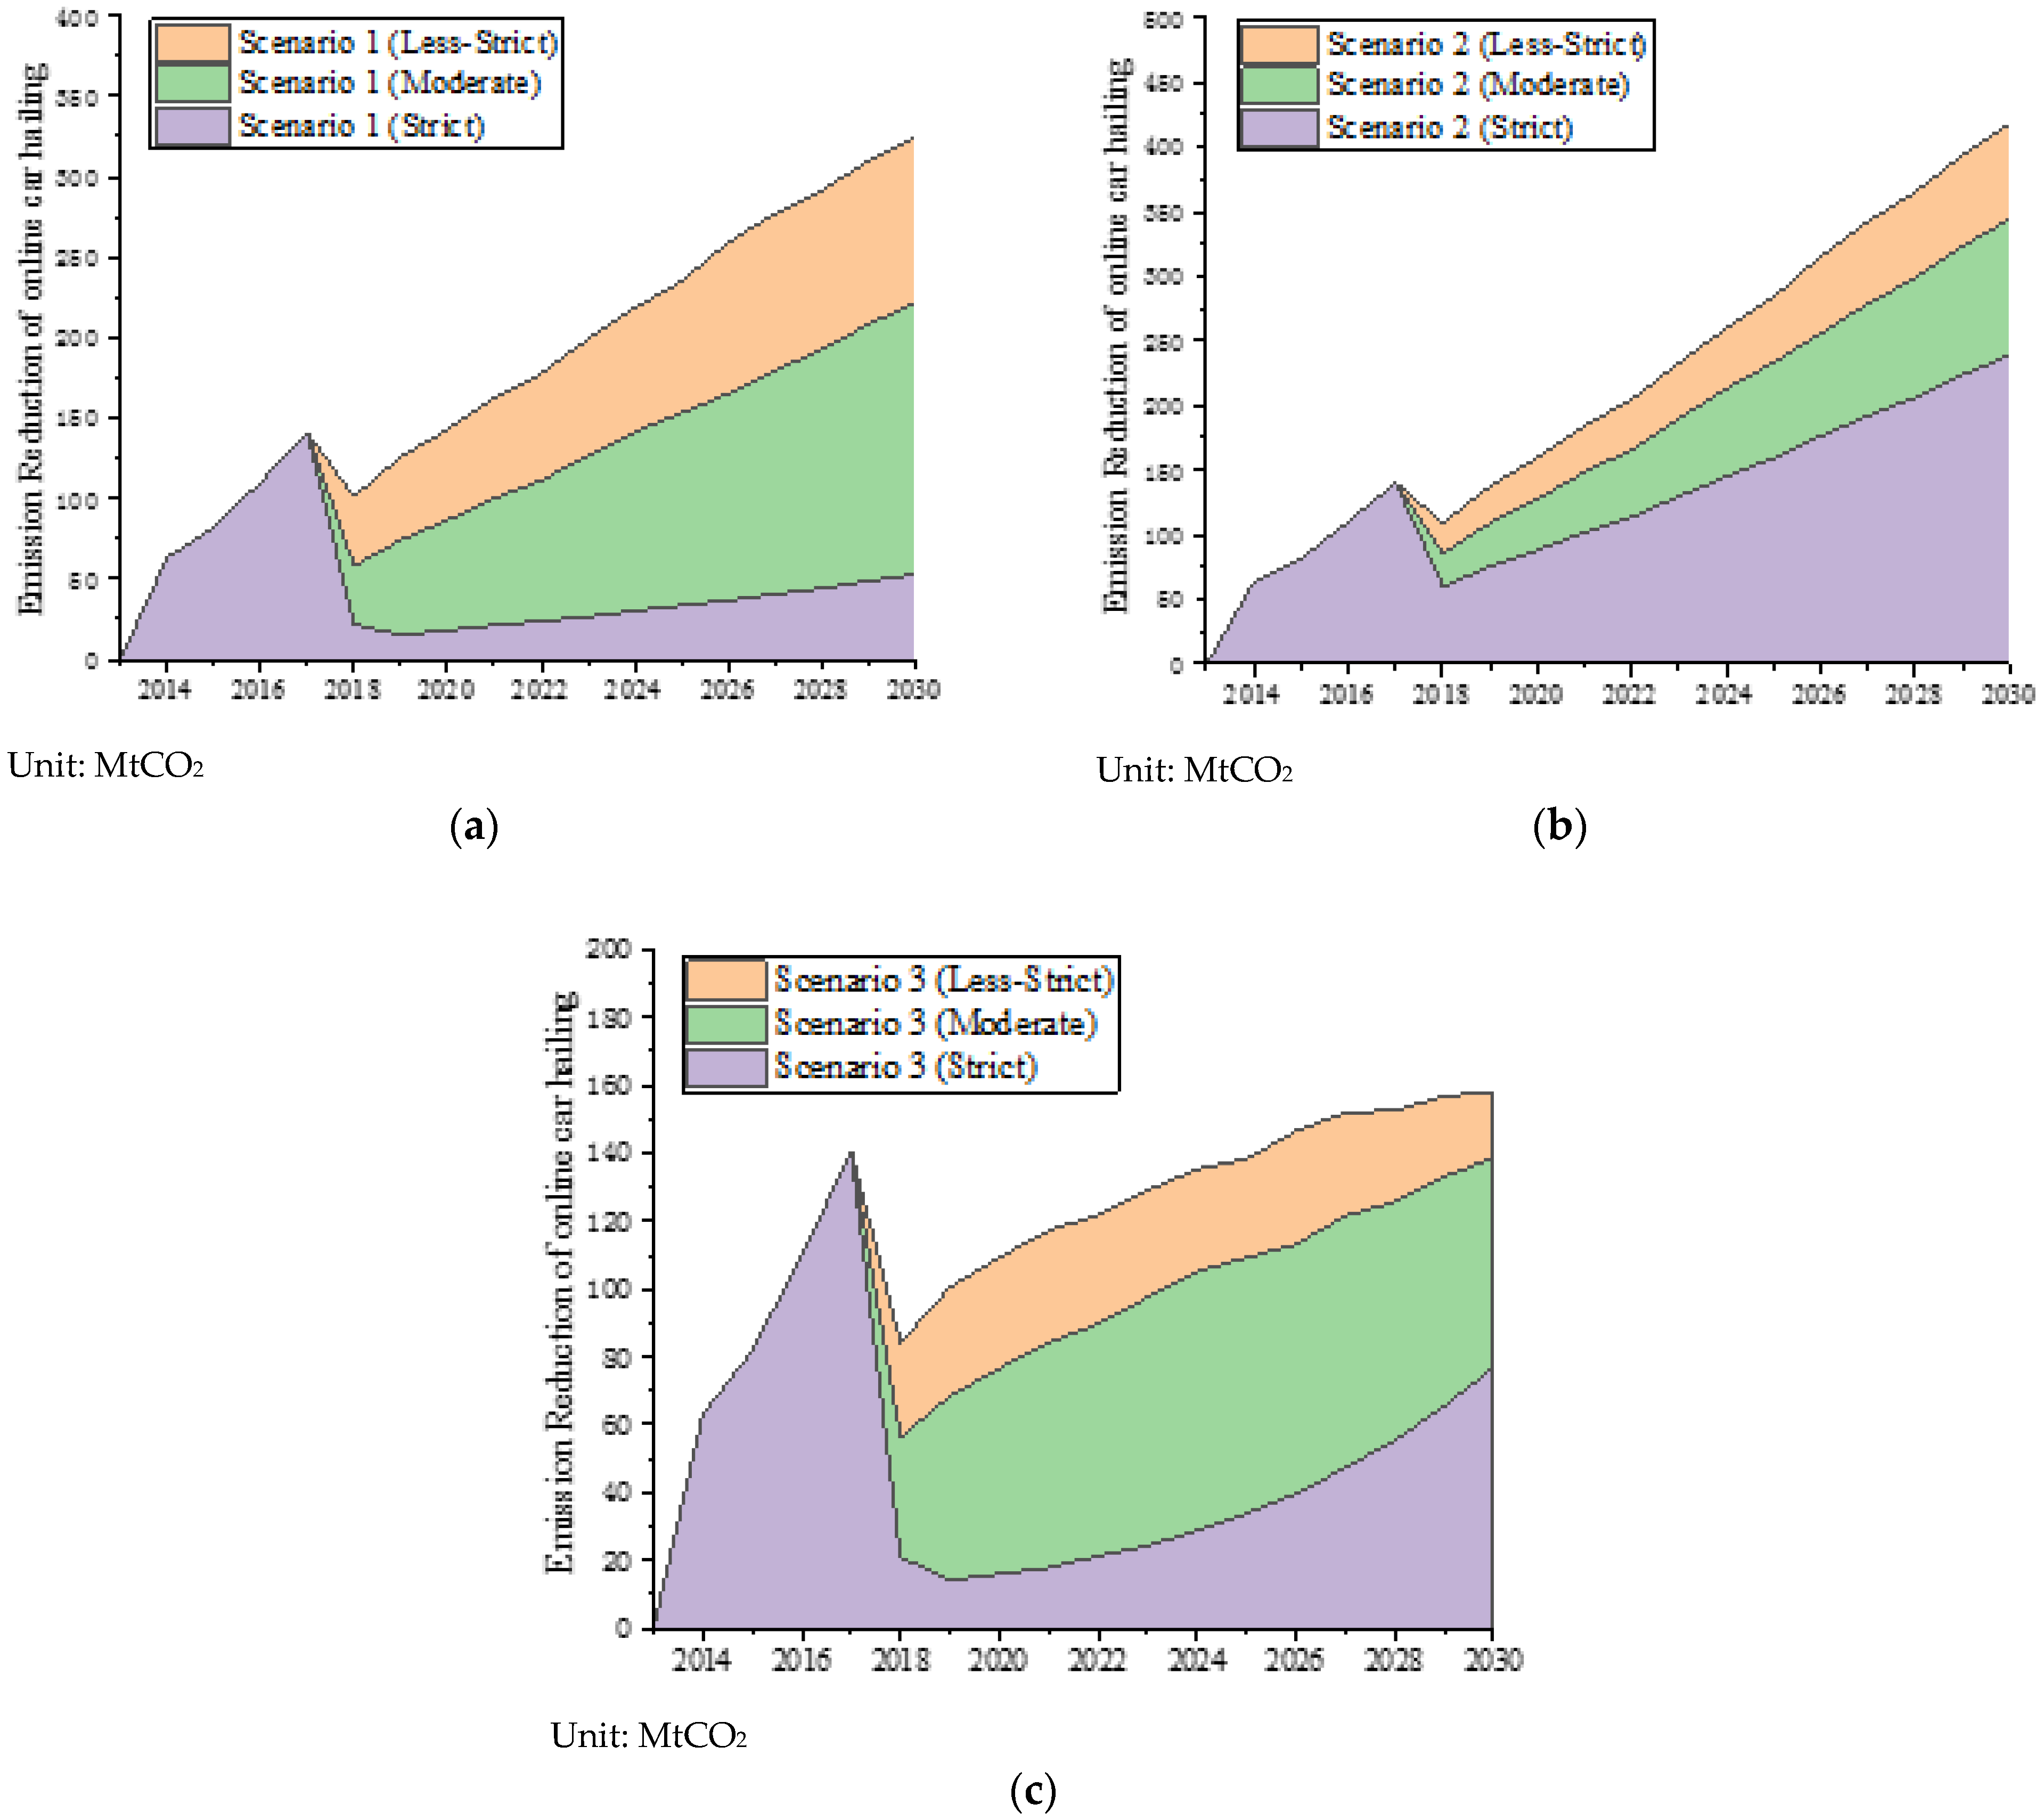
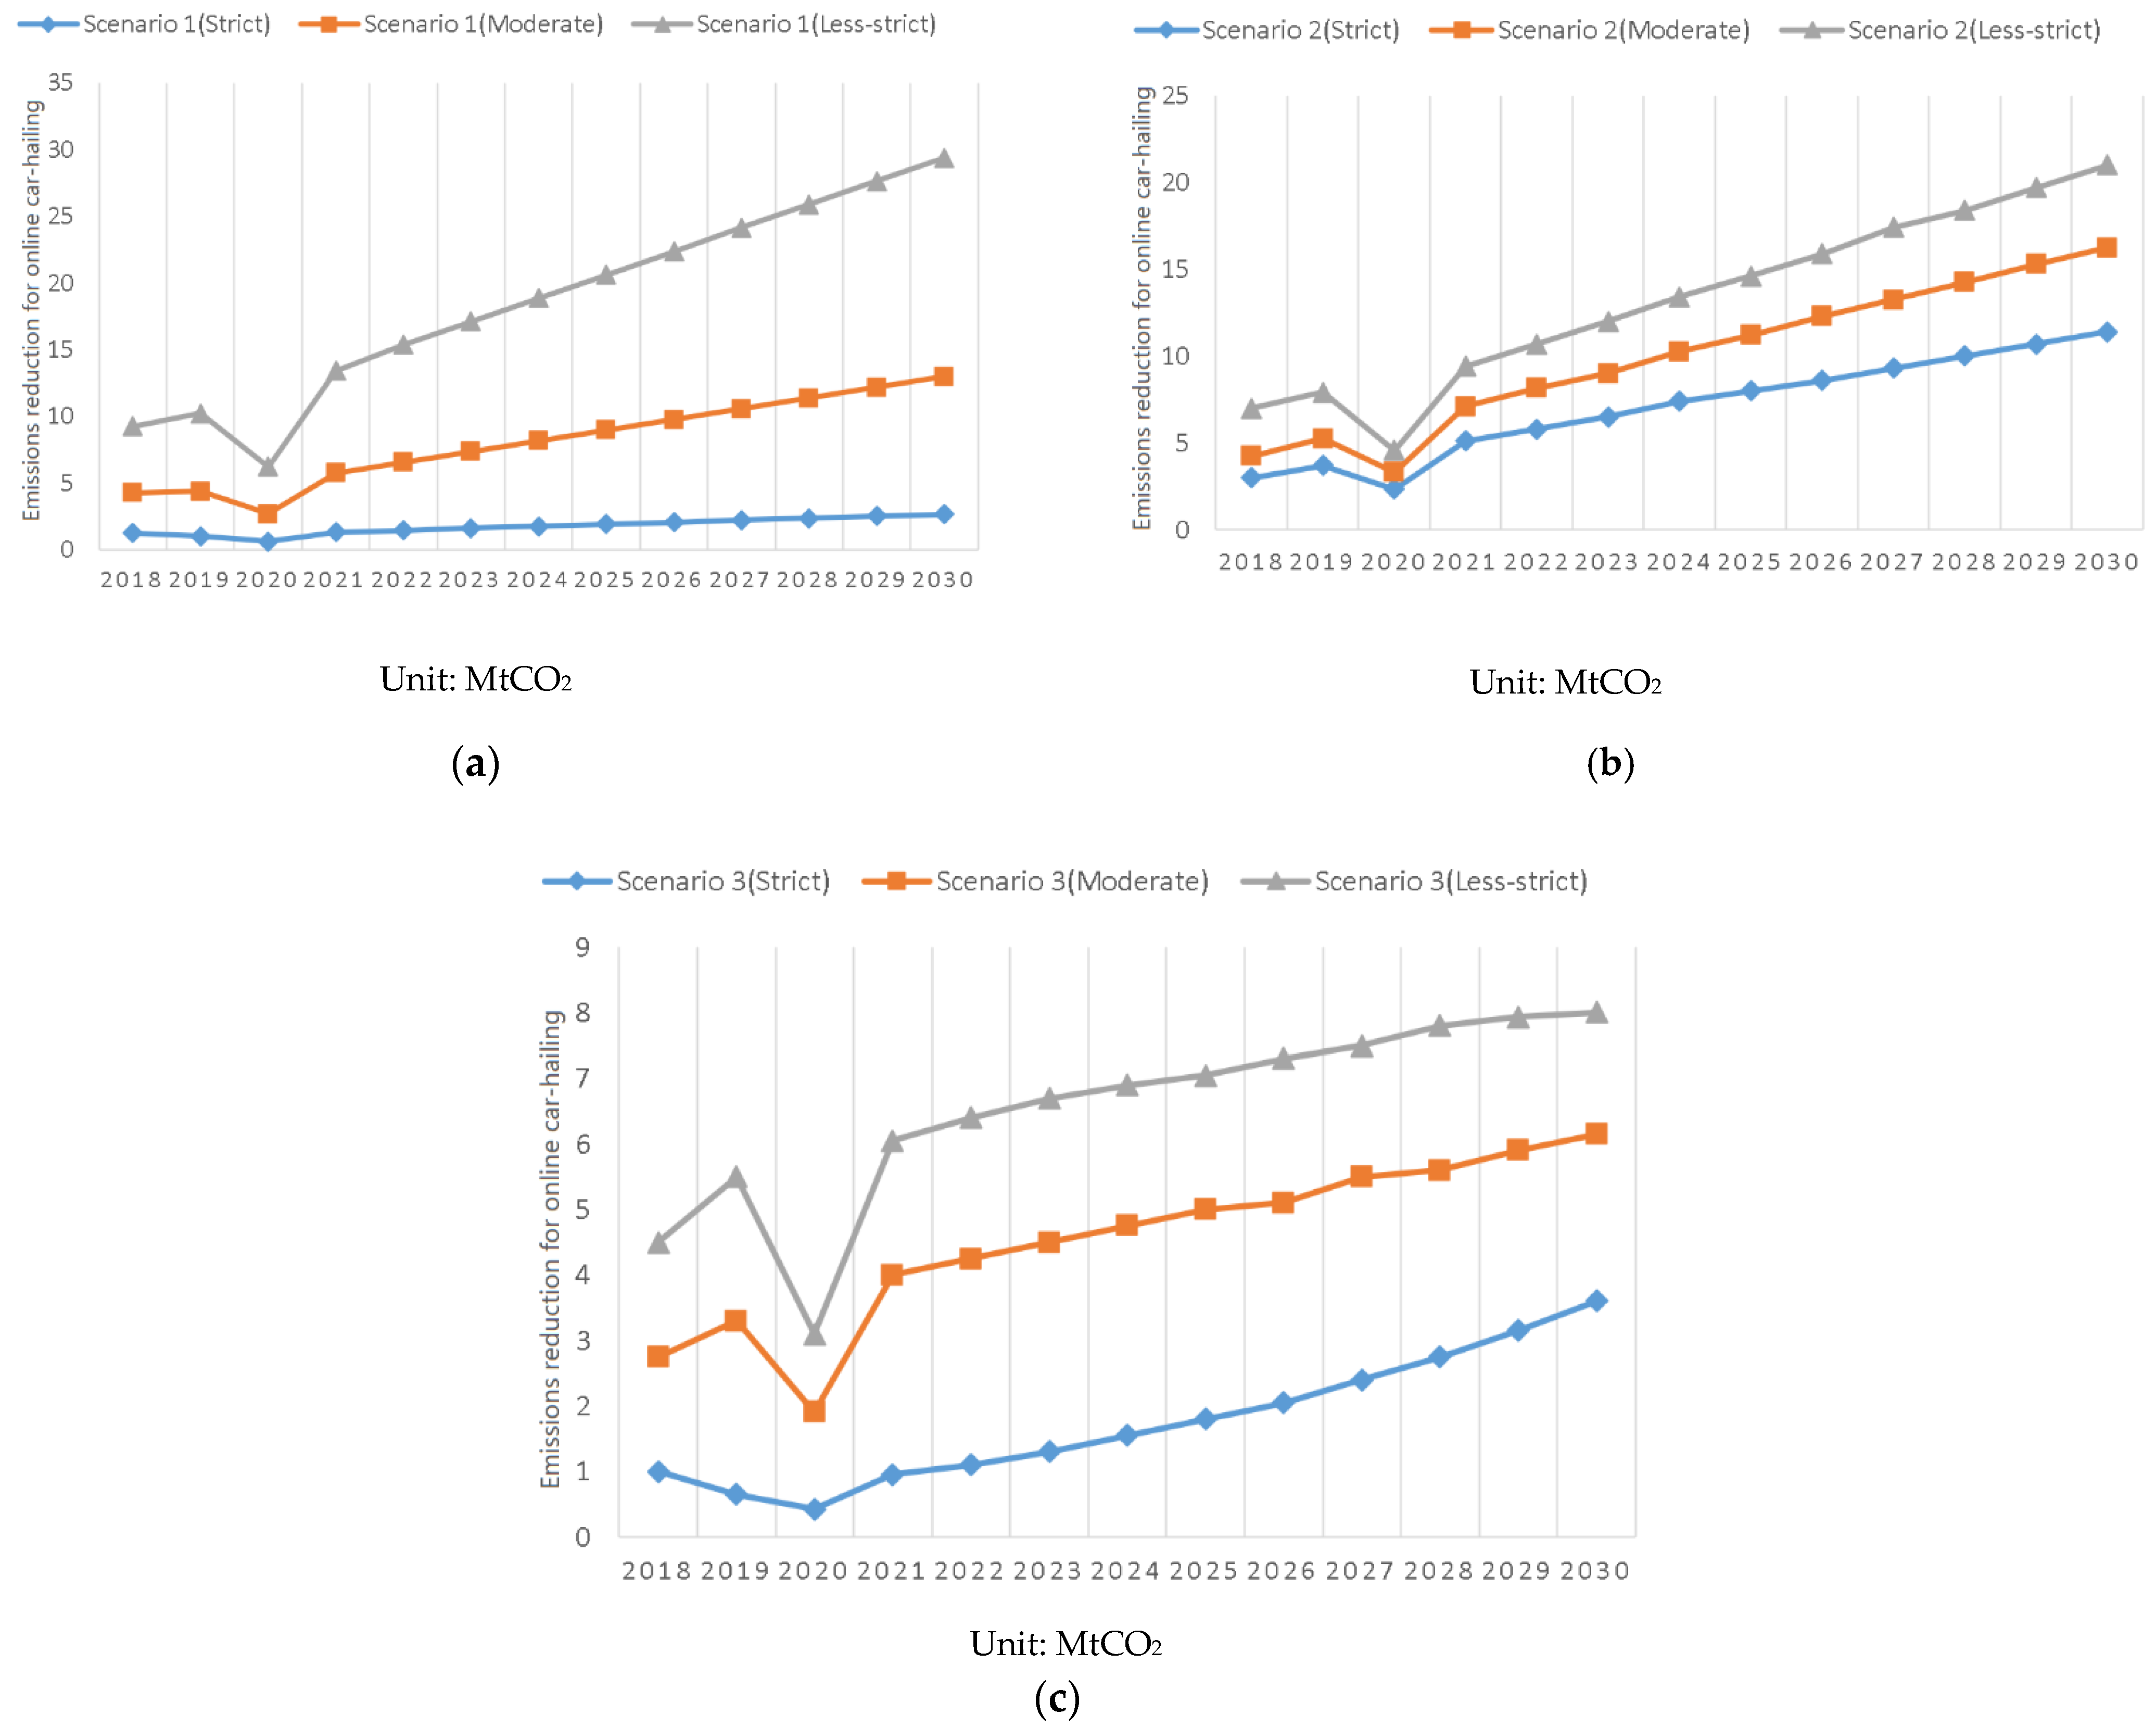
4.4. Emissions Reduction for Online Car-Hailing
The literature shows that mobile transportation platforms have a role in energy-saving and emissions reductions, and that, the more online cars there are, the more obvious the energy-saving and emission reduction effects are. However, the introduction of PRMOCHs controlled the amount of online car-hailing, to a certain extent, and weakened the energy-saving and emission reduction effects of online vehicles.
The energy savings and emission reductions of car-hailing vary under different levels of regulatory stringencies and policy implementation. As shown in Figure 5, by 2030, under the less-strict policy, online ride-hailing services will reduce emissions by 19.46, 25.10, and 9.48 MtCO2 in Scenario 1, Scenario 2, and Scenario 3, respectively. However, under the strict policy, for online ride-hailing services, the reductions would be 2.13, 13.57, and 2.53 MtCO2 in Scenario 1, Scenario 2, and Scenario 3, respectively. We found a huge impact on the total amount of online taxi emission reductions under different policies. The more lenient the policy, the better the carbon emission reduction. Therefore, the government needs to find a trade-off between protecting passengers’ rights and reducing carbon emissions.
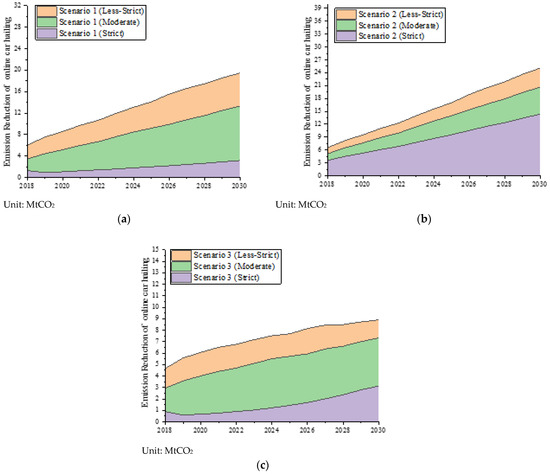
Figure 5.
(a) Emission reductions of online car-hailing in Scenario 1, (b) Emission reductions of online car-hailing in Scenario 2, (c) Emission reductions of online car-hailing in Scenario 3.
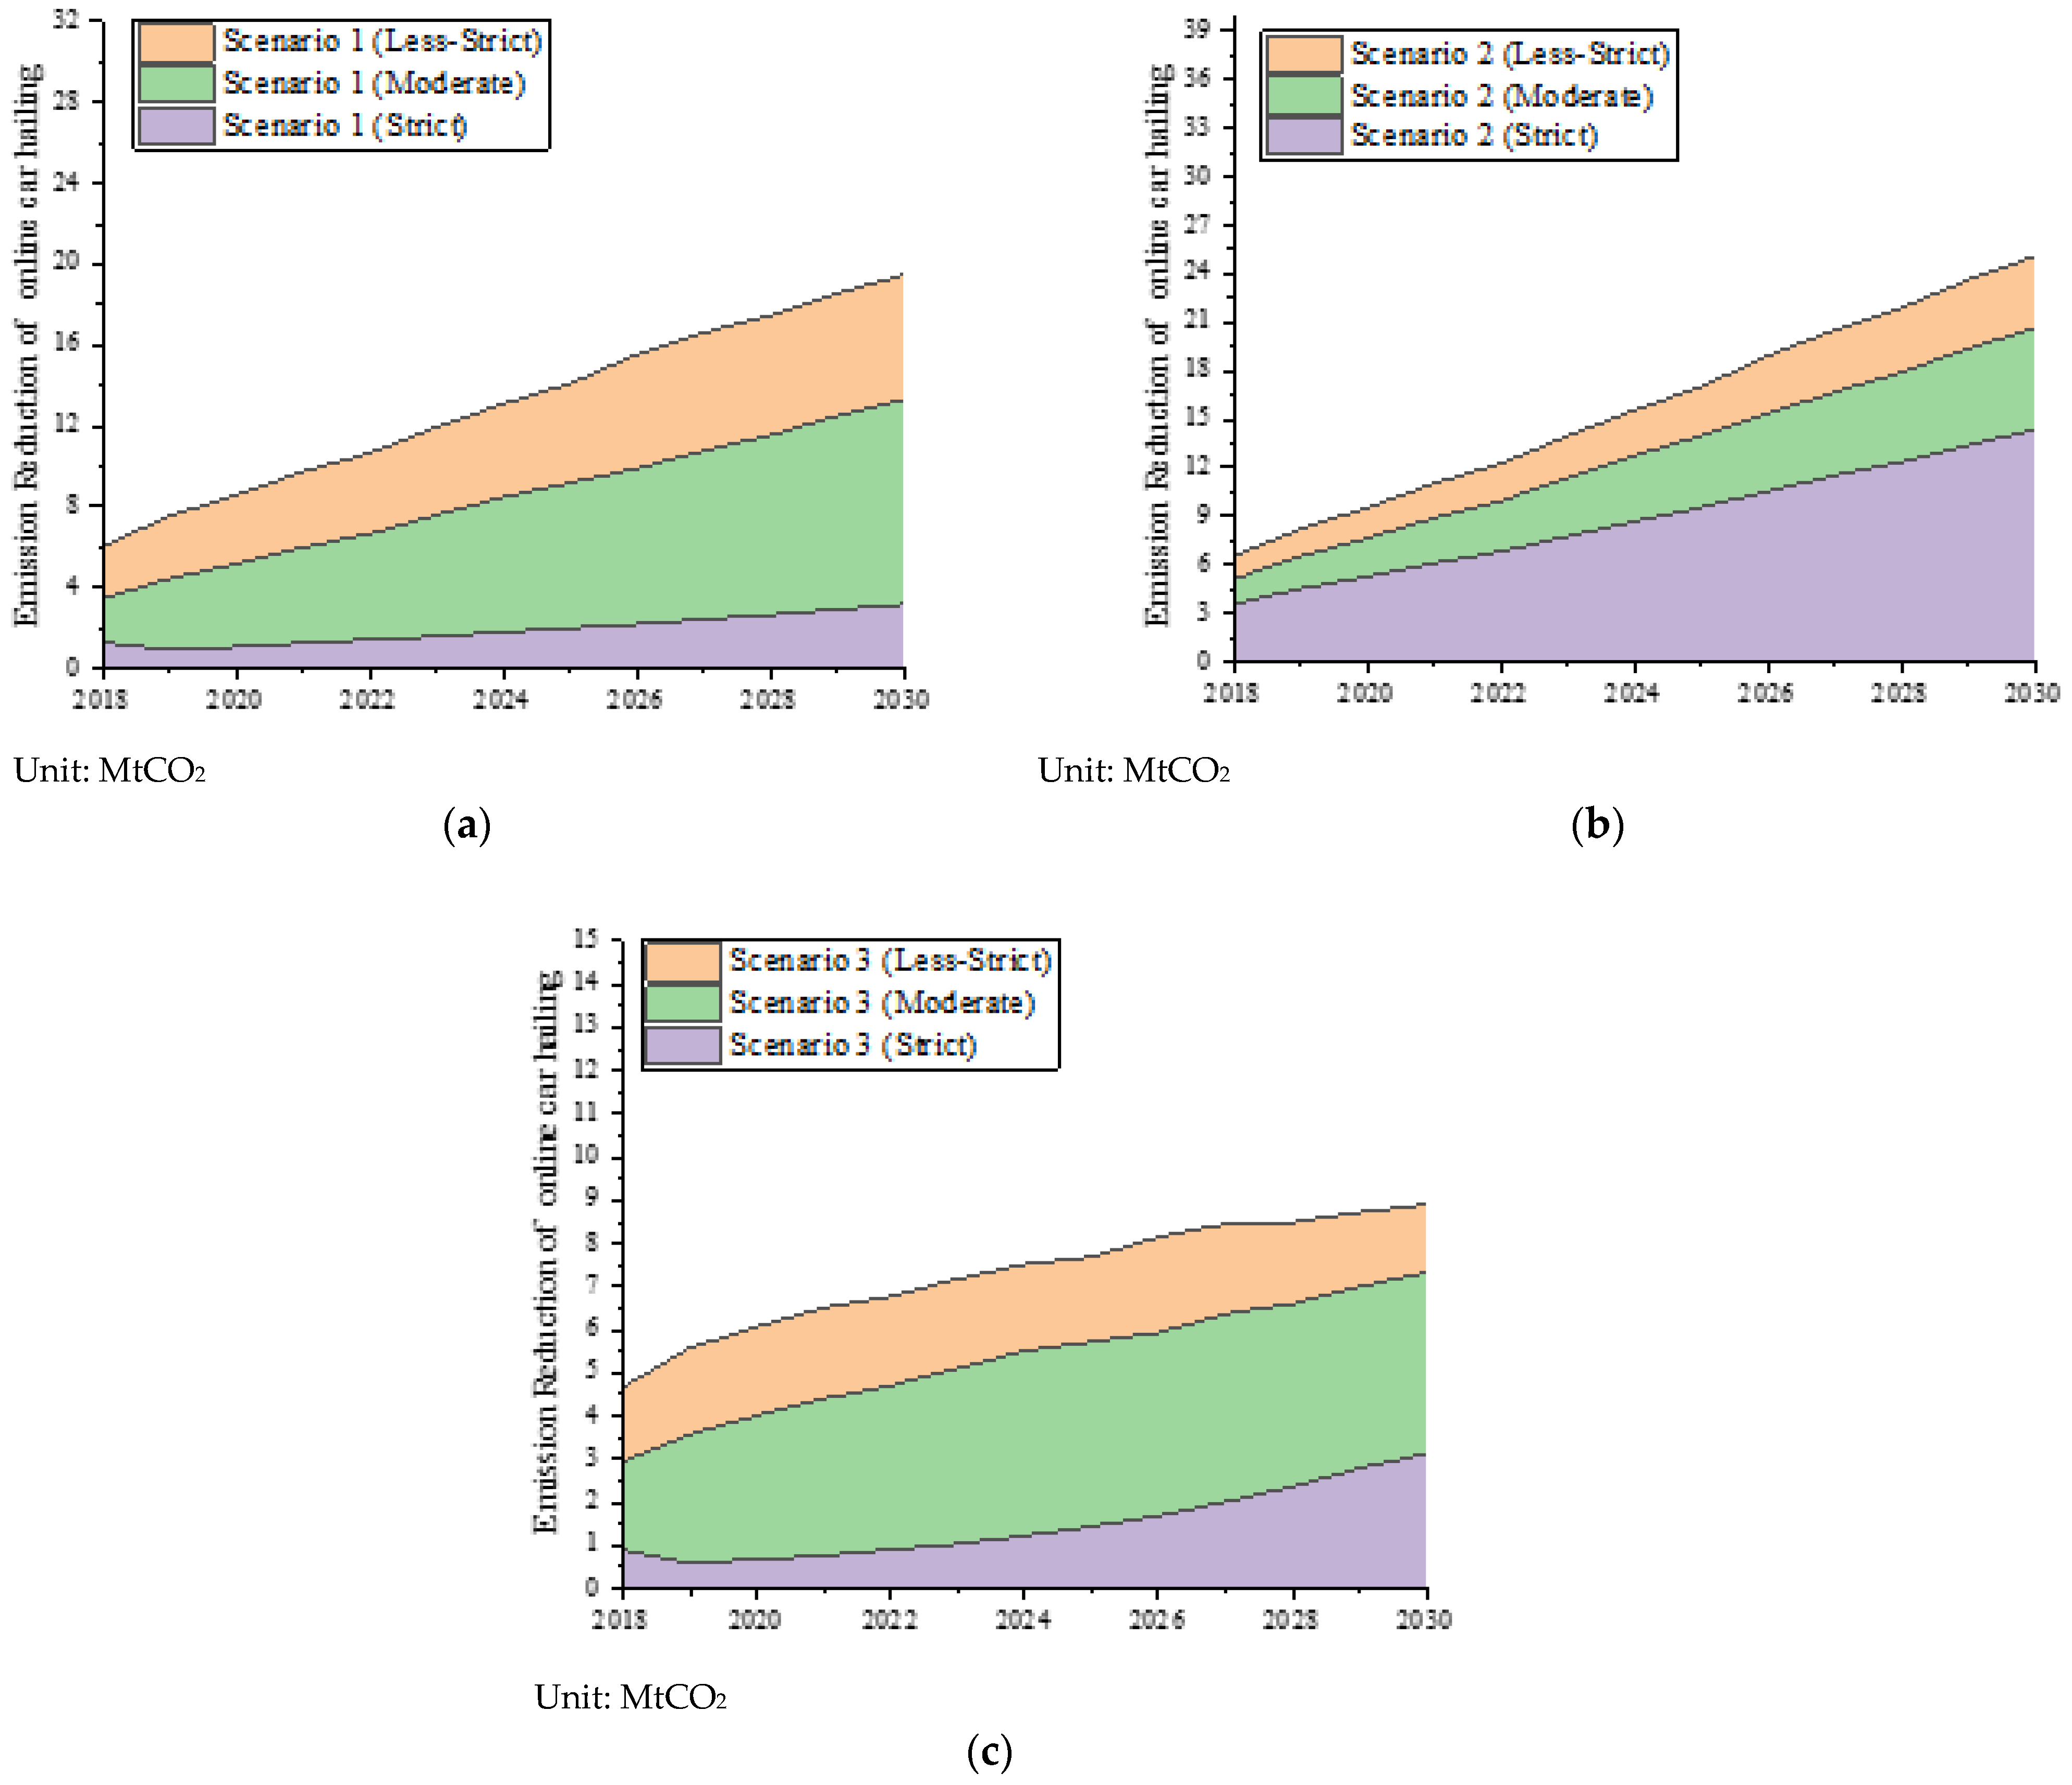
4.5. Assessment of the Reduction Effect on Other Pollutant Gases
In this section, we investigate the effect of the implementation of different policies on other pollutant gases, which refers to the emission reduction effect of CO, NOx, and HC gases.
Combined with the findings of the Borucka study, the gas emissions generated during car driving were as follows: CO2 235 g/km, CO 6.8 g/km, NOx 1.23 g/km, and HC 1.03 g/km, on average, from road tests record [68].
We obtained the reduction effects of CO, NOx, and HC gases, as shown in Figure 6, Figure 7, and Figure 8, respectively.
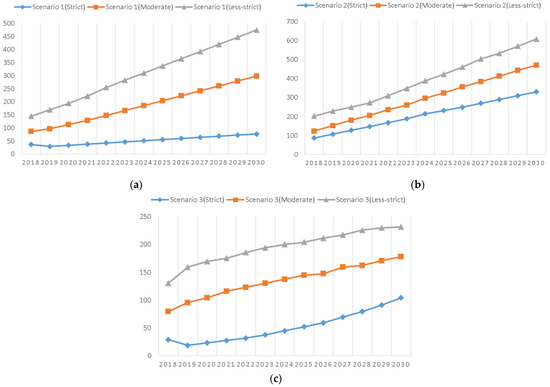
Figure 6.
(a) CO emission reductions for online car-hailing (thousand TCO2) in Scenario 1, (b) CO emission reductions for online car-hailing (thousand TCO2) in Scenario 2, (c) CO emission reductions for online car-hailing (thousand TCO2) in Scenario 3.
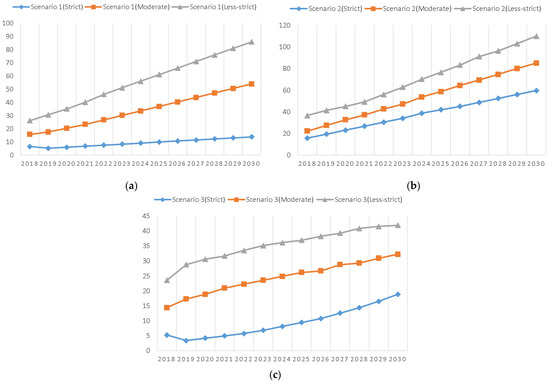
Figure 7.
(a) NOx emission reductions for online car-hailing (thousand TCO2) in Scenario 1, (b) NOx emission reductions for online car-hailing (thousand TCO2) in Scenario 2, (c) NOx emission reductions for online car-hailing (thousand TCO2) in Scenario 3.
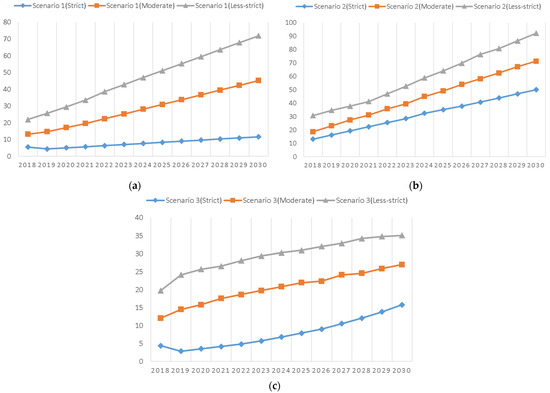
Figure 8.
(a) HC emission reductions for online car-hailing (thousand TCO2) in Scenario 1, (b) HC emission reductions for online car-hailing (thousand TCO2) in Scenario 2, (c) HC emission reductions for online car-hailing (thousand TCO2) in Scenario 3.
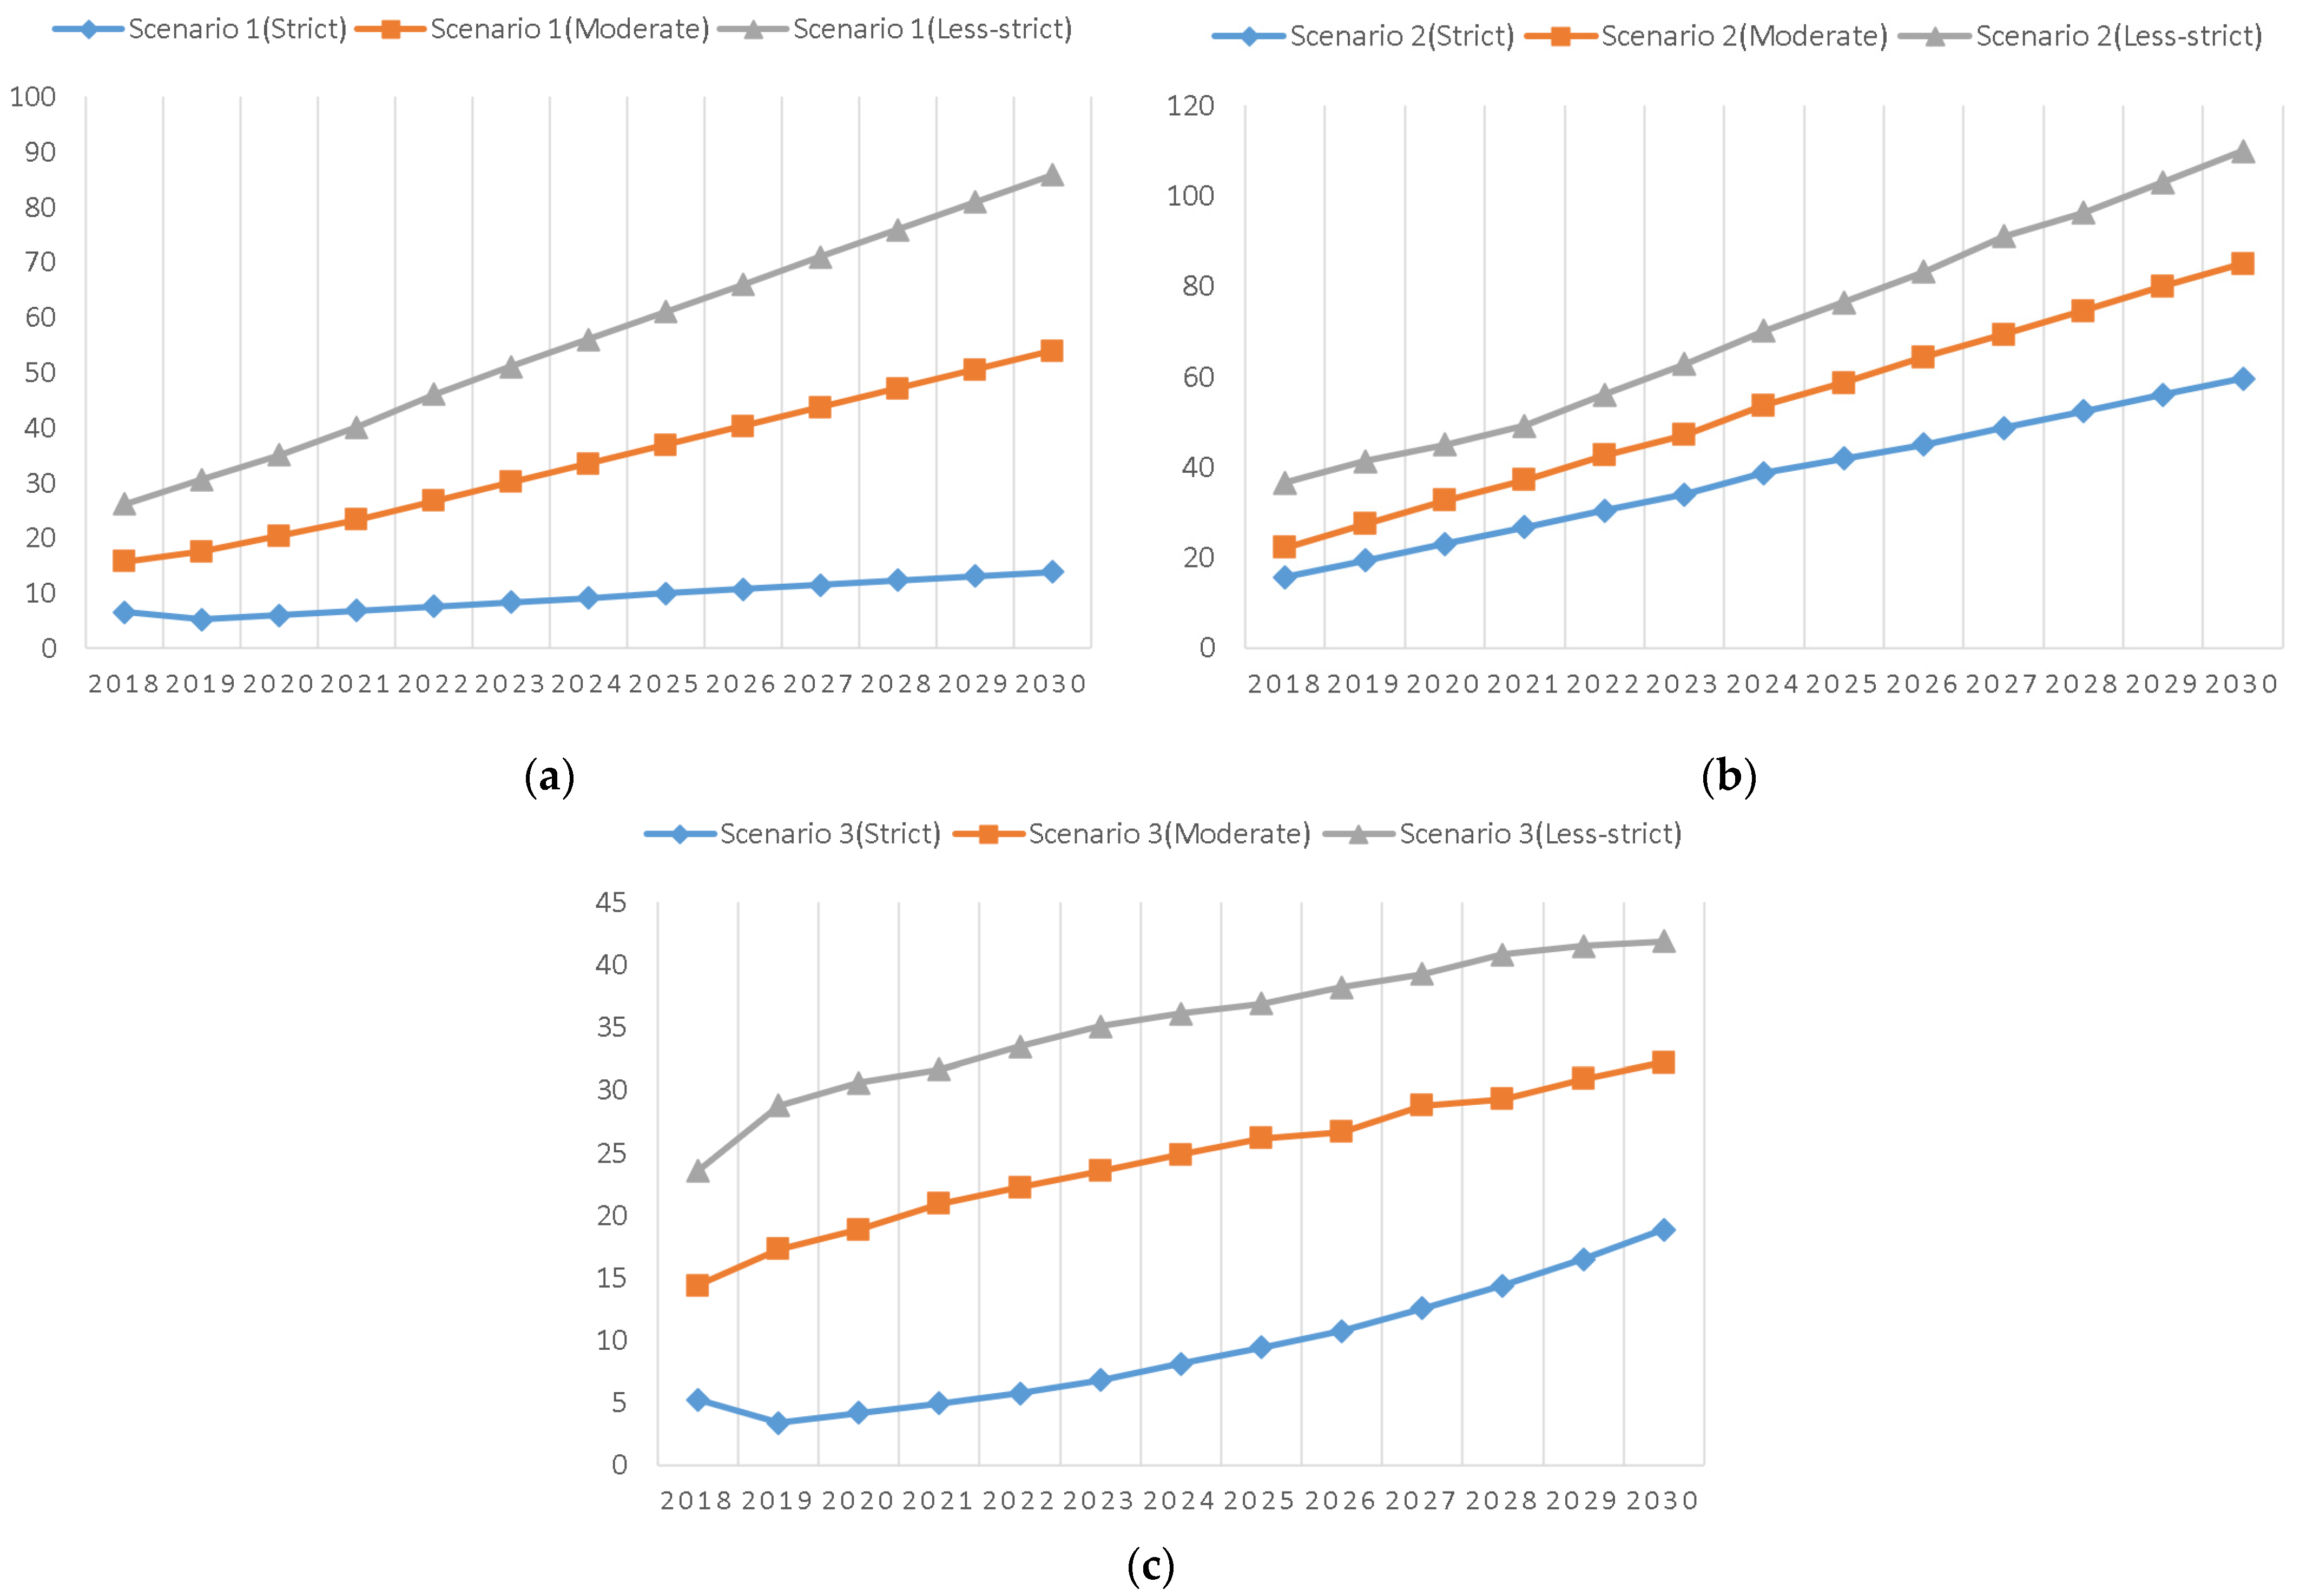
4.6. Assessment of the COVID-19 Epidemic Impact
In this section, to better understand the current reality in China, we considered the impact of the COVID-19 epidemic on transportation in China from December 2019, when the first case of COVID-19 was reported in China. By 2020, the epidemic spread further and several regions in China adopted lockdown policies to limit the spread of the COVID-19 epidemic, which, in turn, led to a significant decrease in people’s travel. Zhang and Tong (2021) set five phases to simulate the impact of traffic consumption, namely the outbreak of COVID-19 (January), the rapid responses to COVID-19 (February), the preliminary containment of the spread of COVID-19 (March), the gradually strengthened COVID-19 pandemic prevention and control, and the regular COVID-19 pandemic prevention and control (From May to October), respectively [69]. Following the settings of five phases, we evaluated the demand for passenger transportation in the five phases (−11.90%, −88.70%, −73.10%, −58.80%, and −41.50%, respectively), and we suggest that the overall decrease in energy consumption for road transport in 2020, due to COVID-19, is about 45%. The revised emission reduction results are shown in Figure 9.
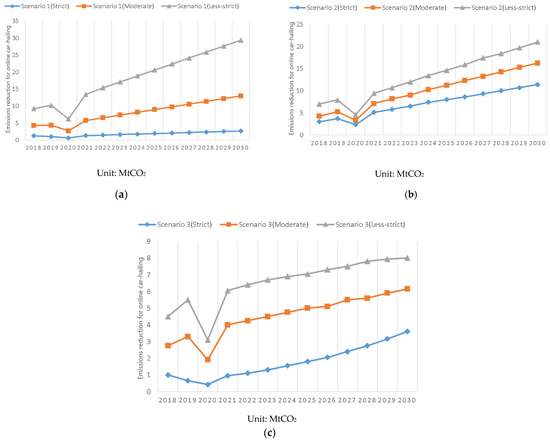
Figure 9.
(a) Revised emission reduction in Scenario 1, (b) Revised emission reduction in Scenario 2, (c) Revised emission reduction in Scenario 3.
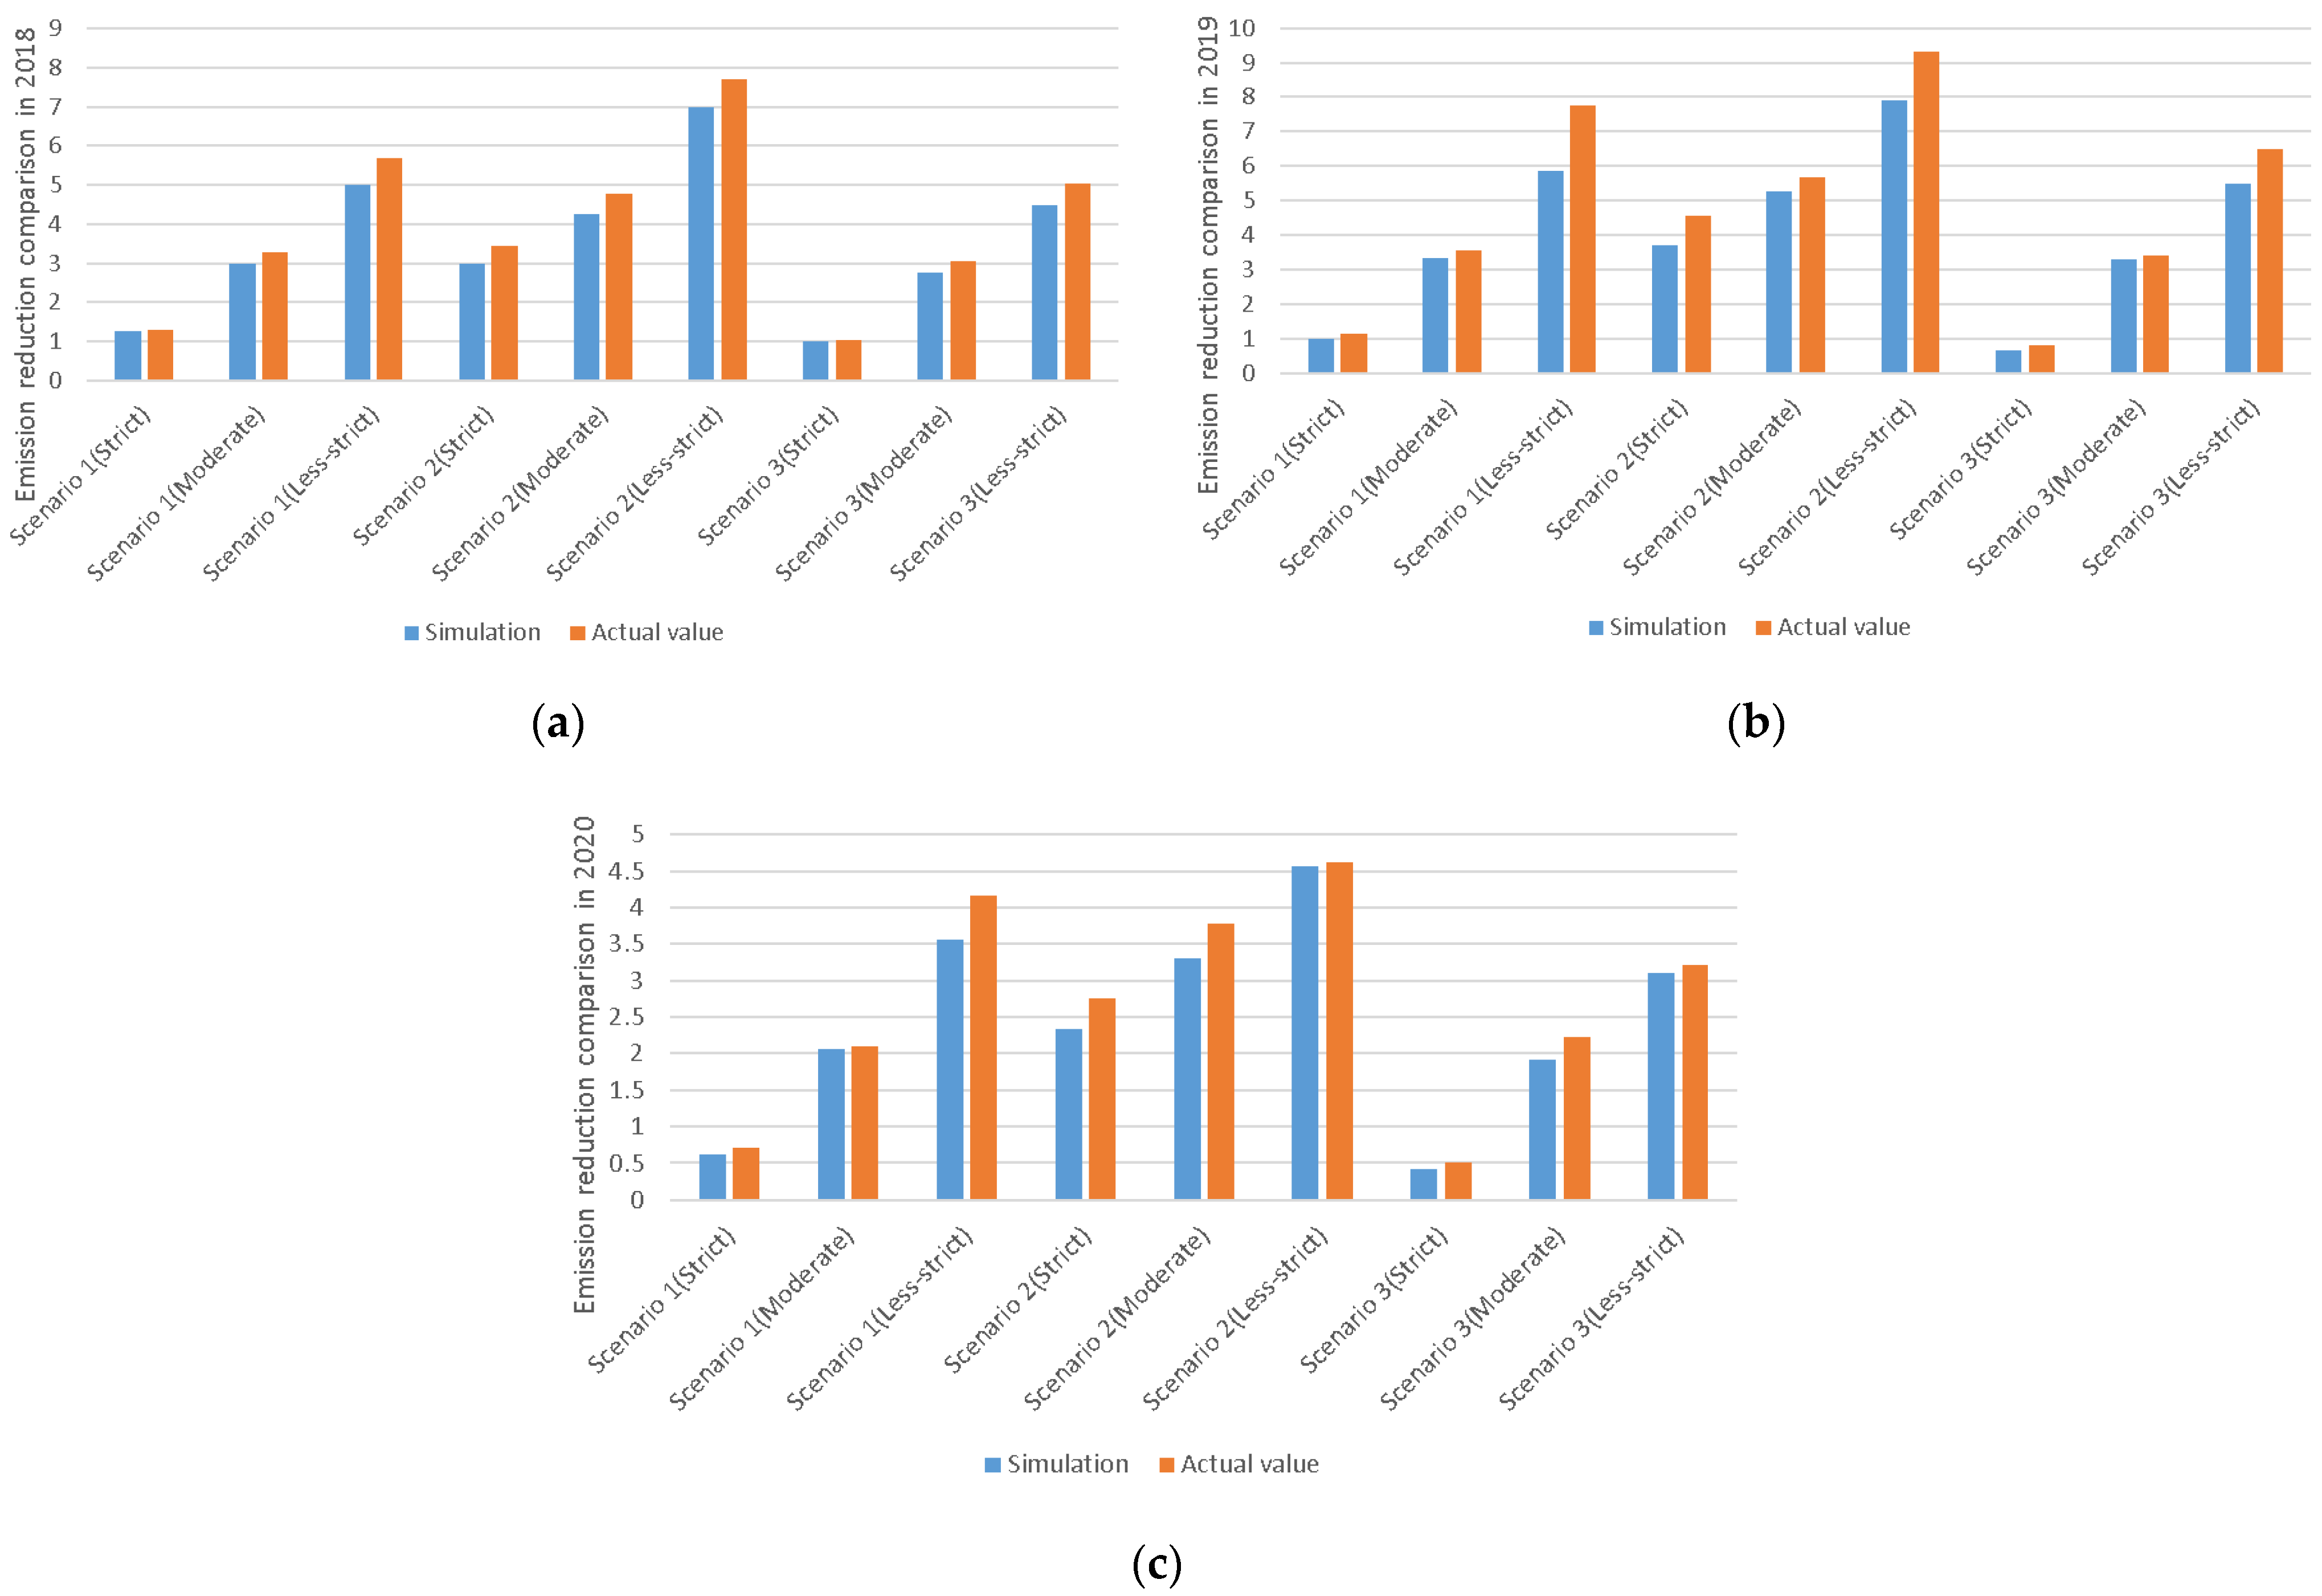
Next, we compared the predicted data from 2018–2020 with the actual data from 2018–2020 in Figure 10, where Figure 10 a–c represent the comparison results in 2018, 2019, and 2020, respectively.
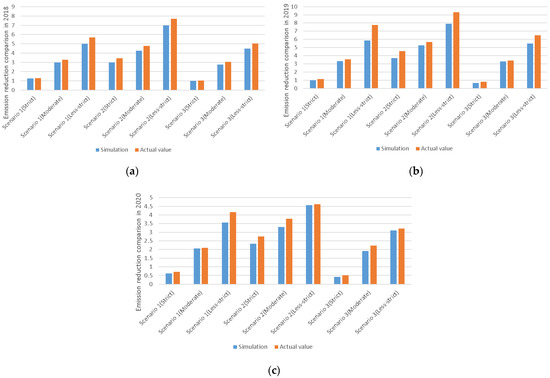
Figure 10.
(a) Emission reduction comparison in 2018, (b) Emission reduction comparison in 2019, (c) Emission reduction comparison in 2020.
We found that the actual results were all somewhat larger than our estimates, which, we believe, is mainly due to the promotion of online car-hailing and the increased awareness of residents to the regulation of their driving, which makes the market penetration of online cars higher than our simulated values and, ultimately, makes the emission reduction effect more significant.
5. Discussions
Based on the above research, we have three policy recommendations: (1) The government should avoid compulsory actions in shutting down online car-hailing platforms because different stringency levels and policy implementations are sufficient to deter potential safety risks and reduce energy consumption. (2) It is better to implement strict policies throughout the country to achieve safety control. It is obvious that the government is not succeeding at controlling the safety of online car-hailing services by controlling their numbers. Controlling just the first-tier and second-tier cities has little effect nationwide. (3) From the perspective of energy consumption and policy efficiency, the government should increase the stringency and implementation of EV replacement policies in the first- and second-tier cities, which can greatly reduce energy consumption. Strict and moderate policies are conducive to the development of new energy-efficient online car-hailing services, which can be seen in Scenario 3: the number of EVs under the strict and moderate policies was 2.3-fold more that of the less-strict policy.
In this paper, we attempted to estimate the greenhouse gas emission reductions from the online car-hailing service based on different regulation scenarios, but there were limitations. First, in the absence of data, a more carefully developed model, incorporating key factors, would likely not have been able to provide direct quantitative predictions, but may have had the ability to identify the conditions under which car-hailing services could reduce greenhouse gas emissions. Second, although taxi penetration is mentioned as a possible factor in influencing the adoption of online car-hailing, other forms of micromobilities, such as bike or scooter sharing, were not mentioned. Third, the implications of increasing emissions because of those shifting from public transit to online car-hailing vehicles were not discussed or considered. These users actually increase GHG emissions, but we did not consider this particular group. Fourth, since we only studied the impact of online car-hailing on emission reduction in China, we did not take into account the situation in other countries. In China, there is a difference between net cars and cabs. That is, cabs can only take orders from cabs, and net cars can only take orders from net cars. This feature is also an important factor in conducting our study.
In the future, we will improve the model to take into account some ride-sourcing groups, for example, the passengers who shift from public transit to ride-sourcing vehicles, which may affect car use and GHG emissions. In addition, we will consider how the potential growth or evolution of micro-mobility options in China could affect online car-hailing emissions. Furthermore, many studies have shown that a portion of online car-hailing users would have used lower emission-intensive modes, such as walking, biking, or public transit (e.g., [70,71]). Therefore, we will consider such individual-level data along with the emissions-reducing effects of private vehicle selling and suppression.
6. Conclusions
By establishing a GHG emissions assessment model, three scenarios, reflecting possible trajectories of online car-hailing in China through to 2030, were developed.
Considering the energy and material consumptions in the vehicle production and operation stages, GHG emissions from online car-hailing services will be at maximums of 325, 413, or 160 MtCO2 and emissions will be reduced by a maximum of 19.46, 25.1, or 9.48 MtCO2 by 2030.
With the expansion of the online car-hailing platform and the further improvement of safety and convenience, the number of services will increase, accompanied by more GHG emissions. However, the substitution of online car-hailing for new car purchases is raising the level of the emission reductions.
Second, although online car-hailing services save energy and reduce emissions, strict PRMOCH standards weaken this effect by decreasing the number of network cars. We found that the more stringent the PRMOCH, the more it reduces the number of car-hailing vehicles. A strict PRMOCH limits the number of network cars to less than 1%, which seriously curbs the development of online car-hailing services based on an increasing probability of a market preference for large displacement vehicles. In addition, the number of vehicles in the network is also diminished because of the small inventory of large displacement vehicles. If the government wishes to ensure the safety of the network by regulating the number of online car-hailing vehicles, it need only control the strictness and execution of some indicators.
Third, implementing the EV replacement policy will help reduce the direct GHG emissions of network cars and promote EV sales. The results showed that in Situation 3, the ratio of EVs to total network vehicles was 49.55% under a strict PRMOCH, while the ratio of online EVs to total vehicles was 4.6% under a less-strict PRMOCH. This means that EV replacement policies help to promote EVs in the market, and strict PRMOCH standards particularly amplify this effect.
Fourth, we found that the actual results were all somewhat larger than our estimates, which we believe is mainly due to the promotion of the online car-hailing and the increased awareness of residents to regulate their driving, which makes the market penetration of net cars higher than our simulated values and, ultimately, makes the emission reduction effect better.
In addition, it is better to implement strict policies throughout the country than in just the first- and second-tier cities to implement the government’s goal of the safety and quantity control of online car-hailing. Therefore, if the government’s goal is to regulate the number of online vehicles across the country, it needs to implement a stricter national PRMOCH.
Author Contributions
Conceptualization, I.Y.Z., Q.L. and T.W.; methodology, I.Y.Z., J.C. and Z.N.; formal analysis, I.Y.Z., J.C. and Z.N.; resources, Q.L. and T.W.; data curation, T.W.; writing—original draft preparation, I.Y.Z., J.C.; writing—review and editing, Z.N.; funding acquisition, Q.L. and T.W. All authors have read and agreed to the published version of the manuscript.
Funding
The project was sponsored in part by the National Natural Science Foundation of China (71804181, 11902350) and in part by the National Center for Mathematics and Interdisciplinary Sciences, CAS.
Data Availability Statement
Not applicable.
Acknowledgments
For helpful comments and discussions, we thank Liulei Shen.
Conflicts of Interest
The authors declare no conflict of interest.
Appendix A
Table A1.
Descriptive statistics of 31 key indicators in the PRMOCH standards of 249 local governments.
Table A1.
Descriptive statistics of 31 key indicators in the PRMOCH standards of 249 local governments.
| Variable | Unit | N | Mean | Sd | Min | Max |
|---|---|---|---|---|---|---|
| Wheelbase | mm | 249 | 2549.98 | 173.81 | 2350 | 3000 |
| Wheelbase of hybrid car | 249 | 2418.47 | 61.24 | 2400 | 2700 | |
| Wheelbase for new energy vehicle EV cruising range | 249 | 2310.4 | 305.63 | 2000 | 2700 | |
| km | 249 | 147.19 | 76.19 | 80 | 260 | |
| Vehicle insurance maximum compensation | Ten thousand (CNY) | 249 | 26.99 | 32.91 | 10 | 100 |
| Vehicle price | 249 | 8.06 | 2.58 | 6 | 16 | |
| Term of transport license | Year | 249 | 6.36 | 2.29 | 3 | 8 |
| Age of vehicle | 249 | 2.67 | 1.09 | 1 | 6 | |
| Term of driving license Driving qualification certificate revocation record | 249 | 0.81 | 1.61 | 1 | 8 | |
| 249 | 0.69 | 1.12 | 1 | 3 | ||
| Emissions | L | 249 | 1.25 | 0.32 | 1 | 2 |
| Criminal record | NA(0) Yes(1) regulations | 249 | 1 | 0 | 1 | 1 |
| Dangerous driving record | 249 | 0.98 | 0.15 | 0 | 1 | |
| Drug abuse record | 249 | 0.98 | 0.15 | 0 | 1 | |
| Drunk record | 249 | 0.98 | 0.15 | 0 | 1 | |
| Violence | 249 | 0.97 | 0.17 | 0 | 1 | |
| Seating capacity of the vehicle | 249 | 0.97 | 0.17 | 0 | 1 | |
| Illegal behavior | 249 | 0.96 | 0.19 | 0 | 1 | |
| Car registration | 249 | 0.94 | 0.23 | 0 | 1 | |
| Driving experience | 249 | 0.94 | 0.25 | 0 | 1 | |
| Whether they passed the integrity assessment | 249 | 0.93 | 0.25 | 0 | 1 | |
| Vehicle driving period | 249 | 0.89 | 0.31 | 0 | 1 | |
| Driver registration | 249 | 0.82 | 0.38 | 0 | 1 | |
| Punishment regulation | 249 | 0.75 | 0.43 | 0 | 1 | |
| Driver age requirement | 249 | 0.69 | 0.46 | 0 | 1 | |
| Driver health requirement | 249 | 0.53 | 0.5 | 0 | 1 | |
| Traffic crime record | 249 | 0.33 | 0.47 | 0 | 1 | |
| Passenger requirements | 249 | 0.31 | 0.46 | 0 | 1 | |
| Requirements for establishing a bad record list system | 249 | 0.18 | 0.38 | 0 | 1 | |
| Body length requirements | 249 | 0.1 | 0.3 | 0 | 1 | |
| Driver education requirements | 249 | 0.08 | 0.28 | 0 | 1 |
Appendix B
Table A2.
Sensitivity analysis.
Table A2.
Sensitivity analysis.
| Model 1 | Model 2 | Model 3 | Model 4 | Model 5 | ||||||
|---|---|---|---|---|---|---|---|---|---|---|
| (1) | (2) | (1) | (2) | (1) | (2) | (1) | (2) | (1) | (2) | |
| driving_licence_term | −0.0414 | 0.375 ** | −0.0414 | 0.375 ** | −0.0455 | 0.399 ** | −0.0474 | 0.398 ** | −0.11 | 0.27 |
| (−0.33) | (−2.74) | (−0.33) | (−2.74) | (−0.37) | (−2.97) | (−0.38) | (−2.89) | (−0.87) | (−1.77) | |
| vehicle_prices | −1.257 *** | −0.126 | −1.257 *** | −0.126 | −1.237 *** | −0.0822 | −1.221 *** | −0.0959 | −1.371 *** | −0.02 |
| (−4.83) | (−0.48) | (−4.83) | (−0.48) | (−4.81) | (−0.31) | (−4.78) | (−0.36) | (−4.81) | (−0.07) | |
| number_of_seats | 1.824 ** | 2.615 ** | 1.824 ** | 2.615 ** | 1.846 ** | 2.384 ** | 1.876 ** | 2.561 ** | 1.477 * | 1.418 |
| (−2.63) | (−3.25) | (−2.63) | (−3.25) | (−2.66) | (−3.05) | (−2.74) | (−3.17) | (−2.04) | (−1.57) | |
| health | 1.088 ** | 1.218 * | 1.088 ** | 1.218 * | 1.075 ** | 1.319 * | 1.133 ** | 0.995 | 1.182 ** | 1.029 |
| (−2.94) | (−2.09) | (−2.94) | (−2.09) | (−2.92) | (−2.28) | (−3.11) | (−1.75) | (−3.1) | (−1.69) | |
| endurance_mileage | 0.0332 | 0.0614 | 0.0332 | 0.0614 | 0.0315 | 0.0463 | ||||
| (−0.42) | (−0.53) | (−0.42) | (−0.53) | (−0.4) | (−0.41) | |||||
| if_traffic_ Violation_record | −0.0543 | 0.7 | −0.0543 | 0.7 | −0.0307 | 0.642 | ||||
| (−0.14) | (−1.27) | (−0.14) | (−1.27) | (−0.08) | (−1.16) | |||||
| if_criminal_record | 0.934 | −1.926 | 0.934 | −1.926 | 0.832 | −1.978 | ||||
| (−0.89) | (−1.51) | (−0.89) | (−1.51) | (−0.79) | (−1.56) | |||||
| driving_time_limit | 0.265 | 0.198 | 0.363 | 0.785 | ||||||
| (−0.41) | (−0.23) | (−0.55) | (−0.82) | |||||||
| bodywork_length | −0.0608 | 1.781 * | 0.149 | 1.720 * | ||||||
| (−0.10) | (−2.44) | (−0.24) | (−2.24) | |||||||
| vehicle_wheelbase | 0.42 | 1.027 ** | ||||||||
| (−1.18) | (−2.7) | |||||||||
| transport_license_term | 0.0322 | −0.191 | ||||||||
| (−0.4) | (−1.41) | |||||||||
| BC wheelbase | 0.174 ** | 0.13 | ||||||||
| (−2.76) | (−1.33) | |||||||||
| cityye | −0.858 | −0.0205 | −0.858 | −0.0205 | −0.815 | −0.136 | −0.76 | 0.266 | −1.144 | 0.294 |
| (−1.18) | (−0.02) | (−1.18) | (−0.02) | (−1.11) | (−0.15) | (−1.04) | (−0.3) | (−1.52) | (−0.31) | |
| fuel95 | 10.55 *** | 3.27 | 10.55 *** | 3.27 | 10.38 *** | 3.574 | 10.27 *** | 1.304 | 10.50 *** | 2.041 |
| (−3.59) | (−0.78) | (−3.59) | (−0.78) | (−3.53) | (−0.88) | (−3.53) | (−0.3) | (−3.4) | (−0.43) | |
| fuel92 | −8.135 * | −4.414 | −8.135 * | −4.414 | −7.866 * | −5.106 | −8.259 * | −2.349 | −8.530 * | −2.449 |
| (−2.46) | (−0.92) | (−2.46) | (−0.92) | (−2.36) | (−1.09) | (−2.47) | (−0.48) | (−2.46) | (−0.45) | |
| Unemployed _persons | 0.0000492 ** | 0.00000356 | 0.0000492 ** | 0.00000356 | 0.0000487 ** | 0.0000035 | 0.0000516 ** | −0.00000579 | 0.0000557 ** | −0.00000627 |
| (−2.64) | (−0.22) | (−2.64) | (−0.22) | (−2.59) | (−0.22) | (−2.68) | (−0.35) | (−2.71) | (−0.36) | |
| numbe_of_taxis | −0.00014 | 0.000153 | −0.00014 | 0.000153 | −0.00014 | 0.000161 | −0.000146 | 0.000136 | −0.000174 | 0.000144 |
| (−1.21) | (−1.27) | (−1.21) | (−1.27) | (−1.20) | (−1.37) | (−1.25) | (−1.17) | (−1.40) | (−1.14) | |
| cdz | −0.00199 | −0.000621 | −0.00199 | −0.000621 | −0.00201 | −0.000814 | −0.00222 | 0.000558 | −0.00291 | −0.00000262 |
| (−0.86) | (−0.25) | (−0.86) | (−0.25) | (−0.87) | (−0.33) | (−0.93) | (−0.22) | (−1.12) | (−0.00) | |
| _cons | −22.11 * | 0.631 | −22.11 * | 0.631 | −22.81 * | 3.112 | −19.11 | −1.602 | −18.73 | −4.067 |
| (−2.06) | (−0.04) | (−2.06) | (−0.04) | (−2.13) | (−0.19) | (−1.89) | (−0.10) | (−1.83) | (−0.22) | |
| 234 | 234 | 234 | 234 | 234 | ||||||
t statistics in parentheses, * p < 0.05, ** p < 0.01, *** p < 0.001.
References
- Zhou, K.; Li, Y. Carbon finance and carbon market in China: Progress and challenges. J. Clean. Prod. 2019, 214, 536–549. [Google Scholar] [CrossRef]
- Li, F.; Cai, B.; Ye, Z.; Wang, Z.; Zhang, W.; Zhou, P.; Chen, J. Changing patterns and determinants of transportation carbon emissions in Chinese cities. Energy 2019, 174, 562–575. [Google Scholar] [CrossRef]
- Kechagias, E.P.; Gayialis, S.P.; Konstantakopoulos, G.D.; Papadopoulos, G.A. Traffic flow forecasting for city logistics: A literature review and evaluation. Int. J. Decis. 2019, 4, 159–176. [Google Scholar] [CrossRef]
- Zhang, L.; Long, R.; Chen, H.; Geng, J. A review of China’s road traffic carbon emissions. J. Clean. Prod. 2019, 207, 569–581. [Google Scholar] [CrossRef]
- Kechagias, E.P.; Miloulis, D.M.; Chatzistelios, G.; Gayialis, S.P.; Papadopoulos, G.A. Applying a system dynamics approach for the pharmaceutical industry: Simulation and optimization of the quality control process. WSEAS Trans. Environ. Dev. 2021, 17, 983–996. [Google Scholar] [CrossRef]
- Brohi, S.N.; Pillai, T.R.; Asirvatham, D.; Ludlow, D.; Bushell, J. Towards smart cities development: A study of public transport system and traffic-related air pollutants in Malaysia. Iop Conf. Ser. Earth Environ. Sci. IOP Publ. 2018, 167, 012015. [Google Scholar] [CrossRef]
- Konstantakopoulos, G.D.; Gayialis, S.P.; Kechagias, E.P.; Papadopoulos, G.A.; Tatsiopoulos, I.P. An algorithmic approach for sustainable and collaborative logistics: A case study in Greece. Int. J. Inf. Manag. Data Insights 2021, 1, 100010. [Google Scholar] [CrossRef]
- Jia, S.; Yan, G.; Shen, A. Traffic and emissions impact of the combination scenarios of air pollution charging fee and subsidy. J. Clean. Prod. 2018, 197, 678–689. [Google Scholar] [CrossRef]
- Zhu, G.; Li, H.; Li, Z. Enhancing the development of sharing economy to mitigate the carbon emission: A case study of online ride-hailing development in China. Nat. Hazards 2018, 91, 611–633. [Google Scholar] [CrossRef]
- Hazée, S.; Vaerenbergh, Y.V.; Delcourt, C.; Kabadayi, S. Service delivery system design for risk management in sharing-based product service systems: A customer-oriented approach. Int. J. Oper. Prod. Manag. 2020, 40, 459–479. [Google Scholar] [CrossRef]
- Li, D.; Huang, Y.; Sun, H.; Zhi, B. Achieving sustainability in sharing-based product service system: A contingency perspective. J. Clean. Prod. 2022, 332, 129997. [Google Scholar] [CrossRef]
- Akbar, P.; Hoffmann, S. Creating value in product service systems through sharing. J. Bus. Res. 2020, 121, 495–505. [Google Scholar] [CrossRef]
- Haber, N.; Fargnoli, M. Designing product-service systems: A review towards a unified approach. In Proceedings of the International Conference on Industrial Engineering and Operations Management, Rabat, Morocco, 11–13 April 2017; pp. 817–837. [Google Scholar]
- Koide, R.; Murakami, S.; Nansai, K. Prioritising low-risk and high-potential circular economy strategies for decarbonisation: A meta-analysis on consumer-oriented product-service systems. Renew. Sustain. Energy Rev. 2022, 155, 111858. [Google Scholar] [CrossRef]
- Wu, T.; Qu, S.; Xu, M.; Peng, T.; Ou, X. Development and application of an energy use and CO2 emissions reduction evaluation model for china’s online car hailing services. Energy 2018, 154, 298–307. [Google Scholar] [CrossRef]
- Ferrero, F.; Perboli, G.; Rosano, M.; Vesco, A. Car-sharing services: An annotated review. Sustain. Cities Soc. 2018, 37, 501–518. [Google Scholar] [CrossRef]
- Rong, K.; Hu, J.; Ma, Y.; Ming, K.L.; Yang, L.; Chao, L. The sharing economy and its implications for sustainable value chains. Resour. Conserv. Recycl. 2018, 130, 188–189. [Google Scholar] [CrossRef]
- de Souza Silva, L.A.; de Andrade, M.O.; Alves Maia, M.L. How does the ride-hailing systems demand affect individual transport regulation? Res. Transp. Econ. 2018, 69, 600–606. [Google Scholar] [CrossRef] [Green Version]
- Wu, T.; Wang, S.; Wang, L.; Tang, X. Contribution of China’s online car-hailing services to its 2050 carbon target: Energy consumption assessment based on the GCAM-SE model. Energy Policy 2022, 160, 112714. [Google Scholar] [CrossRef]
- Guo, Y.; Xin, F.; Barnes, S.J.; Li, X. Opportunities or threats: The rise of online collaborative consumption (OCC) and its impact on new car sales. Electron. Commer. Res. Appl. 2018, 29, 133–141. [Google Scholar] [CrossRef] [Green Version]
- Wong, R.C.P.; Szeto, W.Y.; Wong, S.C. Behavior of taxi customers in hailing vacant taxis: A nested logit model for policy analysis. J. Adv. Transp. 2016, 49, 867–883. [Google Scholar] [CrossRef] [Green Version]
- Zuo, W.; Zhu, W.; Chen, S.; He, X. Service quality management of online car-hailing based on PCN in the sharing economy. Electron. Commer. Res. Appl. 2019, 34, 100827. [Google Scholar] [CrossRef]
- Zandie, M.; Ng, H.K.; Gan, S.; Said, M.; Cheng, X. Review of the advances in integrated chemical kinetics-computational fluid dynamics combustion modelling studies of gasoline-biodiesel mixtures. Transp. Eng. 2021, 7, 100102. [Google Scholar] [CrossRef]
- Dey, S.; Mehta, N.S. Selection of manganese oxide catalysts for catalytic oxidation of carbon monoxide at ambient conditions. Resour. Environ. Sustain. 2020, 1, 100003. [Google Scholar] [CrossRef]
- Dey, S.; Mehta, N.S. Automobile pollution control using catalysis. Resour. Environ. Sustain. 2020, 2, 100006. [Google Scholar] [CrossRef]
- Dey, S.; Mehta, N.S. Synthesis of CuMnOx catalysts by using various precipitants for oxidation of carbon monoxide. Resour. Environ. Sustain. 2021, 4, 100025. [Google Scholar] [CrossRef]
- Wu, T.; Zhang, M.; Tian, X.; Wang, S.; Hua, G. Spatial differentiation and network externality in pricing mechanism of online car hailing platform. Int. J. Prod. Econ. 2019, 219, 275–283. [Google Scholar] [CrossRef]
- Ma, L.; Li, Y. How does the government regulate the sharing economy: An empirical study of China’s urban ride-hailing policies. E-Government 2018, 4, 9–20. (In Chinese) [Google Scholar]
- Bischoff, J.; Kaddoura, I.; Maciejewski, M.; Nagel, K. Simulation-based optimization of service areas for pooled ride-hailing operators. Procedia Comput. Sci. 2018, 130, 816–823. [Google Scholar] [CrossRef]
- Cheng, X.; Fu, S.; de Vreede, G.-J. A mixed method investigation of sharing economy driven car-hailing services: Online and offline perspectives. Int. J. Inf. Manag. 2018, 41, 57–64. [Google Scholar] [CrossRef]
- Illgen, S.; Höck, M. Electric vehicles in car sharing networks—Challenges and simulation model analysis. Transp. Res. D Transp. Environ. 2018, 63, 377–387. [Google Scholar] [CrossRef]
- Song, M.; Zhou, Y. Analysis of carbon emissions and their influence factors based on data from Anhui of China. Comput. Econ. 2015, 46, 359–374. [Google Scholar] [CrossRef]
- van der Kamp, D.; Lorentzen, P.; Mattingly, D. Racing to the bottom or to the top? decentralization, revenue pressures, and governance reform in China. World Dev. 2017, 95, 164–176. [Google Scholar] [CrossRef]
- Zhang, K.; Zhang, Z.-Y.; Liang, Q.-M. An empirical analysis of the green paradox in China: From the perspective of fiscal decentralization. Energy Policy 2017, 103, 203–211. [Google Scholar] [CrossRef]
- Yang, C. The Embarrassment and the Way Out of the “Online Car Hailing Policy”. 2018. Available online: https://baijiahao.baidu.com/s?id=1613224968998164701&wfr=spider&for=pc (accessed on 14 December 2021).
- Ma, L.; Wu, M.; Tian, X.; Zheng, G.; Du, Q.; Wu, T. China’s Provincial Vehicle Ownership Forecast and Analysis of the Causes Influencing the Trend. Sustainability 2019, 11, 3928. [Google Scholar] [CrossRef] [Green Version]
- Van Mierlo, J.; Messagie, M.; Rangaraju, S. Comparative environmental assessment of alternative fueled vehicles using a life cycle assessment. Transp. Res. Procedia 2017, 25, 3435–3445. [Google Scholar] [CrossRef]
- Newman, J.P.; Lurkin, V.; Garrow, L.A. Computational methods for estimating multinomial, nested, and cross-nested logit models that account for semi-aggregate data. J. Choice Model. 2018, 26, 28–40. [Google Scholar] [CrossRef]
- Train, K.E. Discrete Choice Methods with Simulation, 2nd ed.; Cambridge University Press: Cambridge, UK, 2009; pp. 34–75. [Google Scholar]
- Uncles, M.D. Discrete choice analysis: Theory and application to travel demand. J. Oper. Res. Soc. 1987, 38, 370–371. [Google Scholar]
- Han, H.; Wang, H.W.; Cheng, F. Vehicle survival patterns in China. Sci. China Technol. Sci. 2011, 54, 625–629. (In Chinese) [Google Scholar]
- Rong, C.; Wang, X. Identify the nature of online booked vehicle and promote regulatory reform of taxi industry. China Transp. Rev. 2016, 38, 4–10. (In Chinese) [Google Scholar]
- Hu, G. Business Plan Analysis of Online Car Hailing Market. 2017. Available online: https://www.sohu.com/a/136991121_662385 (accessed on 14 December 2021).
- Fiegerman, S. Uber CEO: We’re Creating 50,000 New Jobs per Month. 2014. Available online: https://mashable.com/archive/uber-ceo-techcrunch-disrupt (accessed on 14 December 2021).
- Lin, C.; Wu, T.; Ou, X.; Zhang, Q.; Zhang, X.; Zhang, X. Life-cycle private costs of hybrid electric vehicles in the current chinese market. Energy Policy 2013, 55, 501–510. [Google Scholar] [CrossRef]
- Du, Z.; Lin, B. How oil price changes affect car use and purchase decisions? Survey evidence from Chinese cities. Energy Policy 2017, 111, 68–74. [Google Scholar] [CrossRef]
- Wallington, T.J.; Anderson, J.E.; Kleine, R.D.; Kim, H.C.; Maas, H.; Brandt, A.R.; Keoleian, G.A. When comparing alternative fuel-vehicle systems, life cycle assessment studies should consider trends in oil production. J. Ind. Ecol. 2017, 21, 244–248. [Google Scholar] [CrossRef] [Green Version]
- Apergis, N.; Vouzavalis, G. Asymmetric pass through of oil prices to gasoline prices: Evidence from a new country sample. Energy Policy 2018, 114, 519–528. [Google Scholar] [CrossRef]
- Gnann, T.; Funke, S.; Jakobsson, N.; Plötz, P.; Sprei, F.; Bennehag, A. Fast charging infrastructure for electric vehicles: Today’s situation and future needs. Transp. Res. D Transp. Environ. 2018, 62, 314–329. [Google Scholar] [CrossRef]
- China Electric Vehicle Charging Infrastructure Promotion Alliance. Promotion and Application of EV Charging Infrastructure Nationwide in June 2018. Available online: https://www.sohu.com/a/240548346_637762 (accessed on 14 December 2021).
- Huo, H.; Wang, M. Modeling future vehicle sales and stock in China. Energy Policy 2012, 43, 17–29. [Google Scholar] [CrossRef]
- Wu, T.; Zhao, H.; Ou, X. Vehicle ownership analysis based on GDP per capita in China: 1963–2050. Sustainability 2014, 6, 4877–4899. [Google Scholar] [CrossRef] [Green Version]
- Wang, Y.; Sperling, D.; Tal, G.; Fang, H. China’s electric car surge. Energy Policy 2017, 102, 486–490. [Google Scholar] [CrossRef]
- Constantinides, P.; Barrett, M. Information infrastructure development and governance as collective action. Inf. Syst. Res. 2014, 26, 40–56. [Google Scholar] [CrossRef] [Green Version]
- China 2016 Motor Vehicle Driver Data: About 97 Million Female Drivers! 2018. Available online: http://www.techweb.com.cn/it/2017-01-11/2471459.shtml (accessed on 14 December 2021).
- There Are 370 Million Motor Vehicle Drivers in China. 2018. Available online: http://www.sohu.com/a/156281809_706013 (accessed on 14 December 2021).
- China New Employment Pattern Research Center. Research Report on the Quality of New Employment Patterns in China. 2018. Available online: http://tech.cnr.cn/techgd/20180711/t20180711_524297760.shtml (accessed on 14 December 2021).
- Nandu Big Data Institute. 30 Million Online Car-Hailing Drivers Serve 300 Million Users. 2018. Available online: https://new.qq.com/omn/20191016/20191016A0RF8X00.html (accessed on 14 December 2021).
- Rao, X. Beijing Fold of Didi Driver: Become black Car Overnight, Some People Leave Others to Hide. 2018. Available online: https://www.huxiu.com/article/258327.html (accessed on 14 December 2021).
- Guo, Y. The stewardess is killed by a ride, is the Didi company legally responsible? Fangyuan Mag. 2018, 10, 7–8. (In Chinese) [Google Scholar]
- Lin, B.; Wu, W. Why people want to buy electric vehicle: An empirical study in first-tier cities of China. Energy Policy 2018, 112, 233–241. [Google Scholar] [CrossRef]
- BloombergNEF. Electric Vehicle Outlook 2019. 2018. Available online: https://about.bnef.com/electric-vehicle-outlook/ (accessed on 14 December 2021).
- Garcia, R.; Freire, F.; Clift, R. Effects on greenhouse gas emissions of introducing electric vehicles into an electricity system with large storage capacity. J. Ind. Ecol. 2018, 22, 288–299. [Google Scholar] [CrossRef]
- Peng, T.; Ou, X.; Yan, X. Development and application of an electric vehicles life-cycle energy consumption and greenhouse gas emissions analysis model. Chem. Eng. Res. Des. 2018, 131, 699–708. [Google Scholar] [CrossRef]
- Orsi, F.; Muratori, M.; Rocco, M.; Colombo, E.; Rizzoni, G. A multi-dimensional well-to-wheels analysis of passenger vehicles in different regions: Primary energy consumption, CO2 emissions, and economic cost. Appl. Energy 2016, 169, 197–209. [Google Scholar] [CrossRef]
- Hawkins, T.R.; Singh, B.; Majeau-Bettez, G.; Strømman, A.H. Comparative environmental life cycle assessment of conventional and electric vehicles. J. Ind. Ecol. 2013, 17, 53–64. [Google Scholar] [CrossRef]
- Shen, W.; Han, W.; Chock, D.; Chai, Q.; Zhang, A. Well-to-wheels life-cycle analysis of alternative fuels and vehicle technologies in China. Energy Policy 2012, 49, 296–307. [Google Scholar] [CrossRef]
- Borucka, A.; Winiowski, P.; Mazurkiewicz, D.; Widerski, A. Laboratory measurements of vehicle exhaust emissions in conditions reproducing real traffic. Measurement 2021, 174, 108998. [Google Scholar] [CrossRef]
- Zhang, Q.; Tong, Q. The economic impacts of traffic consumption during the COVID-19 pandemic in China: A CGE analysis. Transp. Policy 2021, 114, 330–337. [Google Scholar] [CrossRef]
- Goodspeed, R.; Xie, T.; Dillahunt, T.R.; Lustig, J. An alternative to slow transit, drunk driving, and walking in bad weather: An exploratory study of ridesourcing mode choice and demand. J. Transp. Geogr. 2019, 79, 102481. [Google Scholar] [CrossRef]
- Gomez, J.; Aguilera-García, A.; Dias, F.F.; Bhat, C.R.; Vassallo, J.M. Adoption and frequency of use of ride-hailing services in a European city: The case of Madrid. Transp. Res. Part C Emerg. Technol. 2021, 131, 103359. [Google Scholar] [CrossRef]

Publisher’s Note: MDPI stays neutral with regard to jurisdictional claims in published maps and institutional affiliations. |
© 2022 by the authors. Licensee MDPI, Basel, Switzerland. This article is an open access article distributed under the terms and conditions of the Creative Commons Attribution (CC BY) license (https://creativecommons.org/licenses/by/4.0/).