Article

Identification of Sustainable Development Priorities for Agriculture through Sustainable Livelihood Security Indicators for Karnataka, India

by
Shankarappa Sridhara
1,*,
Pradeep Gopakkali
1,
Konapura Nagaraja Manoj
1,
Kiran Kumar R. Patil
2,
Venkatesh Paramesh
3,
Prakash Kumar Jha
4 and
P. V. Vara Prasad
4,5
1
Center for Climate Resilient Agriculture, University of Agricultural and Horticultural Sciences, Shivamogga 577204, Karnataka, India
2
Department of Agricultural Economics, University of Agricultural and Horticultural Sciences, Shivamogga 577255, Karnataka, India
3
ICAR-Central Coastal Agricultural Research Institute, Old Goa 403402, Goa, India
4
Sustainable Intensification Innovation Lab, Kansas State University, Manhattan, KS 66506, USA
5
Department of Agronomy, Kansas State University, Manhattan, KS 66506, USA
*
Author to whom correspondence should be addressed.
Sustainability 2022, 14(3), 1831; https://doi.org/10.3390/su14031831
Submission received: 7 January 2022 / Revised: 27 January 2022 / Accepted: 2 February 2022 / Published: 5 February 2022

Abstract

:
To cope with worsening climate change and widening intergenerational equity issues, more impetus should be given to sustainable development. India, predominantly an agrarian economy, faces most pressing issues of sustainable development with a complex territorial hegemony of the population and their dynamic food demands. Regional production systems play a vital role in strengthening national sustainable development priorities in India. Hence, to realize the dimensions of sustainable development in a more meaningful way, sustainability needs to be prioritized in an agrarian economy. Sustainability is a complex phenomenon encompassing economic, ecological and equity dimensions. A modest attempt in this regard has been made to estimate normative sustainable indicators for Karnataka state considering 20 crucial indicators or variables governing different dimensions. Using principal component analysis and linear scoring techniques, a minimum dataset including forest cover, livestock and human population density, and cropping intensity governing ecological issues, groundwater availability and milk availability governing social equity issues, and net cropped area, land productivity, labor productivity, food grain productivity and fertilizer use governing economic efficiency was identified, constituting crucial indicators for the development of the sustainable livelihood security index. The computed index was used to classify districts in Karnataka into various sustainable categories. Among 27 districts, 13 districts were grouped as less sustainable, 4 as highly sustainable and 10 as moderately sustainable categories. This classification and knowledge provide clues for policy makers to transform less sustainable districts into moderately/highly sustainable ones by formulating suitable policies related to crucial factors. Formulated policies on crucial factors have a domino effect/causation effect and bring about desirable changes in all other indicator variables, leading to the sustainable development of the target districts in Karnataka. This approach can be used at different scales in other states in India and in other developing countries.

1. Introduction

Sustainable livelihood security (SLS) is a broad concept encompassing present concerns and policy requirements for sustainable development in the long run. Barbier [1] emphasized environmental science and economics while explaining sustainable development, while Garnett et al. [2] defined it as a process wherein human wants in general and the needs of the poor specifically are met, giving due concern for the environment. SLS indicates economically efficient, ecologically secure, and socially equitable livelihood options [3,4]. The concept of sustainable livelihood is beyond the traditional definitions which aim at poverty elimination. These definitions concentrated only on manifestations of poverty, denying key factors such as frangibility and social exclusion [5]. In the recent past, greater attention has been given to different features and processes which can either limit or intensify the potential of poor people to make a living in an economically, ecologically, and socially sustainable manner in rural areas. Several studies indicated the suitability of the Sustainable Livelihood Security Index (SLSI) as an integrative policy after critical assessment of agricultural sustainability using relevant indicators [6,7,8,9]. In the past few years, there have been emphases on the dual goals of increasing both productivity and positive environmental outcomes, which can be obtained simultaneously with a focus on sustainable intensification [10]. A recent global assessment showed that sustainable intensification offers synergistic opportunities for the co-production of agricultural and natural outcomes; however, efficiency, substitution and system redesign are essential to deliver optimum outcomes that are both ecological and economical [10]. In addition to biophysical innovations, it will require social innovations which include building social capital and changes in national and regional policies [11]. A broader frame of indicators covering different domains (productivity, economics, environment, social and human aspects) must be evaluated using proper indicators and metrics [12,13].
India is one of the largest agrarian countries, and the development of the agricultural sector is quite challenging with many issues. India has the largest area of rainfed dryland agriculture globally, with a variety of distinct types of farming systems producing most of its coarse cereals, food legumes, minor millets, and a large number of livestock [14]. Significant socio-ecological challenges overlap in these landscapes: endemic poverty, malnutrition, and land degradation [14]. Addressing these challenges is vital for national and regional food and nutritional security. Sub-optimal growth, poor or a lack of income generation, and the relocation of farmers to other livelihood activities other than agriculture are the signs of the degradation of natural resources and the weakening the socio-economic status of farmers [15]. Karnataka is the state in India with the second largest extent of agriculture coming under rainfed conditions, and the growth is affected by the quantum variability and distribution of rainfall received during the monsoon season. The agriculture sector offers the largest source of employment and is the prime source of income for the farming households of Karnataka. The contribution of agriculture towards Karnataka state’s gross domestic product in absolute terms is ever increasing and significant, while a declining trend has been observed in relative terms compared to manufacturing and service sectors [16]. Although the per capita income has increased significantly because of an expansion in the manufacturing and service sectors in Karnataka, the per capita gross domestic product (GDP) from agriculture has remained low in rural areas, with widening inter-sectoral inequities [16]. More than half of Karnataka’s workforce brings in less than one-fifth of the GDP, due to the low productivity of labor in the agricultural sector. This has major ramifications for the well- being of the rural population and poverty alleviation [16].
The sustainable livelihood at regional level is assessed by taking into account the following goals of the United Nations, viz., the sustainable development goals (SDG): SDG-2, related to zero hunger (e.g., availability of food grain and milk), SDG-3 for good health and well-being (e.g., mortality rate of infants), SDG-5 for gender equality (e.g., % literacy of rural female), SDG-8 for decent work and economic growth (e.g., productivity of labor, land and food grains), SDG-13 for climate action (e.g., % forest cover, pressure on groundwater, % degraded land, variation in rainfall), and SDG-15, related to life on land (e.g., net cropped area, density of human and livestock) [17,18]. The assessment of sustainability must give more emphasis on conserving natural resources that can have a profound influence on the agricultural sector in the long run [15]. Identification of productive indicators is the key to measuring and vividly describing the condition of sustainability [19] and vulnerability of livelihoods [20]. The SLSI has not been assessed extensively for regional agroecosystems, especially in South Asia. This study addresses these issues by identifying sustainable development priorities for agriculture through SLS indicators for the state of Karnataka in India.
In the present study, twenty indicators are considered; most of them address sustainability issues related to agriculture, while a few are associated with SDGs [17]. There is a dearth of scientific studies addressing the sustainable development of agriculture in India at the district level involving the state as a whole entity. Hence, a modest attempt is made in this paper to develop a composite sustainable index which subsumes economic, ecological and equity issues at district level to identify priority areas for the sustainable development of the agriculture sector.

2. Materials and Methods

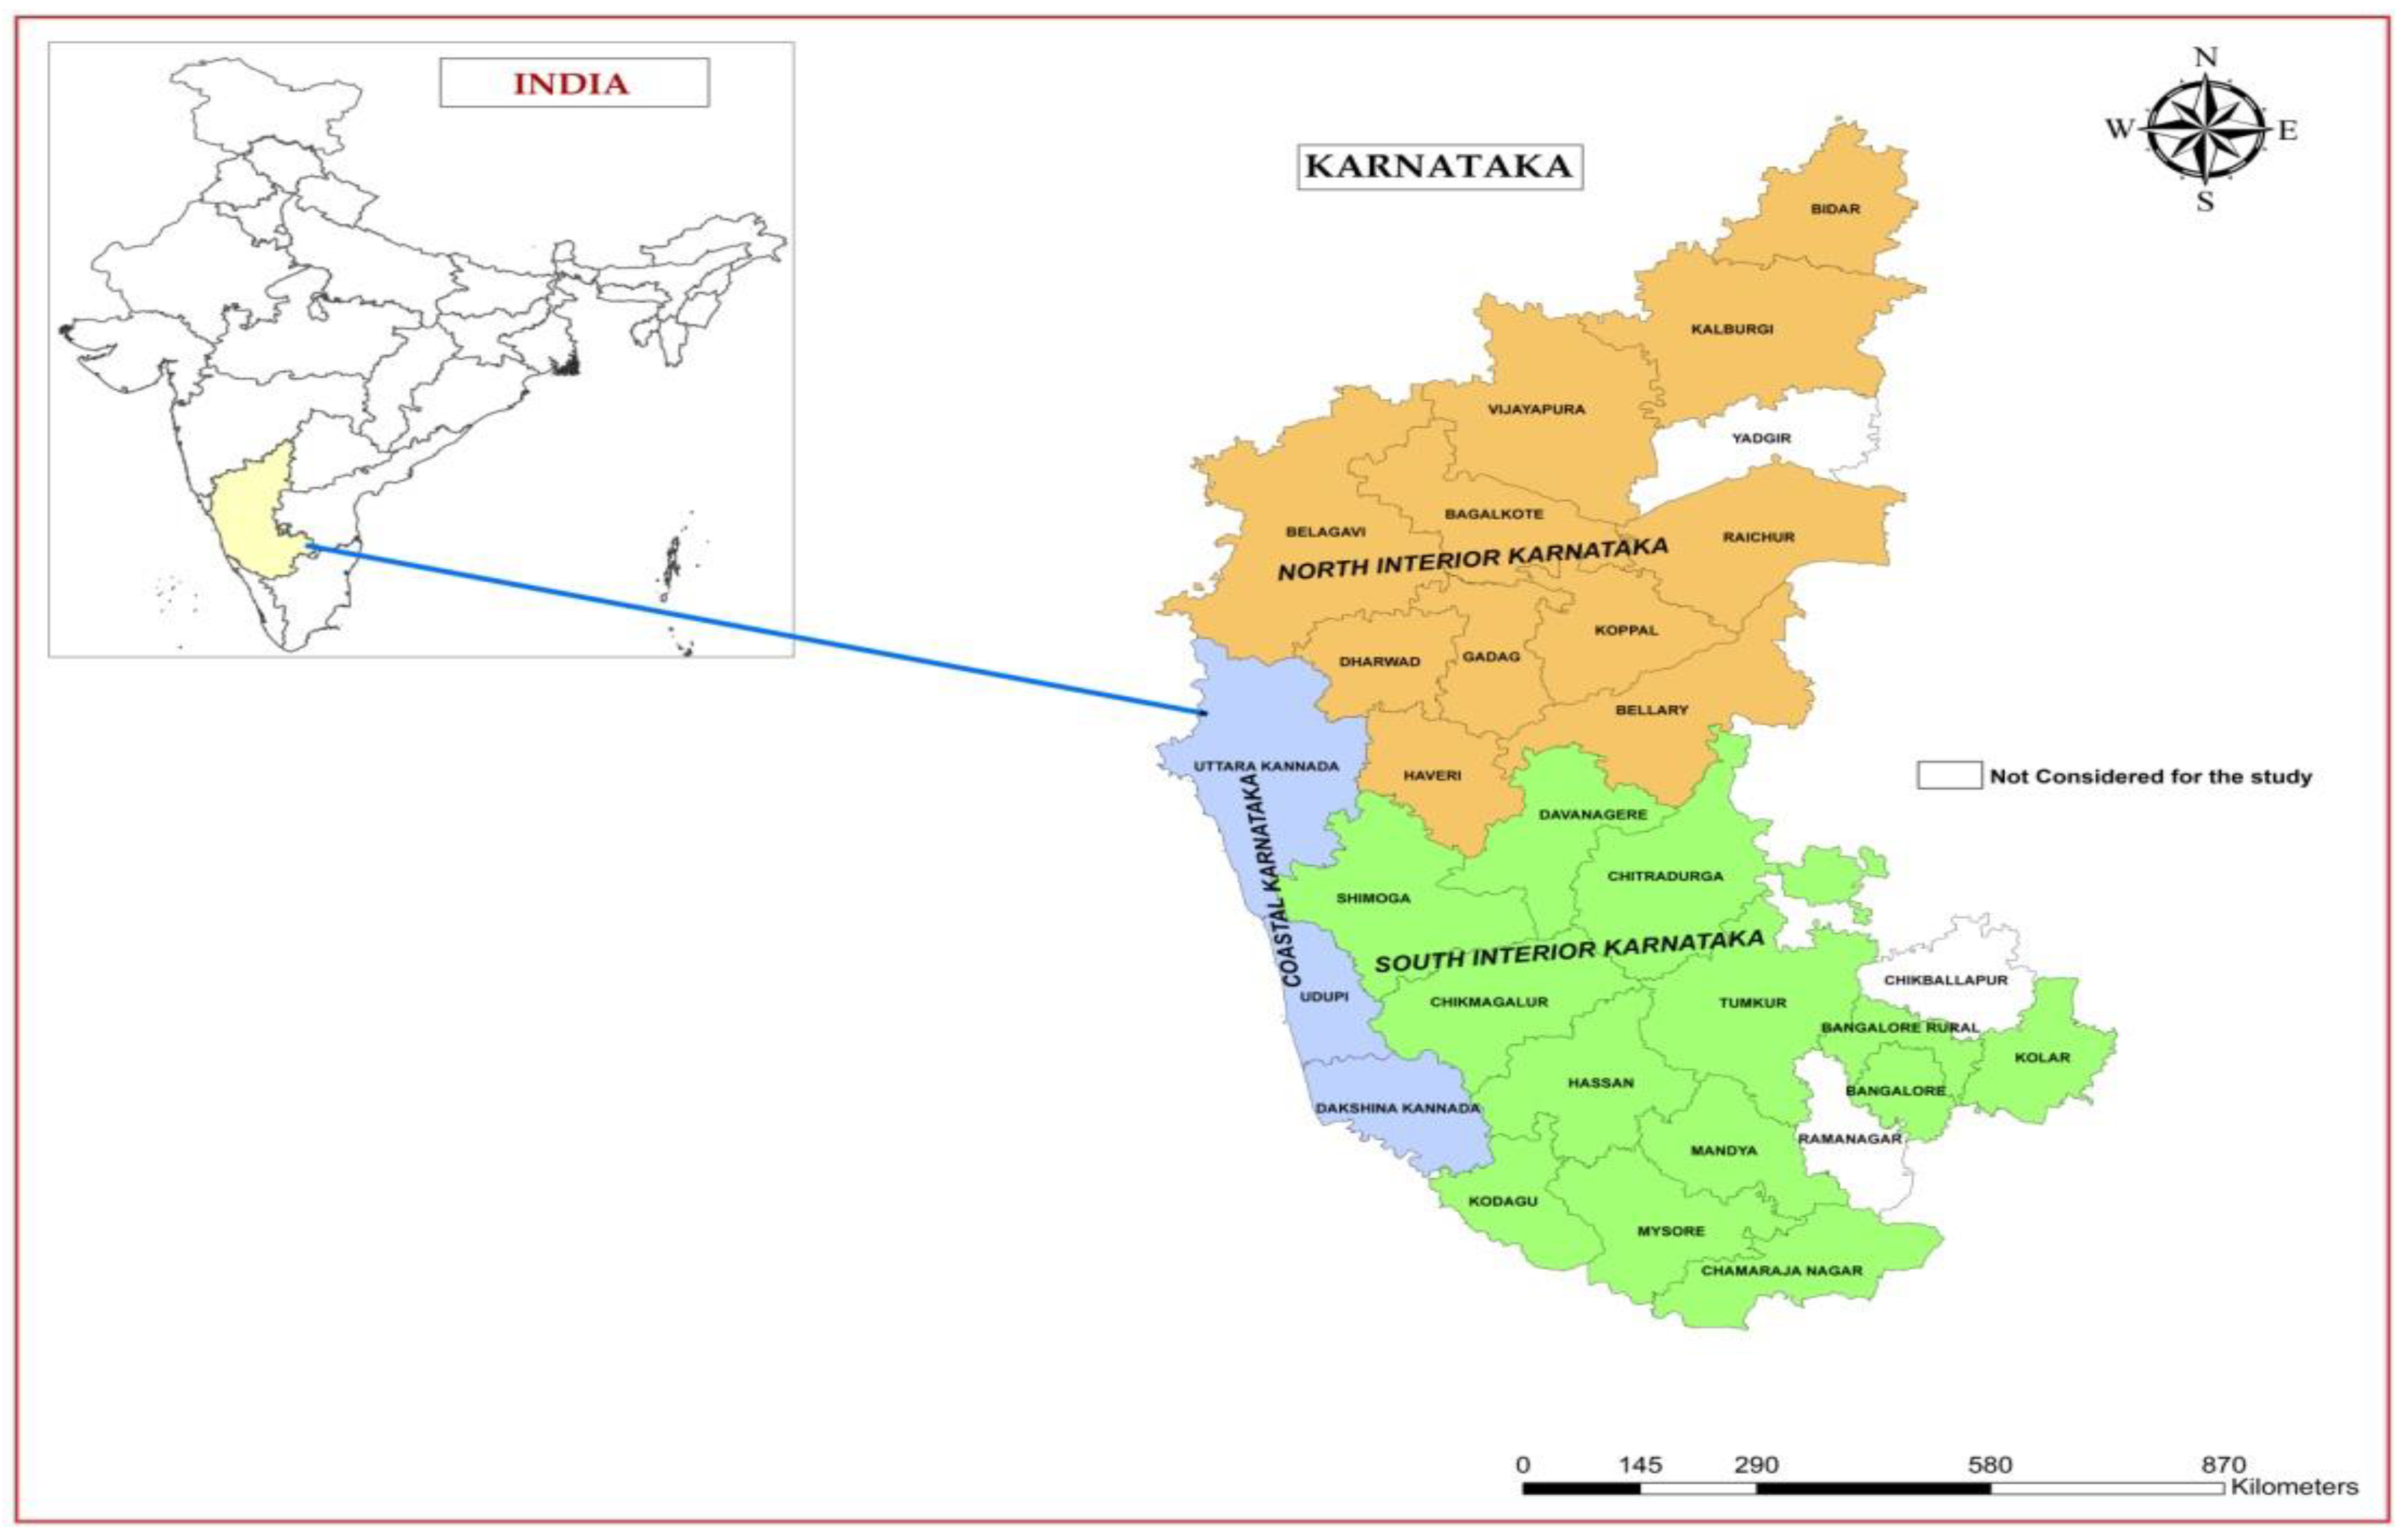
2.1. Study Area and Indicators for Assessment of Sustainable Livelihood Security Index

In the present study, 27 districts of the state of Karnataka (Figure 1) were selected for analysis. The state is located in the south-west of the country, accounting for about 191,791 sq. km of the geographical area. It is the sixth largest state in the country, and is surrounded by Goa, Maharashtra, Telangana, Andhra Pradesh, Tamil Nadu, and Kerala to the west, north-west, north, north-east, east, and south-east, respectively. The larger portion of the state, being dry with little rain, stands third in the country after Rajasthan and Gujarat with respect to area within the arid region. Karnataka is bestowed with a rich diversity of climate, topography, and soils. Based on the climatic gradient between districts, the state is divided into three meteorological regions, namely North Interior Karnataka (NIK), South Interior Karnataka (SIK) and Coastal Karnataka (CK) (Figure 1).
In Karnataka, most rural people rely on agriculture and its related activities, with 56 percent of the workforce consisting of farmers and agricultural laborers. Karnataka has a total of 123,100 km2 of cultivated land as per the Census 2011, accounting for 64.6 percent of the state’s total geographical area. Most of the the state’s agricultural land is subject to monsoon vagaries, posing significant agro-climatic and resource constraints. The main crops grown are rice, ragi, jowar, maize, tur, and gram in addition to oilseeds and cash crops. Karnataka is the largest producer of coarse cereals, coffee, spices, aromatic and medicinal crops, tropical fruits, mulberry, safflower, ragi, arecanut, sunflower and tomatoes among the states in India. It also stands second in milk and grape, third in fruit and sugar and fifth in vegetable production [16,21]. According to the National Institution for Transforming India (NITI) Aayog SDG India index 2020, Karnataka state ranks 4th among the Indian states, with an overall score of 72. The state ranks 1st in affordable and clean energy, and 3rd in sustainable consumption and production goals. Out of 16 SDG goals, the state is an achiever (100) in one goal (affordable and clean energy), a front runner (65–99) in nine goals (no poverty, good health and well-being, clean water and sanitation, decent work and economic growth, reduced inequality, sustainable cities and communities, sustainable consumption and production, life on land, peace, justice and strong institutions), a performer (50–64) in six goals (zero hunger, quality education, gender equality, industry, innovation and infrastructure, climate action, life below water) and an aspirant (0–49) in none of the goals. The values indicated in parenthesis in above statement indicate the SDG India index score (https://www.niti.gov.in (accessed on 15 January 2022)). The complete list of different indicators used for assessment in this study are listed in Table 1.

2.2. Principal Component Analysis

The data pertaining to twenty indicators detailed in Table 1 were considered for the construction of various indices. The selected variables were subjected to principal component analysis (PCA) using SPSS 16 software. PCA is a multivariate statistical tool used to reduce the dimensions of the dataset. In the present study, we had 20 variables which need to be reduced in number to meet the principle of parsimony. On using PCA analysis, with the desired number of principal components, the linear combination of variables considered under study could be extracted. The extraction of principal components was based on the eigenvalue (>1) and the proportion to the total variation explained by each of them (>5%) [18,31]. From the extracted principal components, indicator variables with higher factor loading with the respective principal components were selected to form a minimum dataset (MDS). The selection of indicator variables from each of the principal components was based on the condition that they should not be lower than 20 percent of the highest factor loading. The other intention of PCA analysis was to assign suitable weights for indicator variables chosen as MDS for the construction of the composite index. The weights were assigned to respective indicator variables by considering their respective principal component, and the share of the respective principal component in the total variation was explained by the extracted principal components. The variables considered for construction of various indices were correlated with one another, posing an econometric problem of multicollinearity. PCA is considered as an effective tool to combat multicollinearity. Thus, PCA not only reduced the dimensions but also facilitated the retention of the major share of variation present in the original dataset.

2.3. Linear Scoring Technique

This scoring technique was used to normalize selected indicator variables in the MDS. The obtained indicator variables after normalization were referred to as indicator scores. Indicator scores were used in the construction of the composite index after weighting with suitable weights. Normalization can be performed using linear or non-linear scoring techniques. In the present study, linear scoring technique was employed to normalize the minimum dataset obtained from the PCA. During the construction of the composite index, if indicator variables assumed higher values, then it was “harmful” in some cases while “useful” in some other cases. If indicator variables were “harmful”, then a linear score of “less is better” (YLL) was computed, and if they were “useful”, a linear score of “more is better” (YLM) was computed using the formulae mentioned below:
Y LM = X i X m i n X m a x X m i n
Y LL = X m a x X i X m a x X m i n
where X m a x and X m i n are the maximum and minimum values of the indicator variable X i .
An amalgamation of the “more is better” and “less is better” indicator variables was performed to obtain the optimized composite index. In the current investigation, “more is better” transformation was conducted for variables such as the net cropped area, net irrigated area, grain yield of food crops, fertilizer use, land productivity, labor productivity, forest cover, cropping intensity, availability of food grains, availability of milk, literacy of rural females, rural electrification, village road connectivity, and availability of groundwater. “Less is better’’ transformation was performed for the population density of humans and livestock, degraded land, variation in rainfall, pressure on groundwater, and mortality rate.

2.4. Economic Efficiency Index

Returns per unit of resource use reflect economic efficiency. More returns from the same level of resource use or the same level of returns at a lower level of resource use indicate economic efficiency. In other words, this indicator represents the optimum utilization of resources, resulting in profit. It is considered as the precursor for economic growth. The variables, viz., net sown area, net irrigated area, fertilizer use, food grain yield, land productivity and labor productivity were considered for the construction of the economic efficiency index (EEI). Since the variables considered are few, dimension reduction to form a minimum dataset is not considered. The EEI, being a composite index, was constructed on assigning suitable weights to the abovementioned variables after normalization. Linear normalization techniques with “more is better” or “less is better” scorings were used to obtain indicator scores. The proportion of variation explained by the respective principal component to the total variation explained by the extracted principal components was used as weights in the construction of the composite index.
EEI = i = 1 n W i S i
where Wi is the weight of the indicator based on PCA, Si is the indicator score, and n is the number of indicators considered for the construction of the index.

2.5. Social Equity Index

The Social Equity Index (SEI) represents the fair and just opportunities that everyone in an economy has in terms of access to resources, control over resources, decision making and more. Any divergence in the above is regarded as inequity and is anticipated to have a negative bearing on the holistic development of the society/region. Thus, social equity is said to have a greater say in the development of the region. The variables capturing social equity in the present context are the availability of food grains, milk, ground water, rural electrification, village road connectivity, literacy among women, and infant mortality. The availability of food grains and milk should be fair among all sections of society, electrification and road connectivity should be just between rural and urban society, access to groundwater should not be biased across categories of farmers based on land holding, and education should be equitable across gender. In the construction of composite SEI, linear transformation was applied with more is better and less is better scoring for the abovementioned variables. “More is better” held well for the availability of food grains, milk, groundwater, rural electrification, female literacy, and road connectivity, while and “less is better” was used for infant mortality rate. The same analogy was used for weighing indicator scores as described in the construction of EEI was for SEI.
SEI = i = 1 n W i S i
where Wi is the weight of the indicator based on PCA, Si is the indicator score, and n is the number of indicators considered for the construction of the index.

2.6. Ecological Security Index

Economic activities are essential for economic growth and development. While performing economic activities, due consideration needs to be given to social equity and ecological balance. Economic activities at the cost of ecology create ecological imbalance. Economic activities which neglect ecological balance pose threats to society in bearing huge social costs. Hence, for regional development, equal if not greater emphasis must be given to ecological factors. Anthropogenic activities are considered as the major source of climate change. Variation in the amount and pattern of rainfall, poor recharge of groundwater and others are repercussions of injudicious anthropogenic activities. Thus, the following indicators were considered for this study, viz., degraded land, population density, livestock density, variation in rainfall, forest cover, cropping intensity and groundwater stress. Except for variables such as forest cover and cropping intensity linear transformation with “less is better” was performed to arrive at an indicator score. The obtained indicator scores were assigned with the weights derived from PCA analysis to estimate the ecological security index (ESI).
ESI = i = 1 n W i S i
where Wi is the weight of the indicator based on PCA, Si is the indicator score, and n is the number of indicators considered for the construction of the index.

2.7. Sustainable Livelihood Security Index

Efficiency is concerned with “I and for today”, equity is related to “we and for today”, while sustainability is related to “we and for today and tomorrow”. Efficiency and sustainability move in the opposite directions. Any economic activity should be performed to attain maximum profit but not at the cost of intergenerational equity and sustainability. The policies related to the growth and development of the economy should strike a proper balance between these three. SLS includes the concepts of economic efficiency, social equity, and ecological balance together. Hence, in the development of SLSI, all twenty variables were considered. The variables exhibit a linear relationship among themselves and are too many in number. To reduce the dimensions of the dataset, PCA was performed, and the desired number of principal components were extracted. Furthermore, the MDS was obtained by following the condition that “indicator variables possessing a factor loading value not less than 20 percent of the highest factor loading value in the respective principal component” were included. The MDS was subjected to linear transformation to obtain the indicator score. Later, the indicator score was weighted using the weights of principal component analysis to arrive at the SLSI.
SLSI = i = 1 n W i S i
where Wi is the weight of the indicator based on PCA, Si is the score of the indicator, and n is the number of indicators considered for the construction of the index.

3. Results

3.1. Selection of Indicator Variables for Estimation of Sustainable Livelihood Security Index

The mean data of 20 indicator variables used in the estimation of the SLSI for the 27 selected districts of Karnataka state, India are presented in Table 1. The included indicator variables were further categorized as economic indicators (1. Net cropped area, 2. Net irrigated area, 3. Grain yield of food crops, 4. Fertilizer use, 5. Productivity of land, and 6. Productivity of labor); ecological indicators (7. Percent forest cover, 8. Density of human, 9. Density of livestock, 10. Percent degraded land, 11. Rainfall variability, 12. Pressure on groundwater, and 13. Cropping intensity); and social indicators (14. Availability of food grains, 15. Availability of milk, 16. Literacy of rural female, 17. Rural electrification, 18. Village road connectivity, 19. Mortality rate of infants, and 20. Availability of groundwater). The data on these 20 indicators for the three different regions—NIK, SIK, and CK—are presented and summarized in Table 2.

3.2. Criteria for Selection of Minimum Dataset

Based on the magnitude of variation explained by principal components in the total dataset, six principal components (PC1 to PC6) were extracted. The extracted principal components explained 78.57 percent of the total variation in the dataset. The eigen values, the ratio of variation explained by each of the principal components to the total variation and the cumulative variances of the extracted principal components are presented in Table 3.
The magnitude of variation explained by PC1, PC2, PC3, PC4, PC5, and PC6 were in the order of 23.19, 17.25, 13.57, 10.19, 8.26, and 6.13 percent, respectively. From the extracted principal components, MDS was obtained by considering only those indicator variables which are not lower by 20 percent of the highest factor loading in the respective principal component. For instance, in PC1, forest cover possessed the highest factor loading of −0.88, followed by livestock density, with a factor loading of 0.79. In absolute terms, it falls short by 10 percent compared to the variable possessing the highest factor loading with PC1. No other variables satisfied the prescribed condition to be eligible for the minimum dataset. Hence, forest cover and livestock density were selected as the components of the minimum dataset from PC1. A similar analogy was used to obtain variables from the other extracted principal components. Population density and fertilizer use from PC2, food grain yield, land productivity and labor productivity from PC3, net irrigated area and ground water availability from PC4, cropping intensity from PC5 and milk availability from PC6 were selected to constitute the minimum dataset. Thus, 11 out of the 20 indicator variables were considered as the minimum dataset for the construction of the SLSI.
Linear indicator scores across different regions of SIK, NIK and CK after obtaining MDS from PCA for the construction of SLSI are presented in Figure 2 using the radar chart. Out of 20 variables, 11 variables were chosen as MDS. After suitable linear transformation, indicator scores were identified for the abovementioned regions. Accordingly, SIK received the highest values for indicator scores such as fertilizer use, milk availability and groundwater availability, while NIK received the highest scores for cropping intensity and CK received the highest scores for forest cover, livestock density, net irrigated area, food grain yield and land productivity. Indicator variables such as population density and labor productivity were found to be equal between NIK and CK and SIK and CK, respectively.

3.3. Allotment of Ranks for Different Indicators

The EEI was computed by assigning suitable PCA weights for the indicator scores, viz., net sown area (0.3), net irrigated area (0.13), fertilizer use (0.22), food grain yield (0.17), land productivity (0.17) and labor productivity (0.17). The weights were obtained by taking the ratio of variances explained by the respective principal component to the total variance explained by the extracted principal components. For instance, the total variation explained by the six principal components was 78.57 percent, while the variation explained by PC1 was 23.19 percent. By taking the ratio of 23.19 to 78.57, it yields 0.3, which is the weight assigned for all the indicator variables having higher loadings in PC1. The same analogy was followed to arrive at weights for all the indicator variables. The EEI was estimated and ranked for NIK, SIK and CK and for individual districts.
Table 4 shows the EEI, ESI and SEI of the three regions and their relative rankings. The EEI was highest in the case of SIK (0.45), followed by NIK (0.40) and CK (0.38). Meanwhile, Table 5 shows the same indices and relative rankings of the various districts within the three regions.
Davanagere was found to have the highest EEI (0.78) among the districts, followed by Hassan (0.66), and it was lowest in the case of Dharwad (0.16). The Social Equity Index (SEI) was constructed by assigning suitable weights of PCA to the following indicator scores: milk availability (0.08), food grain availability (0.22), rural female literacy (0.30), village electrification (0.30), rural road connectivity (0.30), infant mortality (0.10) and groundwater availability (0.13). The constructed SEI exhibited the same trend as that of EEI, wherein SIK ranked first (0.56), followed by NIK (0.50) and CK (0.36). Across districts, Davanagere showed an SEI of ‘1’, followed by Shivamogga (0.97) and Haveri (0.92), while it was lowest in the case of Kodagu (0). In the case of ecological security index (ESI), indicator scores such as degraded land (0.22), population density (0.22), rainfall variance (0.30), forest cover (0.30), livestock density (0.30), cropping intensity (0.10), groundwater stress (0.30) were assigned the weights indicated in the parentheses. On the construction of the ESI, an altogether different pattern was observed, wherein CK ranked first (0.91), followed by SIK (0.44) and NIK (0.38). Among the districts, Kodagu ranked first with an ESI of 1, while Belagavi displayed the lowest ESI, i.e., ‘0’ (Table 5).

3.4. Sustainable Livelihood Security Index

The SLSI was constructed considering the MDS obtained from PCA. Out of 20 variables, 11 variables formed the MDS and were subjected to linear scoring to obtain indicator scores. Indicator scores were weighted with PCA weights to arrive at SLSI. The constructed SLSI indicated that the CK (0.73) was relatively more sustainable compared to SIK (0.56) and NIK (0.38) (Table 6).
The SLSI in NIK varied from 0.24 in Gadag to 0.60 in Ballari, Bengaluru (Urban) (0) to Shivamogga (1) in SIK and Udupi (0.65) to Uttara Kannada (0.79) in CK. Among the districts, Shivamogga appeared to be highly sustainable with an SLSI of ‘1’, and Bengaluru (Urban) was the least sustainable with an SLSI ‘0’. The districts were further classified as less sustainable, moderately sustainable, and highly sustainable based on the magnitude of SLSI. Thirteen out of the 27 districts were found to have an SLSI of less than 0.50 and were thus categorised as less sustainable. Around 10 districts were found to be moderately sustainable, with an SLSI in the range of 0.50 to 0.75. Only four districts turned out to be highly sustainable in Karnataka, with an SLSI of more than 0.75. The classification of different districts based on SLSI is depicted in Figure 3.

4. Discussion

Agriculture plays a vital role in the growth and development of agrarian countries such as India in terms of the economy and the environment. Sustainable integration of the available resources and environmental base is necessary to achieve higher productivity at agricultural farms to meet the future food needs of the ever-increasing population. The three pillars of sustainable development, viz., social, economic, and environmental aspects, must be integrated into agricultural systems to achieve sustainable production [32]. Furthermore, agricultural systems are more diverse and complex in nature, due to their interconnection with distinctive physical, biological, and human components within the system [33]. Thus, different social, economic, and environmental indicators need to be identified to monitor and evaluate the performance of different agricultural systems at the regional level in relation to sustainability.

4.1. Economic Efficiency Index

Among the indicator variables of the Economic Efficiency Index, net sown area received the highest weight, followed by fertilizer use. Land, labor, and crop productivity received equal weights, while net irrigated area received the lowest weight in the computation of the composite index. Although the average net sown area (524,537.27 ha) and percent net irrigated area (38.59) were found to be the highest in NIK and CK, respectively, compared to SIK (264,654.85 ha and 30.66%), EEI was highest in SIK due to the 73.4, 33.7, 35.0 and 14.3 percent higher fertilizer use, food grain productivity, labor productivity, and land productivity, respectively, over NIK. CK had the highest net irrigated area (38.59%), because of which it experienced the highest grain yield (2780.33 kg/ha) and factor productivity, viz., land (2.68) and labor (2.31), but was relegated to second position in terms of EEI due to its very low net sown area (114,625.33 ha). The net sown area reflects the rainfall potential of the region and the extent of agricultural activities carried out in the kharif season.
In NIK, Dharwad (0.16) and Gadag (0.18) received the lowest EEI, while Belagavi (0.63) and Ballari (0.60) received the highest. Dharwad had the lowest EEI due to the lowest net sown area (288,642 ha), a lower yield of food grains (874 kg/ha), poor usage of fertilizers (81 kg/ha), a meagre net irrigated area (19%), and poor labor (1.1) and land (0.8) productivity. The same conditions persist in Gadag district. A smaller area under irrigation, lower chemical fertilizer consumption, and lesser use of farm machinery consequently lower the per capita grain production and thereby reduce the economic efficiency of the farmers [34]. The use of improved agricultural technologies, intensive use of fertilizers, the cultivation of commercial crops, the percentage of cropped area under assured irrigation, etc., not only improve the productivity of natural resources but enable the district to generate enough income from the agricultural sector. Food grain productivity is the prima facie indicator of the efficient use of natural resources such as land, water, and labor. In the abovementioned districts, it was lower compared to other districts in NIK. Belagavi and Ballari, on the other hand, performed well in economic terms, as indicated in the EEI. This is because of the availability of a relatively greater net cropped area, the reflector of rainfall potential and agricultural activities during the kharif season. In Karnataka, the least agricultural vulnerability in Belagavi district with higher cropping intensity, gross irrigated area and commercial crop area was reported [35].
In SIK, Davanagere received the highest EEI (1.00) due to its higher labor (4.9) and land (5.2) productivities, a relatively greater share of net irrigated area (46%), higher food grain productivity (3902 kg/ha) and greater net cropped area (389,010 ha). A major portion of Davanagere district lies in the Krishna basin and is drained by the Tungabhadra and Chikka Hagari rivers. The other streams are Jangahalla and Haridra Nadi. Shantisagar, the largest tank constructed across the Haridra stream, is the major source of irrigation. The Davanagere and Harihara branch canals of Bhadra reservoir add to the irrigation facilities in the district. Rice and maize are the major food crops grown in the district. The availability of irrigation facilities throughout the year ensures crop and resource productivity. Apart from this, the innovativeness of farmers in adopting new improved production technologies has also increased productivity and agricultural activities. This is clearly reflected in the higher cropping intensity of the district (125%). Bengaluru (Urban) and Tumkuru recorded the lowest EEI in SIK. The obvious reason for Bengaluru (Urban)’s low EEI is the poor availability of the net cropped area and the net irrigated area, and the relatively lower grain yield, labor, and land productivity. Tumkuru also witnessed similar attributes, i.e., poor grain yield, poor fertilizer use, poor land and labor productivities, and sparse net irrigated area. From the preceding facts, it could be inferred that Bengaluru (Uurban) is constrained by land resources and paramount stress on groundwater due to scanty rains. Tumkuru, though having a relatively greater cropped area, is characterized by poor productivity of natural resources and consequently poor food grain yields. Contrastingly, a maximum EEI of 0.68 for Bengaluru (Urban) was estimated by Suresh Kumar et al. [36], and they found that a higher area under irrigation, fertilizer usage and easy access to the market led to higher per capita income in the district.
Among the districts of CK, Dakshina Kannada received the highest EEI of 0.48, while Uttara Kannada obtained an EEI of 0.31. Compared to SIK and NIK, CK had a having lower EEI due to the sparse net cropped area, net irrigated area, and relatively lower use of fertilizers. The productivity of resources and output were found to have a positive influence on EEI, as they were relatively higher compared to SIK and NIK. A relatively greater net cropped area, net irrigated area, fertilizer use, and labor productivity led Dakshina Kannada to assume the highest EEI among CK. A similarly high EEI of 0.41 in Dakshina Kannada was earlier reported by Krishna et al. [18] compared to Udupi (0.19) and Uttara Kannada (0.28) districts.

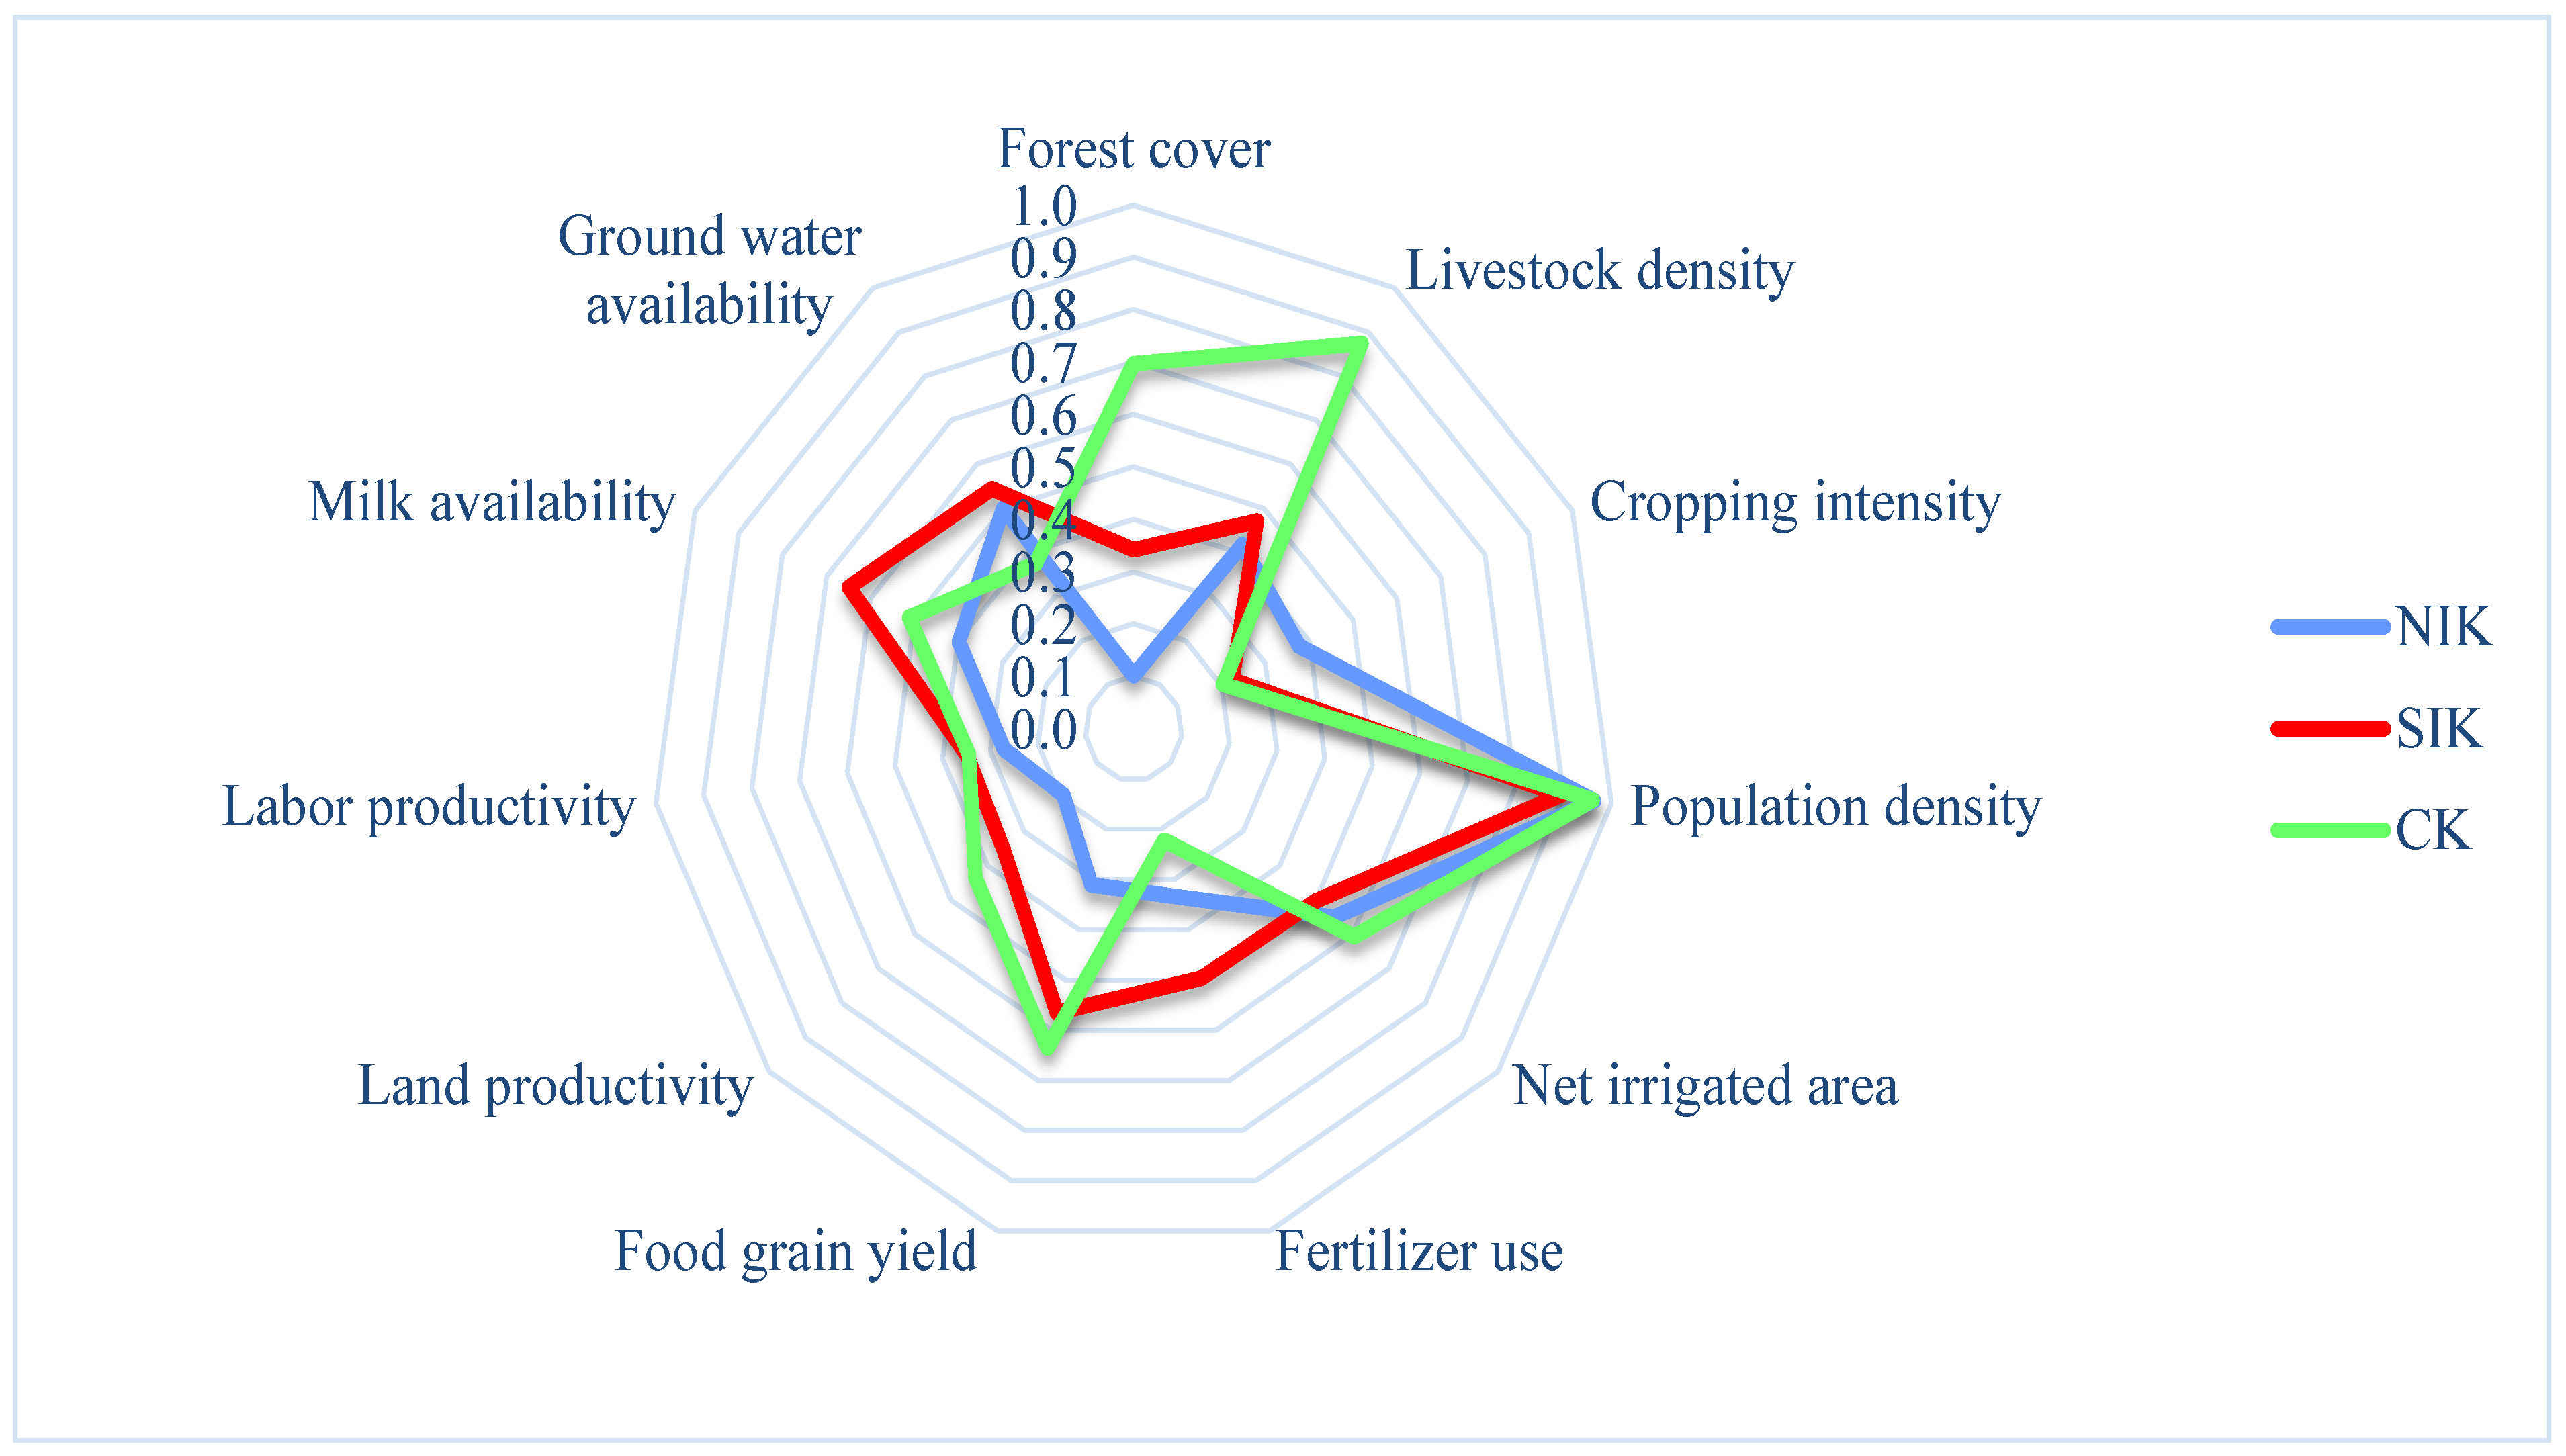
4.2. Ecological Security Index

In ESI, variables such as forest cover, stress on groundwater, density of livestock, and variation in rainfall received equal weights of 0.30 based on PC analysis. Degraded land and the density of the human population received weights of 0.22, and cropping intensity received a weight of 0.10. ESI mainly depends on those indicator variables which receive relatively higher weights. CK was found to have the highest ESI (0.91) compared to SIK (0.44) and NIK (0.38). The lower groundwater stress of 29.52%, the relatively higher forest cover (56.36%), the lower degraded area (625.33 in ’000 ha), and the relatively lower variation in rainfall (14%) resulted in the highest ESI of 0.91 for CK compared to NIK and SIK. Kumar and Irfan [37] and Guha et al. [38] reported that forest cover is a vital factor for maintaining high ESI in any region. Poor forest cover (8.88%), relatively greater variation in rainfall (26.55%), groundwater stress (57.01%) and a greater degraded area (803.27 in ‘000 ha) were responsible for NIK experiencing the lowest ESI of 0.38. The paramount stress on groundwater (81.93%), the relatively higher density of the human population at 584.23 per sq. km, and the degraded area of 647.76 in ‘000 ha are the reasons for SIK experiencing a moderate ESI of 0.44.
Among the districts of SIK, Kodagu had the highest ESI of 1.00, followed by Shivamogga (0.85), while Bengaluru (Urban) and Kolar received the lowest ESI of 0.09 and 0.01, respectively. Lower variability in rainfall (19%), less stress on groundwater (29%), very little degraded land (409,000 ha), relatively more forest cover (70%), and the thin density of human and livestock population are responsible for Kodagu attaining the highest ESI. These factors influence ecosystem services directly or indirectly. For example, an increase in the forest cover helps the land to receive an adequate amount of rainfall and conserve the available natural resources in the region and helps in ecological trade-offs, leading to better ESI. Bengaluru (urban) and Kolar are fraught with poor forest cover (6% and 13%, respectively), huge stress on groundwater (135% and 201%, respectively), and a relatively higher density of human population in Bengaluru (urban) of 4381 per sq. km and livestock density of 204 per sq. km in Kolar. The rainfall variability hovered at around 25 percent in both the districts. In the case of the SIK districts, viz., Kolar, Chikkaballapura, Chitradurga, Mandya and Tumkur, high rainfall variability with a coefficient of variation exceeding 85% was also reported earlier [39]. The above factors are prima facie indicators of ecological imbalance. Erratic and non-uniform rains coupled with poor forest cover, the extreme overdraft of groundwater, the absence of a perineal source of surface irrigation, the high density of the human population, the tendency of farmers to cultivate high-value water-intensive commercial crops, the vicinity of districts to metropolises, etc., have put enough pressure on natural resources and ecology in Bengaluru (urban) and Kolar districts. Thus, efforts in terms of resource conservation (soil and water), afforestation, the augmentation of groundwater with efficient utilization of available groundwater through water-saving technologies and restoring degraded lands with horti-silviculture systems are required with immediate effect to restore the ecological balance in these districts [36].
In case of CK, Uttara Kannada was found to have the highest ESI of 0.97, followed by Udupi (0.90) and Dakshina Kannada (0.86). Higher forest cover (81%), lower groundwater stress (26%), meagre rainfall variability (15%), and lower population density (140/km2) are the possible factors responsible for the ESI of 1 for Uttara Kannada. An ESI in the order of Uttara Kannada (0.81)>Udupi (0.76)>Dakshina Kannada (0.60) was earlier reported by Krishna et al. [18].
Among NIK’s districts, Dharwad and Bidar experienced a high ESI of 0.66 and 0.52, respectively. Belagavi and Bagalkote possessed a lower ESI of 0.00 and 0.24, respectively. The less variability in rainfall, less reliance on groundwater, less degraded land, lower livestock density, and relatively higher cropping intensity are responsible for the higher ESI in Dharwad. Contrarily, Belagavi and Bagalkote had a low ESI due to the greater pressure on groundwater (70% and 87%), huge rainfall variability (51% and 25%), and relatively poor forest cover, hovering at 15 percent, with a higher magnitude of degraded land. The higher ecological sustainability in Uttara Kannada and Kodagu districts and the lower sustainability in the majority of the NIK districts were earlier reported by Kumar et al. [40].

4.3. Social Equity Index

The SEI was constructed considering indicator variables such as milk availability (0.08), food grain availability (0.22), female literacy in rural areas (0.30), electrification in rural areas (0.30), rural road connectivity (0.30), infant mortality rate (0.10) and availability of ground water (0.13). The figures in parentheses indicate the weights assigned to the indicator variables obtained from the PCA. Gender disparity is prominent in all the sectors, and education for women must be considered to achieve social equity and to minimize this gap for the holistic development of the economy. Providing education to women not only results in their empowerment, but it results in the holistic development of families on all fronts. A higher literacy level in a society always indicates growth in the economy [38]. Access to electricity and better connectivity to distant localities is crucial in the development of economic activities. Electrification is a must for carrying out agricultural activities, as it is crucial for energizing pump sets. Pump sets are inevitable in India, and Karnataka is not an exception, as more than 80 percent of irrigated land is reliant on groundwater. Access to groundwater across different sizes of farm holdings and generations reflects the equity issue. Groundwater should be available to all the farming categories (marginal, small, and large farmers) across generations (inter-generational equity). The mortality rate during infancy reflects the childcare and maternal care facilities available in the region. A reduction in the infant mortality rate is considered as a positive sign on the medical front. The availability of food and milk to all sections of society is crucial in addressing the problems of malnourishment and malnutrition. The governments of Karnataka and India have taken many steps in addressing the abovementioned problems. India in general and Karnataka specifically might have addressed food security issues, but they are still fraught with nutritional insecurity. Nutritional security is a cause for concern, as the redressal of social equity is sine qua non. In Karnataka, SIK had the highest SEI of 0.56, followed by NIK (0.50) and CK (0.36). The average SEI did not surpass 0.60 in any of the abovementioned regions of Karnataka, which is concerning. It is considered as the prima facie indicator for existing disparity and divergence in terms of the availability of resources to farmers, food to consumers, and rural infrastructure for people residing in villages. Without bridging the abovementioned divergence, attaining development on the socio-economic front will be challenging.
Among the districts in SIK, Davanagere had the highest SEI of 1.00, followed by Shivamogga (0.97), while Kodagu and Chamarajanagara recorded the lowest SEI of 0.00 and 0.16, respectively. The higher availability of food grains (655 kg/person/year) and milk (321 mL/person/day), the higher female literacy (64%) in rural areas and, the 100 percent road connectivity and electrification, the lower infant mortality rate (19%) and the higher groundwater availability (66,059 ha-m) are considered as the factors responsible for the SEI of 1.00 for Davanagere. Even those it has slightly higher milk availability, female literacy, and groundwater availability than Davanagere, Shivamogga stands in second position in terms of the SEI in SIK, mainly due to its lower food grain availability and the indifferent conditions persisting with respect to rural connectivity and electrification in rural areas. From the preceding discussion, the availability of food and milk to consumers, groundwater availability, and electrification and road connectivity for farmers and manufacturers are critical in the development of any sector of the economy.
Among CK districts, Udupi ranked first with an SEI of 0.75, having rural road connectivity of 84 percent and electrification of 100 percent. The availability of milk was comparable to NIK and SIK (340 mL/person/day), but food availability was lower (115 kg/person/year), and groundwater availability was also meagre (31,409 ha-m). Dakshina Kannada had an SEI of 0.12 due to the poor availability of food grains (41 kg/person/year), poor rural road connectivity (40%), high infant mortality rate (21%) and lower groundwater availability (29,732 ha-m). Krishna et al. [18] also determined the SEI of Dakshina Kannada, Uttara Kannada and Udupi districts of Karnataka and reported the highest SEI in Udupi (0.59).
In the case of NIK districts, Haveri assumed the highest SEI of 0.92, followed by Koppal, with an SEI of 0.74. The higher availability of food grains (500 kg/person/year) and milk (226 mL/person/day), the road connectivity (92%), the 100 percent electrification, the very low infant mortality (6%), and the relatively higher groundwater availability (55,743 ha-m) are the reasons for the SEI of 0.92 in Haveri. Contrarily, Raichur assumed the lowest SEI of 0.12, with an average food grain availability of 295 kg/person/year and milk availability of 185 mL/person/day. Female literacy in rural areas was at its lowest level (42%), with poor rural road connectivity (52%). From this, we can infer that increasing divergence in equity in society hampers the growth of the region. Thus, the government should aim at formulating suitable policies which instill equity in the region, thereby leading to the development of the region.

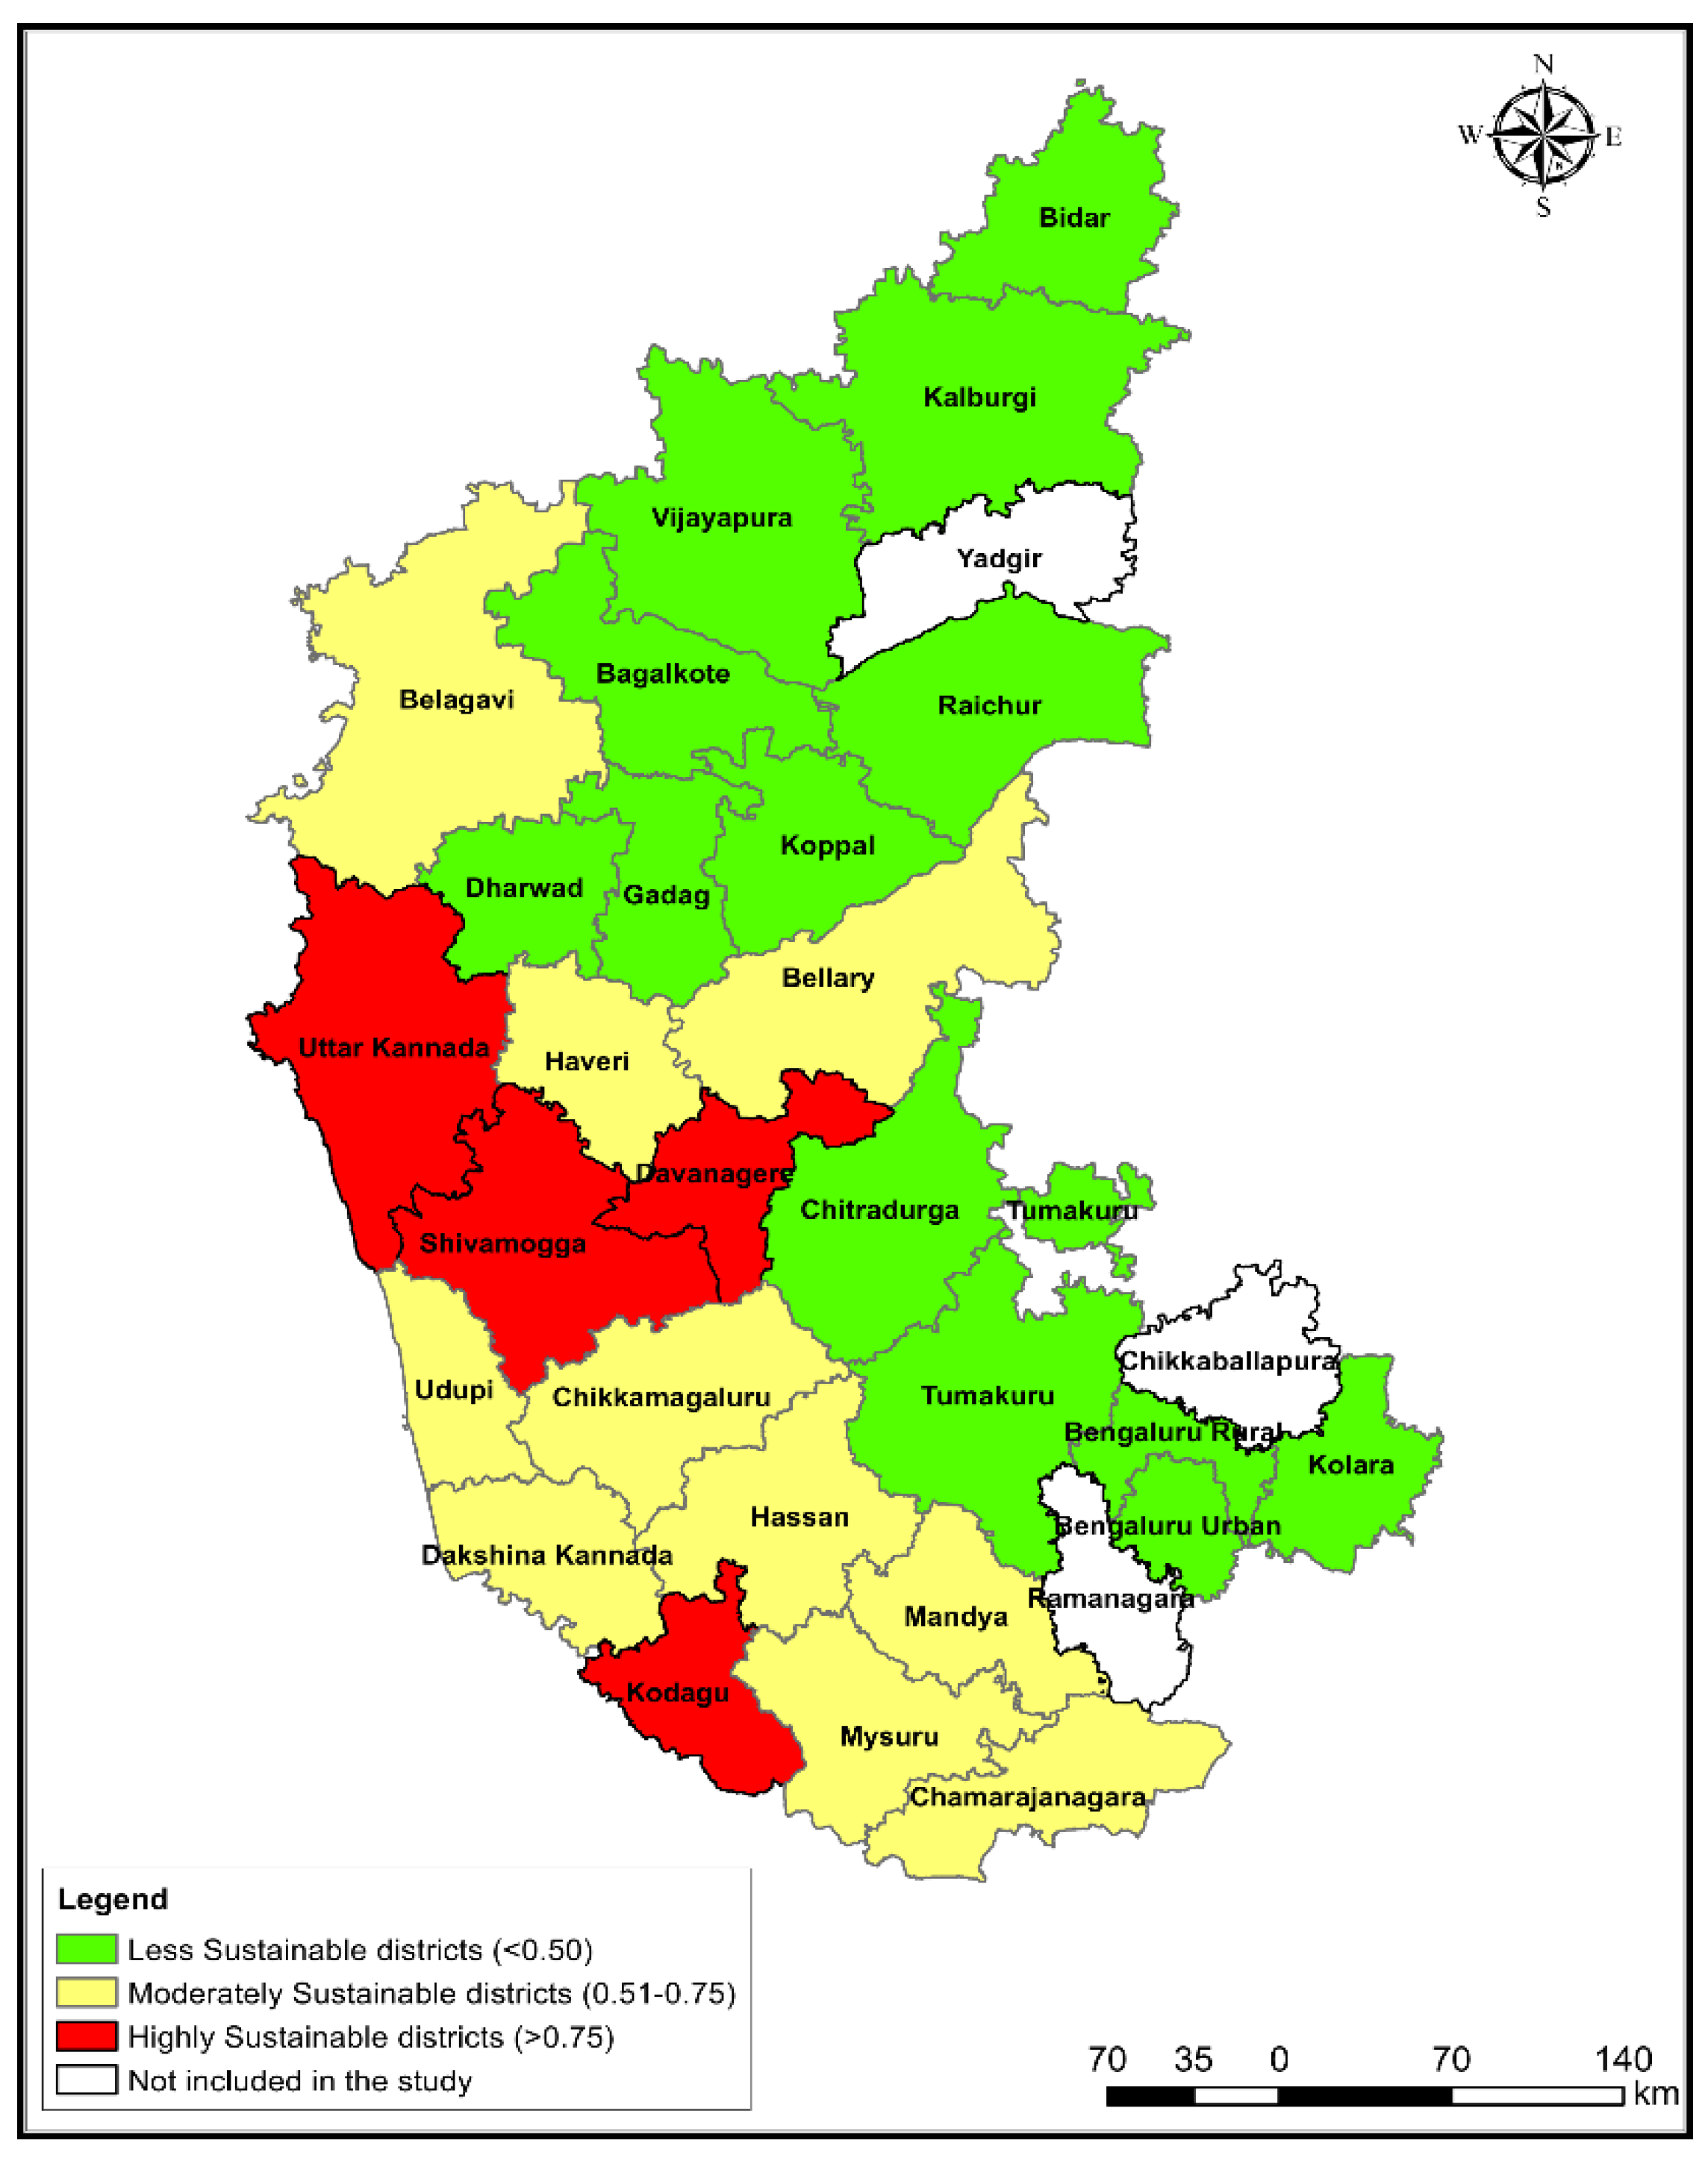
4.4. Sustainable Livelihood Security Index

The SLSI is a composite index constructed based on the amalgamation of indicator variables representing equity issues, economic efficiency, and ecological issues [41]. The index needs to be holistic and comprehensive. Development should not be at the cost of society and ecology. It is attained only when inequities are ratified, and ecological balance is met. SLSI aids in focusing on the challenges and probable synergies that exist between the ecological, economic, and equity elements of sustainable development [42]. Forest cover and livestock density received the highest weight of 0.30, followed by human population density and fertilizer use with weights of 0.22, while food grain yield, land and labor productivity received equal weights of 0.17, net irrigated area and groundwater availability received similar weights of 0.13, cropping intensity received a weight of 0.10 and milk availability received a weight of 0.08. Forest cover, the population density of humans and livestock, and cropping intensity reflected ecological factors, land productivity, labor productivity and food grain productivity, net irrigated area and fertilizer use reflected economic aspects, and the availability of milk and groundwater represented equity issues. Looking into these weights, it can be inferred that ecological factors received higher weights, followed by economic factors and social equity factors. Development can be treated as sustainable only when profits are made without cost to the environment and ecology and denying any section of society [43].
In SIK, Bengaluru (Urban) witnessed the lowest SLSI of 0.00. The poor forest cover, huge density of human population, lower food grain productivity, poor land and labor productivities, sparse net irrigated area, poor groundwater availability, lower milk availability, urbanization and extensive industrialization pose a negative impact on SLS [44]. However, Shivamogga occupied the first position in SIK, with an SLSI of 1.00. The obvious factors responsible for the highest SLSI were the greater forest cover, relatively better food grain yield, relatively higher proportion of area under irrigation, ground water availability and relatively higher milk availability. Among CK’s districts, Uttara Kannada witnessed the highest SLSI of 0.79 due to the higher forest cover, lower population and livestock density, and relatively greater availability of groundwater. The present results are in accordance with the findings of Krishna et al. [18], who reported an SLSI of 0.70–0.81 in coastal Karnataka. Ballari and Belagavi occupied first and second position among the NIK districts, with an SLSI of 0.60 and 0.58, respectively. The relatively higher yields of food grains, higher productivities of resources such as land and labor, relatively higher proportion of area under irrigation, and better availability of groundwater are the factors governing their relative positions in terms of SLSI. Thus, based on the prevailing conditions and geographical features, the SLSI varies across districts. Garai et al. [45] and Ghabru et al. [46] reported wide variation in SLSI across the different districts of West Bengal and Gujarat states of India, respectively.
Greater emphasis should be given to forest cover, because it not only ensures the onset of the monsoon at the right time, but it regulates carbon concentration in the atmosphere through sequestration [36,47,48]. Carbon and related greenhouse gas (GHG) emission are at their peak to meet the global demand. To combat the negative repercussions of GHGs, invariably, a desired proportion of the total geographical area needs to be covered by forest. Forests play a prime role in maintaining ecological security through ecosystem service conservation [49,50]. At present, the forest cover in Karnataka is only 20.11% of the state’s geographical area, with very dense, moderately dense, and open forests covering 2.35%, 10.97% and 6.79% of the area, respectively. Interestingly, an increase in the forest cover by 1025.48 sq. km was noticed between the years 2017 and 2018, which is a positive sign for the ecological security in the state [51]. Afforestation, joint forest management, social forestry, and encouraging imports of forest-based products at cheaper rates can reduce the pressure on natural forests. Afforestation can also improve groundwater availability and water flow in rivers and streams along with water quality, which are of great concern at present regarding agriculture [52]. The effective implementation of policies and acts related to forestry and biodiversity should be taken up in letter and spirit, not only to save the Earth, but also to ensure development in a sustainable mode. Groundwater, being the largest source of irrigation in India and Karnataka, is no exception.
Transition in cropping patterns for subsistence to commercial crops, advance technologies related to crop improvements and irrigation are essential for improving productivity and meeting food and nutritional needs. However, there must be a balance between productivity gains, economics, and efficiency in natural resource management for sustainability. This balance can be achieved by adopting appropriate policies. For example, to manage limited irrigation water resources, emphasis needs to be given to borewell recharge, the adoption of water-saving technologies, the recycling of water, rainwater harvesting, the sharing of irrigation wells, and the cultivation of less water-intensive high-value crops through polices at different scales (from plots to landscapes).

5. Conclusions

Economic growth is not an end—rather, it should be a means for economic development. Economic development should not be at the cost of ecology and the environment. It should give due consideration to efficiency, intergenerational equity, and sustainability. Undoubtedly, efficiency results in economic growth, but in the era of dramatic climate change, mere efficiency cannot be considered as a feasible solution; rather, greater emphasis should be laid on equity, livelihoods, sustainability, and the regeneration of natural resources. Hence, a modest attempt has been made to develop a normative indicator, SLSI, for Karnataka state, which not only ensures sustainability but also ensures livelihood security. SLSI was computed for 27 districts, considering 20 indicator variables covering three vital dimensions of sustainable development, i.e., economic efficiency, social equity, and ecological issues. PCA and linear scoring techniques were employed to identify the MDS to develop SLSI. The overall results show that CK had the highest SLSI of 0.73, followed by SIK with 0.56, while NIK had the lowest value of 0.38. Among the districts, 13 appeared to be less sustainable, with an SLSI less than 0.50, and only four districts appeared to be highly sustainable, with an SLSI of more than 0.75, which is cause for concern.
Economic efficiency, social equity and ecological aspects are interrelated and interdependent. Therefore, if a suitable change is brought in one or a few indicator variables through policy formulation or intervention, desired changes can be brought about in other indicator variables through the domino effect. The results from this study help policy makers in the identification of such crucial indicator variables. Indicator variables receiving the highest weights after linear scoring can be considered as crucial variables. In future, policies should be tailored for strengthening these variables, which in turn can bring about changes in other variables, leading to the sustainable development of the region. Forest cover and livestock density received the highest weights of 0.3. If policies are formulated to conserve or expand the forest cover, this could impact the rainfall received, groundwater recharge, net cropped area, net irrigated area, and the effective utilization of natural resources such as land, labor, and water [38,43,53]. Districts with poor forest cover should encourage afforestation on a large scale, social forestry, joint forest management programs, and strengthening village-level institutions to ensure the conservation of forests. Livestock populations should be encouraged to derive two-fold benefits, such as income stability and the conservation of soil health. This could be attained through the further implementation of schemes such as milk price incentive schemes, schemes/programs aiming at the development of improved animal breeds, etc. Looking into the vitality of indicator variables, niche policies could be formulated. Niche policies emphasize formulating localized policies for a particular region which help to achieve sustainability. In hard rock areas, farmers practicing groundwater recharge and water conservation practices should be incentivized; farmers should be educated about water budgeting techniques through capacity building programs. To maintain the SLS, the extension of micro-irrigation facilities for all agricultural crops, efficient water management policies, the preservation of water bodies, the promotion of plantation crops and the use of modern production technologies are required [38,43]. Degraded land should be cultivated through suitable reclamation, which not only adds to food/fodder security but also reduces escalating pressure on forest cover. Through capacity building programs, farmers must be educated about the adoption of improved farm technologies which not only improve the productivity of enterprises but also enhance the productivity of natural resources.

Author Contributions

S.S., P.G., K.N.M., K.K.R.P. and V.P.: Investigation, Formal analysis, Manuscript writing—original draft; S.S. and V.P.: Conceptualization, Methodology, and Supervision; S.S., P.V.V.P. and P.K.J.: Visualization; Writing—review and editing. All authors have read and agreed to the published version of the manuscript.

Funding

This research received no external funding.

Institutional Review Board Statement

Not applicable.

Informed Consent Statement

Not applicable.

Data Availability Statement

Data are available upon request from corresponding author.

Acknowledgments

The authors are grateful to the University of Agricultural and Horticultural Sciences, Shivamogga, Karnataka, India for the support and encouragement.

Conflicts of Interest

The authors declare no conflict of interest. The views are of the authors and do not reflect their organizations or funders as they had no role in the design of the study, data collection, analyses, interpretation of data, or decision to publish the results.

References

  1. Barbier, E.B. The Concept of sustainable development. Environ. Conserv. 1987, 14, 101–110. [Google Scholar] [CrossRef]
  2. Garnett, T.; Appleby, M.C.; Balmford, A.; Bateman, I.J.; Benton, T.G.; Bloomer, P.; Burlingame, B.; Dawkins, M.; Dolan, L.; Fraser, D.; et al. Sustainable intensification in agriculture: Premises and policies. Science 2013, 341, 33–34. [Google Scholar] [CrossRef] [PubMed]
  3. Swaminathan, M.S. Greening of the mind. Indian J. Soc. Work 1991, 52, 401–407. [Google Scholar]
  4. Swaminathan, M.S. From Stockholm to Rio de Janeiro: The road to sustainable agriculture. In Monograph No. 4; MS Swaminathan Research Foundation: Chennai, India, 1991. [Google Scholar]
  5. Krantz, L. The Sustainable Livelihood Approach to Poverty Reduction; Swedish International Development Cooperation Agency, Division for Policy and Socio-economic analysis: Stocholm, Sweden, 2001; Volume 44. [Google Scholar]
  6. Fumagalli, M.; Acutis, M.; Mazzetto, F.; Vidotto, F.; Sali, G.; Bechini, L. An analysis of agricultural sustainability of cropping systems in arable and dairy farms in an intensively cultivated plain. Eur. J. Agron. 2011, 34, 71–82. [Google Scholar] [CrossRef]
  7. Sharma, D.; Shardendu, S. Assessing farm-level agricultural sustainability over a 60-year period in rural eastern India. Environmentalist 2011, 31, 325–337. [Google Scholar] [CrossRef]
  8. Talukder, B.; Saifuzzaman, M.; van Loon, G.W. Sustainability of agricultural systems in the coastal zone of Bangladesh. Renew. Agric. Food Syst. 2015, 31, 148–165. [Google Scholar] [CrossRef]
  9. You, H.; Zhang, X. Sustainable livelihoods, and rural sustainability in China: Ecologically secure, economically efficient, or socially equitable? Resour. Conserv. Recycl. 2016, 120, 1–13. [Google Scholar] [CrossRef]
  10. Pretty, J.; Benton, T.G.; Bharucha, Z.P.; Dicks, L.V.; Flora, C.B.; Godfray, H.C.J.; Goulson, D.; Hartley, S.; Lampkin, N.; Morris, C.; et al. Global assessment of agricultural system redesign for sustainable intensification. Nat. Sust. 2018, 1, 441–446. [Google Scholar] [CrossRef]
  11. Pretty, J.; Attwood, S.; Bawden, R.; van den Berg, H.; Pervez, Z.; Dixon, J.; Flora, C.B.; Gallagher, K.; Genskow, K.; Hartley, S.; et al. Assessment of the growth in social groups for sustainable agriculture and land management. Glob. Sust. 2020, 3, e23. [Google Scholar] [CrossRef]
  12. Musumba, M.; Grabowski, P.; Palm, C.; Snapp, S. Guide for the Sustainable Intensification Assessment Framework. In Feed the Future; The US Government Global Hunger and Food Security Initiative; Available online: www.k-state.edu/siil/documents/docs_siframework/Guide%20for%20SI%20Assessment%20Framework%20-%2010.24.17.pdf (accessed on 15 January 2022)2017.
  13. Stewart, Z.P.; Middendorf, B.J.; Prasad, P.V.V. SIToolKit.com. Feed the future innovation lab for collaborative research on sustainable intensification. Kansas State University. 2018. Available online: https://www.sitoolkit.com (accessed on 15 January 2022).
  14. Bharucha, Z.P.; Attwood, S.; Badiger, S.; Balamatti, A.; Bawden, R.; Bentley, J.W.; Bhattacharya, A.; Chander, M.; Chary, G.R.; Davis, L.; et al. The top 100 questions for the sustainable intensification of agriculture in India’s rainfed dryland. Int. J. Agric. Sust. 2021, 19, 106–127. [Google Scholar] [CrossRef]
  15. Kareemulla, K.; Venkattakumar, R.; Manoj, P. An analysis on agricultural sustainability in India. Curr. Sci. 2017, 112, 258–266. [Google Scholar] [CrossRef]
  16. Bhende, M.J. Agricultural Profile of Karnataka State; Agricultural development and rural transformation center, Institute for social and economic change: Bangalore, India, 2013; pp. 1–32. [Google Scholar]
  17. DESA (Department of Economic and Social Affairs). Sustainable Development, United Nations. 2020. Available online: http://www.un.org/sustainabledevelopment/news/communications-material/ (accessed on 12 April 2021).
  18. Krishna, V.R.; Paramesh, V.; Das, V.A.B.; Elansary, H.O.; Parab, A.; Reddy, D.D.; Shashidhar, K.S.; El-Ansary, D.O.; Mahmoud, E.A.; El-Sheikh, M.A. Assessment of sustainability and priorities for development of Indian west coast region: An Application of Sustainable Livelihood Security Indicators. Sustainability 2020, 12, 8716. [Google Scholar] [CrossRef]
  19. Dale, V.H.; Beyeler, S.C. Challenges in the development and use of ecological indicators. Ecol. Indic. 2001, 1, 3–10. [Google Scholar] [CrossRef] [Green Version]
  20. Hahn, M.B.; Anne, M.R.; Stanley, O.F. The Livelihood Vulnerability Index: A Pragmatic Approach to Assessing Risks from Climate Variability and Change, a Case Study in Mozambique; Center for Sustainability and the Global Environment, University of Wisconsin-Madison: Madison, WI, USA, 2009. [Google Scholar]
  21. Economic Survey of Karnataka, 2020–2021, 43rd ed.; Planning, Programme Monitoring and Statistics Department: Bengaluru, India, 2021; pp. 1–765.
  22. DES Reports, Statistical Reports of Directorate of Economics and Statistics; Government of Karnataka: Bengaluru, India, 2018.
  23. Annual Report; Department of forest, Government of Karnataka: Bengaluru, India, 2017.
  24. Livestock Census Report; Department of Animal Husbandry, Dairying and Fisheries, Ministry of Agriculture: New Delhi, India, 2012.
  25. Waste Land Atlas of India; Department of Land Resources, Ministry of Rural Development, Government of India: New Delhi, India, 2019.
  26. Guhathakurta, P.; Sanap, S.; Menon, P.; Prasad, A.S.; Sable, S.T.; Advani, S.C. Observed Rainfall Variability and Changes Over Karnataka State, Met Monograph No.: ESSO/IMD/HS/Rainfall Variability/13(2020)/37; India Meteorological Department, Ministry of Earth Sciences, Government of India: New Delhi, India, 2020.
  27. CGWB & MoWR, Dynamics of Groundwater Resources of India; Central Ground Water Board, Ministry of Water Resources, Government of India: New Delhi, India, 2019.
  28. Dairying in Karnataka: A Statistical Profile of Karnataka; National Dairy Development Board, Government of India: New Delhi, India, 2015.
  29. DCO, District Census Handbook, Bangalore, Directorate of Census Operations; Government of Karnataka: Bengaluru, India, 2011.
  30. DES Reports, Statistical Reports of Directorate of Economics and Statistics; Government of Karnataka: Bangalore, India, 2011.
  31. Brejda, J.J.; Karlen, D.L.; Smith, J.L.; Allan, D.L. Identification of regional soil quality factors and indicators: II. Northern Mississippi Loess Hills and Palouse Prairie. Soil Sci. Soc. Am. J. 2000, 64, 2125–2135. [Google Scholar] [CrossRef] [Green Version]
  32. Cruz, J.F.; Mena, Y.; Rodríguez-Estévez, V. Methodologies for assessing sustainability in farming systems. Assess. Rep. 2018, 3, 33–58. [Google Scholar]
  33. Antle, J.M.; Ray, S. Sustainability of Agricultural Systems. In Sustainable Agricultural Development. Palgrave Studies in Agricultural Economics and Food Policy; Palgrave Macmillan: London, UK, 2020. [Google Scholar]
  34. Sajjad, H.; Nasreen, I. Assessing Farm-Level Agricultural Sustainability Using Site-Specific Indicators and Sustainable Livelihood Security Index: Evidence from Vaishali District, India. Community Dev. 2016, 47, 602–619. [Google Scholar] [CrossRef]
  35. Raju, K.V.; Deshpande, R.S.; Satyasiba, B. Socio-Economic and Agricultural Vulnerability Across Districts of Karnataka. In Proceedings of the International Conference on Climate Change and Social-Ecological-Economical Interface-Building: Modelling Approach to Exploring Potential Adaptation Strategies for Bioresource Conservation and Livelihood Development, Bangalore, India, 20–21 May 2015; Springer: Cham, Switzerland, 2015; pp. 161–190. [Google Scholar]
  36. Kumar, S.; Raizada, A.; Biswas, H. Prioritising development planning in the Indian semi-arid Deccan using sustainable livelihood security index approach. Int. J. Sustain. Develop. World Ecol. 2014, 21, 332–345. [Google Scholar] [CrossRef]
  37. Kumar, A.; Irfan, Z.B. Are the new Indian States ecologically secured, economically efficient and socially equitable? (assessment using the Sustainable Livelihood Security Index Framework). Asian J. Lang. Lit. Cult. Stud. 2019, 2, 1–9. [Google Scholar]
  38. Guha, S.; Mandla, V.R.; Barik, D.K.; Das, P.; Rao, V.M.; Pal, T.; Rao, P.K. Analysis of sustainable livelihood security: A case study of Allapur S Rurban cluster. J. Rural Develop. 2018, 37, 365–382. [Google Scholar] [CrossRef]
  39. GoK, Government of Karnataka. Karnataka Climate Change Action Plan. Bengaluru (India): Bangalore Climate Change Initiative—Karnataka (BCCI-K). 2011. Available online: http://moef.gov.in/wp-content/uploads/2017/08/Karnataka.pdf (accessed on 15 April 2021).
  40. Kumar, S.; Raizada, A.; Biswas, H.; Srinivas, S. Planning Holistic Development in Karnataka Using the Sustainable Livelihood Security Index; Soil and Water Conservation Research Brief No. IISWC-RB-1/BL-1/2015; ICAR: New Delhi, India, 2015. [Google Scholar]
  41. Marco, F.; Yuan, Z. Achievements and Challenges in Agricultural Extension in India. Glob. J. Emerg. Econ. 2012, 4, 319–346. [Google Scholar] [CrossRef]
  42. Singh, P.K.; Hiremath, B.N. Sustainable livelihood security index in a developing country: A tool for development planning. Ecol. Indic. 2010, 10, 442–451. [Google Scholar] [CrossRef]
  43. Singh, A.K.; Issac, J. Impact of climatic and non-climatic factors on sustainable livelihood security in Gujarat state of India: A statistical exploration. Agric. Food Sci. Res. 2018, 5, 30–46. [Google Scholar] [CrossRef] [Green Version]
  44. Hiremath, D.B.; Shiyani, R.L. “Analysis of vulnerability indices in various Agro-climatic Zones of Gujarat”. Indian J. Agric. Econ. 2013, 68, 122–137. [Google Scholar] [CrossRef]
  45. Garai, S.; Ghosh, M.K.; Maiti, S.; Garai, S.; Meena, B.S.; Dutta, T.K.; Kadian, K.S. Development and application of dairy-based sustainable livelihood security index in the districts of West Bengal, India: A tool for dairy development planning. J. Rural Stud. 2019, 17, 1–9. [Google Scholar] [CrossRef]
  46. Ghabru, M.G.; Devi, G.; Singh, R. Estimating agricultural sustainability in Gujarat using sustainable livelihood security Index. Agric. Econ. Res. Rev. 2017, 30, 125–131. [Google Scholar] [CrossRef]
  47. Watson, R.T.; Noble, I.R.; Bolin, B.; Ravindranath, N.H.; Verardo, D.J.; Dokken, D.J. Land Use, Land-Use Change and Forestry: A Special Report of the Intergovernmental Panel on Climate Change; Cambridge University Press: Cambridge, UK, 2000. [Google Scholar]
  48. Shahzad, K.; Sintim, H.; Ahmad, F.; Abid, M.; Nasim, W. Importance of Carbon Sequestration in the Context of Climate Change. In Building Climate Resilience in Agriculture; Jatoi, W.N., Mubeen, M., Ahmad, A., Cheema, M.A., Lin, Z., Hashmi, M.Z., Eds.; Springer: Cham, Switzerland, 2022. [Google Scholar]
  49. Dash, R. Environmental Sustainability Index for Indian States 2011: Informing Environmental Action; Centre for Development Finance, Institute for Financial Management and Research: Chennai, India, 2011. [Google Scholar]
  50. Singh, A.K.; Narayanan, K.G.S.; Sharma, P. Influence of Climate Variability on Sugarcane Farming in India: An Empirical Research. In Proceedings of the 9th Biennial Conference 2017 of the Indian Society for Ecological Economics (INSEE) on Sustainability, Institutions, Incentives: Voices, Policies and Commitments, New Delhi, India, 8–10 November 2017. [Google Scholar]
  51. India State of Forest Report. Forest Survey of India; Ministry of Environment Forest and Climate Change, Government of India: New Delhi, India, 2019.
  52. Intergovernmental Panel on Climate Change. Land Use, Land-Use Change, and Forestry: Summary for Policymakers; IPCC Plenary XVI; IPCC: Montreal, Canada, 2000. [Google Scholar]
  53. Kumar, A.; Ahmad, M.M.; Sharma, P. Carbon emission and global food security: A cross country analysis. PENCIL Pub. Agric. Sci. 2015, 2, 7–24. [Google Scholar]
Figure 1. Location of Karnataka in India and districts in three different regions (North Interior Karnataka; South Interior Karnataka; and Coastal Karnataka) used for this research.
Sustainability 14 01831 g001
Figure 2. Selected minimum dataset (MDS) from principal component analysis based on linear weighted scores for the calculation of SLSI indicators.
Sustainability 14 01831 g002
Figure 3. Sustainable livelihood security index (SLSI) classes based on linear scoring for different districts in Karnataka.
Sustainability 14 01831 g003
Table 1. Different indicators selected for the assessment of the Sustainable Livelihood Security Index (SLSI).
IndicatorScope in Sustainable DevelopmentFunctional RelationshipSource
Economic Efficiency Indicators
1Net cropped areaProportion of net sown area in the total cropped area, represents the extent of utilization of land resources for farming activities.Positive[22]
2Net irrigated area (%)Area under assured irrigation reflecting the irrigation potential of the regionPositive
3Grain yield of food crops (kg/ha)Total food grain production of cereals and pulses per unit area. Productivity of output indicates the efficiency of all the resources used in its productionPositive
4Fertilizer use (NPK, kg/ha)Right quantity, method, and timing of fertilizer usage based on soil test are crucial in the optimum usage of fertilizers as it not only economizes production but also results in sustainability.Positive
5Productivity of land (DGDP/unit cultivated area)Income earned from agriculture and its related activities per unit of cultivated area represents the productivity of land in monetary terms. It varies by district depending on the type of crops being cultivated, livestock components being reared, technologies being used, etc.Positive
6Productivity of labor (DGDP from agriculture farm/labor)Income earned from agriculture and its related activities per unit of agricultural labor. It varies by district depending on the crops, livestock, extent of mechanization, amenability for adoption of innovative technologies, etc. It reflects the per capita income of the agricultural laborers, a crucial element in economic growth.Positive
Ecological Security Indicators
7Forest cover (%)Forest cover plays a vital and diversified role in ecological balance. It has a greater say influence on the hydrological cycle and carbon concentration.Positive[23]
8Human density (persons/km2)The number of individuals and livestock component per unit of geographical area represents the density of the human and livestock population, respectively. They have a direct bearing on ecological balance. The extent of pressure exerted by human and livestock population in the form of degradation of land, abstraction and pollution of water resources, deforestation, environmental pollution, etc.Negative[22]
9Density of livestock (livestock/km2)[24]
10Degraded land (000 ha)To ensure the food and fodder security of the expanding population, profound negative pressure has been exerted on natural resources such as land, water (groundwater), etc. The extent of degradation of natural resources influences social cost to be borne by the society.Negative[25]
11Rainfall variability (co-efficient of variation)Agriculture mainly depends on rainfall, and its variation is anticipated to have greater influence on net cropped area. Net irrigated area depends on availability of groundwater, and its recharge further depends on the uniformity and magnitude of rainfall. Optimum quantity with uniform distribution is considered as the robust indicator of ecological balance.Negative[26]
12Pressure on ground water (ratio of annual draft to the annual recharge)It indicates the availability of ground water for future generations. Recharge of groundwater mainly depends on rainfall and to some extent anthropogenic interventions may add to the same. To ensure food and fodder security, over drafting of groundwater has been performed. Disproportionate discharge has exceeded recharge, leading to tremendous pressure on groundwater. Intergenerational equity and sustainability in groundwater use is a cause of concern.Negative[27]
13Cropping intensity (%)Growing a greater number of crops per unit area is a feasible alternative for attaining food and fodder security. Higher cropping intensity leads to more productivity from arable landPositive[22]
Social Equity Indicators
14Availability of food grains (kg/person/year)In addition to food security, nutritional security is of immense importance in attaining development. Availability of food and milk to adults, children, pregnant women as per the recommendation of ICMR is crucial in determining the development of any region. Malnutrition and malnourishment have a negative bearing on development. Food and milk availability varies in society depending on the earning power of the individuals and governmental programs.Positive[22]
15Availability of milk
(mL/person/day)
Positive[28]
16Literacy of rural female (%)Gender equity is crucial in the development of any region. Both genders (male and female) should have equal opportunities in terms of access to resources, ownership of resources, decision making, etc. The bridging of gender disparities and the empowerment of women are considered as effective solutions in the formation of quality social capital, for which the literacy of rural women is must.Positive[29]
17Rural electrification
(% of residence)
Energizing pump sets is essential for the effective and efficient usage of groundwater, a major source of irrigation. It is essential to run small cottage industries, handicrafts, agro-based industries. It is also essential for performing usual activities at home, for education of children, people residing in remote areas having poor road connectivity, etc. Proper supply of power has a greater influence on the economic growth of the regionPositive[22]
18Village road connectivity (% of residence)Proper road connectivity is quintessential for the marketing of produce from any production activity. Transportation alone forms more than 50 percent of the marketing costs. It is considered as the key factor in determining infrastructural development in the region.Positive
19Mortality rate of Infants (per 1000 live birth)This is a key factor reflecting the overall physical health of the community and eventually influencing regional socio-economic developmentNegative[30]
20Availability of ground water (ha-m)Adequate ground water is crucial for agricultural growth. It is considered the major source of irrigation in Karnataka. Its availability varies from district to district depending on various factors having a positive bearing on its recharge.Positive[27]
Note: DGDP—district gross domestic product at constant price 2004–2005; Data compiled from CGWB—Central Ground Water Board; MoWR—Ministry of Water Resources; NDDB—National Dairy Development Board; DCO—Directorate of Census Operations; DES—Directorate of Economics and Statistics; ICMR—Indian Council of Medical Research. Functional relationship indicates a hypothetical positive or negative relationship between indicators considered and SLSI.
Table 2. Average values of sustainability indicators across different regions of Karnataka state, India.
Variables (Unit)North Interior Karnataka (NIK)
BagalkoteBallariBelagaviBidarDharwadGadagHaveriKalburgiKoppalRaichurVijayapura
Population density (persons/km2)288278356357433229331229250228207
Density of livestock (livestock/km2)24517120411497124160135147211106
Forest cover (%)131615811796651
Cropping intensity (%)129128132119165140113112124118113
Rainfall variability2524512422242321282624
Net irrigated area (%)5947591719272318364239
Degraded land (000 ha)659845134254542746548216207196821050
Pressure on groundwater (%)8749704051855237534163
Net cropped area (000 ha)477,581414,072766,580350,792288,642352,624363,2071,199,348350,198458,062748,804
Grain yield of food crops (kg/ha)15543106268512528748293504120819121731965
Availability of milk
(mL/person/day)
265173363232152194226207233185153
Fertilizer use (kg/ha)1492602076481561873213719964
Availability of food grains
(kg/person/year)
280307210170116247500365457295302
Literacy of rural female (%)5351595763616841554251
Mortality rate infants
(per 1000 live birth)
714134322165565
Availability of groundwater
(ha-m)
49,10556,23385,80036,11220,69726,39455,74350,76954,98069,96348,909
Village road connectivity (%)70818096961009294955298
Rural electrification (%)100100100100100100100100100100100
Productivity of land
(DGDP/cultivated area)
1.52.32.01.20.80.83.31.11.82.10.9
Productivity of labor
(DGDP from agriculture sector/agricultural labor)
1.92.01.81.11.11.42.72.52.51.62.1
Variables (Unit)South Interior Karnataka (SIK)
Bengaluru ®Bengaluru (U)ChamarajanagaraChikkamagaluruChitradurgaDavanagereHassanKodaguKolarMandya
Population density (persons/km2)3704381181158196328261135287364
Density of livestock (livestock/km2)1651311017619116214832204226
Forest cover (%)206553815913701313
Cropping intensity (%)103104121110117125125109105117
Rainfall variability27262418302525192526
Net irrigated area (%)2420401520462712161
Degraded land (000 ha)622133512736829593680409821496
Pressure on groundwater (%)114135784110786562920155
Net cropped area (000 ha)290,07251,433184,396292,988387,100389,010359,192169,922388,681232,404
Grain yield of food crops (kg/ha)2938203621931657235739023737311725781738
Availability of milk (mL/person/day)46338344397236321486247378434
Fertilizer use (kg/ha)21277415724881192181206128326
Availability of food grains (kg/person/year)1343244191282655471163130162
Literacy of rural female (%)62715170626464765859
Mortality rate infants (per 1000 live birth)101214151019812716
Availability of groundwater (ha-m)19,92112,76538,83157,41745,35166,05971,36231,33639,53982,669
Village road connectivity (%)85899153100100727395100
Rural electrification (%)1001009810010010010096100100
Productivity of land (DGDP/cultivated area)2.81.91.01.62.25.23.63.03.41.7
Productivity of labor (DGDP from agriculture sector/agricultural labor)1.70.41.21.71.74.95.26.01.11.4
Variables (Unit)South Interior Karnataka (SIK)Coastal Karnataka (CK)
MysuruShivamoggaTumkuruDakshina KannadaUdupiUttara Kannada
Population density (persons/km2)476207251430330140
Density of livestock (livestock/km2)14496199637043
Forest cover (%)217812444481
Cropping intensity (%)155117113120118110
Rainfall variability222121141315
Net irrigated area (%)506331543428
Degraded land (000 ha)68484510614573911028
Pressure on groundwater (%)483085382526
Net cropped area (000 ha)344,908227,965509,542131,446100,128112,302
Grain yield of food crops (kg/ha)185337611486280830112522
Availability of milk (mL/person/day)240335349245340216
Fertilizer use (kg/ha)1382711071475591
Availability of food grains (kg/person/year)16432711541115120
Literacy of rural female (%)567063807975
Mortality rate infants (per 1000 live birth)2516821912
Availability of groundwater (ha-m)73,12487,94671,53229,73231,40961,711
Village road connectivity (%)9610089408432
Rural electrification (%)10010010099100100
Productivity of land (DGDP/cultivated area)1.81.01.42.72.92.5
Productivity of labor (DGDP from agriculture sector/agricultural labor)1.72.40.93.12.31.5
Note: DGDP- District gross domestic product; R-Rural; U-Urban.
Table 3. Economic, ecological, and social indicators based on principal component analysis.
ComponentsPC1PC2PC3PC4PC5PC6
Eigen values4.643.452.712.071.651.23
Variance (%)23.1917.2513.5710.198.266.13
Cumulative %23.1940.4354.0064.1872.4478.57
Eigen vectors/Factor loading
Degraded land0.16−0.53−0.130.43−0.49−0.21
Population density0.120.92−0.16−0.17−0.05−0.15
Rainfall variability0.620.080.030.36−0.070.04
Forest cover−0.88−0.050.080.080.020.17
Density of livestock0.790.04−0.050.39−0.140.23
Cropping intensity0.20−0.23−0.100.140.85−0.23
Pressure on ground water0.590.34−0.13−0.28−0.170.51
Net cropped area0.51−0.48−0.060.20−0.37−0.42
Net irrigated area0.070.05−0.020.830.270.07
Fertilizer use0.020.940.040.12−0.07−0.003
Grain yield of food crops−0.240.200.770.21−0.080.36
Productivity of land−0.0020.150.78−0.06−0.110.39
Productivity of labor−0.23−0.180.89−0.080.01−0.10
Availability of milk−0.03−0.330.230.26-0.110.75
Availability of food grains0.37−0.270.710.21−0.05−0.26
Literacy of rural female−0.650.320.21−0.190.160.35
Rural electrification0.430.06−0.290.40−0.050.08
Village road connectivity0.66−0.060.04−0.170.24−0.02
Mortality rate of infants−0.180.08−0.090.050.730.03
Availability of ground water0.05−0.230.210.86−0.09−0.001
Table 4. Economic Efficiency Index (EEI), Ecological Security Index (ESI), and Social Equity Index (SEI) ranking for different regions of Karnataka.
RegionEEIEEI RankESIESI RankSEISEI Rank
North Interior Karnataka0.4020.3830.502
South Interior Karnataka0.4510.4420.561
Coastal Karnataka0.3830.9110.363
Table 5. Economic Efficiency Index (EEI), Ecological Security Index (ESI), and Social Equity Index (SEI) ranking for different districts of Karnataka.
DistrictsEEIEEI RankESIESI RankSEISEI Rank
Bagalkote0.44120.24230.3621
Ballari0.6040.42140.3919
Belagavi0.6330.00270.6110
Bengaluru (R)0.4890.28210.4715
Bengaluru (U)0.18250.09250.3820
Bidar0.20240.52100.5313
Chamarajanagara0.32210.6870.1624
Chikkamagaluru0.37170.7360.4318
Chitradurga0.34200.21240.708
Dakshina Kannada0.48100.8640.1225
Davanagere0.7810.36171.001
Dharwad0.16270.6680.3222
Gadag0.18260.47110.4914
Hassan0.6620.44120.804
Haveri0.5660.44130.923
Kalburgi0.44130.33180.4516
Kodagu0.5471.0010.0027
Kolar0.42140.01260.5611
Koppal0.40150.39150.745
Mandya0.5180.32190.736
Mysuru0.40160.5790.4517
Raichur0.46110.32200.1226
Shivamogga0.5950.8550.972
Tumkuru0.32220.25220.659
Udupi0.36180.9030.717
Uttara Kannada0.31230.9720.2523
Vijayapura0.35190.37160.5612
Table 6. Sustainable Livelihood Security Index (SLSI) based on linear scoring for different districts of Karnataka.
DistrictsLinear ScoringRegion Average
North Interior Karnataka
Bagalkote0.330.38
Ballari0.60
Belagavi0.58
Bidar0.25
Dharwad0.30
Gadag0.24
Haveri0.55
Kalburgi0.25
Koppal0.43
Raichur0.38
Vijayapura0.29
South Interior Karnataka
Bengaluru (R)0.490.56
Bengaluru (U)0.00
Chamarajanagara0.61
Chikkamagaluru0.63
Chitradurga0.33
Davanagere0.79
Hassan0.75
Kodagu0.92
Kolar0.36
Mandya0.54
Mysuru0.55
Shivamogga1.00
Tumkuru0.30
Coastal Karnataka
Dakshina Kannada0.740.73
Udupi0.65
Uttara Kannada0.79
Publisher’s Note: MDPI stays neutral with regard to jurisdictional claims in published maps and institutional affiliations.

