2. Current State Analysis
According to the GSMA report (annual report published by GSMA Association about mobile phone trends and usage, including data from 750 mobile operators worldwide), by the end of 2020, 5.2 billion people were subscribed to mobile services globally, representing 67% of the global population. In Europe, there were 472 million unique subscribers, and the penetration rate was 86%. When analyzing the number of SIM Connections, in 2020, in Europe, there were 674 million active connections that represent a penetration of 123% [
4]. According to this, the number of drivers who actively use the mobile phone while driving is also rising [
5]. Research has shown that mobile phone usage in traffic is one of four key factors (together with speed, alcohol, and the non-use of passive road safety devices) that cause serious accidents, injuries, and deaths in road traffic [
6]. Mobile phone usage is the key cause of distraction, which, depending on countries, accounts for a total of 11–30% of all traffic accidents [
3,
7,
8,
9]. Four types of distraction while using the mobile phone in traffic have been identified:
visual (not focusing on the road in front);
cognitive (during mobile phone usage, drivers fail to pay attention, and their concentration and judgement is declining, since their attention is split between driving and talking on the phone);
physical (driver’s arms are no longer on the steering wheel; rather, they are used to talk on the mobile phone);
sound (congestion of warning sounds).
Cognitive distraction has the biggest impact on the driver. Therefore, the driver is equally less focused on driving whether he is holding the phone in his hand or is using “hands-free” functions. The result of cognitive distraction is that the driver unconsciously prioritizes the phone call over the driving itself. Additionally, unlike talking to another passenger in the vehicle, phone calls are characterized by other hazards. The person the driver is talking to on the phone is not aware of the traffic situation the driver is in. If a potentially dangerous situation occurs, the driver and passenger will slow down or stop the conversation, focusing on the road. When talking on the phone, the other person is not aware of such a situation and will continue a normal conversation, which will make the driver even less focused in a moment when his full focus is required to handle the situation accordingly [
5,
8,
9]. Additionally, research results point out that the presence of a phone turned on in the vehicle is a distractor in general, even if it is not actively used, especially with drivers who frequently use it in general [
10,
11,
12].
Distraction while driving is dangerous since it significantly affects the driver’s reaction speed. A driving simulator study found that drivers using cell phones had slower reaction times than drivers with a 0.08 blood alcohol content [
13]. According to research, it has been determined that the average driver reaction time in normal circumstances is 0.6 s, while it increases to 1.5 s while conducting a phone call and 2.7 s while texting. For 2.7 s, with a speed of 60 km/h, a vehicle travels a length of 45 m, which equals 12 pedestrian crossings in length. When research results are adapted to highway speeds, the vehicle is, at a speed of 100 km/h, unattended for 75 m, while the driver is reading a message or texting (2.7 s). The same results, for a speed of 130 km/h, equals almost 100 m [
14]. Therefore, all “phone-use conditions“ proved to be the most significant factors in degrading the driving performance (up to 204%) [
15,
16,
17].
The European Union has, in its document “EU road safety policy framework 2021–2030—Next steps towards ‘Vision Zero’”, paid special attention to mobile phone usage as a distractor. “Usage of mobile phones while driving” has been chosen as a simple and measurable variable for estimating the problem of driver’s lack of concentration, to define the key indicator. Therefore, the key performance indicator has been defined: the percentage of drivers who do not use a mobile phone. A methodology that suggests direct observations next to the road or in a moving vehicle to collect data is also proposed. However, if available, other methodologies can be used, for example, automatic detection. Every state member should choose its method. The indicator is supposed to include highways and rural roads that are not highways, as well as urban areas, while the following types of vehicles and users are included: passenger cars and light road freight vehicles and autobuses as a minimum, as well as other types of users, if required. It is also suggested that the location should be chosen randomly, while each member state decides about the methodology, and the observations should be made in daylight [
5].
A number of studies have tried to determine how many drivers actually use mobile phones while driving. Although data about the precise number of mobile phone subscribers do exist, data about the number of drivers using their mobile phone while driving are not so precise. There are few major sources for estimating these numbers that include self-reports, observational studies, and police accident records, each with certain limitations [
17]. Studies from a number of countries suggest that the proportion of drivers using mobile phones while driving has increased over the past 5–10 years, ranging from 1% to up to 11% [
5]. As stated, those data are generally based on self reports as a part of surveys and questionnaires or by performing visual observations. Most recent research in Croatia has found that 8.9% of drivers are using a mobile phone while driving (as a result of visual observation) [
18]. Based on research, voice communication is the main reason for using a mobile phone while driving (86%), and the navigation and texting (SMS, WhatsApp, Viber, and Skype) are equally present (44%). Social networking is the reason why 15% of respondents uses their mobile phone, followed by emailing with 13%. Approximately 80% of drivers now report using their mobile phones covertly (i.e., holding their phones out of sight to persons external to the vehicle) to avoid detection by law enforcement [
19].
Until the full deployment and utilization of connected and automated vehicles [
20], mobile phone usage among drivers will represent a security threat. The rising number of mobile phone users, as well as of drivers who actively use the mobile phone while driving, and the rising number of accidents caused by this factor are a motive for research and to find new methods, based on big datasets and data science. These methods should stop the trend of negative consequences of mobile phone usage while driving, primarily by acting appropriately in target areas and in a time when such activities are frequent. Compared to traditional methods of collecting and processing data, using big datasets and data science has several key advantages. Collecting and processing data usually generates a massive amount of data and includes a significantly bigger sample, which, in most cases, includes all involved participants, while traditional methods usually consist of determining a minimal statistical sample, which, in absolute numbers, represents a significantly smaller number of involved persons or respondents [
21]. Data collection methods, such as manual observation, must include the human factor, which has a possibility of a mistake and puts the workers in danger, since they perform the observations in the immediate vicinity of the road. Using big datasets eliminates this possibility since the human factor while collecting data has been, to a greater extent, replaced by computer systems. Traditional observations are usually point-type (it is performed on a certain road segment), and it involves many resources (usually human resources) and involves the long and error-prone process of digitalizing and processing the data). Using data science on big datasets, this problem is addressed in a way that makes it possible to include a significantly bigger coverage area, and the data processing can take place immediately after its collection, or also while its collection occurs. This way, processing times (as well as required resources) are becoming significantly lower, while also improving the precision, as the process is sequential and automatized.
Analysis of available scientific literature has shown that, based on the authors’ knowledge, a method that would use anonymized big datasets from telecommunication networks to identify road sections with higher mobile phone usage has not been developed so far. Therefore, this method will be the subject of this research.
3. Defining the Methodology for Identifying the Pattern of Mobile Phone Use by Drivers While Driving
This section defines the methodology for identifying the pattern of mobile phone use by the driver while driving.
3.1. Data Used and Proposed Methodology Overview
The methodology envisages an analysis of the use of two different datasets collected from the mobile telephony operators, namely, “data for the charging of telecommunication services”—called Call (Charging) Data Records (CDR), as well as the data on the use of “data traffic”. Call Data Record data sets are collected all the time by all operators, since these data are used for charging purposes. “Data traffic data” are collected on demand by mobile network operators for specific analysis, including mobile network tuning and optimization.
The set of data generated by telecommunication events is called Call Data Records (CDR). They are created after some telecommunication activity in the network. The events include activities such as voice calls, SMS or MMS services, data traffic usage, and roaming information. For the purposes of this research, out of the CDR set of data, only data related to voice calling and texting will be used, whereas data on data traffic usage will be drawn from another source. As a rule, the records contain information on the start time of the activity and the duration of the service, as well as the type of activity, and the operators use them for the purpose of recording the telecommunication activities of the users, on the basis of which an invoice for services is formed. The structure and the content of the data from the records for the billing of telecommunication services are standardized and independent of the equipment manufacturer or service provider. The analysis of data for telecommunications billing will provide an answer to the question of how much the actual number of voice calls is within the coverage area, i.e., the observed road segment, which can be segmented into smaller sections. By using additional data sources (determining the occupancy of the vehicle) and the total number of trips in that segment, it is possible to determine the share of drivers and passengers who have an active voice call on the move. Data traffic are the data that are transmitted over a mobile network. The operators offer various technologies for the use of data traffic, and each of them defines the speed of data transfer. To collect data, a system is used that records events from the network, correlates the collected data, and saves them in a database. For the purposes of this methodology, data on the total volume of transmitted data traffic in the relevant coverage area are used. The analysis of data on the use of data traffic will answer the question of how many users on the move use a mobile phone to work in applications, make calls over the data network, and access the Internet. The coverage area, the same as in the analysis of data for the charging of telecommunication services, allows the segmentation of the road into smaller sections. This dataset is the most massive one and contains most information, and, as such, it has the greatest prospect for determining in more detail the number of drivers and passengers who use mobile phone while driving. All the above data have been anonymized in an appropriate manner, in order to fully comply with all the current legal regulations and guidelines related to the protection of personal data and are in line with the GDPR regulation. A number of both technical and organizational measures have been taken to ensure this. In the case of data about data traffic, they only indicate the volume of transmitted data and do not provide insight into the content of the transmitted data. The overall process included 11 steps presented in
Figure 1.
Steps 1–3 are identical for both datasets, as is Step 11. Steps 4a–10a refer to charging data processing, and Steps 4b–10b relate to data about the data traffic. All steps are described further in the text.
3.2. Common Steps for Both Data Sets
Step 1 refers to the spatial segmentation and determining the coverage area and the timeframe for the analysis includes the following steps. In this sub-step, the geographical area covered by the analysis is determined, i.e., the road that is the subject of the analysis is identified. The identified segments of the transport network (target road) are then divided into smaller sub-segments so that the results of the analysis can better describe each sub-segment (for example, a section of several kilometers). Then, the identification of potential parallel or nearby corridors that are not subject of this analysis is performed, and these need to be isolated so that the data from them would not affect the result of the analysis of the target segment. In accordance with the defined requirements, the timeframes for the analysis are determined, that is, the time coverage of the data that need to be collected. As a rule, time intervals are defined (e.g., characteristic workday, characteristic day of the weekend, time interval during tourist season, day, night).
Step 2 includes defining the data service provider and data delivery. A service provider is defined as the mobile telephone operator with significant market share. Then, anonymized data are supplied. For the purposes of analytics, an anonymized subset of data from the dataset for telecommunication charging (CDR) is used. The data must be anonymized in accordance with the AZOP (Croatian Personal Data Protection Agency—Croatian supervisory authority responsible for monitoring the application of the GDPR) guidelines and in accordance with the GDPR regulation. The anonymized dataset should contain information on the type of telecommunication service (outgoing voice call, incoming voice call, information on SMS messages), duration of telecommunication service, and information on the location of the mobile telephony cell to which the user was connected during the telecommunication activity (start and end of activity). Then, the acquisition of additional datasets that need to be collected for the implementation of the project is defined. On the characteristic sections of the road network, it is necessary to carry out the traffic count, i.e., to determine the average vehicle occupancy. Based on the data on the average vehicle occupancy, the number of drivers and the number of passengers within the coverage area will be determined.
Step 3 refers to data pre-processing. The dataset is pre-processed, i.e., the activities are performed that aim to raise the quality of the dataset so that the result of the activity is better analysis. This includes format adjustment, redundant data deletion, incomplete data deletion, and input dataset verification and validation.
The next steps (4–10) then take place in two parallel processes for the billing data (labeled in the diagram with A) and data on data traffic (labeled in the diagram with B), and the results are fused in the last, 11th step.
3.3. Analysis of CDR Data—Identification of Voice Call Activities
Step 4a refers to the identification of telecommunication activities of the users. From a consolidated dataset follows the identification of every telecommunication activity that can be divided into four key categories (outgoing voice calls, incoming voice calls, incoming SMS message, and outgoing SMS message). In the next steps, the breakdown of these activities will be carried out into those that were generated in motion (while driving) and those activities that were released while the user was stationary. The subject of this analysis will be only those telecommunication activities for which it can be proven that they took place on the move, and those are the calls that have different and distanced base station antennas at the start and at the end of the call. Therefore, the subject of analysis will not include activities related to SMS messages. Sending or receiving SMS messages belongs to the point type of activity that has no duration, and it is not possible to determine whether the event occurred while moving or while the user was stationary. Since the dataset is completely anonymized, it is not possible to link multiple activities (e.g., calls and SMS messages sent by the same user), and therefore the information about text messages is of no value to this survey.
In Step 5a the dataset is further prepared for the analysis by discarding the data about SMS messages and by calculating the indicators related to calls. Based on the call start and end information, it is possible to calculate the call duration. The analysis includes only those data that have a certain duration. Additional filtering is then performed, optimizing the dataset and removing call records for which there are no complete or useful data (e.g., duration of “0” seconds, etc.). Calls that have an extremely long duration (e.g., 7000 s) are additionally analyzed in order to determine whether these are deviating values.
The next step (Step 6a) involves the implementation of analytical steps aimed at identifying those calls that occurred on the move, i.e., while driving, so that further analytics could only apply to those calls and not to those made while the user was stationary. Criteria are defined to determine which call was made on the move. All datasets are then examined according to this set of criteria, and only those calls that were released during movement are taken for further analysis. This step is a prerequisite to separate from all the calls on the move, those that will relate to drivers and passengers. Additionally, filtering is performed of the calls on the move within the coverage zone (if necessary and if the input data do not match the actual coverage area) in order to ensure that the analysis includes only those calls that occurred, ended, or lasted during the user movement within the coverage zone.
Step 7a includes the calculation of the trip characteristics during the call to be used for subsequent analysis. This includes the calculation of the travelled distance and speed calculation. Based on anonymized information about the position of the base station antenna to which the user was connected at the beginning of the telecommunication activity, during the telecommunication activity, and at the end of telecommunication activity, the approximate distance travelled by the user while performing this telecommunication activity is calculated. The travelled distance is calculated as the air distance between the mentioned points. Based on the information about the duration of the telecommunication activity and the information about the approximation of the travelled distance, the average speed of movement for each individual telecommunication activity can be calculated. Determining the mode using the parameter “speed”—for the purpose of determining the users who were on the move, and who are extremely likely to have moved as a driver or passenger by passenger car, bus, and some other mode of transport, which is the subject of this analysis, the range of speed criteria is defined that will be used in the identification of the transport mode used when moving.
Since the type of data about the call contains only the information about the origin and destination of the trip, in Step 8a, it is necessary to supplement the information about the trips through transit sectors.
The procedure of filling in the transit sectors is introduced, which are then assigned a value for each individual call if the user has “passed” through it. For each possible grouped pair of travel origins and destinations, a separate filling logic is defined to make the filling process as accurate as possible and relate to those sectors that are more unlikely as transit sectors. The logic of filling the sectors must take into account the list of roads under research, the list of parallel or adjacent roads not subject to research that may affect the former, and the list of potential origins and destinations in relation to the road under investigation which are geographically or logically divided (e.g., north of the coverage zone and the like).
The principle of filling in the transit sectors is shown in
Figure 2. The coverage zone includes Sectors 1–6, and Sectors 7–12 represent nearby sectors that are not within the coverage zone. Based on the information about the start and end of the call (sectors marked dark purple) the transit sectors are then filled in. In Case A, Sectors 2, 3, 4, and 5 are filled in as the only possible transit sectors in which the call was active while travelling from Sectors 1–6. Examples B and C illustrate the cases in which the user was part of the journey (part of the call duration) in the sectors representing the coverage zone. If, in Example B, the call started in Sector 1 and ended in Sector 9, and from Sector 4 to 9 there is an alternative road that is not in the coverage area, only those transit sectors that are in the coverage area, i.e., Sectors 2, 3, and 4, are filled in. The result is a table of all trips realized with the active call in which, apart from the initial and final sector, the transit sectors are also defined.
In Step 9a, the analysis of the number of active calls per sector is then performed. The table created as a result of Step 8a represents the final dataset on the calls while moving and their geographical distribution. In this step, for a defined time for which the analysis is performed, a “count” of active calls per sector is carried out, in order to calculate the number of active calls in that sector, which will indicate the number of users who had an active voice call while driving. The result of this step will be a table that will show, per sector, i.e., road section, how many active voice calls there were during the defined period of time while driving.
Step 10a refers to the analysis of the number of active drivers and passengers per sector. In the previous step, the total number of the users in the call and the total number of the users with active calls per sector have been identified. In order to distinguish the drivers from passengers, in this step, the number of active users is broken down into these two categories based on the second set of input data, and is described in detail in Step 10b. There are two approaches. The first is based on the pre-defined data (information on vehicle occupancy); an estimate is made of the number, i.e., share of the drivers and passengers who actively use mobile phone in a call while driving. For example, if the average vehicle occupancy is 1.5, a hundred vehicles contain 150 people. Based on this occupancy rate, the number of drivers in this case is 100, and the number of passengers is 50. The total number of calls will be distributed according to this ratio (100:50) among drivers and passengers. The second approach identifies so-called “minimum certain number of drivers” that use a mobile phone. This approach is elaborated in detail in Step 10b. It is based on the assumption that passengers use a mobile phone more often than drivers. If all passengers are assigned with active phone usage, the remaining number of identified active mobile phone usage is dedicated to drivers, and it represents the certain minimum of drivers using mobile phone. For example, if 75 active mobile phone usages have been identified in the section where 100 vehicles with 150 passengers were identified, 50 active mobile phone usages will be assigned to 50 passengers, and the remaining 25 active mobile phone usages will be identified as a certain minimum number of drivers that are using a mobile phone while driving. This step completes the analysis of data for charging the telecommunication services.
3.4. Analysis of “Data Traffic” Data—Identification of Usage of Applications
A parallel set of activities includes Steps 4b–10b. In this part, the methodological frame for data processing on data traffic has been defined, in order to determine the number of users in the coverage area who actively use mobile phones while driving in terms of using applications and Internet access, based on the volumes of data traffic transmitted on the mobile terminal in a particular sector of the analysis.
Step 4b—the fourth step of the process is to provide a large amount of information on the position of the users obtained from the mobile network; often even hundreds of scattered records per second need to be adjusted so as to use them to calculate user migrations, i.e., realized trips. Optimization of the user position is performed, which includes a series of optimization processes and the application of procedures for removing deviations and spatial and temporal grouping in order to reduce a large number of different points to an optimal number for the analysis (e.g., one location per second), at the same time not impairing the positioning accuracy. Then, based on the data on the optimized user locations, a spatial–temporal analysis is performed, with the aim of determining the locations in which the user stayed long enough (configurable parameter) for these locations to be called stay locations. After having defined the retention locations, the potential migrations between retention locations are determined, that is, the criteria are defined, using which it will be determined whether the transitions between individual retention locations can be defined as migration (trip). In this way, an anonymized travel list is determined for all the users covered by the analysis. Each trip then becomes determined by appropriate attributes, such as the trip start point, trip end point, trip start timestamp, trip end timestamp, air distance travelled during the trip, travel duration, and the average speed. Then, a set of predefined criteria is applied in order to single out from this set only those trips that relate to the mode of transport that is the subject of the analysis.
Based on the information from the previous step, in Step 5b, a list of all the trips per transport modes for the coverage area is defined. This is followed by the procedure of removing the deviant and incorrect values, which includes all the trips with extremely low or extremely high values relating to the trip duration, travelled distances and speeds, which may indicate an error in the data. The result is a refined list of all the journeys, which is ready for the analysis in the next steps.
Then, in Step 6b, the data traffic analysis per trip is performed. The initial travel list is expanded by the information about the amount of data traffic transmitted during every single trip. For every trip, the amount of data traffic (downloading and sending data) that the mobile terminal and the network have exchanged during the trip is identified. The amount of the transmitted traffic per trip is then distributed, in accordance with the time of stay of the user in a particular sector, to every individual sector that was involved in the trip or in which the trip took place.
Then, in Step 7b follows the analysis of usage and defining of the criteria for the use categorization into “active” and “passive”. A very complex analysis is performed to determine the range of traffic volumes that may characterize active and passive use of the application. The applications on the mobile phone can generate data traffic even when the mobile phone is not actively used; therefore, it is necessary to define the ranges of data transfer volumes per sector in order to determine whether the user is actively or passively using the mobile phone. Such a set of criteria needs to be defined for each individual sector, since this number can vary depending on the length of the road section in a sector, average movement speed, or the retention time of the user in the sector. Therefore, in this step, an analysis for every single sector is performed, by testing different values (e.g., mean value of the amount of transmitted data, median of the transmitted data, etc.) and using mathematical grouping methods (e.g., k-means clustering) in order to divide the dataset into two sub-groups (clusters) based on the appropriate criteria of similarity, where then belonging to a certain group defined whether the user was actively or passively using the mobile phone. Based on the previous step, the ranges for the detection of active and passive users for each single sector are defined.
Then, in Step 8b, an analysis of mobile phone use is performed, for each individual trip in each individual sector. For each individual trip, an analysis of the amount of data transferred and a comparison with the pre-defined categories is performed. Based on this comparison, the value is recorded that: (a) the user in the sector actively used the applications, (b) passively used the applications, or (c) was not even present in that sector. Upon the completion of the previous step, then, the counting of active and passive users per single sector is carried out in order to determine the number of active users of the mobile phone per sector. In this phase, it is still about all the users, that is, the drivers and the passengers that will be separated in the next steps.
In Step 9a, the information on the user activity in the sectors in which the telecommunication traffic was not recorded, and the user was moving in that sector, is being supplemented. If the user, on their trip, went through a certain series of sectors, for each of them, an analysis is performed, described in the previous steps, which determines whether the user was active or passive in those sectors. However, if no value is recorded in a particular sector, which is located between the sectors in which the user had an activity, in this part of the process, these sectors are marked as “passive”. An example of the filling logic is given in
Figure 3. Thus, if the origin and target sector were outside the coverage area and had data traffic in a non-marginal sector, the marginal sector is “filled” and marked as passive. If, between the sectors in which the user was obviously active or passive, there is a sector in which there are no records, then these missing values are filled in and the user is classified there as passive. For each possible grouped pair of trip origins and destinations, a separate filling logic is defined in order to make the filling process as accurate as possible and refer to those sectors that are most likely as transit sectors.
Thus, the user has records by which they are categorized as active or a user in the first two and the last two sectors. In the middle two sectors, that were also part of that one trip, there are no records on the usage. The logic of filling in the sectors will then assume that, since the user passed through those sectors, and they contain no records, their use of the mobile phone was “passive”. The result is a table of all the trips realized with an active call in which, in addition to the initial and final sectors, the transit sectors are also identified.
The final step of this part of the process (Step 10b) involves determining the number of drivers and passengers in relation to the total number of detected users. There are two options available, namely the division on drivers and passengers by using a fixed ratio obtained from the data on vehicle occupancy, as well as using the “method of minimum number of drivers”, to obtain the final ratio of creating a range of active driver mobile phone users. The process has been defined as follows. The total number of identified trips is weighted with appropriate weight in order to scale the absolute number of trips to 100% of the value of the total population. In this way, the total number of persons whose migrations have been recorded in the coverage area is obtained. The following analysis is then performed for each sector. First, the value of the “minimal number of drivers” who use the application is determined. It assumes that, as a rule, the passengers in the vehicle use the applications more than the drivers, and the assumption that the minimal number of drivers who use the applications on the mobile phone while driving is the number of users that remains after the number of all the identified passengers is subtracted from the total number of active users. In this way, if all the passengers use the applications on their mobile phones, the lowest number of drivers who use the applications while driving is obtained in a reliable manner. Based on the information about the vehicle occupancy, from the data on the overall number of persons, the number of drivers and the number of passengers are calculated. Based on the information on the use of applications from the mobile network, the number of active users of applications is obtained, divided in a fixed ratio, representing the upper limit of the drivers using the mobile phone. The upper range limit is defined based on the assumption that both the drivers and the passengers use mobile phones during driving equally. Thus, the total number of users who actively use the applications on mobile phone is divided in the driver/passenger ratio, obtained from the measured average vehicle occupancy. In this way, the absolute number of drivers and passengers who actively use mobile phones while driving is calculated, and, based on these amounts, it is possible to determine the share of active drivers in relation to all the drivers and in relation to all the persons included in the analysis.
The procedure of determination can be described as follows in equations from (1) to (10):
where:
Vfin_ak—final number of active drivers defined by the range from the minimal number of active drivers to the number of active drivers calculated on the basis of a fix ratio;
Vmin—minimal number of active drivers;
Vfix—number of active drivers calculated on the basis of fix ratio;
Unp—total number of users—non-weighted;
α—coefficient for determining the share of mobile operator;
Up—total number of users (weighted);
V—number of drivers;
P—number of passengers;
β—drivers share coefficient (from vehicle occupancy);
γ—passenger share coefficient (from vehicle occupancy);
δ—coefficient for determining the number of active users, i.e., users who use applications on mobile phone while driving;
Uak—total number of active users, i.e., users who use applications while driving;
Vak—total number of active drivers, i.e., drivers who use applications while driving;
Pak—total number of active passengers, i.e., drivers who use applications while driving.
The result of the process is the defined range of active drivers for each individual sector of the road, which is defined by the value of the minimal number of drivers and the number of drivers who actively use the applications on the mobile phone while driving.
3.5. Fusion of Results from CDR Data and “Data Traffic” Data
Step 11 combines the results of the analysis of the data from the call and the analysis of the data on data traffic, and a unique assessment of the use of mobile phone by the driver while driving is introduced.
The result of the analysis of data for charging the telecommunication services will give the estimate of the share of the “minimal” and “maximal” number of drivers who are in voice call on a particular road section. The result of the data analysis about the data traffic will give the estimate of the share of “minimal” and “maximal” number of drivers who are categorized as “active” users of mobile applications on a particular road section. Although coming from the same mobile operator, the two datasets, for the protection of privacy, cannot be related to each other, and it is therefore necessary to define the way in which the final, cumulative assessment of the user activity on a particular road segment will be given.
The cumulative assessment will look at the lower and upper limits of the analysis of mobile phone use by two segments (voice calls and applications). Given that there may be overlaps (e.g., a user in one part of the sector has an active voice call and in the other one used the applications, which is in nature still a total of a single user and not one in each set), the logic is introduced that observes the upper (less favorable) values and the minimal and maximal limits of use for each set. Based on these, it then defines the range that determines how much in which segment the mobile phone is used by the driver.
In order to determine the mean value of use and for a more practical visualization per segment, it is possible to also introduce a method that will divide the defined range into four intervals (quartiles) and will especially indicate the inclusive median (second and third quartile), whereas the values of the first fourth quartile will be marked separately, as shown in
Figure 4.
The result of this step defines the range of the total use of mobile phone (voice call and the use of applications), which is then assigned to each individual segment and can be used for further analytics and visualization of the results.
An example of methodology application is provided in the next section.
4. Application of Methodology on Pilot Zones
In this section, methodology will be applied on pilot zones, which is state road D1 in Croatia and both data on telecommunication service charges and data on “data traffic” will be utilized to identify road sections with above average mobile phone usage. This section of state road was selected by road operator Croatian Roads Ltd. (Zagreb, Croatia).
4.1. Data on Telecommunication Service Charges (CDR—Charging Data Records)
In the first step, spatial segmentation has been made, and the coverage area of the pilot project has been defined. The coverage area is presented on
Figure 5 and is related to the segment of the D1 State Road in the Republic of Croatia (Sectors 81–88) and Sector 89, which represents the parallel road not being part of the analysis. Afterwards, spatial decomposition into smaller segments takes place, for the analysis results to describe a certain subsegment with more quality and precision (for example, a road section with a length of several kilometers). The respective section lengths are presented in
Table 1.
After the spatial segmentation, the defining of corridors subject to analysis, as well as alternative corridors, the following step is to determine the timeframe for analysis, or the time coverage of data that is necessary to collect.
A typical working day during the autumn of 2020 (Wednesday) has been chosen for the purpose of this research. Anonymized data has been collected for this timeframe. Afterwards, measurements were performed to secure additional datasets, which are required for project implementation. Traffic counting has been conducted at typical segments of the road network, as well as average vehicle occupancy per vehicle category; both counts were conducted at the same cross-sections. Traffic counting data has been obtained from automatic traffic counters of road operator Croatian Roads Ltd., and vehicle occupancy was measured (monitored) by trained human traffic counters.
Average vehicle occupancy per location has been determined, as well as the average number of persons in different vehicle categories. Average vehicle occupancy is presented in
Table 2. Please note that the abbreviation RFV represents road freight vehicles.
Following this, an analysis, which included determining the share of each vehicle category in the total number of vehicles, has been conducted. The absolute number of vehicles per each category and the respective vehicle occupancy per category data helps to determine the number of drivers and passengers, as well as the final ratio of drivers and passengers on each cross-section. The results are presented in
Table 3.
Using the data from
Table 3, the final ratio of drivers and passengers on the entire section of both subject roads has been determined, where the share of drivers is 74.35%, while the share of passengers is 25.65%. The average number of persons in a vehicle is 1.34.
The data set related to the analyzed typical day and zone also includes telecommunications activities, as is shown in
Table 4. In this step, all telecommunications activities are presented, without taking into account if the activities were performed while moving or remaining stationary.
Using defined conditions and criteria, the dataset connected to activities performed while being stationary (including SMS messages) is excluded from analysis. Therefore, the total number of telecommunications activities now contains data about 21,662 calls. This is followed by a calculation of travel characteristics during calls. Afterwards, it is possible to conduct an analysis of distance travelled during a call (
Figure 6a), an analysis of call duration in relation to distance travelled (
Figure 6b), and an analysis of average speed values (
Figure 6c,d).
As expected, a correlation has been determined between distance travelled and call duration, while the Pearson correlation coefficient equals 0.24, with a statistical significance of 0.001.
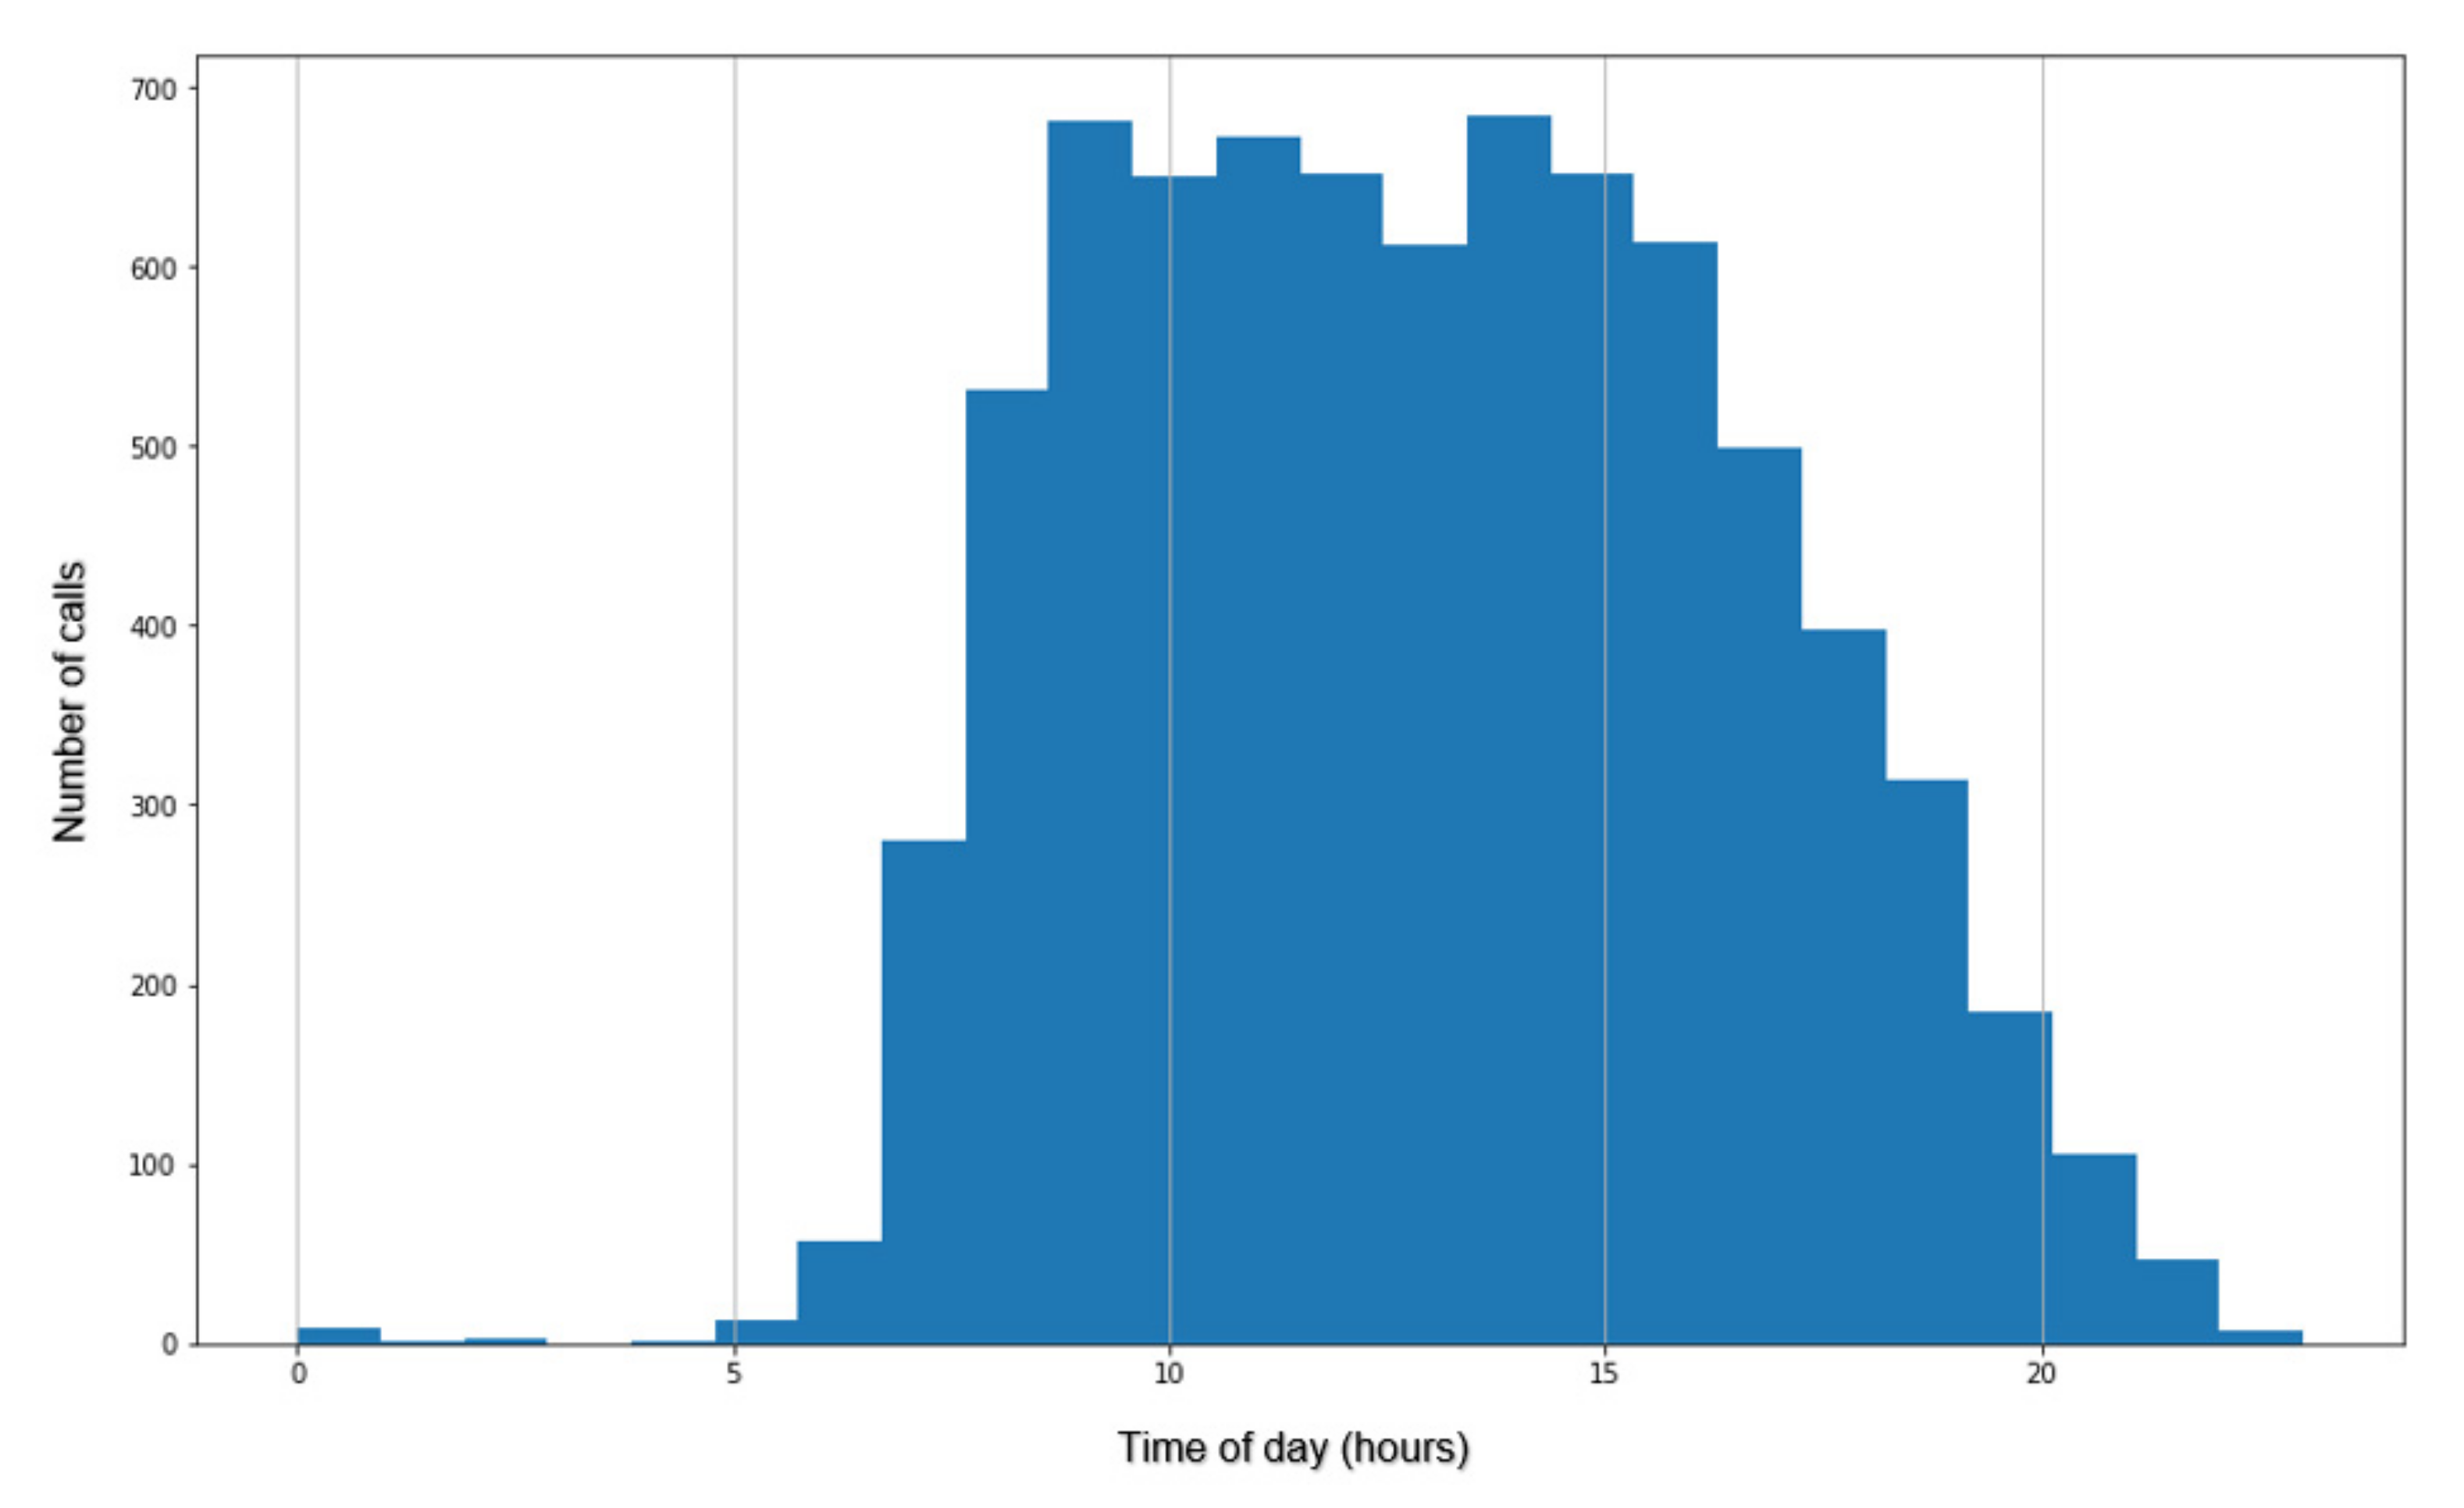
Using speed data, a set of criteria that a trip must meet for it to be considered as realized by one of the transport modes that are subject of this research is created. After applying speed filters, the dataset has been reduced to a total of 7663 calls, for which it can be assumed that they were made by the driver or passenger during the trip. The analysis of average call duration during the trip is presented in
Figure 7. Aditionally, to check the correctness of data, a separate analysis of exceptionally long calls (for example, calls with a duration of 1 h or more) has been conducted, as well as an analysis of a pattern of mobile phone usage, which shows the distribution of calls according to the time when the call started, relative to the time of the day.
Following this, the process of supplementing information about travel on transit sectors is conducted.
An illustration of a table with unfilled and filled transit sectors are shown in
Table 5 and
Table 6, where “S” represents the starting sector, while “F” represents the final sector, obtained from the telecommunications activities charge record. The sectors in the coverage area are marked with numbers from 81 to 99.
The result is a table of all trips during which a call was made, in which the sectors where the calls were active are filled.
In the next step, a count of active calls per sector is performed for the timeframe in which the analysis is conducted. This is undertaken to determine the actual number of active calls during a trip per sector, as well as the span of minimal and maximal number of drivers who conducted an active voice call in that segment. The share of minimal and maximal number of drivers who made an active phone call on the defined segments of the road network is shown in
Table 7.
The share of minimal and maximal number of drivers who made an active phone call on the defined segments of the road network is shown in
Figure 8a,b and
Figure 9, which present the final result of this analysis.
As can be seen in the figures and tables in this subsection, the usage of mobile phones for voice calls while driving (made by the driver) is significantly widespread on all segments of the D1 State Road, which was subject to analysis. The span of usage ranges from a minimum of approximately 2% of drivers on some sectors to, for some sectors (such as Sectors 82, 83, and 84), 15% or more, which indicates that, in total, every seventh driver is making a voice call while driving.
Overall, making a voice call while driving is, in most cases, less widespread than using mobile apps on the phone (next section). Still, it indicates that these figures are exceptionally high, and they present a serious threat to road traffic safety.
4.2. Data on Mobile Data Traffic
The mobile data dataset, which is subject to this analysis, refers to a typical working day (Wednesday) and contains multiple terabytes of uncompromised records from the mobile network, which are preprocessed in the next steps, and redundant values are removed. The following step includes the optimization of the user’s position, and the computing of holding locations has been conducted, during which the typical holding locations for each user has been identified. Using this information, trips with all respective attributes were defined. After this, a set of predefined criteria is applied, to segregate only the trips that are related to transport modes that are the subject of this analysis. In the coverage area, around 35,000 individual users have been recorded, during a typical day. These users have made around 67,700 trips in the coverage area. An example of a trip table is shown in
Table 8. The data in the table filled for the purpose of this report are illustrative, and, for the purpose of privacy protection, do not match the actual data.
Afterwards, an analysis of mobile data traffic per trip is conducted. In this step, the initial list of trips is expanded with information on the amount of data traffic that was transmitted during each individual trip so that the amount of data traffic can be identified for each trip. Afterwards, these amounts are distributed to each individual sector that was involved in the trip (each sector through which the trip occurred). An example of a table containing information on the amount of transmitted data per trip is given in
Table 9, and the amounts of data traffic per trip are shown in
Figure 10a,b.
Following this step, the analysis of mobile data transmission per sector and per user is conducted, with the purpose of determining the span of data volume. This entire step is conducted with the purpose of separating the users into active and passive. In this step, the analysis is conducted for each individual sector, in such a manner that different values are tested (for example, the average value of the amount of transmitted data, median of transmitted data, and so on) and mathematical methods of grouping are used (for example, k-means clustering), in order for the dataset to be split into two subgroups (clusters) using adequate similarity criteria. Whether data belong to one group or the other defines if the user has been actively or passively using his mobile phone. Determining the boundary of separation of the two sectors requires careful analysis, since this boundary is different in each sector, depending on the sector size, average travel time through the sector, etc.
The analysis of mobile data traffic per sector, shown in percentiles of the number of users for D1 State Road, are presented in
Table 10. The graphical representation of transmitted mobile data in relation to the percentile of the number of trips (users) for one target sector (for example, sector 81), is shown in
Figure 10. It is defined that the median of transmitted mobile data will be used as the boundary of active and passive mobile app usage. In addition to the value of the amount of mobile data traffic, the limit factor that defines the minimal amount of mobile data traffic that the user must consume to be pronounced as active was introduced. For all trips, all values of the realized mobile data traffic per sector are compared to the limit values to evaluate if the user is active or passive in a certain sector, as shown in
Table 10.
According to the methodology, the next step is to fill in the information regarding the user’s activities in sectors in which the telecommunication traffic has not been recorded, but the user has been moving in this sector and has had recorded activity in the previous and next sectors. Such fields are labelled as passive, and the table is updated with the appropriate values, as shown in
Table 11.
The last step in the process includes the determination of the number of drivers and users in relation to the total number of detected users. Two options are available: separating persons into drivers and passengers using the fixed ratio obtained from the vehicle occupancy data, as well as by using the “method of the smallest number of drivers“, with the purpose of obtaining the final ratio and creating a span of active mobile phone users who drive.
The upper limit of the span is defined using the assumption that both drivers and passengers equally use their mobile phone during the trip. Using this methodology, the total number of users who actively use mobile apps is divided using the ratio drivers/passengers, obtained from the average vehicle occupancy survey. In this way, the absolute number of drivers and passengers who actively use their mobile phone during the trip is computed, and, using these values, it is possible to determine the share of active drivers in relation to all drivers and in relation to all persons covered by the analysis.
As can be seen in the
Figure 11 and
Figure 12 and tables in this subsection, the usage of mobile apps while driving (used by the driver) is significantly distributed on all segments of the D1 State Road. For some sections, it is not possible to determine the minimal number of usages, since the total amount of identified passengers exceeds the total amount of active mobile app users. Therefore, the minimal value for this segment was set to 0%, but for some sectors (for example, Sector 81), the minimal number of drivers is more than 10%. Additionally, if the figures indicating the maximal share of drivers that use mobile apps while driving are considered, the figures are high in all sectors, while they grow over 30% in sectors with the highest usage of mobile apps.
According to the methodology defined in Step 11 of the methodology, the results of the analysis of voice call usage, as well as the usage of mobile apps are fused to obtain the final assessment of mobile phone usage by drivers, while driving. The results that show the share of drivers who actively use their mobile phone while driving on the D1 State Road are shown in
Table 13, as well as graphically represented in
Figure 13a,b.
Table 14 shows those elements of the road network on which the mobile phones has been used the most, in terms of using voice calls, using mobile apps, and in total. According to the figures from the table, most drivers use voice calls on sections 83, 82, and 81 of the D1 State Road, while this figure is the highest in Sector 83 and it equals as much as 16.81%.
In terms of using mobile apps, the usage is highest in Sectors 82 and 86 on the D1 State Road, as well as in Sectors 99 and 94 on the D8 State Road. If the total usage of the mobile phone is observed, sectors in which drivers use voice calls and apps the most, or in which they use telecommunication services the most, are Sectors 82 and 86 of D1 State Road and Sectors 99 and 94 of D8 State Road.
Figure 14a features a graphical representation of the “minimal” share of drivers who use the mobile phone in general while driving on the D1 State Road.
Figure 14b presents the maximal share of drivers who use their mobile phone while driving on the D1 State Road.
The research results indicate that the share of drivers who use their mobile phone for voice calls or for mobile app usage is very high and presents a serious road traffic safety risk. For example, if the total usage of the mobile phone is observed, sectors in which the drivers use both voice calls and mobile apps, or in which they use telecommunication services while driving the most, are Sectors 82 and 86 of D1 State Road and Sectors 99 and 94 of D8 State Road.
Thus, in Sector 82, this span ranges from 10.68% to 33.90%, in Sector 85 from 9.46% to 33%, in Sector 93 from 4.21% to 30%, and in Sector 98 from 2.56% to as much as 31.5%. Therefore, on all four sections, the frequency of active mobile phone usage by the driver is very high. In average values, it amounts to almost 20%, which means that almost every fifth driver is using his phone to make a voice call or is using some of his mobile apps. If the maximal established values are observed, the mobile phone is used by every third driver on certain sections.
Additionally, using the mobile phone varies from section to section, making it possible to clearly identify priority sections, that is, those on which certain measures should be taken, since the percentage of mobile phone usage, and thus the threat to road traffic safety, is significantly higher.


