Article

Analysis of Conservation Gaps and Landscape Connectivity for Snow Leopard in Qilian Mountains of China

1
Institute of Forest Ecology, Environment and Nature Conservation, Chinese Academy of Forestry, Beijing 100091, China
2
Key Laboratory of Biodiversity Conservation of National Forestry and Grassland Administration, Beijing 100091, China
3
Qilian Mountain National Park Qinghai Administration, Xining 810008, China
*
Author to whom correspondence should be addressed.
Sustainability 2022, 14(3), 1638; https://doi.org/10.3390/su14031638
Submission received: 6 January 2022 / Revised: 26 January 2022 / Accepted: 26 January 2022 / Published: 30 January 2022

Abstract

:
Human modification and habitat fragmentation have a substantial influence on large carnivores, which need extensive, contiguous habitats to survive in a landscape. The establishment of protected areas is an effective way to offer protection for carnivore populations by buffering them from anthropogenic impacts. In this study, we used MaxEnt to model habitat suitability and to identify conservation gaps for snow leopard (Panthera uncia) in the Qilian Mountains of China, and then assessed the impact of highways/railways and their corridors on habitat connectivity using a graph-based landscape connectivity model. Our results indicated that the study area had 51,137 km2 of potentially suitable habitat for snow leopards and that there were four protection gaps outside of Qilian Mountain National Park. The findings revealed that the investigated highway and railway resulted in a decrease in connectivity at a regional scale, and that corridor development might enhance regional connectivity, which strengthens the capacity of central habitat patches to act as stepping stones and improve connections between western and eastern habitat patches. This study emphasized the need for assessing the impact of highways and railways, as well as their role in corridor development, on species’ connectivity. Based on our results, we provide some detailed recommendations for designing protection action plans for effectively protecting snow leopard habitat and increasing habitat connectivity.

1. Introduction

Human modification and habitat fragmentation have a substantial influence on large carnivores, which need extensive, contiguous habitats to survive [1]. When developing successful conservation plans, it is crucial to understand how species respond to such changes in order to safeguard key regions and the connectivity they offer [2].
The snow leopard (Panthera uncia) is a rare and endangered big cat species of international concern. It is an apex predator found in alpine ecosystems on the Tibetan Plateau [3]. It serves as an ecosystem health indicator, making it critical for sustaining biodiversity in vulnerable habitats threatened by climate change and human interference [4]. Snow leopards are found in the mountainous regions of 12 countries [3]. Despite their widespread distribution, there is much ambiguity surrounding the total number of snow leopards, which is roughly estimated to be between 4000 and 6500 individuals [5]. Snow leopards were downlisted to a Vulnerable classification by the IUCN in 2017 [6]. This delisting caused disagreement among experts and conservationists, who felt that population levels were exaggerated and threats to snow leopards were understated [7]. While the downlisting has been questioned, widespread consensus exists that snow leopard conservation efforts must be extended and reinforced [8].
Previously published snow leopard research covers a broad range of topics, including abundance and density [9], activity patterns [10], home range size [11], genetic diversity [12], diet [13,14], impacts of climate change [4,15], illegal trade [16], human–snow leopard conflict [17], herder attitudes [18], conservation landscapes [19], and global landscape connectivity [20]. Research on regional landscape connectivity is critical for snow leopards that dwell in a matrix of naturally fragmented and human modified landscapes, as well as for the formulation of effective conservation action plans. Unfortunately, investigation of snow leopard landscape connectivity has received minimal attention [2], particularly the influence of road/railway construction on snow leopard movement [21].
Only 2% of known snow leopard habitat in China has been properly surveyed [22]. The Qilian Mountains are a major snow leopard distribution area that cover both Qinghai and Gansu Provinces. Li et al. [19] designated the Qilian Mountains as one of the Global Snow Leopard Landscape Conservation Units (LCUs) important to the long-term preservation of snow leopard populations. The Chinese Government authorized the creation of the Qilian Mountain National Park Pilot Area in 2017, a transitional stage prior to the formal establishment of a national park. The formation of the national park enables the development of more systematic conservation action plans and the implementation of rigorous protection for the region’s flagship species, including the snow leopard. At present, past investigations in the Qilian Mountain Area have been largely confined to Gansu Province, with fewer studies conducted in Qinghai Province. Research that has been published has predominately focused on conflicts between humans and snow leopard [23], the effect of human and natural environmental variables on snow leopard site-use patterns [24], model selection for various scale species distribution models [25], and genetic structure [26]. These studies identifying the conservation gap of snow leopard habitats and the influence of major roadways on habitat connectivity have received much less attention, but are critical for targeted conservation management of this species and its sympatric species in the Qilian Mountain range.
Ecological niche models (ENMs) are currently the primary modeling tool used for forecasting and resolving issues related to sustainable ecological development [27]. The MaxEnt model, one type of ENM, has become increasingly popular in conservation biology [28]. It is commonly used to anticipate the influence of global climate change on the geographical distribution of target species, as well as to quantify species’ habitat suitability and to analyze species’ niche drift [29,30]. The majority of landscape connectivity modeling tools rely on expert opinion to assign resistance values and estimate landscape connectivity across a resistance surface. These methods do not involve a formal evaluation of the focus species’ biological reactions to landscape variables based on field data. Furthermore, landscape connectivity is species specific [2], necessitating parameterization based on actual movement data in response to landscape characteristics in order to map credible connectivity. The significant expense of acquiring adequate movement data of dispersed individuals or genetic data across landscapes makes this difficult. While ENMs might be used to identify habitat distribution, they could also be used to generate resistance maps based on a habitat suitability index. This is a preferable method over the more subjective way of assigning values based on expert opinion. This resistance degree takes a variety of variables impacting species distribution into account and enables rapid assessment of a species’ connectivity [31].
The use of graph theory to represent ecological networks is becoming a more popular tool for assessing connectivity [32]. Landscape graphs enable the modeling of functional connectivity among habitat patches. Graph-based studies have been used to analyze the role of connectivity for species occurrence [33], examine the influence of a specific road and its development on connectivity [32], and compare various forest management scenarios [34]. Land and conservation planning may benefit greatly from their use [35].
In this work, we developed a distribution model for snow leopards and a landscape connectivity model based on occurrences related with environmental factors. We aimed to (i) analyze potentially suitable habitat for snow leopards in the Qilian Mountain area, (ii) identify current protection gaps within snow leopard habitats, (iii) assess the impact of highways and railways and their corridors on habitat connectivity, and (iv) make conservation recommendations for the snow leopard based upon findings.

2. Methods

2.1. Study Area

The Qilian Mountains are a mountain range in China that is situated on the border of Gansu and Qinghai Provinces. It occupies the boundary between the arid and semi-arid parts of northwest China and the alpine zone of Qinghai–Tibet [36]. Its key roles include serving as a buffer between three deserts, Tengger, Badain Jaran, and Kumtag, and habitat to the south, ensuring the stability of the Hexi Corridor oasis, and ensuring the Yellow River and continental rivers’ runoff supplies [37]. In 2017, the Chinese government authorized the establishment of the Qilian Mountain National Park Pilot Area, which included the Qilian Mountain National Nature Reserve and Yanchiwan Nature Reserve in Gansu Province, as well as the Qilian Mountain Provincial Nature Reserve in Qinghai Province. The pilot area encompasses 50,200 square kilometers in total, with 34,400 square kilometers in Gansu Province, accounting for 68.5% of the overall area. In Qinghai Province, it covers 15,800 square kilometers, representing 31.5% of the total area. Subei, Aksay, Sunan, Minle, Yongchang, Tianzhu, Shandan County, and Liangzhou District are located in Gansu Province, whereas Delinha City, Tianjun, Qilian, and Menyuan county are located in Qinghai Province. We define the research area as the rectangle created by the Qilian Mountain National Park’s 30 km buffer zone, which covers 324,414 square kilometers (Figure 1). Thirty kilometers is somewhat more than the furthest distance (27.9 km) that snow leopards have been seen traveling from one point to another on consecutive days [19,38].

2.2. Occurrence Records

Snow leopard occurrence records (N = 640) included camera trap data and genetically verified fecal samples from 2017 to 2020. To mitigate the effect of spatial autocorrelation, we reduced multiple occurrence data to a single record within a radius of 1 km using SDMtoolbox 2.4 [39]. This study employed a total of 365 occurrence records (Figure 1).

2.3. Environmental Variables

We selected environmental variables that were associated with snow leopard ecological traits, including land cover (Figure S1), topography, Normalized Difference Vegetation Index (NDVI), river density, distance from a major road, and human population density data derived from the China population spatial distribution kilometer grid data set (POP). Topography-related variables included elevation, slope, aspect, curvature, and ruggedness. The elevation data were extracted from a WorldClim digital elevation model (DEM) with a resolution of 30”. Slope, aspect, curvature, and ruggedness were extracted based on DEM. Ruggedness was calculated from elevation using the terrain ruggedness index tools in ArcMap with a moving window size of 3 × 3 [19]. We obtained land cover, NDVI, and POP from Resource and Environment Science and Data Center (http://www.resdc.cn/, accessed on 25 January 2022). Snow leopards can cross general roads, so only highways and railways were taken into account when calculating distance from roads [21] (Figure S1). Road and river data were derived from the OpenStreetMap database (the source of all environmental variables is detailed in Table S1).
We projected all variables into the same projection using ArcGIS 10.6 (ESRI Inc., Redlands, CA, USA), and resampled at a resolution of 1 × 1 km. A modified version was created by deleting Pearson’s correlation coefficients with |r| larger than 0.8 to decrease multicollinearity [40] (Table S2). After that, we excluded factors that contributed less than 1% to the MaxEnt model, leaving us with eight variables to build the snow leopard distribution model (DEM, slope, POP, river density, distance from road, NDVI, land cover, and ruggedness).

2.4. Species Distribution Model

We utilized the maximum entropy technique (MaxEnt 3.3.3k), one of the best performing approaches in modeling species distribution, using presence-only data to generate the habitat suitability for snow leopard [41]. MaxEnt has been used extensively to assess habitat suitability for a wide variety of rare or endangered species [27,31,42]. MaxEnt determines species distributions by calculating the probability distribution of maximum entropy while taking into account data restrictions [43]. MaxEnt also uses jackknife tests to determine the importance of variables and their contributions, which show the degree to which each variable contributed to the model. A total of 75% of the occurrence data were put into a training set for model development and the remaining 25% were put into a random test set for assessing model performance. We used most of the MaxEnt model’s default parameters [43] with the number of background points set to 10,000. The prevalence value was set to 0.7. Random fivefold cross-validation was used to test the model [19].
To assess the model’s performance, we used the threshold-independent area under the receiver operating characteristic curve (AUC) with value ranges of 0–1. AUC values close to 1 imply that the models are in perfect agreement [43]. The importance of variables was estimated using the permutation importance approach [44]. The MaxEnt model’s logistic outputs were used to depict the probabilities of species occurrence [45]. Based on the average of the maximum training sensitivity plus specificity, the results were categorized into presence and absence [46]. Suitable habitats were defined as locations with probability values above the threshold [31].

2.5. Landscape Connectivity Modeling

To quantify landscape connectivity, we employed a landscape graph-based method. This method creates a graph, which is a collection of nodes connected by links or edges, using habitat patches (nodes) and a landscape resistance layer. By calculating the least cost pathways between nodes using a resistance layer, the network edges depict a biologically species-specific landscape. Landscape connectivity indices were then calculated using the characteristics of edges, nodes, and their connections. The program Graphab v2.6 was used to complete all steps of the landscape connectivity analysis [33]. The landscape resistance layer was derived from the habitat suitability index from the MaxEnt model to measure the degree of resistance to the movement of snow leopard. The resistance layer was created by rescaling the inverse of the logistic output from our MaxEnt model from 1 to 100 [4]. Resistance was set to 1 for cells having a value greater than the threshold (the MaxEnt model provided maximum training sensitivity plus specificity). The resistance value for the cell with a value less than the threshold was set to (threshold − “value”) × 100/threshold [31].
Three scenarios were investigated to assess the influence of highways and railways and their potential corridor development on connectivity. The highways and railways were the only changes made between S0 and S1 scenarios in order to examine their effect directly. Scenario S2 was then modeled in accordance with the potential corridor’s construction of the highway and railway.
S0: the landscape resistance layer was created using the habitat suitability index to represent the initial state of connectivity in the study area.
S1: the current state of connectivity as determined by superposing the resistance of the highways and railways on S0. To simulate the barrier of highways and railways, we placed a resistance value of 100 for the highways and railways on the S0 resistance layer.
S2: S1 + corridors were constructed for highways and railways to facilitate snow leopard dispersal between suitable habitats, and the corridor location was selected from areas with a high habitat suitability index (Cost = 1).
To analyze their contribution to connectivity, the S1 scenario was compared to the S0 scenario and the S2 scenario to the S1 scenario. Only the resistance map was altered for each scenario by incorporating changes. Three steps were used to construct our landscape graph. First, the nodes (hereinafter referred to as a “habitat patch”) were defined. The next step was to create a collection of edges. We utilized the resistance surface created for the three scenarios, respectively, to calculate the least-cost distance edges (using cumulative cost along least cost pathways) [32]. The final step was to create a landscape graph using the habitat patches and edges discussed earlier.
We calculated two connectivity metrics at different spatial scales, i.e., regional-scale and local-scale. The probability of connectivity (PC) developed by Saura and Pascual-Hortal [47] was used in the regional study and gave insight into the overall connectivity changes of the study area. The PC was set according to the species’ maximum dispersal distance in a number of studies. However, because snow leopard dispersal events were unknown, a variety of distances by increments of 10 km were investigated to see how sensitive the results were to the distance parameter. To build graphs, the Euclidean distance was transformed to the cumulative cost distance using the following equation: Cumulative Cost Distance = e^(intercept + β × log(Euclidean Distance)) [32]. Their rates of variation were then computed and compared. The extent of the difference between PC values allowed for an evaluation of the effect of highways and railways, as well as potential corridor projects on habitat connectivity.
Betweenness centrality (BC) was determined at the local scale. BC is a measure of route-specific flux and is used to investigate the role of any particular habitat patch as a stepping stone between two other patches [48]. BC was calculated using a maximum movement distance of 30 km to reflect the distance traveled in consecutive days by a snow leopard.

2.6. Conservation Gap Analysis

Conservation gap analysis was conducted to determine habitat area that had not been adequately conserved. Conservation gaps were defined as habitat patches that were distributed continuously but were not included within boundaries of the national park and remained functionally connected after the connectivity graph was built at 30 km. Conservation gaps were identified by an overlay analysis of the suitable habitats, national park boundaries, and connectivity graph.

3. Results

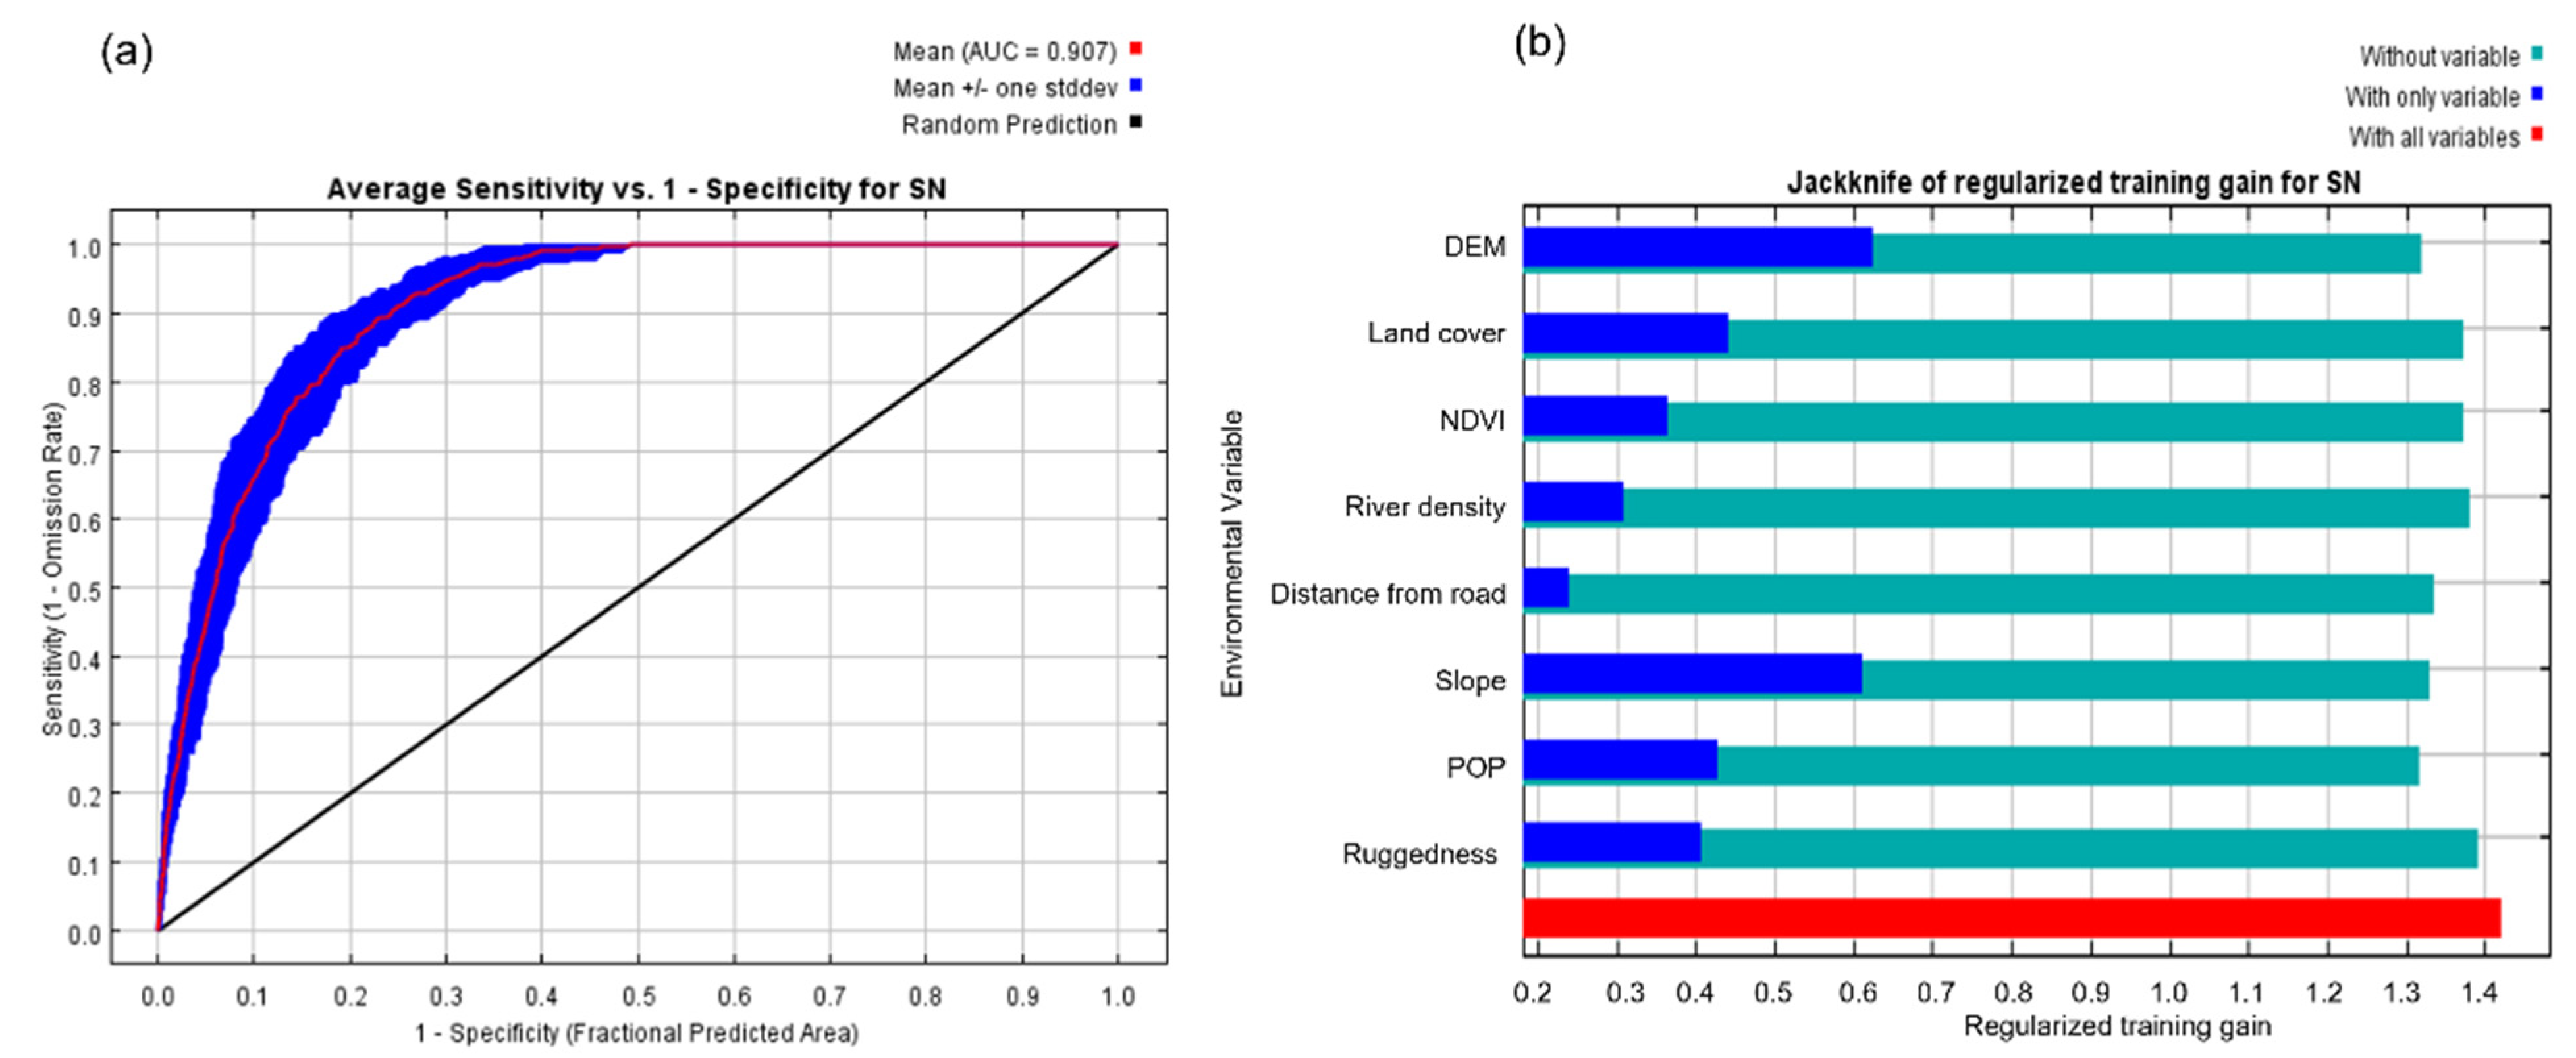
3.1. Habitat Suitability Model

With an average training AUC value of 0.930 (±0.0013) and average testing AUC value of 0.907 (±0.018, Figure 2a), the MaxEnt model for snow leopard produced satisfactory results. According to the jackknife test results (Figure 2b) and the permutation importance, DEM (26.8%) contributed the most to the model, followed by slope (25.3%), POP (12.7%), river density (10.1%), distance from road (8.3%), NDVI (8.1%), land cover (4.8%), and ruggedness (3.9%). The average threshold value of 0.2288 was used to define suitable habitat. The suitable habitat of snow leopard was found between 3500 and 4100 m above sea level with terrain slope greater than 13° (Figure S2). Snow leopards preferred areas with high elevations and low population densities that are far from major roads.

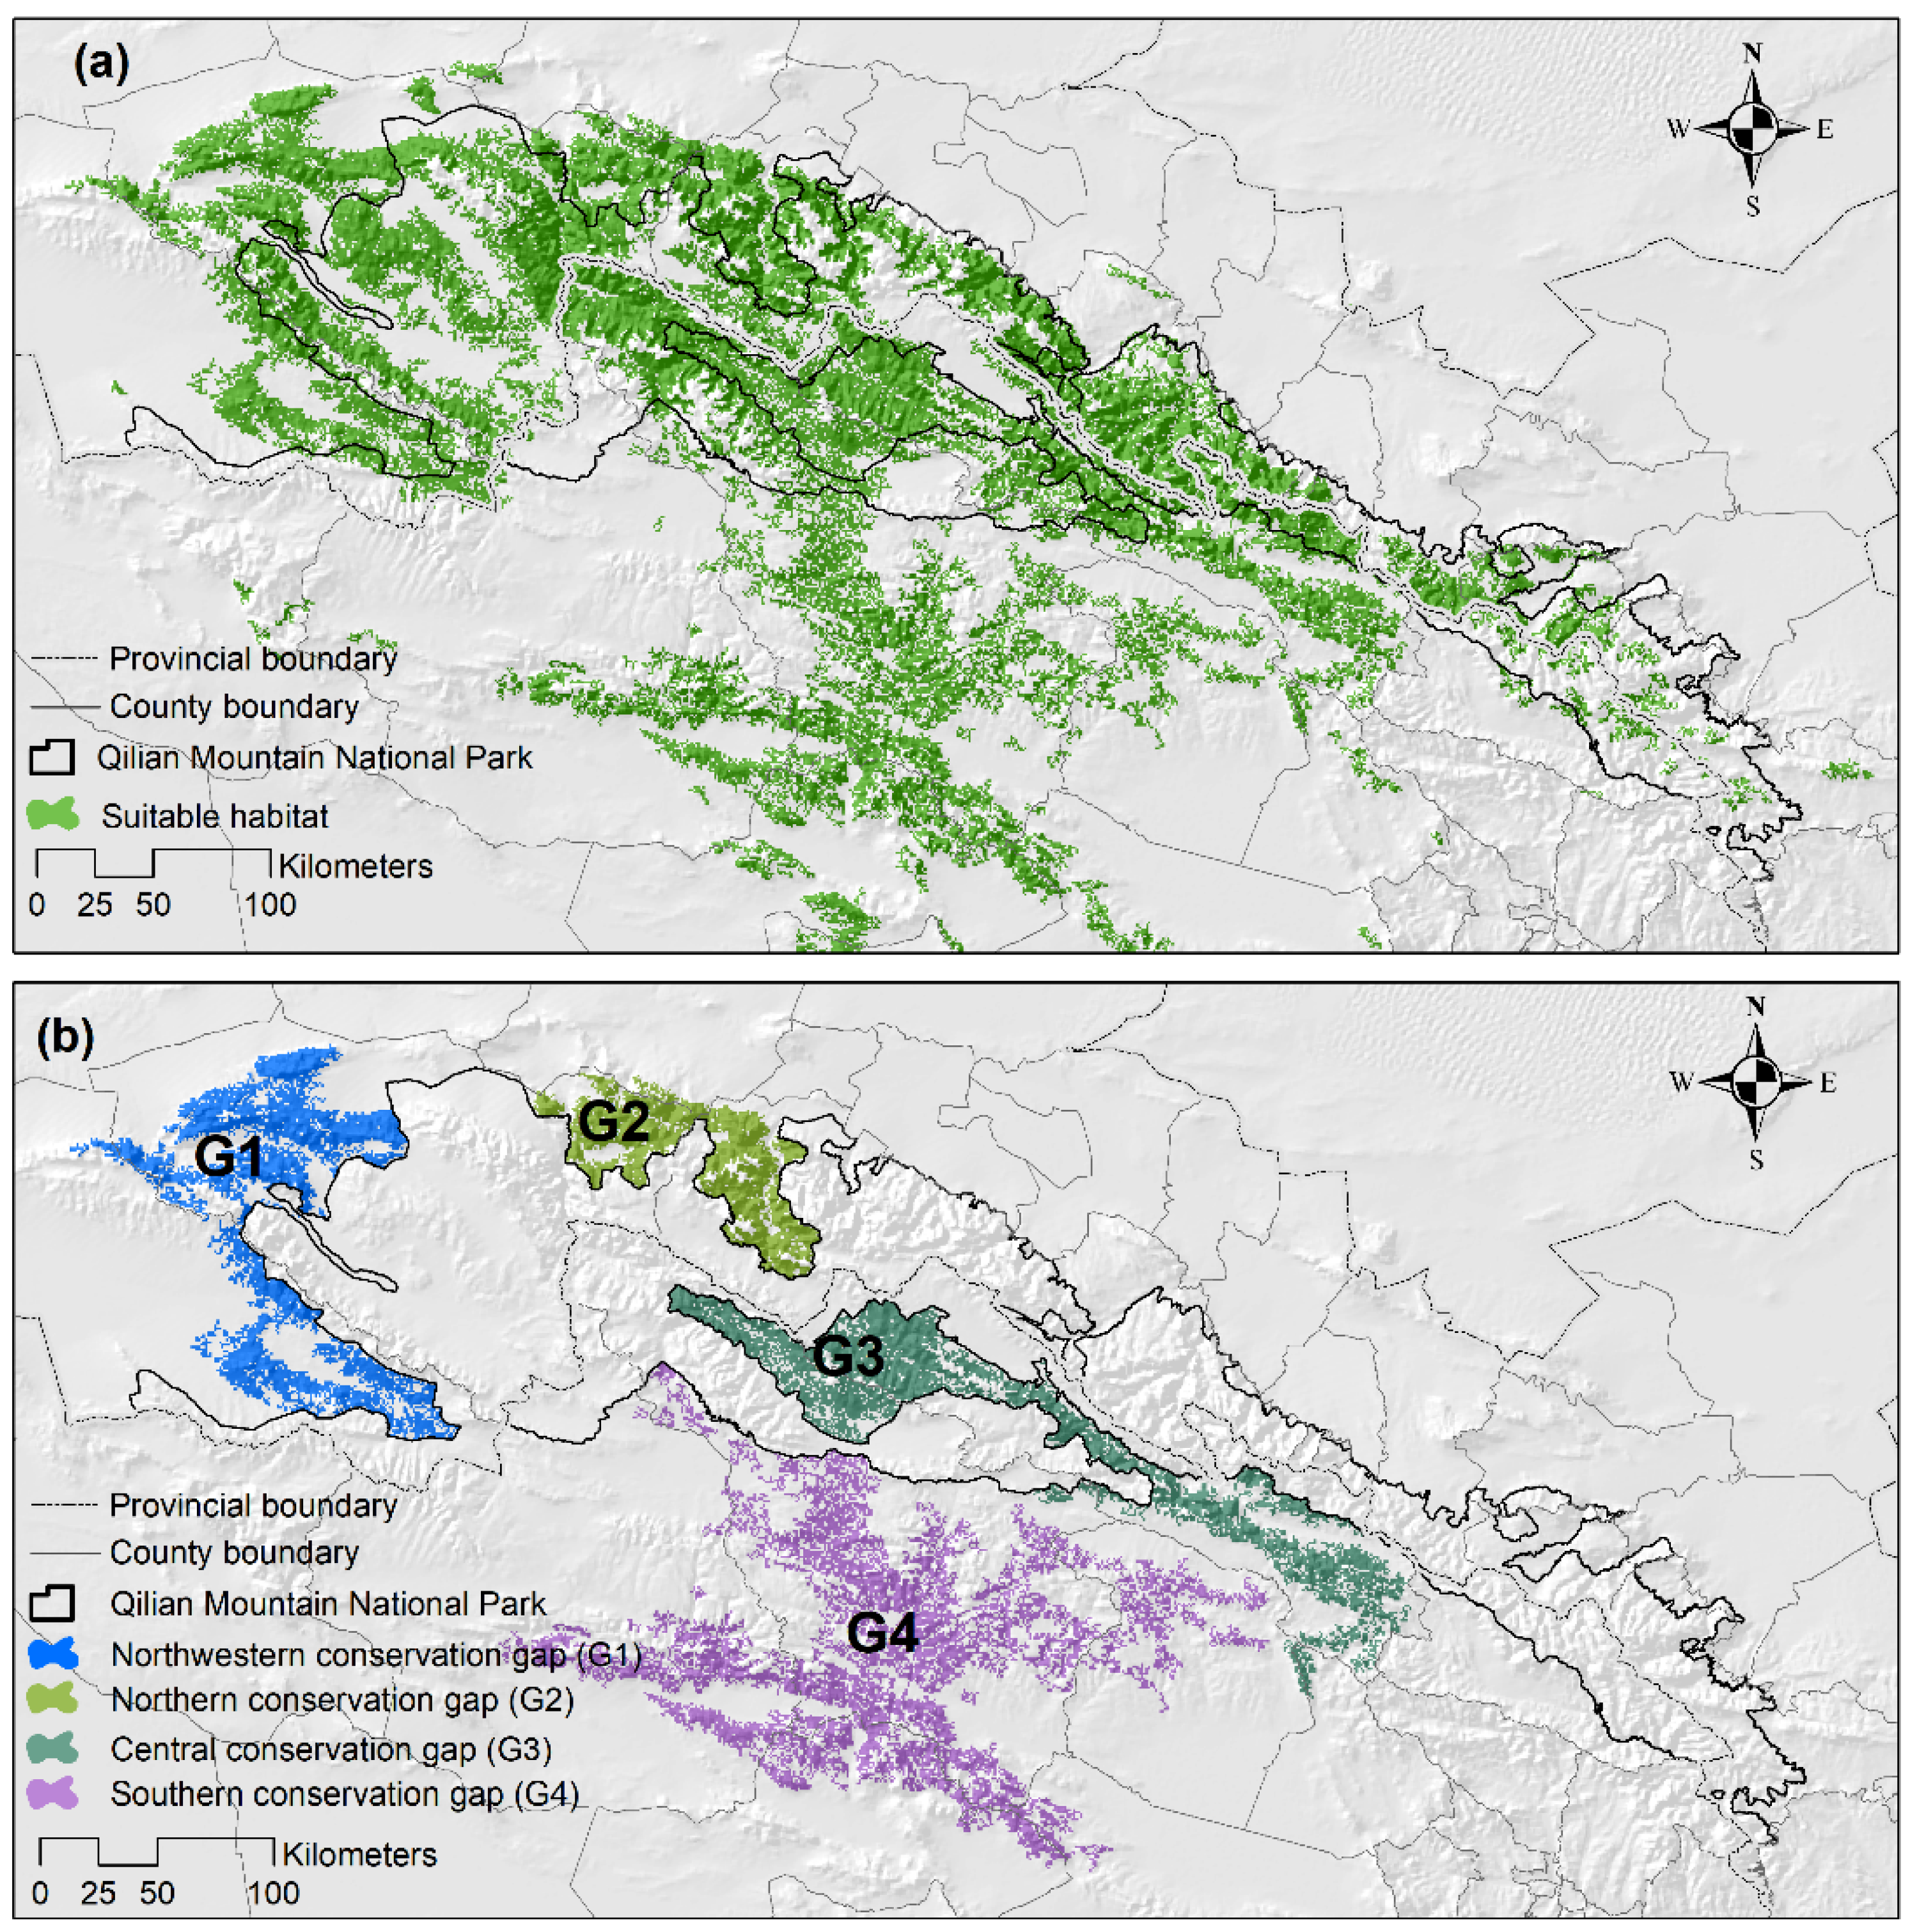
3.2. Potential Suitable Habitat

The region had 51,137 square kilometers of potentially suitable habitat (TA, Figure 3a), representing 16% of the study area, with measures of high habitat suitability index concentrated mostly in the western Qilian Mountains (Figure S3). The potentially suitable habitats could be divided into midwestern and eastern regions. The midwestern habitats were continuous large patches, with the five largest patches totaling 38,120 square kilometers (accounting for 74.54% of TA). Subei, Sunan, Tianjun, and Qilian County were the counties with the most suitable habitat patches. In contrast to the midwestern habitats, the eastern habitat patches were small and fragmented. The Qilian Mountain National Park has a total of 22,640 square kilometers of suitable habitat (accounting for 44.27% of TA).

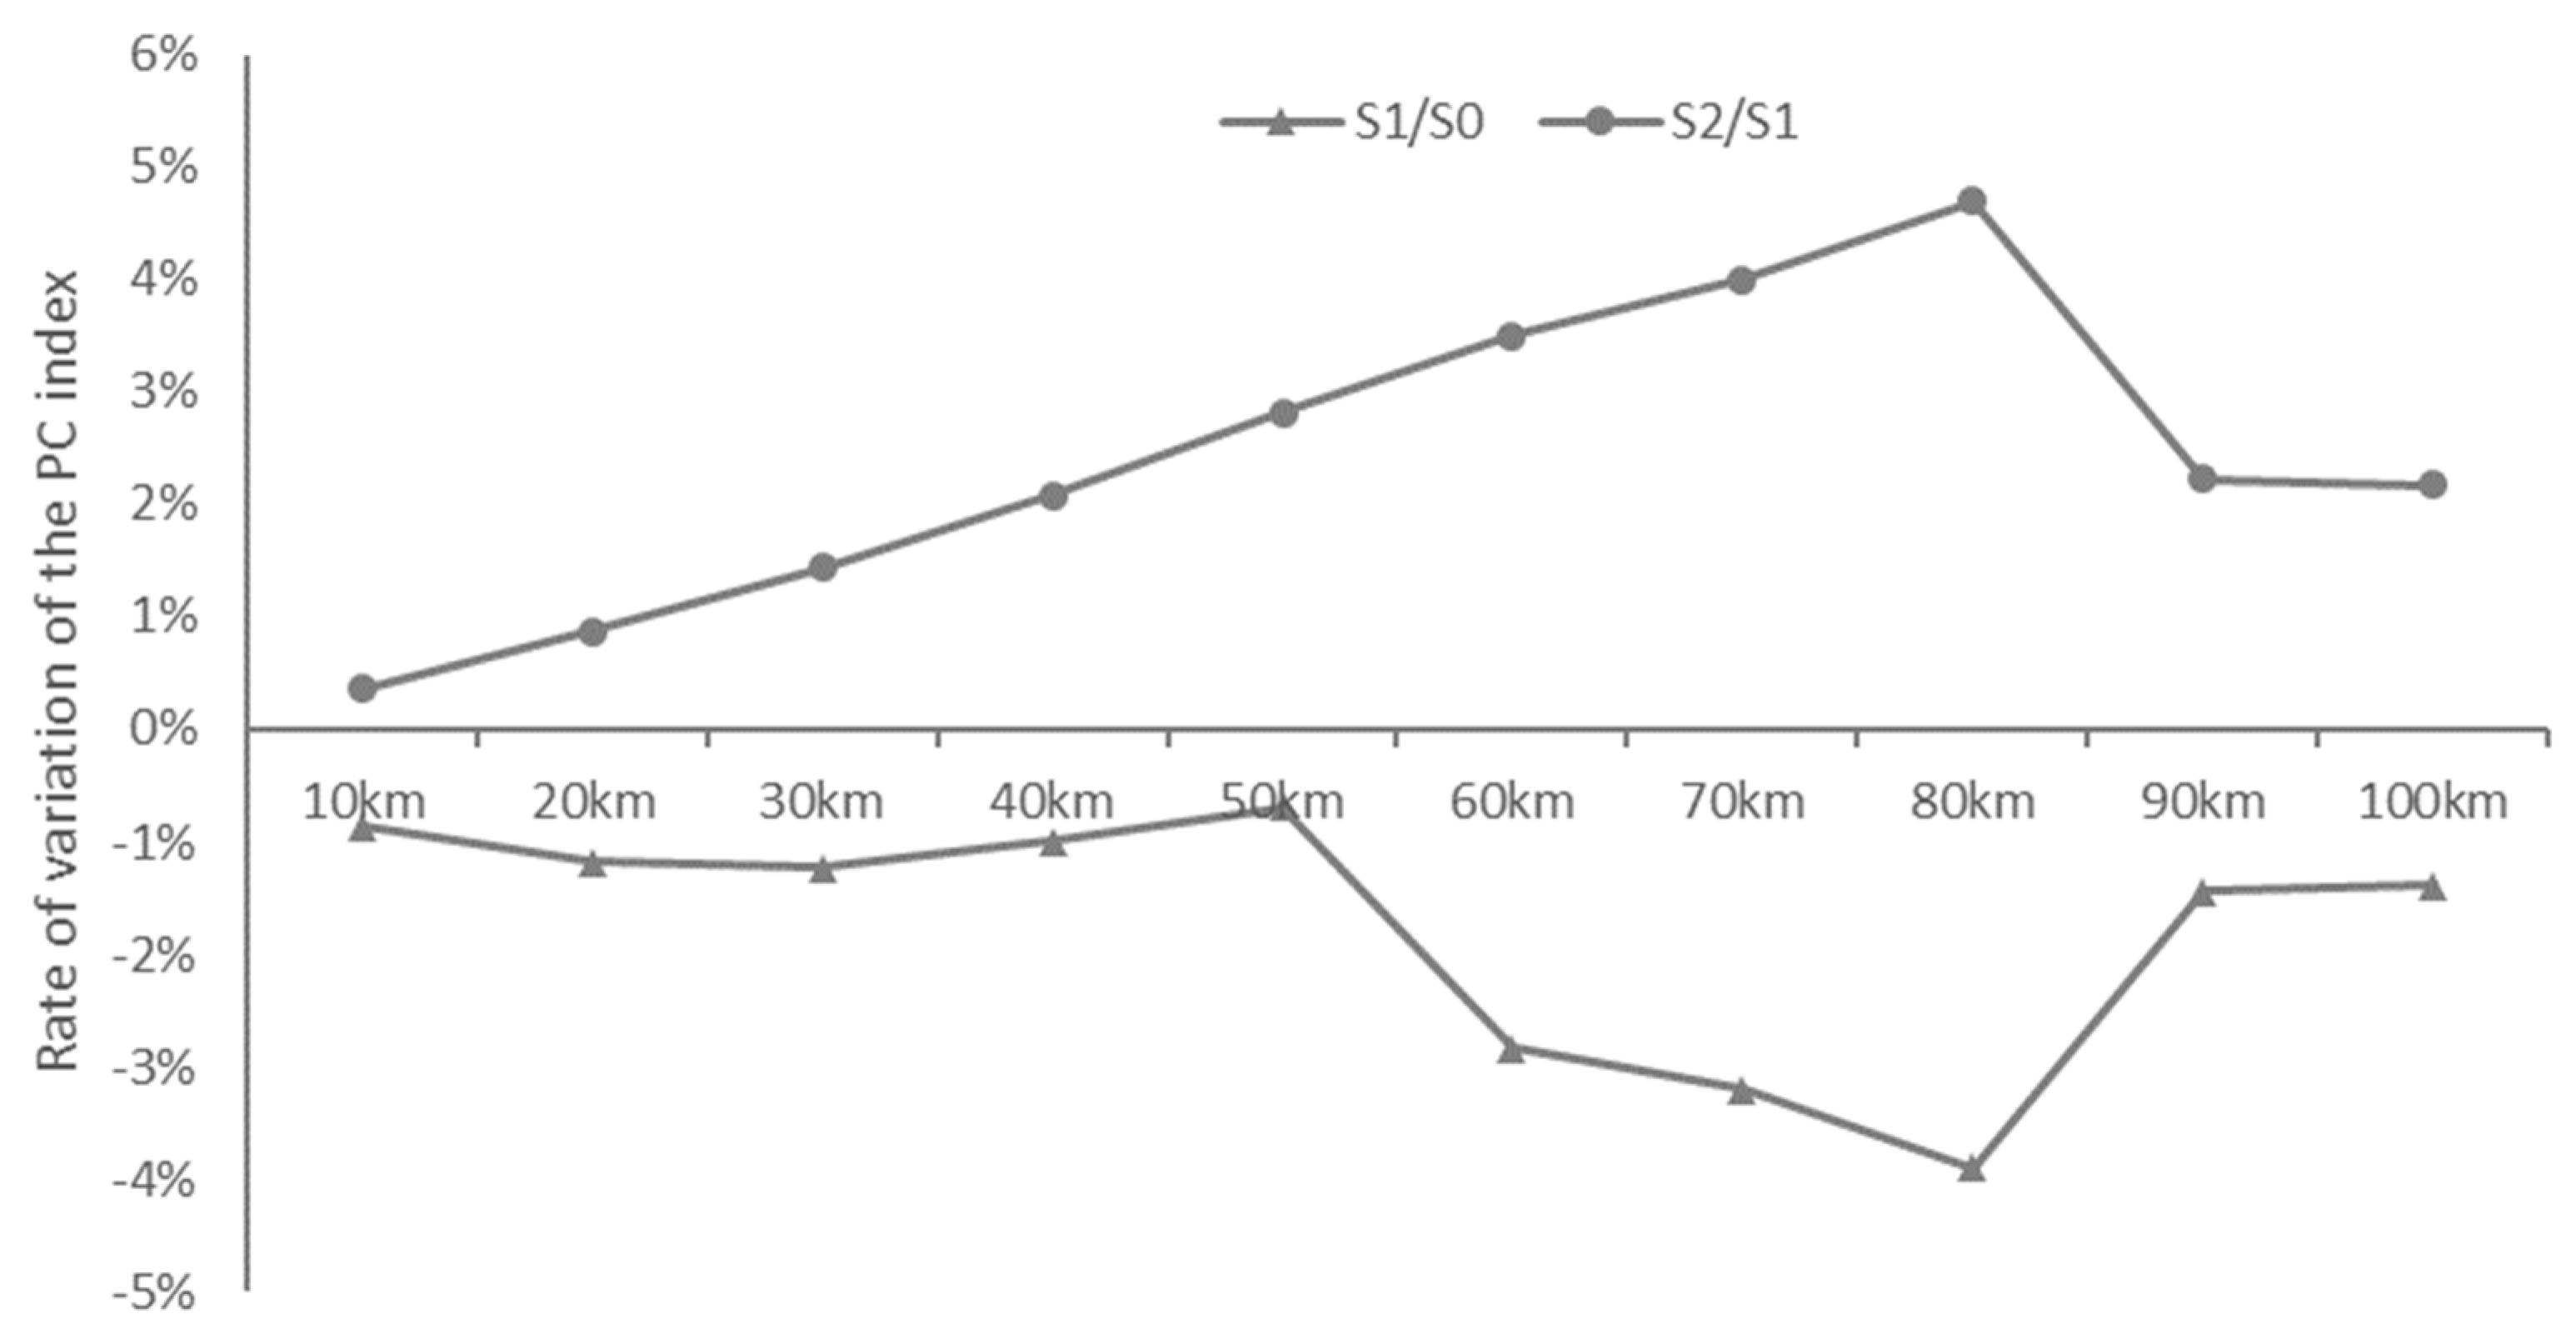
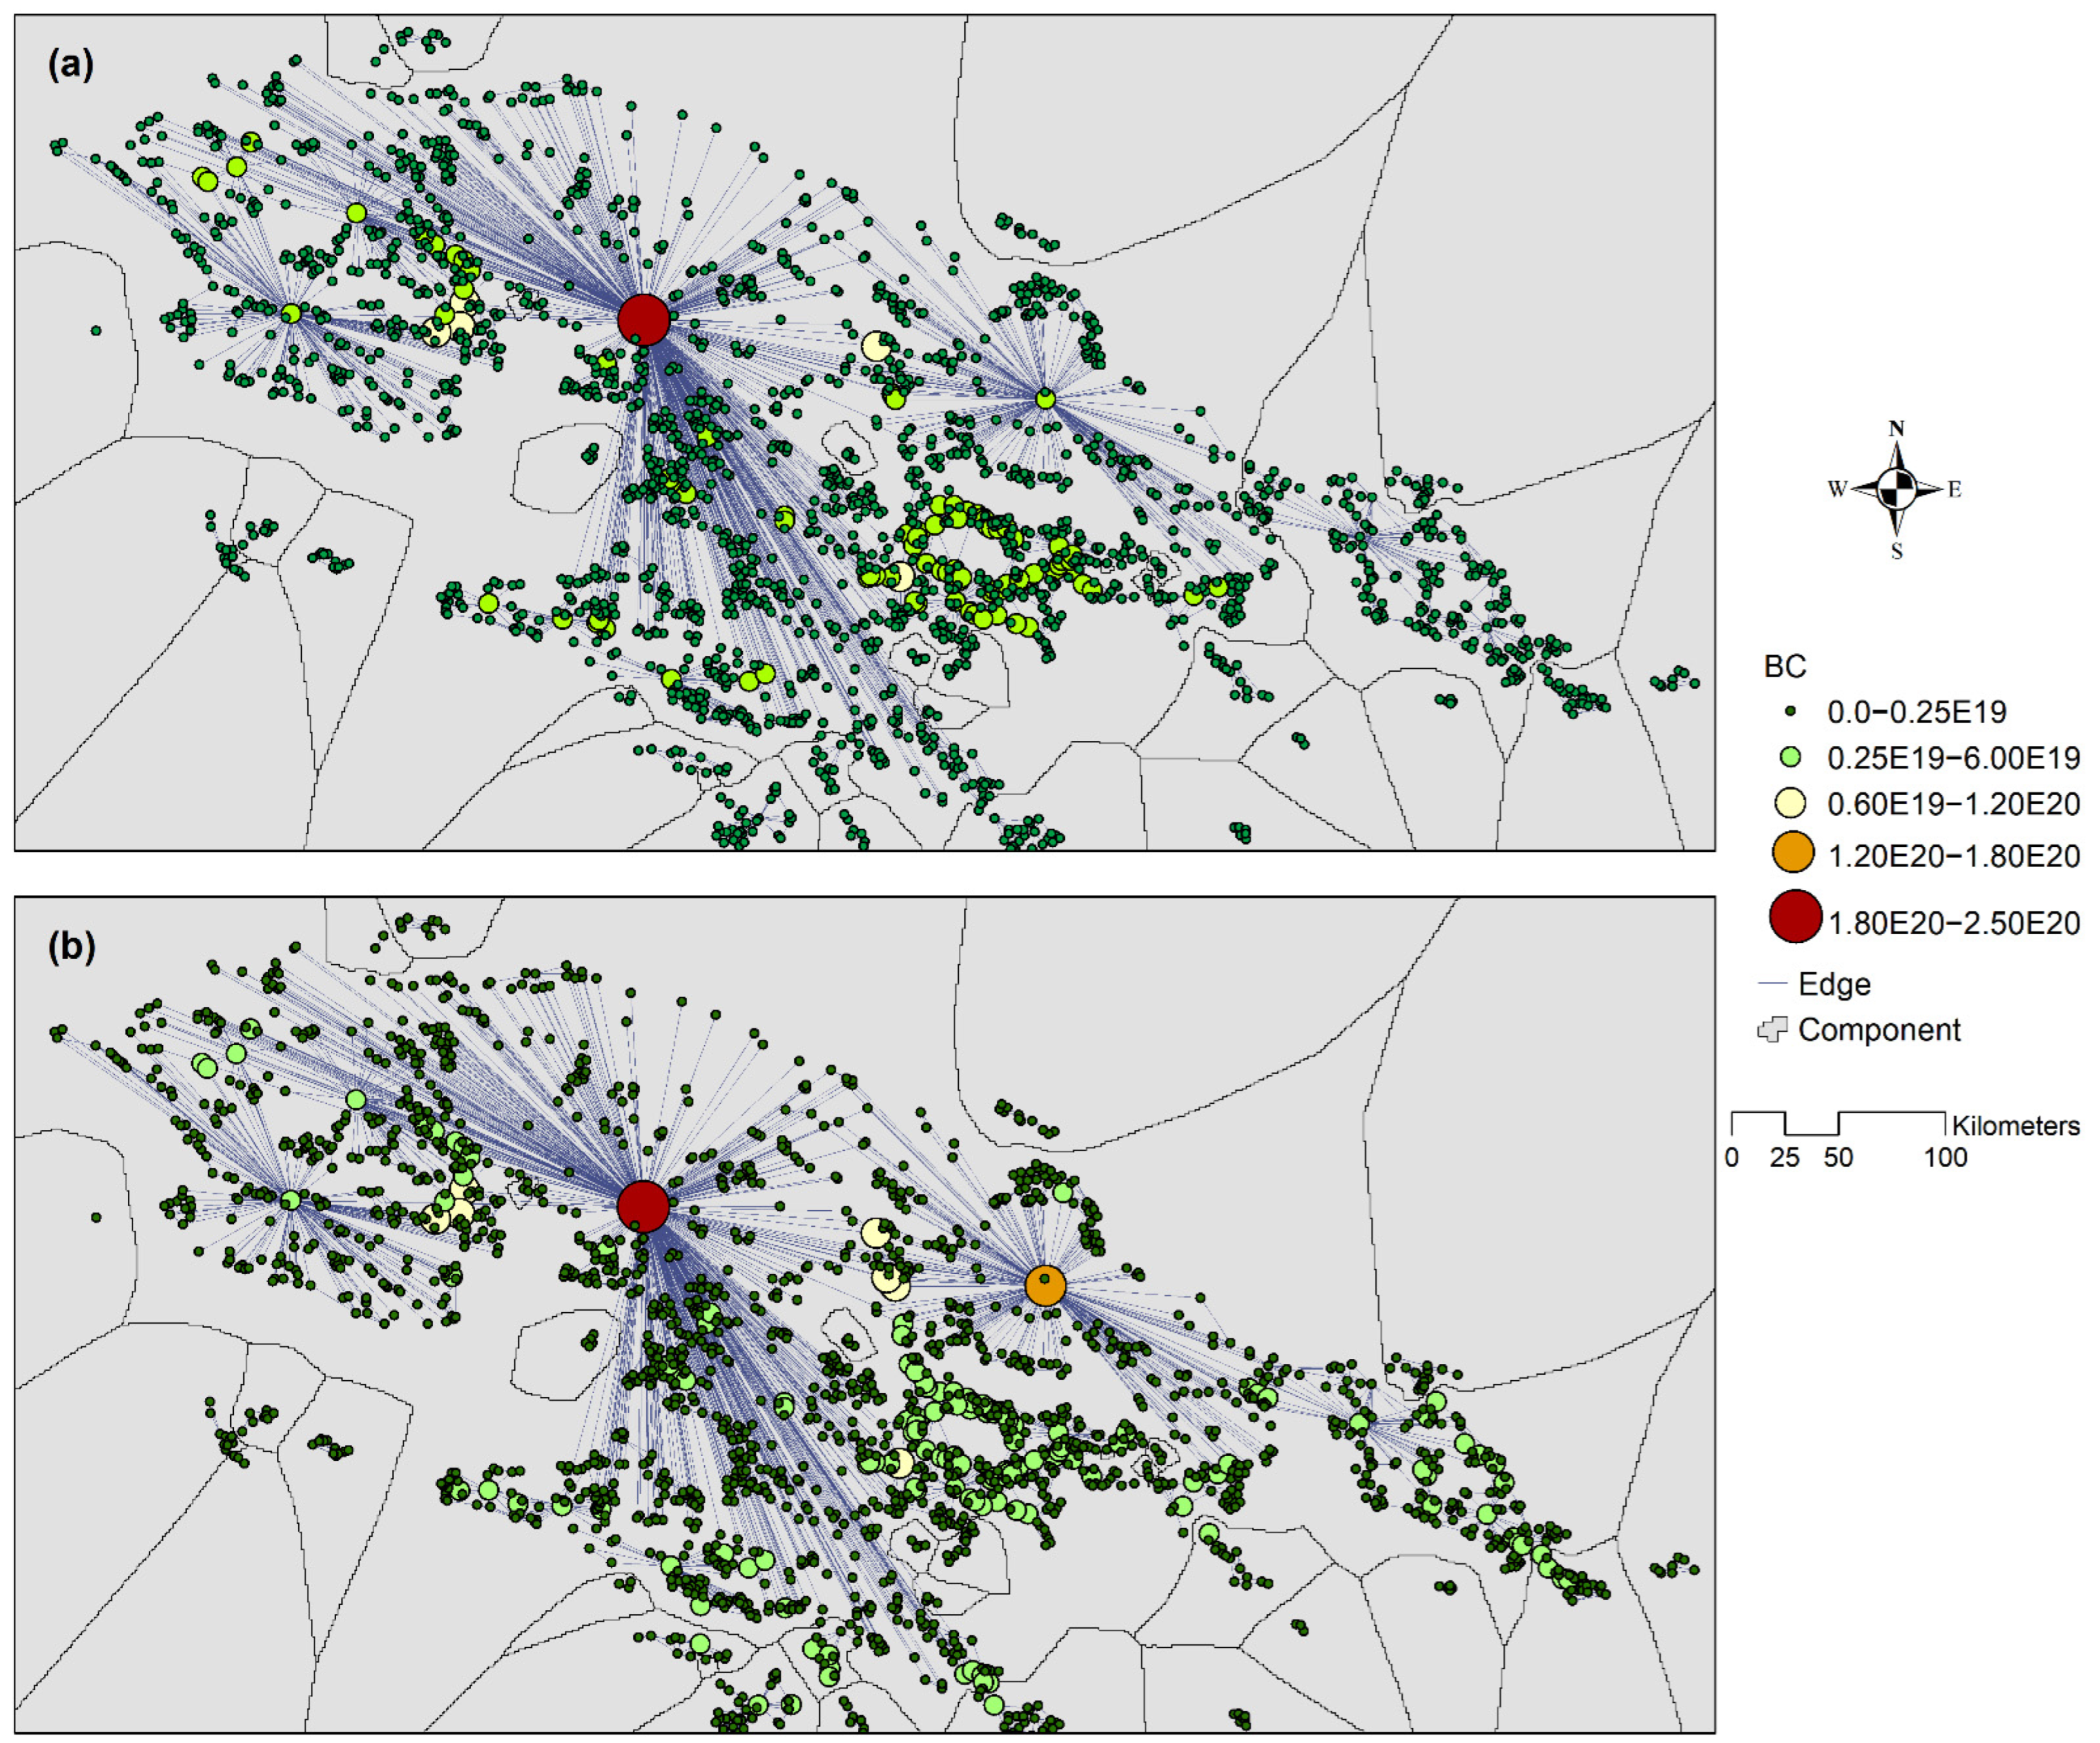
3.3. Landscape Connectivity

We discovered that snow leopard habitat was mostly isolated from the G227 National Road and the Lanzhou-Wulumuqi High-Speed Railway by superimposing highways and railroads and suitable habitats, and therefore simulated the corridor construction for the routes (S2, Figure S4). A graph was constructed for each scenario (S0 to S2). Then, the PC value was calculated at various distances. As shown in Figure 4, the PC index between the initial state (S0) and the highway and railway state (S1) indicated that highways and railways slightly decreased overall connectivity (Figure 4), with the PC index rate of variation ranging from −0.86% for a distance of 10 km to −3.90% for a distance of 80 km. The mitigation scenario (S2) promoted the connectivity of highway and railway state (S1) with a slight increase with distance (up to +4.69% for 80 km) and subsequently returned to +2.17% for 100 km.
The findings revealed that highways and railways resulted in a −1.22% decrease in connectivity over a distance of 30 km, which was thought to be indicative of the travel distance on consecutive days for snow leopard (Figure 4). When compared to the highway and railway state (S1), the corridor development (S2) might enhance regional connectivity by +1.44%. Furthermore, corridor development strengthens the capacity of those central patches to act as stepping stones and improve connections between western and eastern habitat patches (Figure 5).

3.4. Conservation Gap

Four conservation gaps (Figure 3b) were identified in the national park’s northwest (G1), north (G2), center (G3), and south regions (G4). These places are generally unprotected, leaving considerable gaps in the current conservation extent. The Qilian Mountain National Park should be expanded to meet these conservation gaps and protect snow leopard habitat integrity.

4. Discussion

This paper presents an integrated approach for identifying suitable habitat and assessing the influence of highways and railways, as well as their potential corridor construction, on the connectivity for the snow leopard in the Qilian Mountain area. This study may contribute to advancements in environmental impact assessments and conservation plans for the species.
We revealed that 16% of the study area could serve as potential snow leopard habitat (Figure 3a). The Qilian Mountain National Nature Reserve in Gansu Province was the first protected area established in Qilian Mountain area in 1988. Then, in 2005 and 2006, the Qilian Mountain Provincial Nature Reserve in Qinghai Province and Yanchiwan National Nature Reserve in Gansu Province were founded. These three nature reserves have been integrated into Qilian Mountain National Park, which has 22,640 square kilometers of potentially suitable habitat (accounting for 44.27% of total suitable habitat). Although certain protection gaps remain, a more continuous national park extent has been established than previously. The larger snow leopard habitat patches that were continuously distributed in the midwestern region of the study area were primarily concentrated in Subei, Sunan, Tianjun, and Qilian County, whereas the patches distributed in Menyuan and Tianzhu County consisted of predominantly small, fragmented patches. This is likely because Menyuan and Tianzhu County have a larger population than counties in the central and western regions. Along with grazing, agricultural areas are found in the region’s lower elevations. For generations, the traditional means of production in the area consisted of grazing sheep and yak in high-altitude pastures.
Climate conditions, topography (elevation, slope, and roughness), prey species, and land cover were all cited as factors affecting snow leopard habitat selection in previous studies. Researchers in Mongolia found that the distribution of prey and rough terrain had a substantial impact on how snow leopards used their habitat [38]. In India, research in highly grazed regions revealed that snow leopard habitat usage was mostly determined by the density of wild prey species [49]. An analysis of snow leopard habitat in the Sanjiangyuan National Nature Reserve found that the two most important factors impacting habitat selection were annual average temperature and roughness [50]. For the Qomolangma National Nature Reserve, the five most important variables impacting snow leopard habitat suitability were the precipitation in the driest quarter, ruggedness, elevation, maximum temperature of the warmest month, and annual mean temperature [51]. A few studies have mentioned human interference as the main factor affecting snow leopard habitat selection. Wolf and Ale [52] found that terrain and human activity had the greatest impact on snow leopard spatial distribution in Nepal’s Sagarmatha National Park, whereas prey resources had a minor impact. Our research revealed that elevation, slope, and human activity (population density) were the three most important variables affecting snow leopard habitat suitability in the Qilian Mountains. To improve forecasting of the snow leopard’s habitat area, the impact of human interference on snow leopard habitat selection at regional scales must be investigated further. Additionally, we may conclude that the variables influencing snow leopard habitat selection may differ in location, emphasizing the need for conducting local evaluations of snow leopard habitat selection to tailor conservation actions.
Impact assessments of highway and railway infrastructure were carried out at the regional level for global connectivity and at the local level for each patch. Highway and railways slightly reduced overall connectivity (−1.22%) for a distance of 30 km, which is representative of the travel distance on consecutive days for snow leopard. This minimal difference is likely because snow leopard habitat is relatively complete and continuous, with the exception of separation caused by the G227 National Road and the Lanzhou-Wulumuqi High-Speed Railway. Enhanced connectivity (+1.44%) may be achieved by corridor restoration initiatives. Additionally, development strengthens the potential of central habitat patches to serve as stepping stones and improves overall connectivity between western and eastern habitat patches (Figure 5).
Clearly, this connectivity approach has limits, and cautions should be addressed. The differences in connectivity between the three scenarios underline the need of enhancing our understanding of movement ability and further emphasizes the need of evaluating a variety of possible distances in the face of uncertainty [53]. Modeling the correlation between movement patterns and landscape characteristics and modeling of multivariate optimization based on gene flow [54] should be taken into account for improving the resistance model using empirical data in future research [55]. Additionally, future research should strive to improve ecological knowledge of how landscape conditions impact the occurrence and dispersal of snow leopard. Hence, it is necessary to develop and conduct targeted research efforts on the effects of large roads on the gene flow of populations [21].
We provide some recommendations for snow leopard protection in the Qilian Mountain National Park based on our study findings. While protected areas (PAs) can safeguard carnivore populations by buffering them from anthropogenic influences, they are useless for long-term conservation of wide-ranging carnivores because they require large territories [2]. The four conservation gaps identified (Figure 3) should be fully considered for inclusion in the management of the Qilian Mountain National Park in order to prevent the degradation and fragmentation of suitable snow leopard habitat in the absence of protection. It is suggested that human activities in conservation gap areas be monitored more closely. Additionally, corridors should be established to mitigate the effect of the G227 National Road and Lanzhou-Wulumuqi High-Speed Railway on the dispersal of snow leopards between habitats. The national park administrators must incorporate multi-species dispersal characteristics into corridor conservation action planning. Thirdly, preservation efforts should concentrate on establishing interprovincial cooperation mechanisms to guarantee that protection aims are met and that protective methods are consistent. While our presentation focuses on a single species, it might be applied to other habitats or multi-species investigations.

5. Conclusions

The distribution and extent of snow leopard habitat in the Qilian Mountains were investigated in this study. The area of potentially suitable habitat was primarily found in the midwestern and eastern regions of the study area. Habitats in the midwestern region present continuously large patches, while habitats in the eastern region showed small, fragmented patches. Snow leopard conservation continues to face substantial protection gaps. Additionally, this study emphasized the need for assessments on the influence of highways and railways, as well as their corridor development, on the connectivity for the species. Our analysis offers a method to investigate protection gaps while taking potential dispersal ability into account and proposing targeted planning based on species characteristics.

Supplementary Materials

The following supporting information can be downloaded at: https://www.mdpi.com/article/10.3390/su14031638/s1, Figure S1: The land cover and highways and railways distribution in the study area, Figure S2: Response curve of selected variables for snow leopard habitat suitability modelling, Figure S3: Habitat suitability modeled from MaxEnt for snow leopard, Figure S4: The resistance surface for three connectivity scenarios, Table S1: The source of environmental variables, Table S2: Pearson’s correlation of environmental variables.

Author Contributions

Conceptualization, D.L. and Y.L.; methodology, Y.Z. (Yu Zhang 1) and Y.X.; software, Y.Z. (Yu Zhang 1); formal analysis, Y.L.; resources, Y.Z. (Yu Zhang 3) and Y.G.; writing—original draft preparation, Y.L.; writing—review and editing, Y.Z. (Yuguang Zhang); supervision, D.L. All authors have read and agreed to the published version of the manuscript.

Funding

This research was funded by Welfare Project of the National Scientific Research Institution (No. CAFYBB2019ZE003 and CAFYBB2018ZD001) and the National Natural Science Foundation of China (Grant No. 32101409).

Institutional Review Board Statement

Not applicable.

Informed Consent Statement

Not applicable.

Data Availability Statement

Geographic coordinates of snow leopard individuals cannot currently be made available due to restrictions and directives from the competent authorities of the Popular Republic of China. Specific requirements can be addressed directly to the corresponding author. Data sharing is not applicable to this article.

Acknowledgments

The authors would like to thank Charlotte Hacker for assistance in editing this paper.

Conflicts of Interest

The authors declare no conflict of interest.

References

  1. Crooks, K.R. Relative Sensitivities of Mammalian Carnivores to Habitat Fragmentation. Conserv. Biol. 2002, 16, 488–502. [Google Scholar] [CrossRef]
  2. Pal, R.; Sutherland, C.; Qureshi, Q.; Sathyakumar, S. Landscape Connectivity and Population Density of Snow Leopards across a Multi-use Landscape in Western Himalaya. Anim. Conserv. 2021. [Google Scholar] [CrossRef]
  3. Snow Leopard Network. Snow Leopard Survival Strategy; Revised 2014 Version; Snow Leopard Network: Seattle, WA, USA, 2014; p. 145. [Google Scholar]
  4. Li, J.; McCarthy, T.M.; Wang, H.; Weckworth, B.V.; Schaller, G.B.; Mishra, C.; Lu, Z.; Beissinger, S.R. Climate Refugia of Snow Leopards in High Asia. Biol. Conserv. 2016, 203, 188–196. [Google Scholar] [CrossRef]
  5. Global Snow Leopard & Ecosystem Protection Program. Available online: https://globalsnowleopard.org/the-snow-leopard/cat-facts/ (accessed on 3 January 2022).
  6. McCarthy, T.; Mallon, D.; Jackson, R.; Zahler, P.; McCarthy, K. Panthera uncia. In The IUCN Red List of Threatened Species; International Union for Conservation of Nature: Gland, Switzerland, 2017; p. e.T22732A50664030. [Google Scholar] [CrossRef]
  7. Aryal, A. Poaching: Is Snow Leopard Tally Underestimated? Nature 2017, 550, 457. [Google Scholar] [CrossRef] [PubMed] [Green Version]
  8. Mallon, D.P.; Jackson, R.M. A Downlist Is Not a Demotion: Red List Status and Reality. Oryx 2017, 51, 605–609. [Google Scholar] [CrossRef] [Green Version]
  9. Alexander, J.S.; Gopalaswamy, A.M.; Shi, K.; Riordan, P. Face Value: Towards Robust Estimates of Snow Leopard Densities. PLoS ONE 2015, 10, e0134815. [Google Scholar] [CrossRef] [Green Version]
  10. Grönberg, E. Movement Patterns of Snow Leopard (Panthera uncia) around Kills Based on GPS Location Clusters. Bachelor’s Thesis, Swedish University of Agricultural Sciences, Uppsala, Sweden, 2011. [Google Scholar]
  11. Johansson, Ö.; Rauset, G.R.; Samelius, G.; McCarthy, T.; Andrén, H.; Tumursukh, L.; Mishra, C. Land Sharing Is Essential for Snow Leopard Conservation. Biol. Conserv. 2016, 203, 1–7. [Google Scholar] [CrossRef]
  12. Janecka, J.E.; Zhang, Y.; Li, D.; Munkhtsog, B.; Bayaraa, M.; Galsandorj, N.; Wangchuk, T.R.; Karmacharya, D.; Li, J.; Lu, Z.; et al. Range-Wide Snow Leopard Phylogeography Supports Three Subspecies. J. Hered. 2017, 108, 597–607. [Google Scholar] [CrossRef]
  13. Ale, S.B.; Brown, J.S. Prey Behavior Leads to Predator: A Case Study of the Himalayan Tahr and the Snow Leopard in Sagarmatha (Mt. Everest) National Park, Nepal. Isr. J. Ecol. Evol. 2009, 55, 315–327. [Google Scholar] [CrossRef] [Green Version]
  14. Wang, J.; Laguardia, A.; Damerell, P.J.; Riordan, P.; Shi, K. Dietary Overlap of Snow Leopard and Other Carnivores in the Pamirs of Northwestern China. Chin. Sci. Bull. 2014, 59, 3162–3168. [Google Scholar] [CrossRef]
  15. Aryal, A.; Brunton, D.; Raubenheimer, D. Impact of Climate Change on Human-Wildlife-Ecosystem Interactions in the Trans-Himalaya Region of Nepal. Theor. Appl. Climatol. 2014, 115, 517–529. [Google Scholar] [CrossRef]
  16. Maheshwari, A.; Niraj, S.K. Monitoring Illegal Trade in Snow Leopards: 2003–2014. Glob. Ecol. Conserv. 2018, 14, e00387. [Google Scholar] [CrossRef]
  17. Aryal, A.; Brunton, D.; Ji, W.; Barraclough, R.K.; Raubenheimer, D. Human–Carnivore Conflict: Ecological and Economical Sustainability of Predation on Livestock by Snow Leopard and Other Carnivores in the Himalaya. Sustain. Sci. 2014, 9, 321–329. [Google Scholar] [CrossRef]
  18. Hacker, C.E.; Dai, Y.; Cheng, Y.; Zhang, Y.; Zhang, Y.; Miller, L.J.; Janecka, J.E. Determinants of Herder Attitudes towards the Vulnerable Snow Leopard Panthera uncia in Yushu Prefecture, China. Oryx 2021, 55, 783–790. [Google Scholar] [CrossRef]
  19. Li, J.; Weckworth, B.V.; McCarthy, T.M.; Liang, X.; Liu, Y.; Xing, R.; Li, D.; Zhang, Y.; Xue, Y.; Jackson, R.; et al. Defining Priorities for Global Snow Leopard Conservation Landscapes. Biol. Conserv. 2020, 241, 108387. [Google Scholar] [CrossRef]
  20. Riordan, P.; Cushman, S.A.; Mallon, D.; Shi, K.; Hughes, J. Predicting Global Population Connectivity and Targeting Conservation Action for Snow Leopard across Its Range. Ecography 2016, 39, 419–426. [Google Scholar] [CrossRef]
  21. Xiao, L.; Cheng, C.; Wan, H.; Zhang, D.; Wang, Y. Defining Conservation Priority Areas of Snow Leopard Habitat in the Sanjiangyuan Region. Biodivers. Sci. 2019, 27, 943. [Google Scholar] [CrossRef]
  22. Liu, Y.; Li, X.; Liang, X.; Liu, Y.; Cheng, C.; Li, J.; Tang, P.; Qi, H.; Bian, X.; He, B.; et al. Where and How Many? The Status of Snow Leopard (Panthera uncia) Density Surveys and Knowledge Gaps in China. Biodivers. Sci. 2019, 27, 919. [Google Scholar] [CrossRef]
  23. Alexander, J.; Chen, P.; Damerell, P.; Youkui, W.; Hughes, J.; Shi, K.; Riordan, P. Human Wildlife Conflict Involving Large Carnivores in Qilianshan, China and the Minimal Paw-Print of Snow Leopards. Biol. Conserv. 2015, 187, 1–9. [Google Scholar] [CrossRef]
  24. Alexander, J.S.; Shi, K.; Tallents, L.A.; Riordan, P. On the High Trail: Examining Determinants of Site Use by the Endangered Snow Leopard Panthera uncia in Qilianshan, China. Oryx 2016, 50, 231–238. [Google Scholar] [CrossRef] [Green Version]
  25. Atzeni, L.; Cushman, S.A.; Bai, D.; Wang, J.; Chen, P.; Shi, K.; Riordan, P. Meta-replication, Sampling Bias, and Multi-scale Model Selection: A Case Study on Snow Leopard (Panthera uncia) in Western China. Ecol. Evol. 2020, 10, 7686–7712. [Google Scholar] [CrossRef] [PubMed]
  26. Atzeni, L.; Cushman, S.A.; Wang, J.; Riordan, P.; Shi, K.; Bauman, D. Evidence of Spatial Genetic Structure in a Snow Leopard Population from Gansu, China. Heredity 2021, 127, 522–534. [Google Scholar] [CrossRef] [PubMed]
  27. Huang, Z.; Huang, A.; Dawson, T.P.; Cong, L. The Effects of the Spatial Extent on Modelling Giant Panda Distributions Using Ecological Niche Models. Sustainability 2021, 13, 11707. [Google Scholar] [CrossRef]
  28. Mays, H.L.; Hung, C.-M.; Shaner, P.-J.; Denvir, J.; Justice, M.; Yang, S.-F.; Roth, T.L.; Oehler, D.A.; Fan, J.; Rekulapally, S.; et al. Genomic Analysis of Demographic History and Ecological Niche Modeling in the Endangered Sumatran Rhinoceros Dicerorhinus Sumatrensis. Curr. Biol. 2018, 28, 70–76.e4. [Google Scholar] [CrossRef] [PubMed] [Green Version]
  29. Wauchope, H.S.; Shaw, J.D.; Varpe, Ø.; Lappo, E.G.; Boertmann, D.; Lanctot, R.B.; Fuller, R.A. Rapid Climate-Driven Loss of Breeding Habitat for Arctic Migratory Birds. Glob. Change Biol. 2017, 23, 1085–1094. [Google Scholar] [CrossRef] [PubMed]
  30. Jiang, F.; Zhang, J.; Gao, H.; Cai, Z.; Zhou, X.; Li, S.; Zhang, T. Musk Deer (Moschus Spp.) Face Redistribution to Higher Elevations and Latitudes under Climate Change in China. Sci. Total Environ. 2020, 704, 135335. [Google Scholar] [CrossRef] [PubMed]
  31. Zhang, Y.; Clauzel, C.; Li, J.; Xue, Y.; Zhang, Y.; Wu, G.; Giraudoux, P.; Li, L.; Li, D. Identifying Refugia and Corridors under Climate Change Conditions for the Sichuan Snub-Nosed Monkey (Rhinopithecus Roxellana) in Hubei Province, China. Ecol. Evol. 2019, 9, 1680–1690. [Google Scholar] [CrossRef] [PubMed] [Green Version]
  32. Clauzel, C.; Xiqing, D.; Gongsheng, W.; Giraudoux, P.; Li, L. Assessing the Impact of Road Developments on Connectivity across Multiple Scales: Application to Yunnan Snub-Nosed Monkey Conservation. Biol. Conserv. 2015, 192, 207–217. [Google Scholar] [CrossRef]
  33. Foltête, J.-C.; Clauzel, C.; Vuidel, G. A Software Tool Dedicated to the Modelling of Landscape Networks. Environ. Model. Softw. 2012, 38, 316–327. [Google Scholar] [CrossRef]
  34. Ernst, B.W. Quantifying Connectivity Using Graph Based Connectivity Response Curves in Complex Landscapes under Simulated Forest Management Scenarios. For. Ecol. Manag. 2014, 321, 94–104. [Google Scholar] [CrossRef]
  35. Foltête, J.-C.; Girardet, X.; Clauzel, C. A Methodological Framework for the Use of Landscape Graphs in Land-Use Planning. Landsc. Urban Plan. 2014, 124, 140–150. [Google Scholar] [CrossRef]
  36. Chen, J.; Tang, X. Research on the Establishment of National Parks Protection System in China. J. Beijing For. Univ. Soc. Sci. 2020, 19, 1–11. [Google Scholar] [CrossRef]
  37. Yan, K.; Ding, Y. The Overview of the Progress of Qilian Mountain National Park System Pilot Area. Int. J. Geoherit. Parks 2020, 8, 210–214. [Google Scholar] [CrossRef]
  38. McCarthy, T.M.; Fuller, T.K.; Munkhtsog, B. Movements and Activities of Snow Leopards in Southwestern Mongolia. Biol. Conserv. 2005, 124, 527–537. [Google Scholar] [CrossRef]
  39. Brown, J.L.; Bennett, J.R.; French, C.M. SDMtoolbox 2.0: The next Generation Python-Based GIS Toolkit for Landscape Genetic, Biogeographic and Species Distribution Model Analyses. PeerJ 2017, 5, e4095. [Google Scholar] [CrossRef] [Green Version]
  40. Cord, A.F.; Klein, D.; Mora, F.; Dech, S. Comparing the Suitability of Classified Land Cover Data and Remote Sensing Variables for Modeling Distribution Patterns of Plants. Ecol. Model. 2014, 272, 129–140. [Google Scholar] [CrossRef]
  41. Elith, J.; Phillips, S.J.; Hastie, T.; Dudík, M.; Chee, Y.E.; Yates, C.J. A Statistical Explanation of MaxEnt for Ecologists. Divers. Distrib. 2011, 17, 43–57. [Google Scholar] [CrossRef]
  42. Li, J.; Xue, Y.; Hacker, C.E.; Zhang, Y.; Li, Y.; Cong, W.; Jin, L.; Li, G.; Wu, B.; Li, D.; et al. Projected Impacts of Climate Change on Snow Leopard Habitat in Qinghai Province, China. Ecol. Evol. 2021, 11, 17202–17218. [Google Scholar] [CrossRef]
  43. Phillips, S.J.; Anderson, R.P.; Schapire, R.E. Maximum Entropy Modeling of Species Geographic Distributions. Ecol. Model. 2006, 190, 231–259. [Google Scholar] [CrossRef] [Green Version]
  44. Searcy, C.A.; Shaffer, H.B. Do Ecological Niche Models Accurately Identify Climatic Determinants of Species Ranges? Am. Nat. 2016, 187, 423–435. [Google Scholar] [CrossRef] [Green Version]
  45. Phillips, S.J.; Dudík, M. Modeling of Species Distributions with Maxent: New Extensions and a Comprehensive Evaluation. Ecography 2008, 31, 161–175. [Google Scholar] [CrossRef]
  46. Songer, M.; Delion, M.; Biggs, A.; Huang, Q. Modeling Impacts of Climate Change on Giant Panda Habitat. Int. J. Ecol. 2012, 2012, e108752. [Google Scholar] [CrossRef]
  47. Saura, S.; Pascual-Hortal, L. A New Habitat Availability Index to Integrate Connectivity in Landscape Conservation Planning: Comparison with Existing Indices and Application to a Case Study. Landsc. Urban Plan. 2007, 83, 91–103. [Google Scholar] [CrossRef]
  48. Bodin, Ö.; Saura, S. Ranking Individual Habitat Patches as Connectivity Providers: Integrating Network Analysis and Patch Removal Experiments. Ecol. Model. 2010, 221, 2393–2405. [Google Scholar] [CrossRef]
  49. Sharma, R.K.; Bhatnagar, Y.V.; Mishra, C. Does Livestock Benefit or Harm Snow Leopards? Biol. Conserv. 2015, 190, 8–13. [Google Scholar] [CrossRef]
  50. Li, J.; Schaller, G.B.; McCarthy, T.M.; Wang, D.; Jiagong, Z.; Cai, P.; Basang, L.; Lu, Z. A Communal Sign Post of Snow Leopards (Panthera uncia) and Other Species on the Tibetan Plateau, China. Int. J. Biodivers. 2012, 2013, e370905. [Google Scholar] [CrossRef] [Green Version]
  51. Bai, D.-F.; Chen, P.-J.; Atzeni, L.; Cering, L.; Li, Q.; Shi, K. Assessment of Habitat Suitability of the Snow Leopard (Panthera uncia) in Qomolangma National Nature Reserve Based on MaxEnt Modeling. Zool. Res. 2018, 39, 373–386. [Google Scholar] [CrossRef]
  52. Wolf, M.; Ale, S. Signs at the Top: Habitat Features Influencing Snow Leopard Uncia Uncia Activity in Sagarmatha National Park, Nepal. J. Mammal. 2009, 90, 604–611. [Google Scholar] [CrossRef]
  53. Cushman, S.A.; Landguth, E.L.; Flather, C.H. Evaluating Population Connectivity for Species of Conservation Concern in the American Great Plains. Biodivers. Conserv. 2013, 22, 2583–2605. [Google Scholar] [CrossRef] [Green Version]
  54. Moraes, A.M.; Ruiz-Miranda, C.R.; Galetti, P.M., Jr.; Niebuhr, B.B.; Alexandre, B.R.; Muylaert, R.L.; Grativol, A.D.; Ribeiro, J.W.; Ferreira, A.N.; Ribeiro, M.C. Landscape Resistance Influences Effective Dispersal of Endangered Golden Lion Tamarins within the Atlantic Forest. Biol. Conserv. 2018, 224, 178–187. [Google Scholar] [CrossRef] [Green Version]
  55. Cushman, S.A.; Lewis, J.S. Movement Behavior Explains Genetic Differentiation in American Black Bears. Landsc. Ecol. 2010, 25, 1613–1625. [Google Scholar] [CrossRef]
Figure 1. Modeling areas of spatial extent and occurrence points of snow leopards.
Sustainability 14 01638 g001
Figure 2. (a) Area under the receiver operating characteristic curve area. (b) Jackknife test of environmental factors in forecasting potential snow leopard habitat distribution.
Sustainability 14 01638 g002
Figure 3. (a) The suitable habitat for snow leopards and (b) the four conservation gaps identified in the Qilian Mountain area.
Sustainability 14 01638 g003
Figure 4. Variation in connectivity according to the distance parameters and the comparative scenarios. PC index measures the degree of connectivity. The values show the rate of variation in the PC-index value from comparing the different scenarios. The S1/S0 curve depicts the effect of the highway and railway on initial connectivity. The S2/S1 curves indicate the impact of the corridor construction scenario on current connectivity.
Sustainability 14 01638 g004
Figure 5. The local-scale connectivity uses an ecological network of (a) current scenario (S1) and (b) of the corridor scenario (S1) using the betweenness centrality (BC) value for each patch and the component represented functionally connected at a distance of 30 km.
Sustainability 14 01638 g005
Publisher’s Note: MDPI stays neutral with regard to jurisdictional claims in published maps and institutional affiliations.

