1. Introduction
Power systems worldwide are undergoing unprecedented advances, in order to achieve two main goals. The first is to increase power system resilience, while the second is to confront global temperature increases. To accomplish the first goal, end users must have their own generators and energy storage systems (ESS), to provide energy to their loads, during public electricity failure in the form of microgrids. Microgrids are interconnected through the main power network during normal operating conditions but can work independently during blackouts [
1]. The second goal can be accomplished by increasing the number of renewable energy sources and electric vehicles. Nowadays, many countries worldwide aim for alternatives to fossil fuels, such as new, renewable, and environment friendly energy resources. With these new resources and the deployment of microgrids, the overall system’s resilience can be improved, in addition to providing economic, environmental, and societal benefits.
Several countries around the world have set up aggressive goals to increase the penetration levels of renewable energy, such as the Kingdom of Saudi Arabia’s (KSA) Vision 2030. In order for the KSA to meet its 2030 renewable energy goals, a more substantial fraction of the total energy production must be contributed by renewable resources [
2]. Moreover, with the rapidly evolving electric vehicle (EV) technologies and dropping battery costs, more EVs are expected on the KSA’s roads within the coming few years. Both renewable energy and electric vehicles impose a set of looming challenges to power grid operators. Renewable energy sources are intermittent by nature, adversely affecting the power grid unless they are augmented with energy storage. In addition, EV charging is expected to strain the distribution network. The solution to these challenges requires the development of a set of optimal control strategies and energy management algorithms to reliably operate the power grid. The strategies and algorithms must take into account renewable energy sources, moving as well as stationary electric vehicles, controllable loads, and other major loads (e.g., electrified transportation and/or heating).
As microgrid solutions find their way into preexisting power distribution networks, numerous control strategies have been proposed in the literature. In 2018, members of the Department of Engineering at the University of Technology Sydney, proposed a novel energy management system (EMS) for a residential microgrid application [
3]. The microgrid model under study consisted of fuel cells, ESS, a photovoltaic (PV) system, and residential customer loads. Fuzzy logic-based control methods were used to determine the status of the various microgrid elements, and a magnetic bus configuration was proposed to transfer utility power amongst them. The control framework successfully worked for the proposed element sizes; however, the system studied in this paper consists of elements requiring different bus configurations and control schemes to adhere to higher power demands.
Similarly, in 2021, members of the engineering departments at the University of Jaen, Ain Shams University, and Future University in Egypt, proposed a smart grid system consisting of EV charging, along with generators, ESS, and consumer loads [
4]. Proper deployment of the proposed system involved an operating agent, which performed “day-ahead” optimal scheduling. However, with the higher penetration of DERs and EVs (as demonstrated towards the latter part of this paper’s case study), given their uncertainty, the grid operator would have difficulty maintaining the load/generation balance and consequently, the stability of the system, which may compromise the whole network’s reliability.
In 2020, the São Paulo Research Foundation presented a power management strategy (PMS) to control the power flow in a microgrid model composed of the AC utility grid, interfaced with a voltage source converter, an ESS, a distributed generator, and customer loads [
5]. The proposed power management system relied on communication between converters, while simultaneously using inertial control methods to regulate DC bus voltage alterations due to customer loads. This paper intends to further expand that study, as well as those previously mentioned, with the inclusion of a high-demand subway system, while also using different control algorithm (vector decoupling) schemes to regulate bus voltages. The inclusion of the subway system and regenerative energy allows sizing upgrades to accommodate loads larger than those mentioned in previous literature, as mentioned in the case study.
In this paper, the proposed coordinated control framework for DC energy hubs consists of DERs, EVs, and subway power supply. The proposed framework has been validated using a case study of NYC’s subway system, which to date does not contain an efficient means of regenerative energy recuperation, let alone one with microgrid integration. Integration of the proposed microgrid not only reduces the subway system’s energy and peak demand reduction, but allows for energy to be sent back into the grid. The rest of the paper is organized as follows: in
Section 2, an overview of the challenges associated with electrified transportation has been provided;
Section 3 focuses on the DC energy hub concept; in
Section 4, the case study is described; in
Section 5, the results and discussion are presented; finally, in
Section 6, the main conclusions of this study are summarized.
2. Electrified Transportation
2.1. Subway
Subway power systems are large consumers of electricity. For instance, the average energy consumption in New York City is about 1.8 billion kWh per year, with approximately 495,000 kW required by the subway system for operation during peak hours. Subway trains are normally powered via power lines in the form of third rails or overhead catenaries that run parallel to traction rails. Third rail power lines, such as those of NYC’s subway system, receive DC power from a set of rectifier substations that are distributed throughout the city. In 625-V DC systems, as in NYC, the rectifier substations include transformers that step down the medium-level utility distribution voltage to about 465-V. Transformers are followed by uncontrolled rectifiers, providing the DC voltage. With no train load, the voltage is typically close to 625-V, but as the train approaches or departs from the station, the voltage on the third rail fluctuates.
Most modern rolling stock is equipped with regenerative braking capability, which enables a portion of the kinetic energy stored in a train’s inertia to be recaptured and potentially injected back into the third rail during deceleration [
6]. If a load happens to exist close enough to the decelerating train on the third rail (e.g., an accelerating train at the same passenger station), it will draw the injected energy [
7]. However, if there is no load, the third rail voltage tends to rise, causing the onboard protection system to electrically disconnect the train from the third rail. Analysis of large subway systems, such as NYC’s, concluded that regenerative braking energy results in only about 8–9% energy savings [
8]. These numbers can be substantially increased with the proper design and deployment of ESS, keeping in mind that regenerative braking needs to be captured within only ~30 s. The captured regenerative energy can be used elsewhere (e.g., to charge electric vehicles, supply customer loads, etc.) or even be sent back into the utility grid, through a path separate from the preexisting rectifiers, all within a controlled microgrid setting.
With advancements in switching systems (transistors), a reverse path can be provided to allow bidirectional exchange between both the AC and DC sides of the railway power distribution network [
9]. Inverters can be integrated throughout already existing substations, to allow rectified DC voltage to be converted back to AC voltage. The inverters can work in parallel with the diode-based rectifiers already being used, and to further reduce power consumption, ESS can be used to store the surplus regenerative energy to be reused. To further reduce greenhouse gas emissions, renewable energy systems (e.g., PV systems) can also be incorporated.
The microgrid proposed in this paper will help recuperate more regenerative braking energy, due to the deployment of an ESS, which will work in parallel with a PV system, as well as a reversible path to the main AC grid, through an inverter. All elements have been carefully sized to work in tandem and optimize energy savings.
2.2. Electric Vehicles
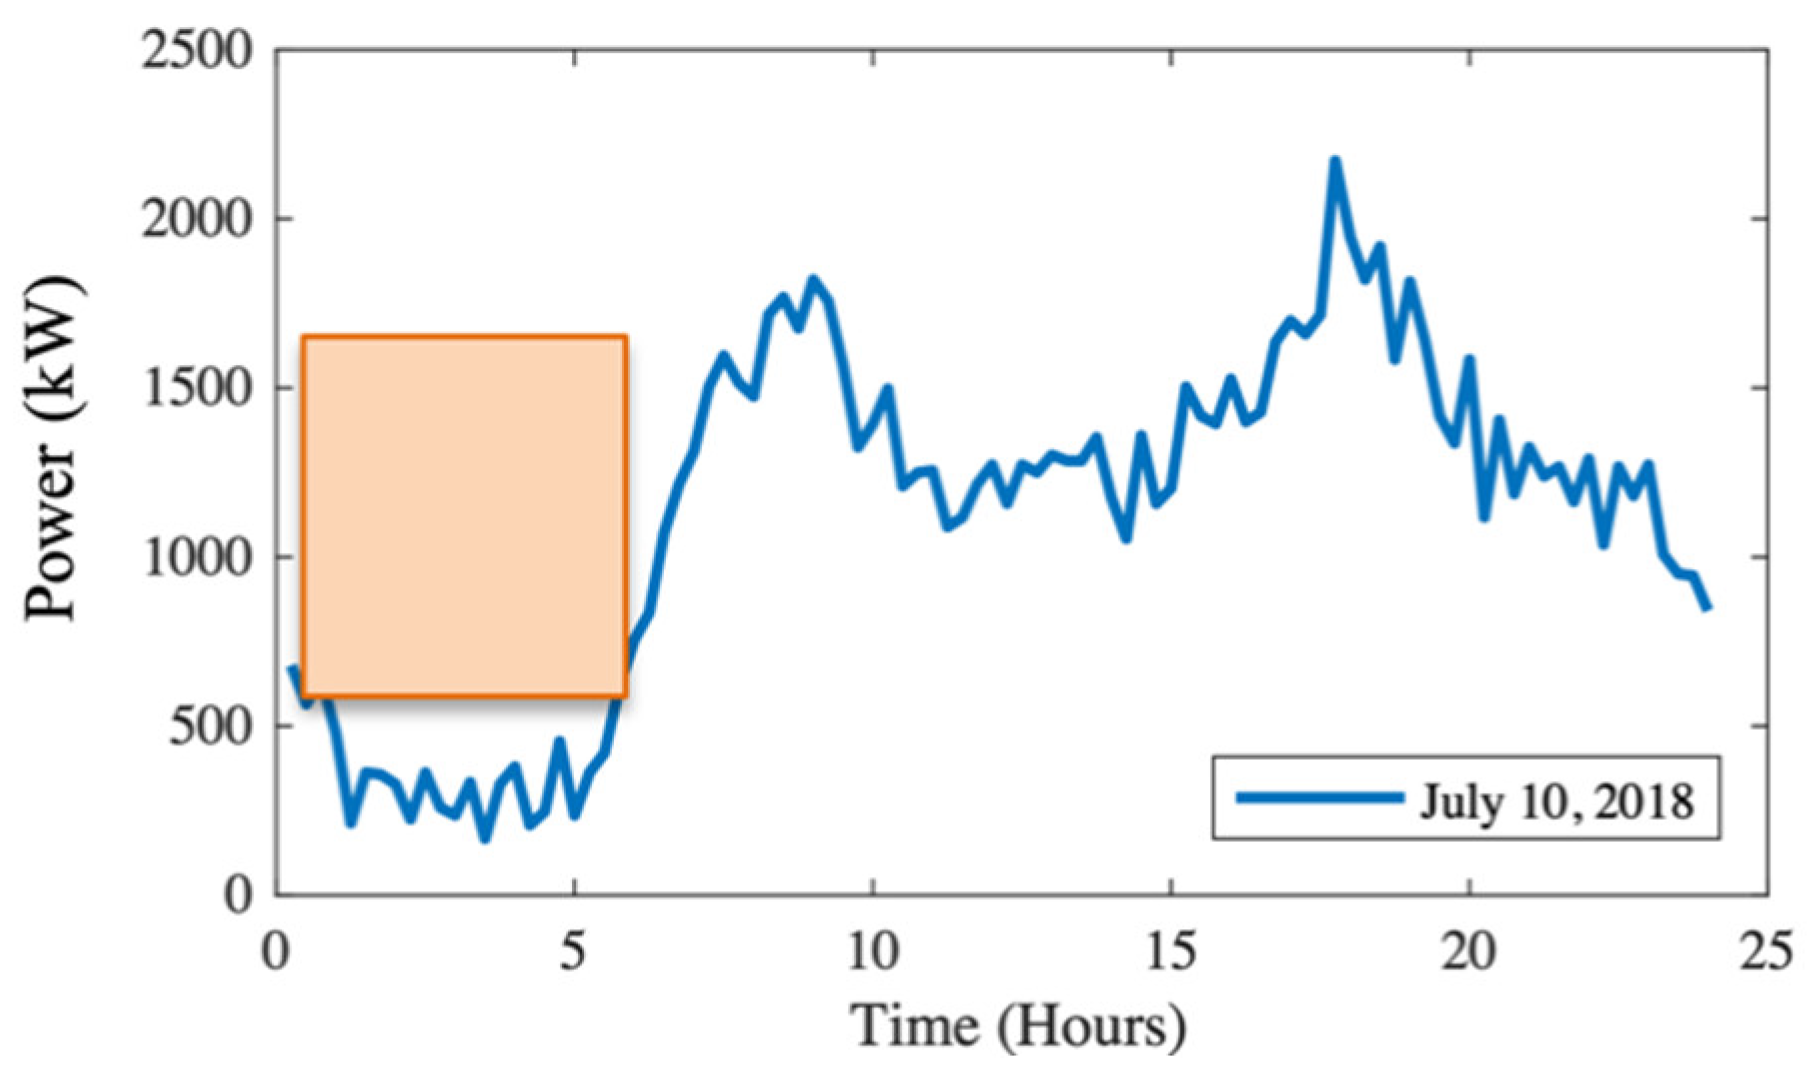
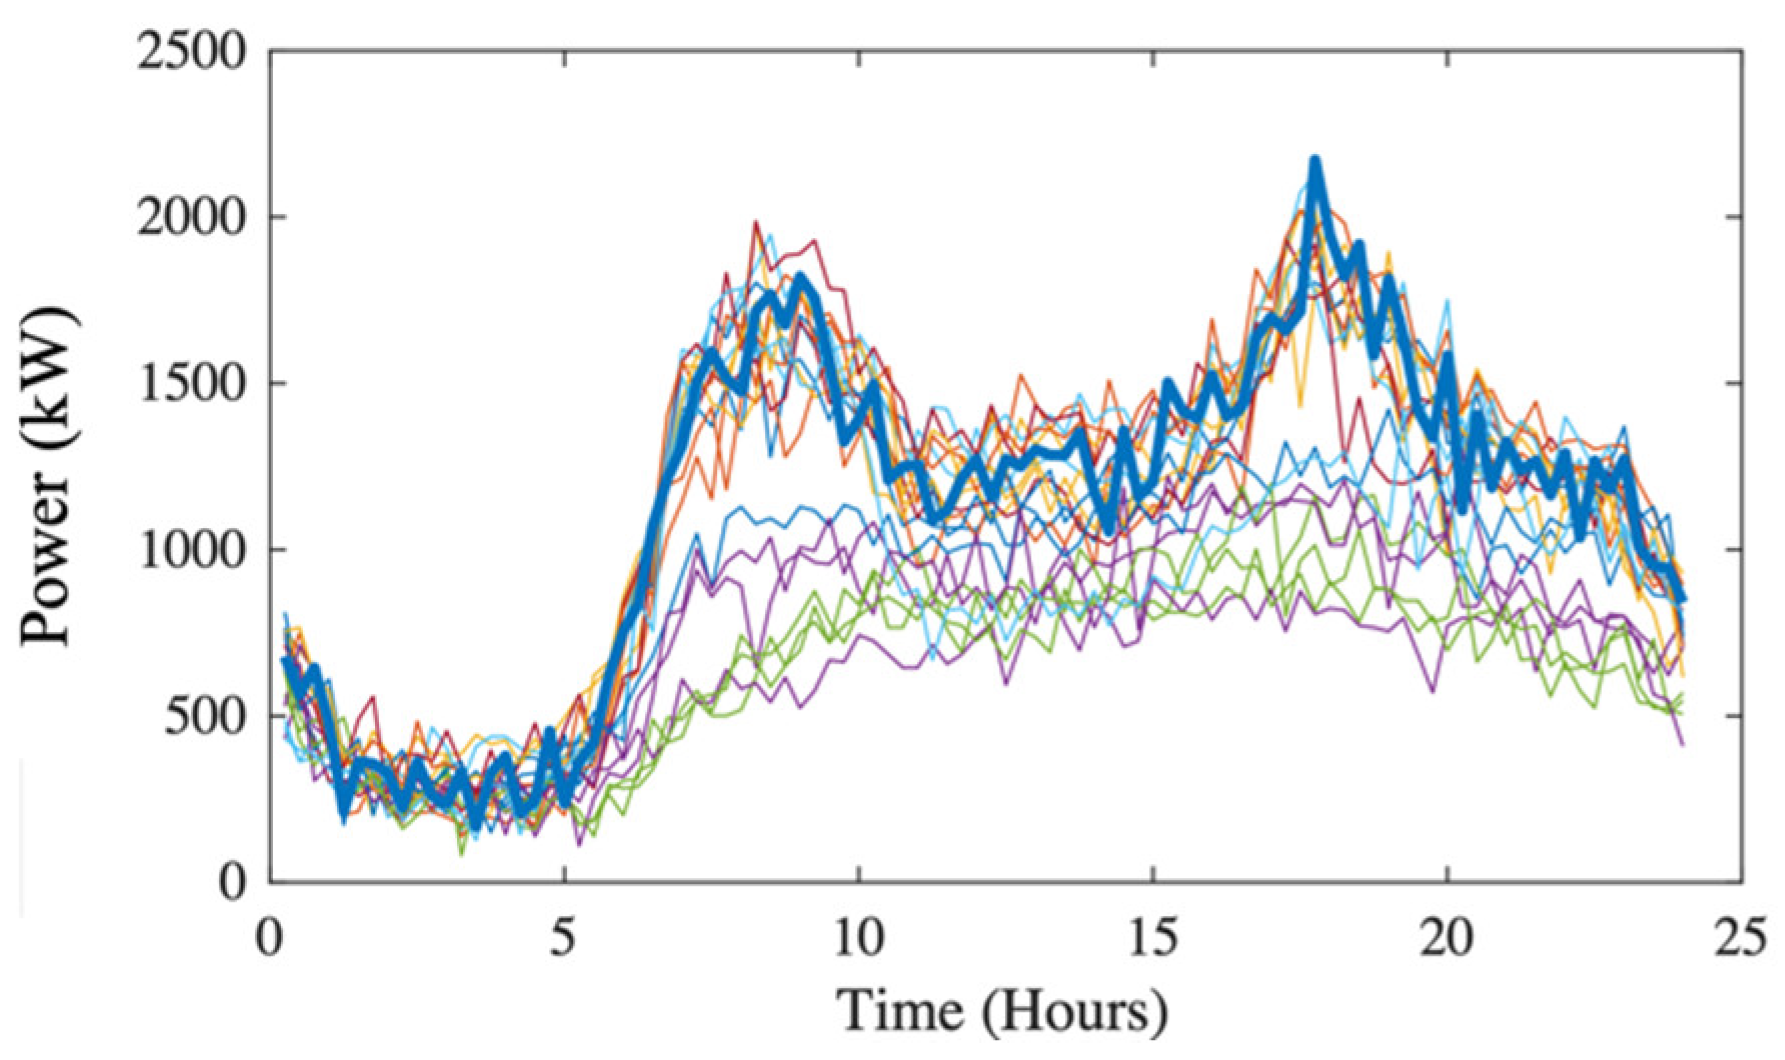
EV chargers vary in their power ratings, from the sub-kW to 20 kW range for Level 1 and 2 chargers, and up to 400 kW for DC fast charging. EVs can collectively represent a significant demand increase when charging, ultimately mandating wide-scale distribution infrastructure upgrades. Infrastructure upgrades can be deferred and the impact of EVs can be mitigated if they are intelligently managed and their charging/discharging process is coordinated and optimally scheduled. For example, home charging is likely to take place during the late evening through to the early morning, leading to a time shift in the residential load peak. Rush hour times for NYC occur between 6:30 a.m. and 9:30 a.m. for morning commute, and 3:30 p.m. and 6:45 p.m. for evening commute, where the highest number of passengers go to and return from work, respectively. Therefore, the greatest number of trains are placed into service during those time intervals. If ESS are utilized to store the available regenerative braking energy during those times, it could be reused during off-peak hours.
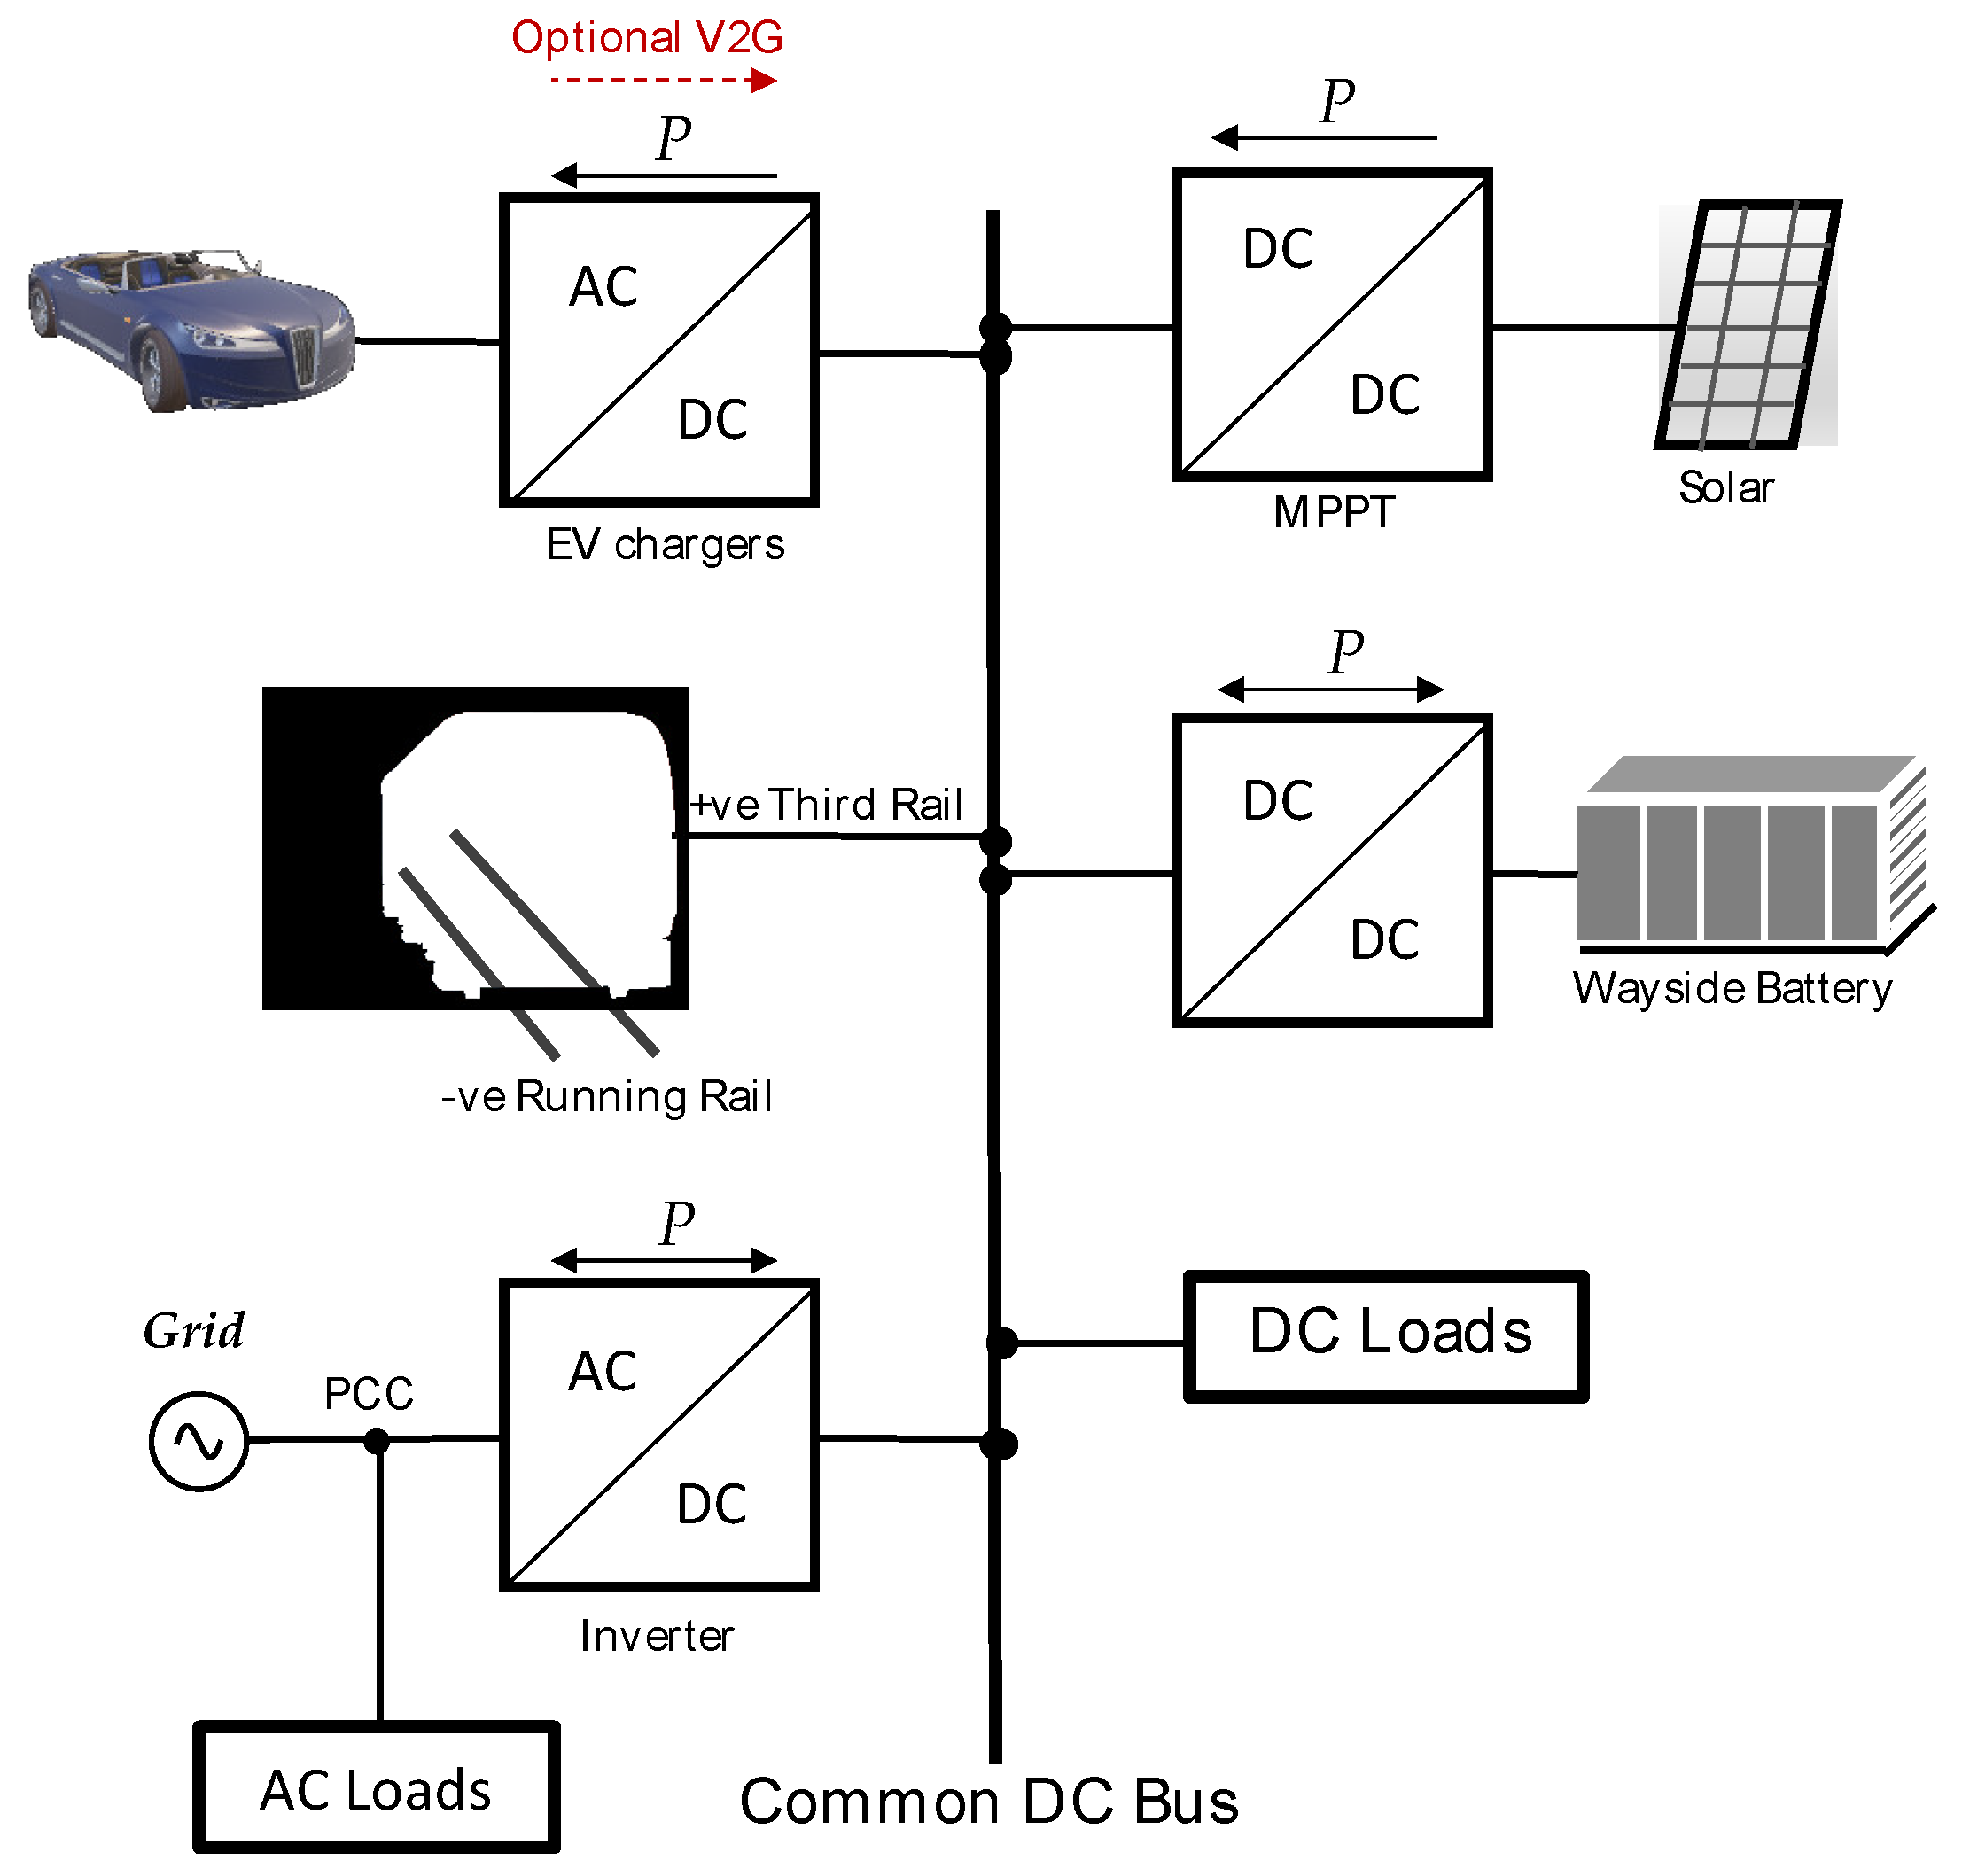
4. Control Framework
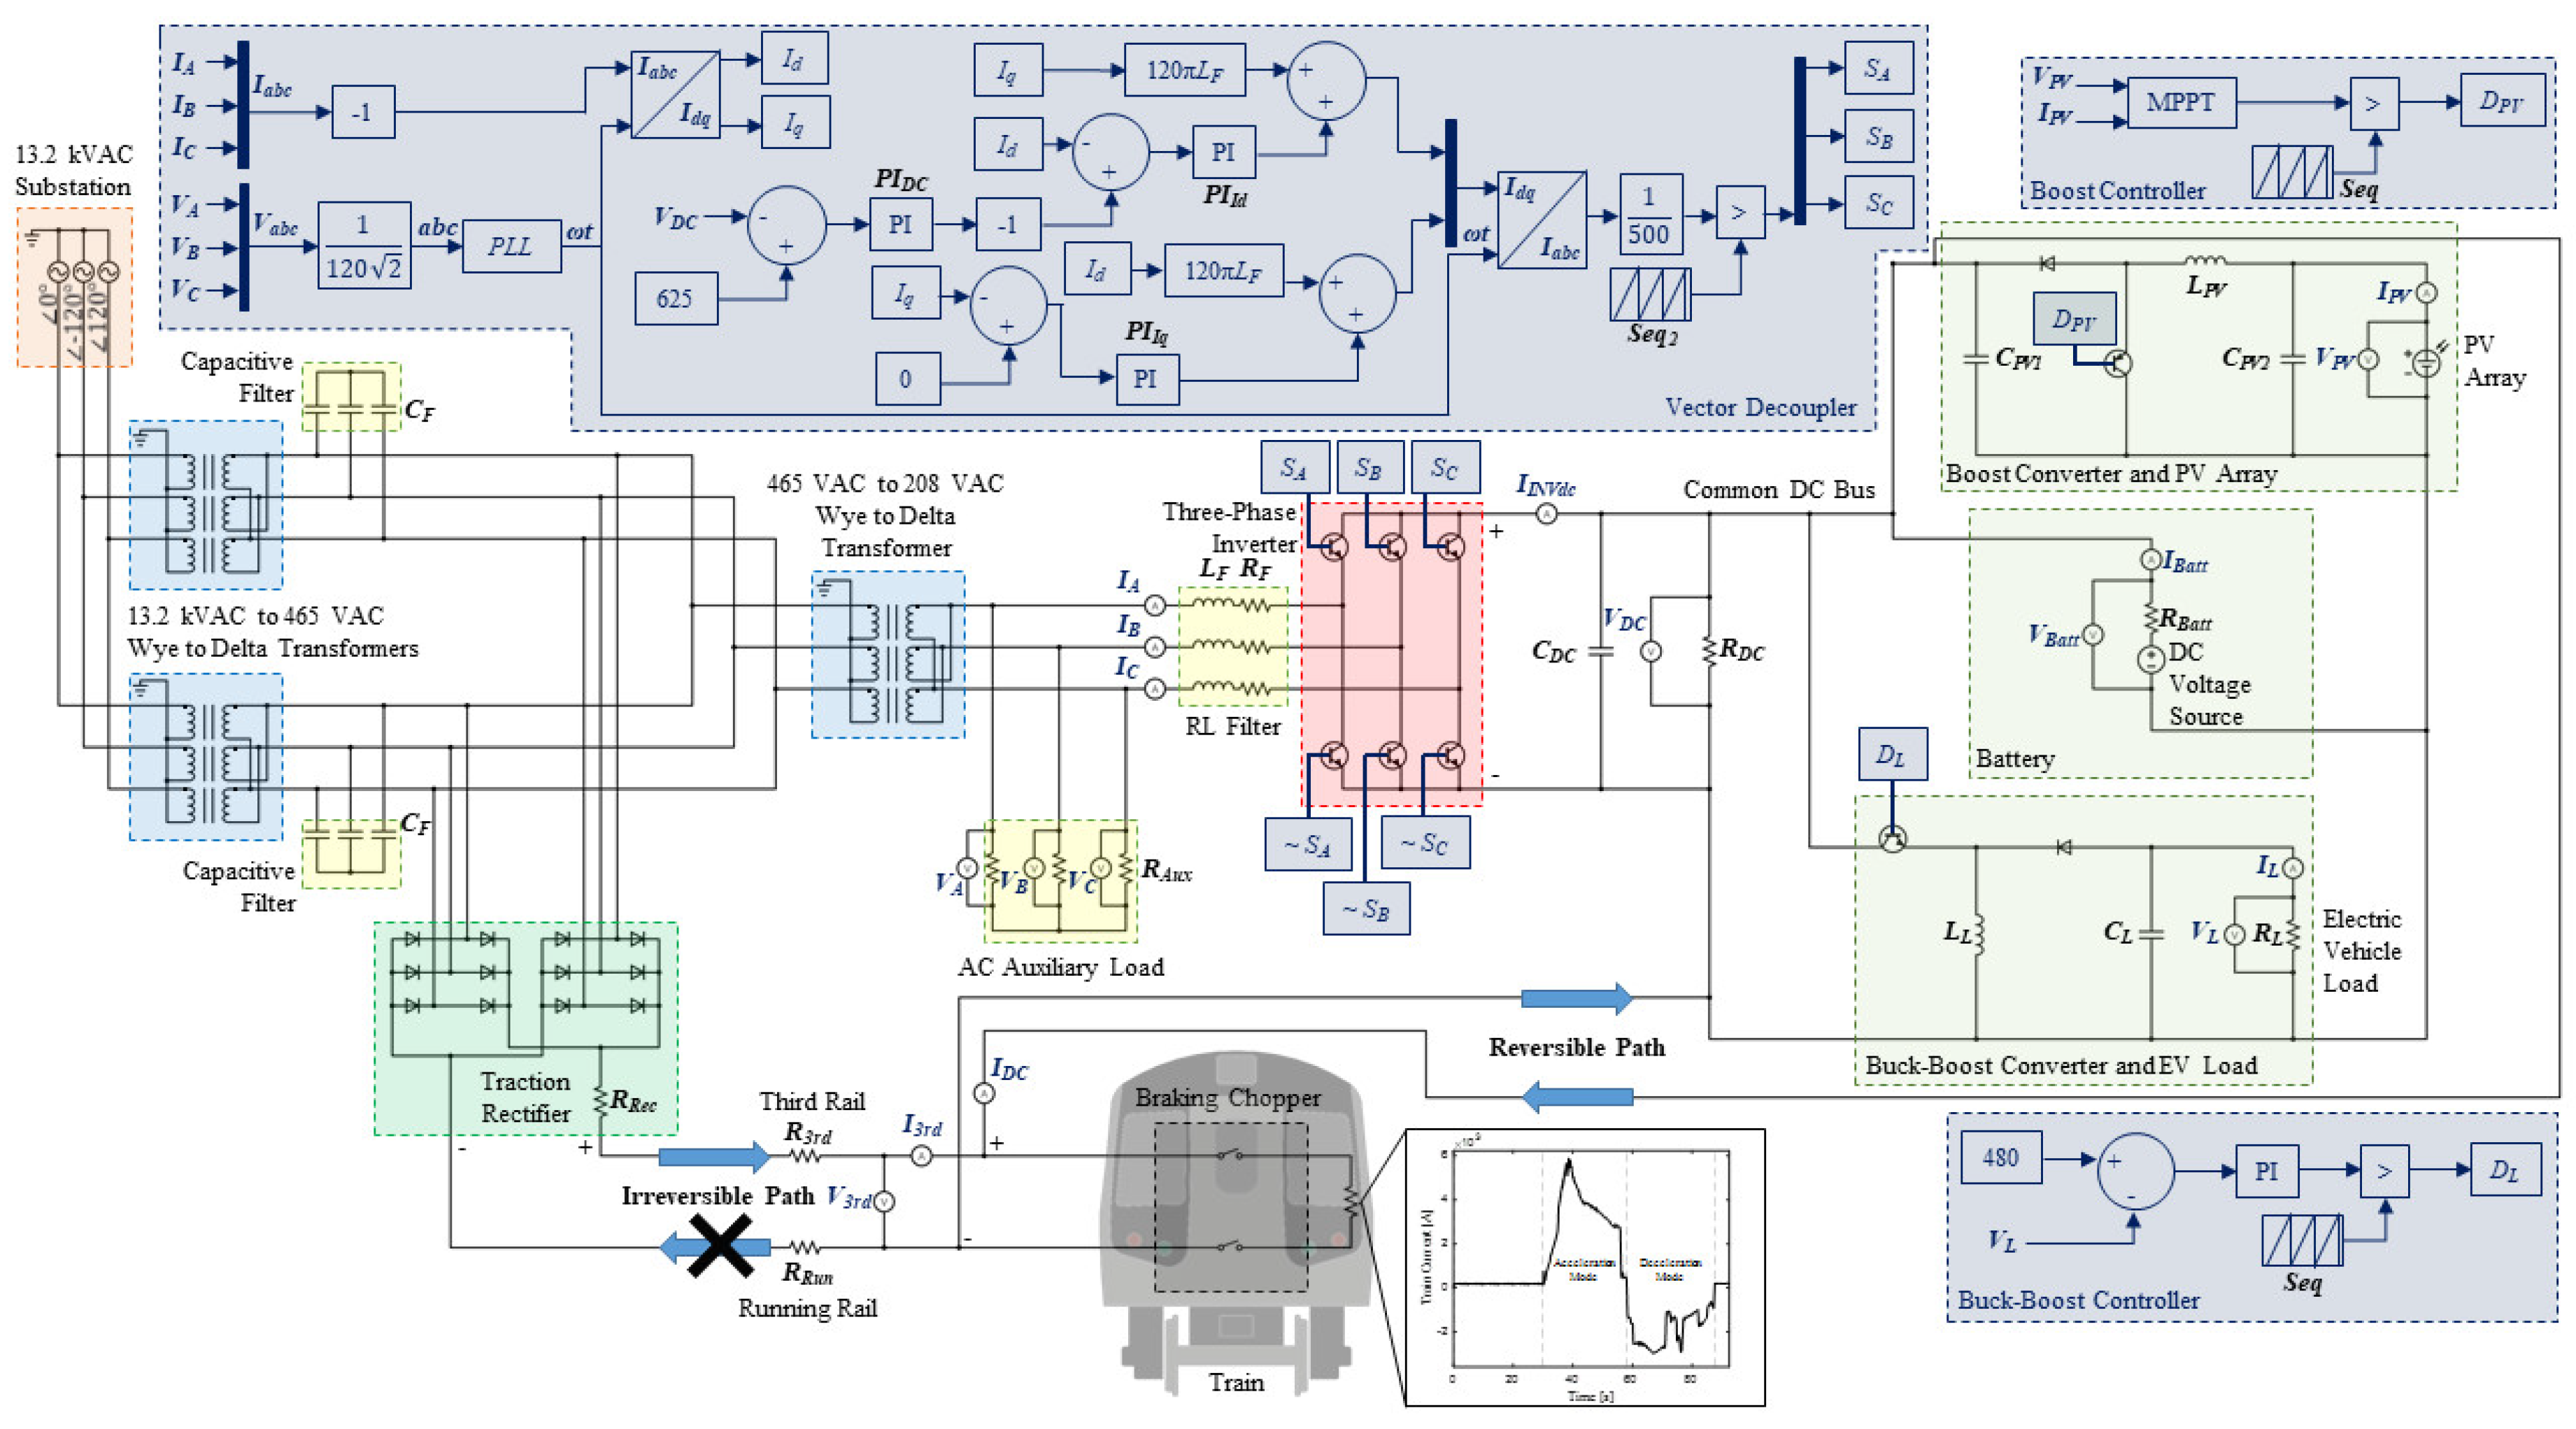
The case study follows the layout depicted in
Figure 4. NYC’s subway power distribution network is illustrated, starting at the substation level, where an uncontrolled rectifier substation supplies the medium-level utility voltage (13.2-kV AC in this case) to two three-phase transformers. The transformers further step down the voltage to about 465-V, which makes its way to two full-bridge diode-based rectifiers (two for redundancy). A capacitive filter is connected between each of the transformers and rectifiers. The output of the uncontrolled rectifiers is what forms the third-rail voltage, as the positive (+) side is connected to the third rail, while the negative (−) side is connected to the running rails [
14]. The output of the transformers is also connected to a third step-down transformer, used to establish the main utility grid. The grid connects to the AC side of an inverter, which is linked to the common DC bus within the proposed microgrid.
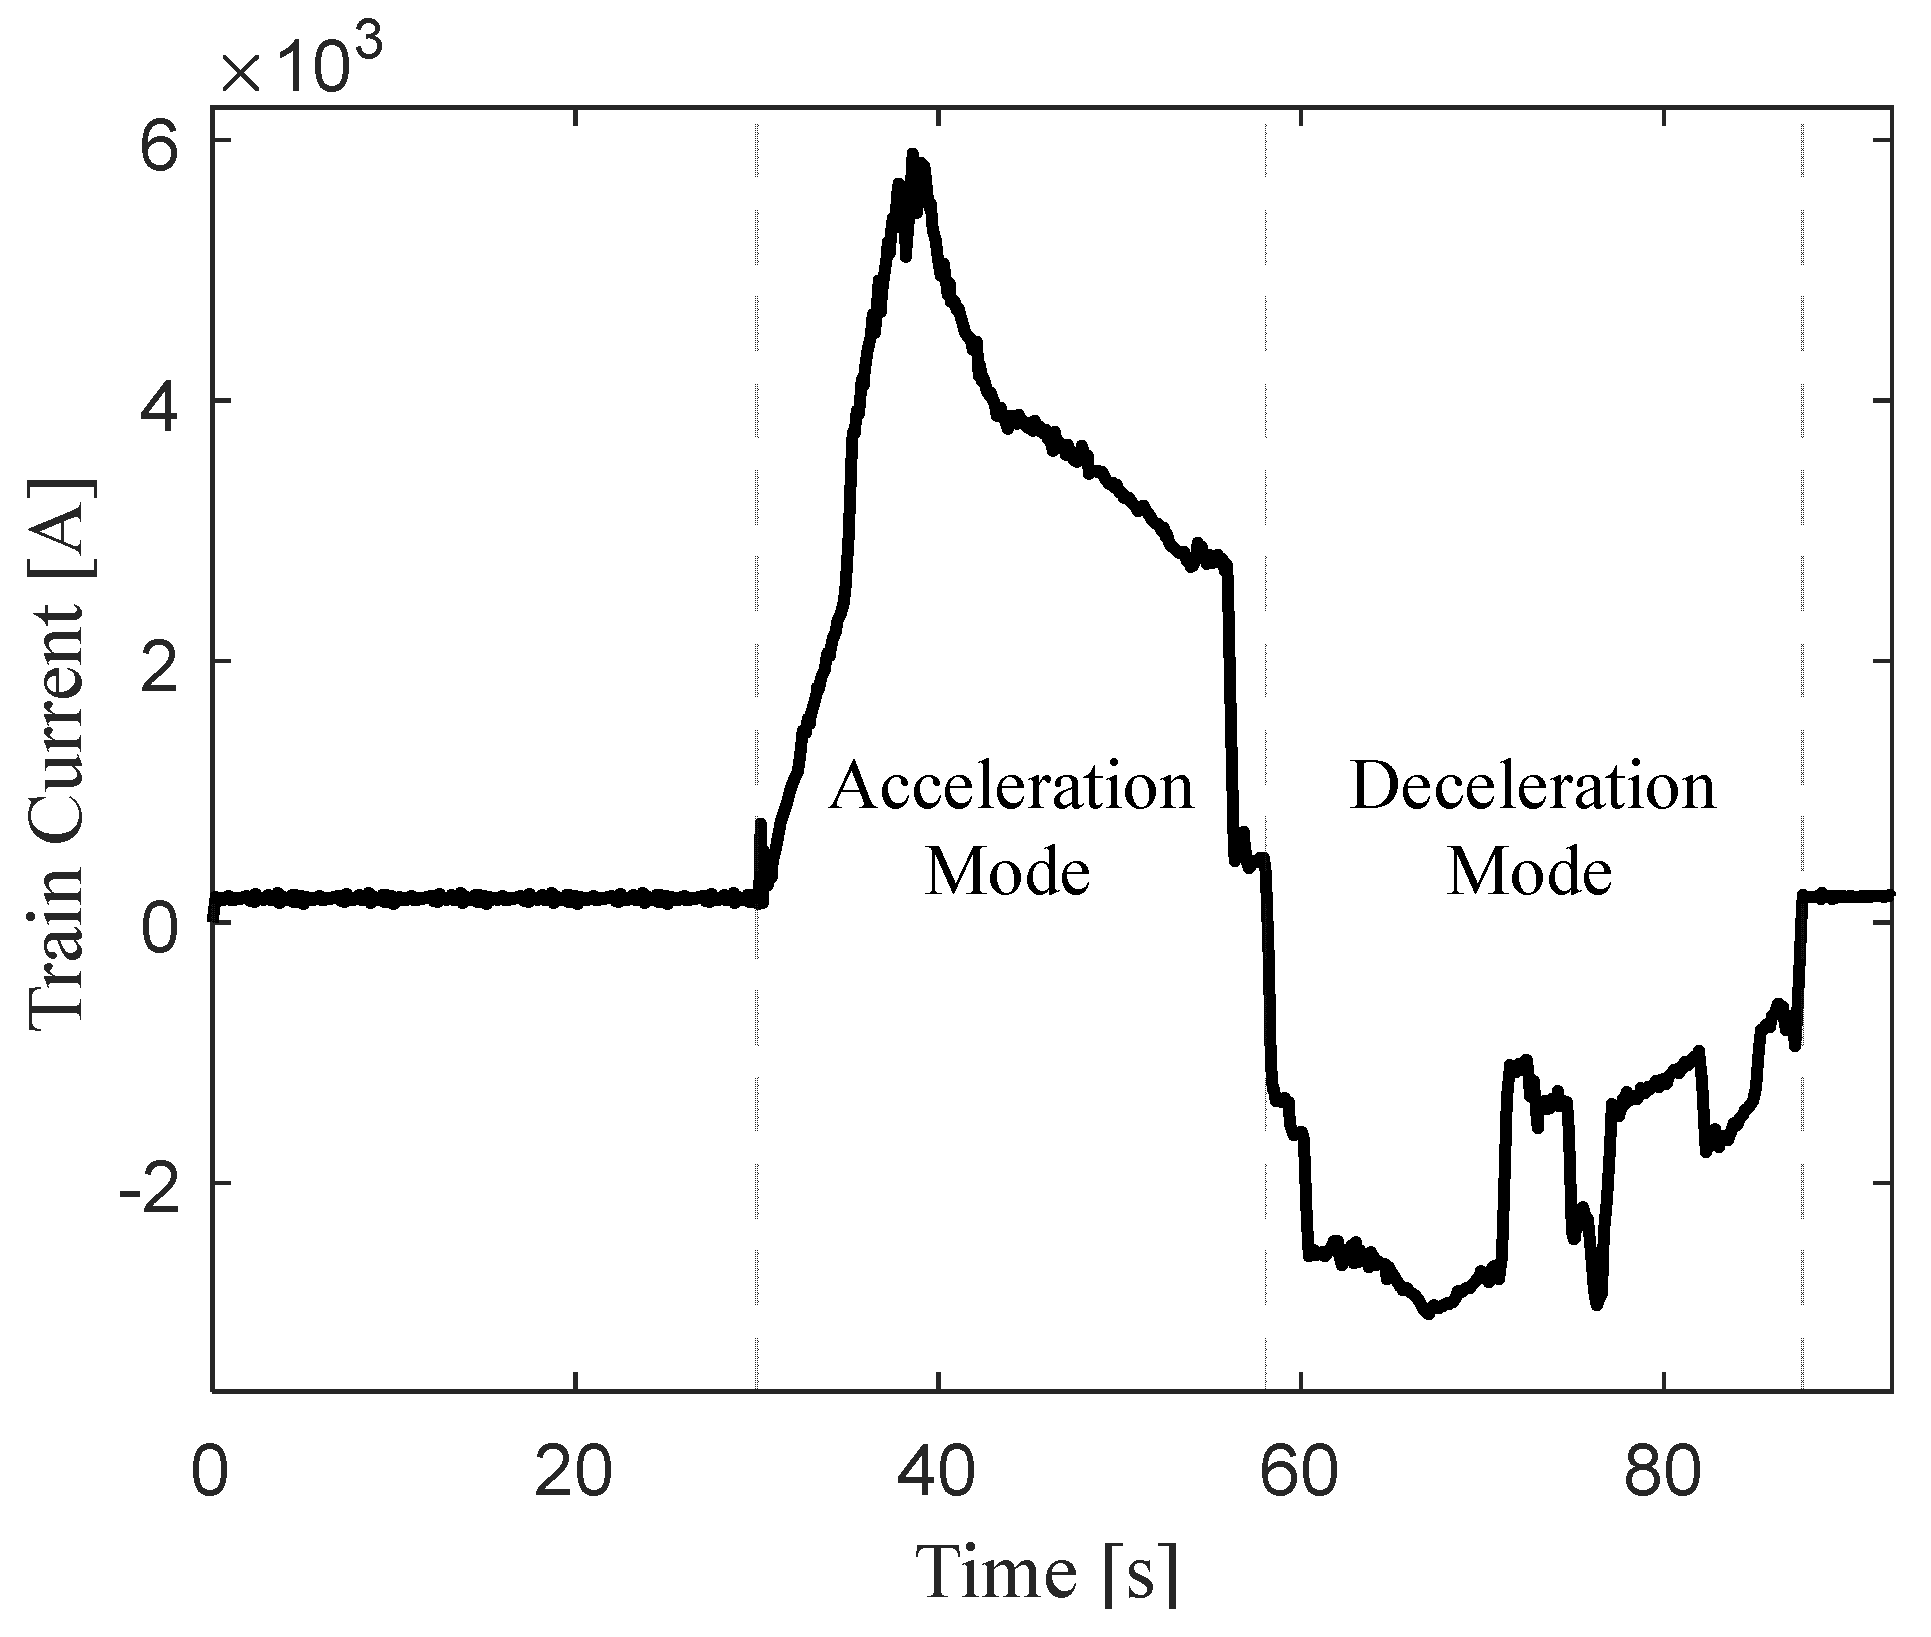
The train is modeled using a current profile (see
Figure 5), which was obtained through real-life measurements, taken at the third rail within an NYC station. The advantage of taking this approach is that it already takes into account train movements, onboard flow control, as well as variable resistance, occurring in real time. The focus of the study can then be simplified and isolated to the rest of the system, where the effects of the train’s behavior can be studied. The current profile shows a train accelerating (from about 30 s to 58 s) as it draws power from the third rail. The train then decelerates (from about 58 s to 88 s), injecting regenerative braking energy (negative current) into the third rail, before coming to a stop. The train also contains an onboard protection system (braking chopper), to enable dynamic braking, even if regenerative braking is not possible.
The control hierarchy consists of two levels, i.e., a set of local controllers and a single secondary central controller, with the possibility for the secondary controller to coordinate with an external tertiary controller (e.g., the utility grid or a community aggregator). The parameters of the converters and controllers are summarized in
Table 1.
In this hierarchy, the local controllers carry out local tasks, by regulating the voltage, current, and/or power, corresponding to pre-specified setpoints and local sensor measurements, while the secondary central controller optimizes the overall system performance by finding those optimal setpoints and sending them to the local controllers. Hence, the bandwidth requirements for the controllers and the vulnerabilities to single point failures are substantially reduced.
The PV system modeled in this case study consists of A10 Green Technology (A10J-S72-175) modules, forming 40 parallel strings, 10 series-connected modules per string, and 72 cells per module. The maximum power rating for each module itself is 175-W at standard test conditions (STC). The boost converter interfacing the PV system performs maximum power point tracking (MPPT), using the Perturb and Observe algorithm [
15]. With regards to the algorithm, the initial duty cycle is set to 0.87, the initial voltage is set to 80-V, and the initial power is set to 640-W. To model the EV charging load, a buck-boost converter, controlled using a proportional-integral (PI) controller, is used to draw power, based on a regulated DC load voltage (480-V in
Figure 4).
One of the key components of this system is the inverter, tying up the common DC bus with the AC grid. The proposed DC bus connects with the preexisting third rail, and the inverter provides a reversible path for regenerative braking energy to be sent into the grid, which is not possible with the pre-existing diode-based rectifiers. Since the inverter is required to operate in four quadrants, it needs to utilize a vector-decoupling pulse-width modulation (PWM) technique. Vector-decoupling control requires coordinate transformation to the DQ frame of references, as depicted in
Figure 4.
To synchronize the inverter output with the grid and enable vector decoupling, a phase-locked loop (PLL) is used to detect the grid phase angle, using the measured voltage. The phase angle is used to decouple current and voltage signals, and to convert them back to the ABC frame of references at the end of the control loop. A nested control loop is used, in which a voltage controller attempts to regulate the common DC bus voltage. The output of the voltage PI controller serves as a reference for an internal direct-axis current controller. The quadrature-axis current is set to zero, to operate at unity power factor, but can be set to provide capacitive or inductive reactive power support, if needed.
In order to examine the performance of the proposed DC energy hub solution, transient simulations were performed, using MATLAB/Simulink. The system was tested under varying operating conditions of solar radiation and temperature, EV charging, and the previously mentioned train acceleration/deceleration cycle.
5. Results and Discussion
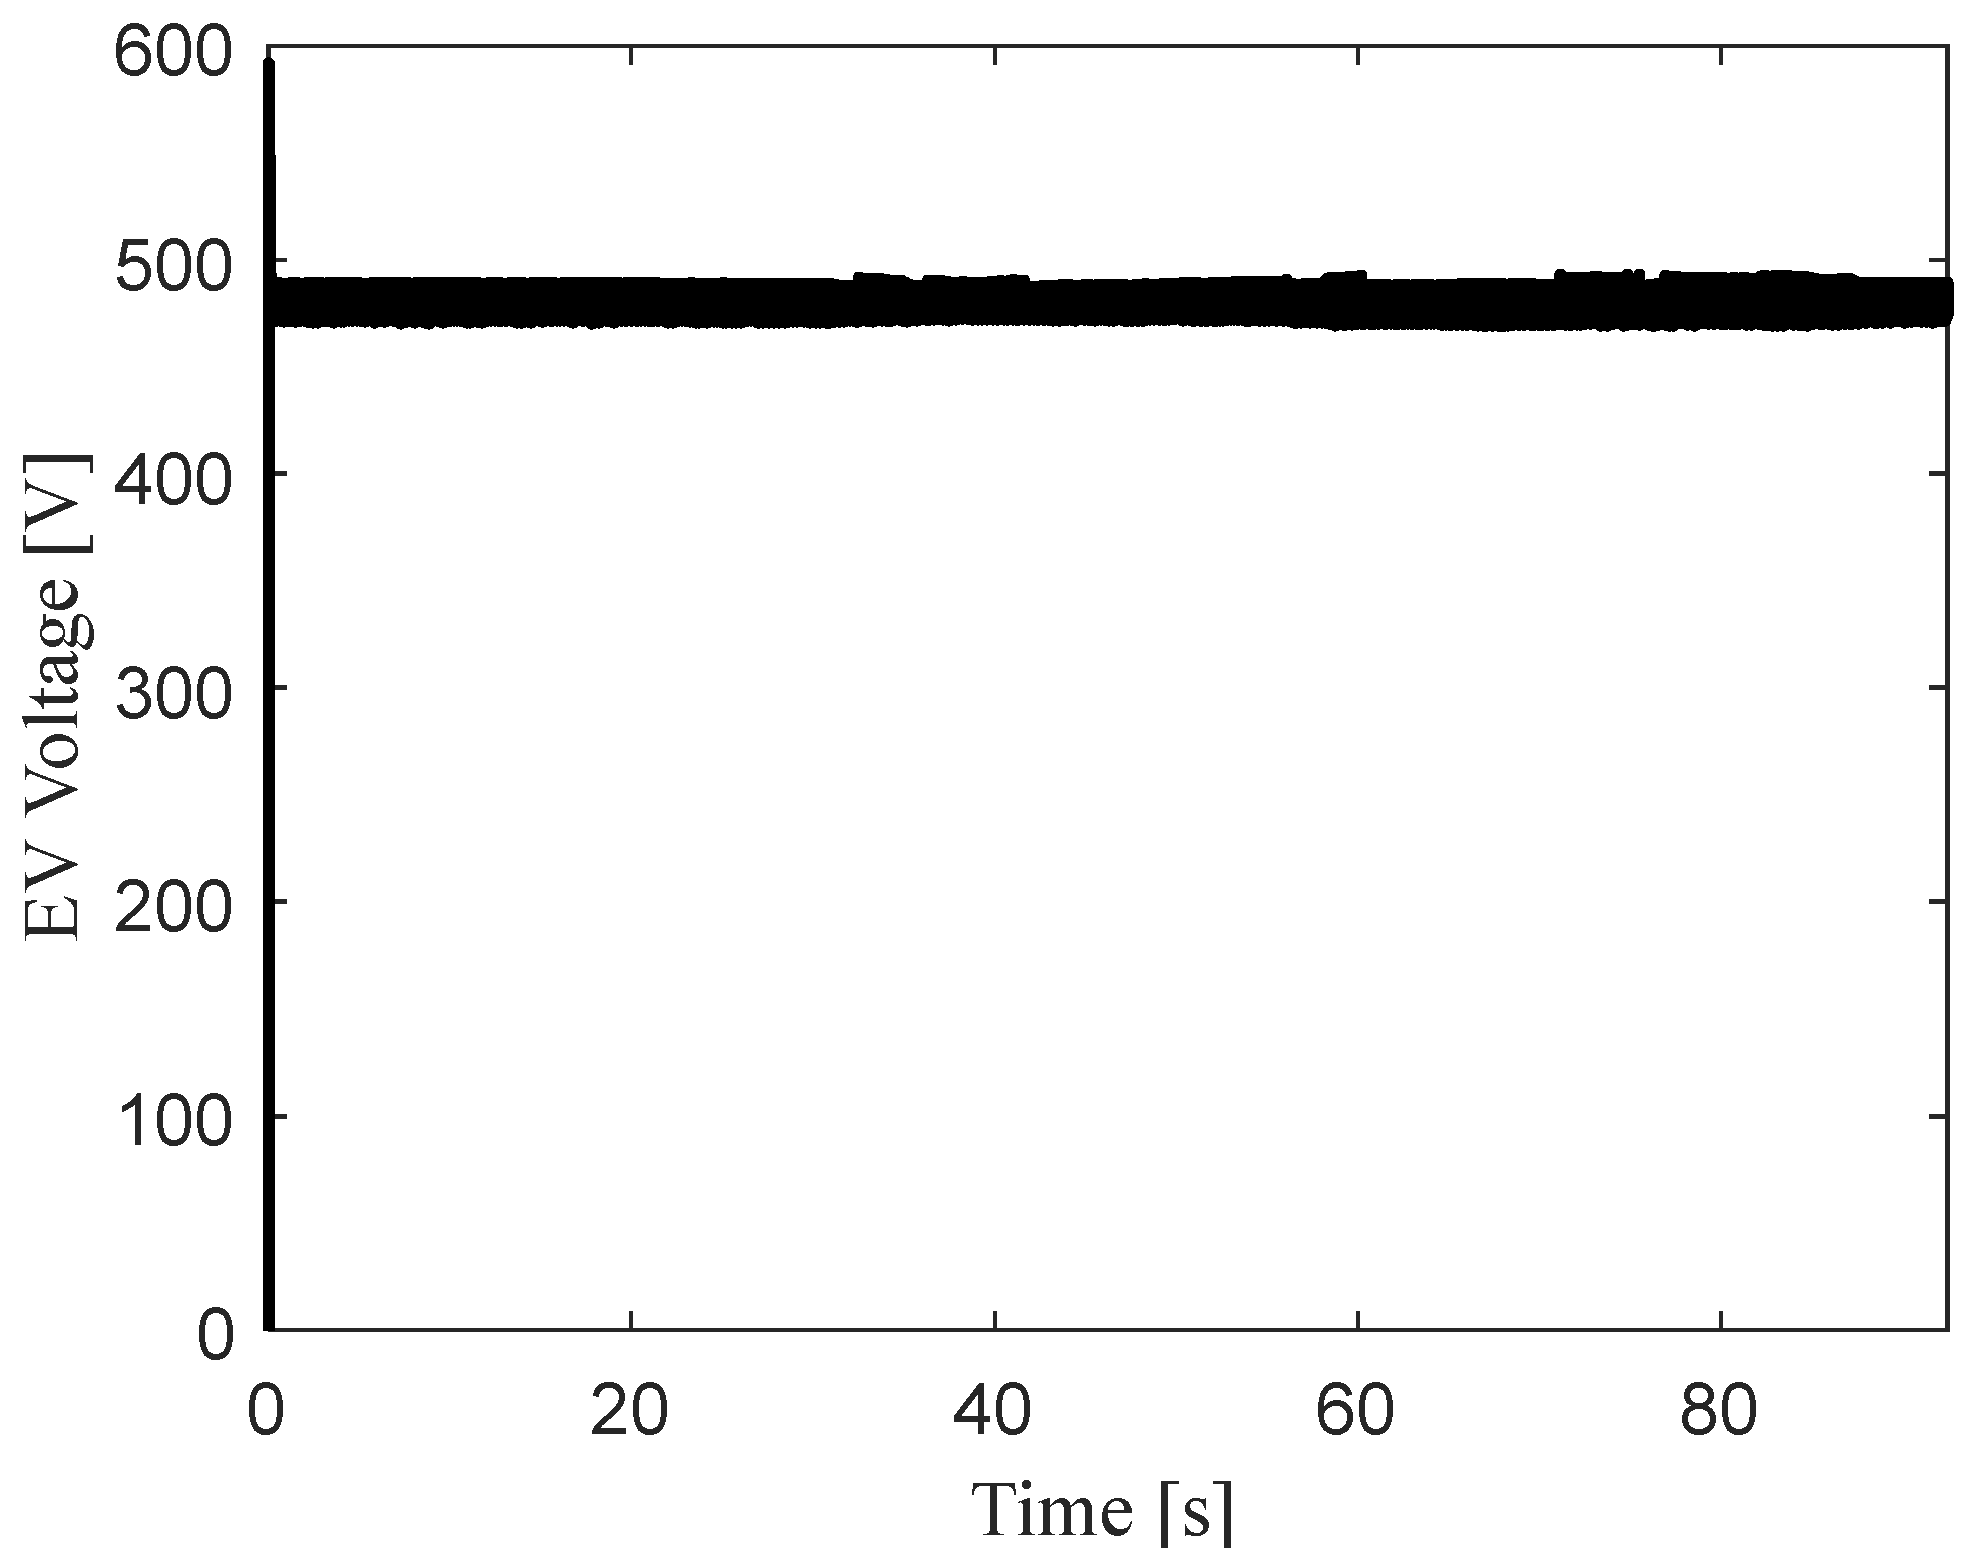
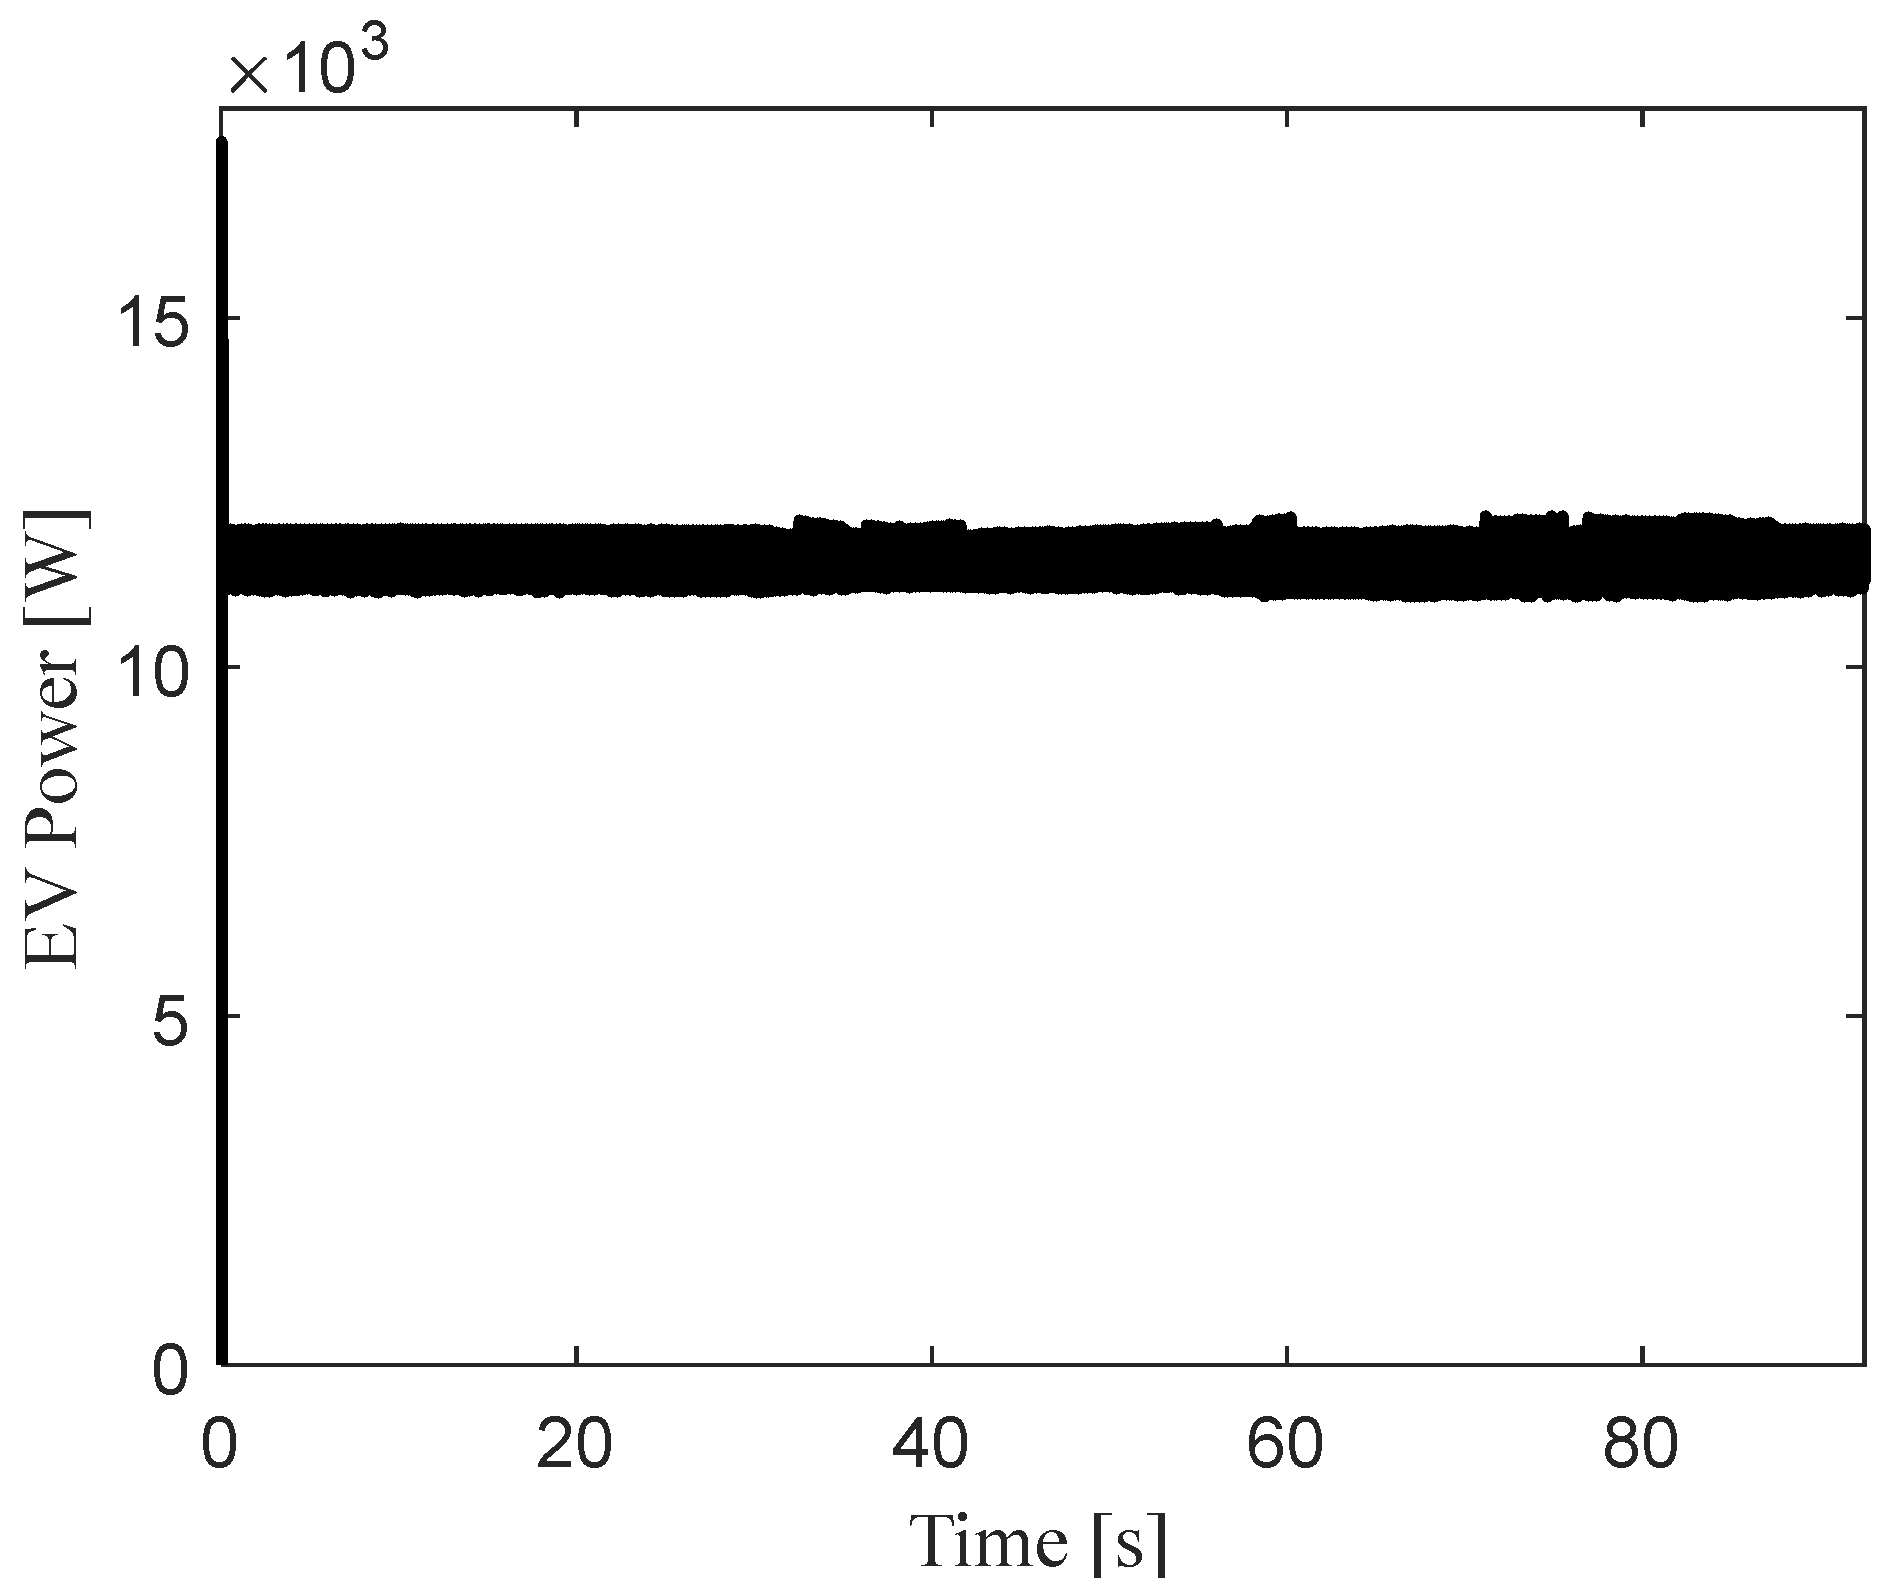
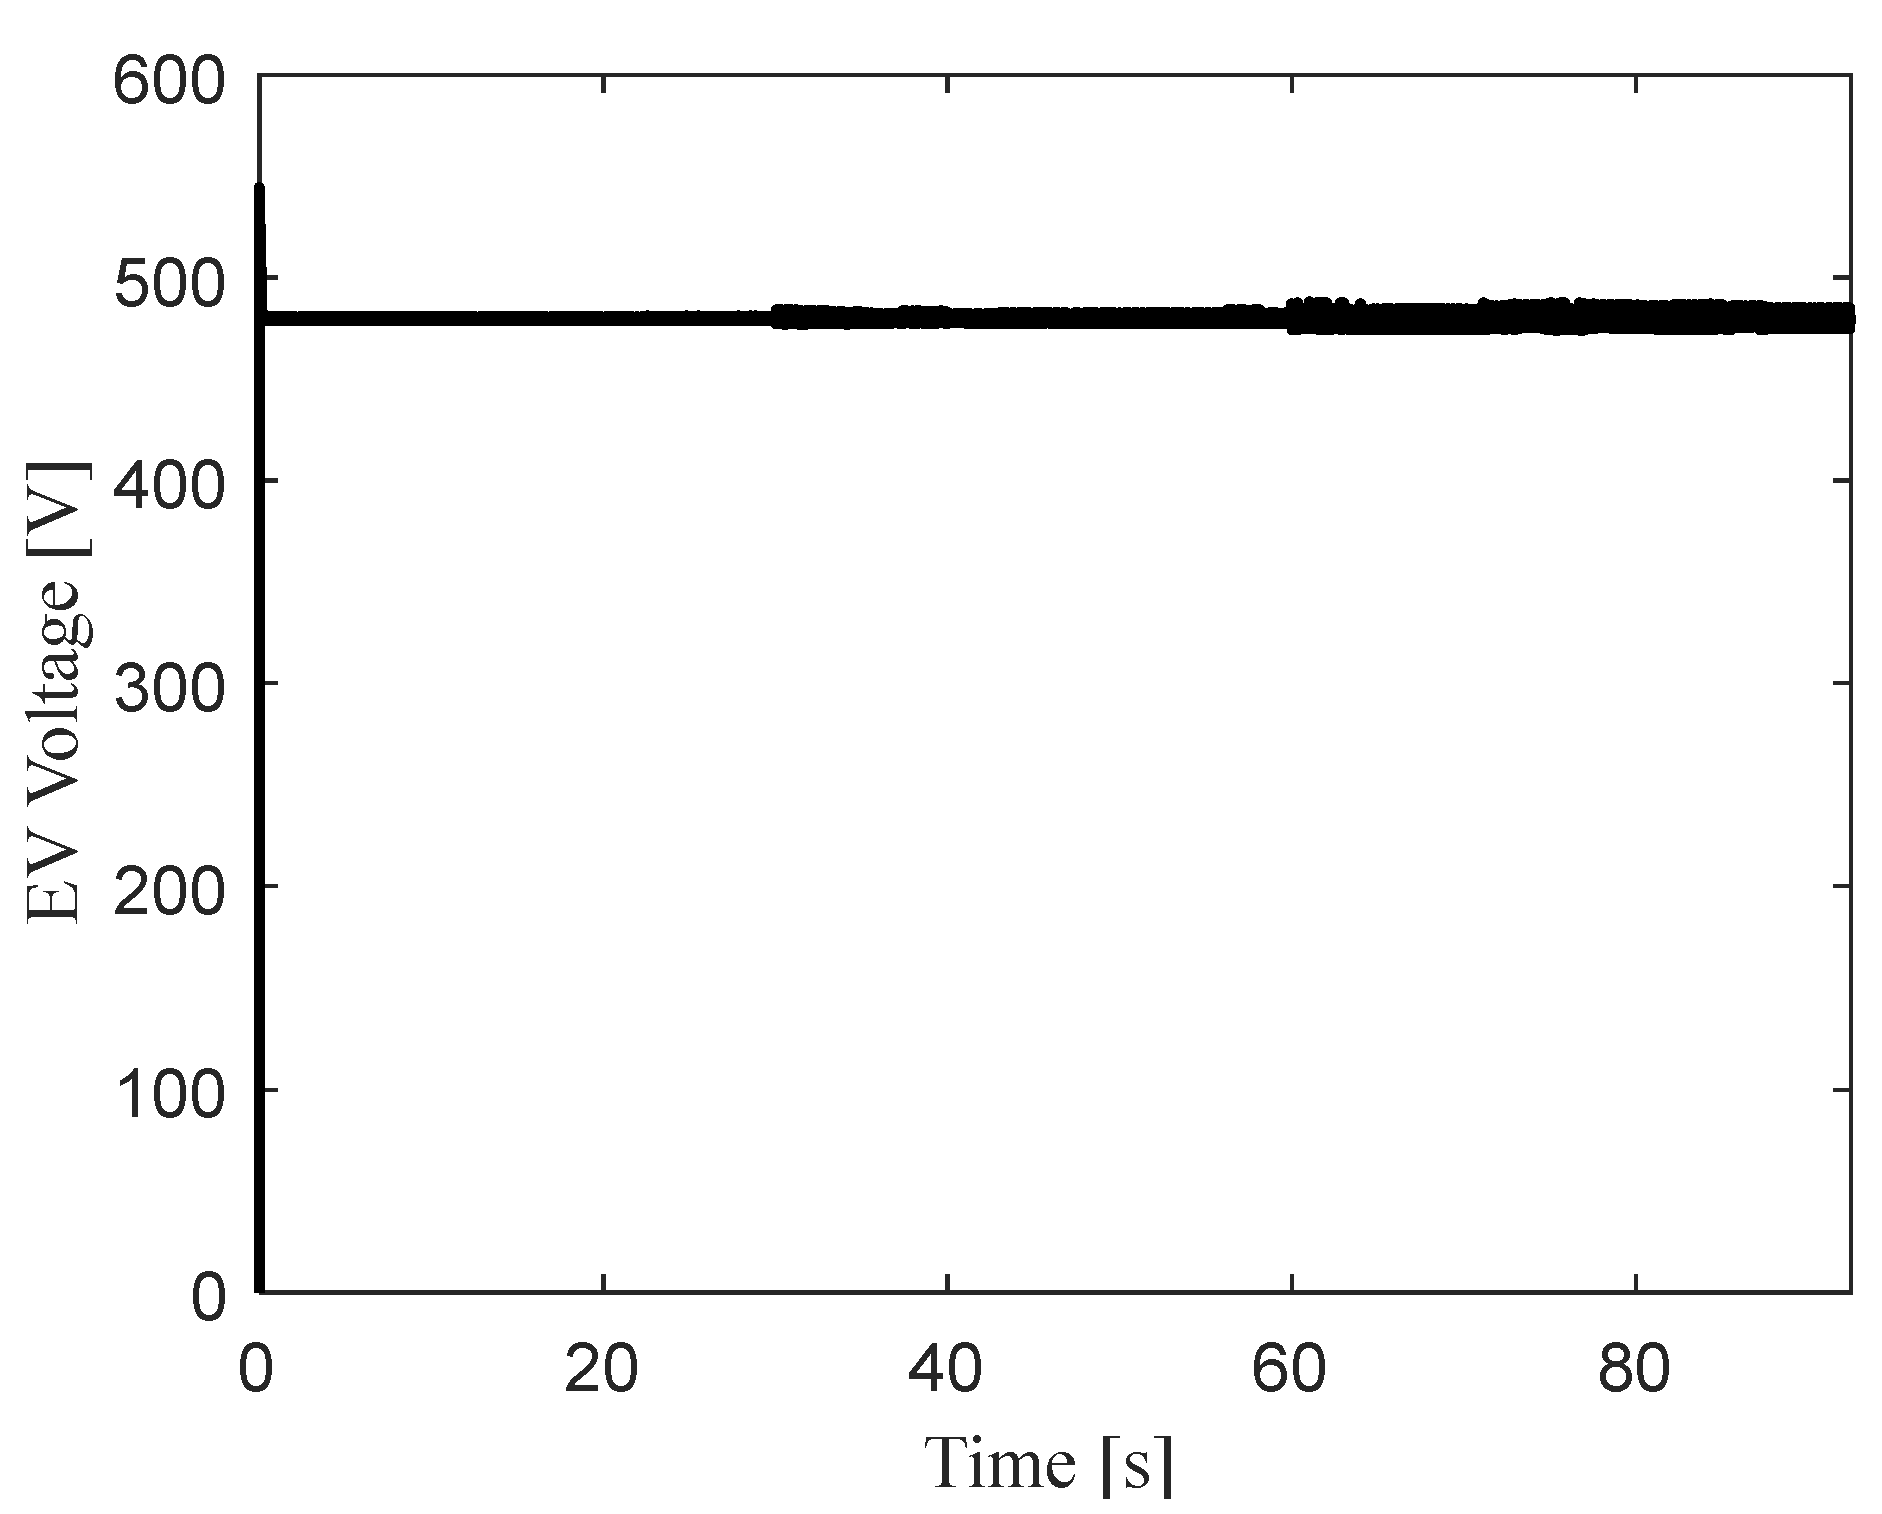
The EV load voltage is depicted in
Figure 6. As can be seen, the buck-boost converter is capable of regulating the voltage at 480-V, throughout the simulation time. This results in a constant EV charging power of about 12-kW, as shown in
Figure 7. This implies that the load is unaffected by the variations in power/voltage on the common DC bus, which are caused by the PV system and train motion.
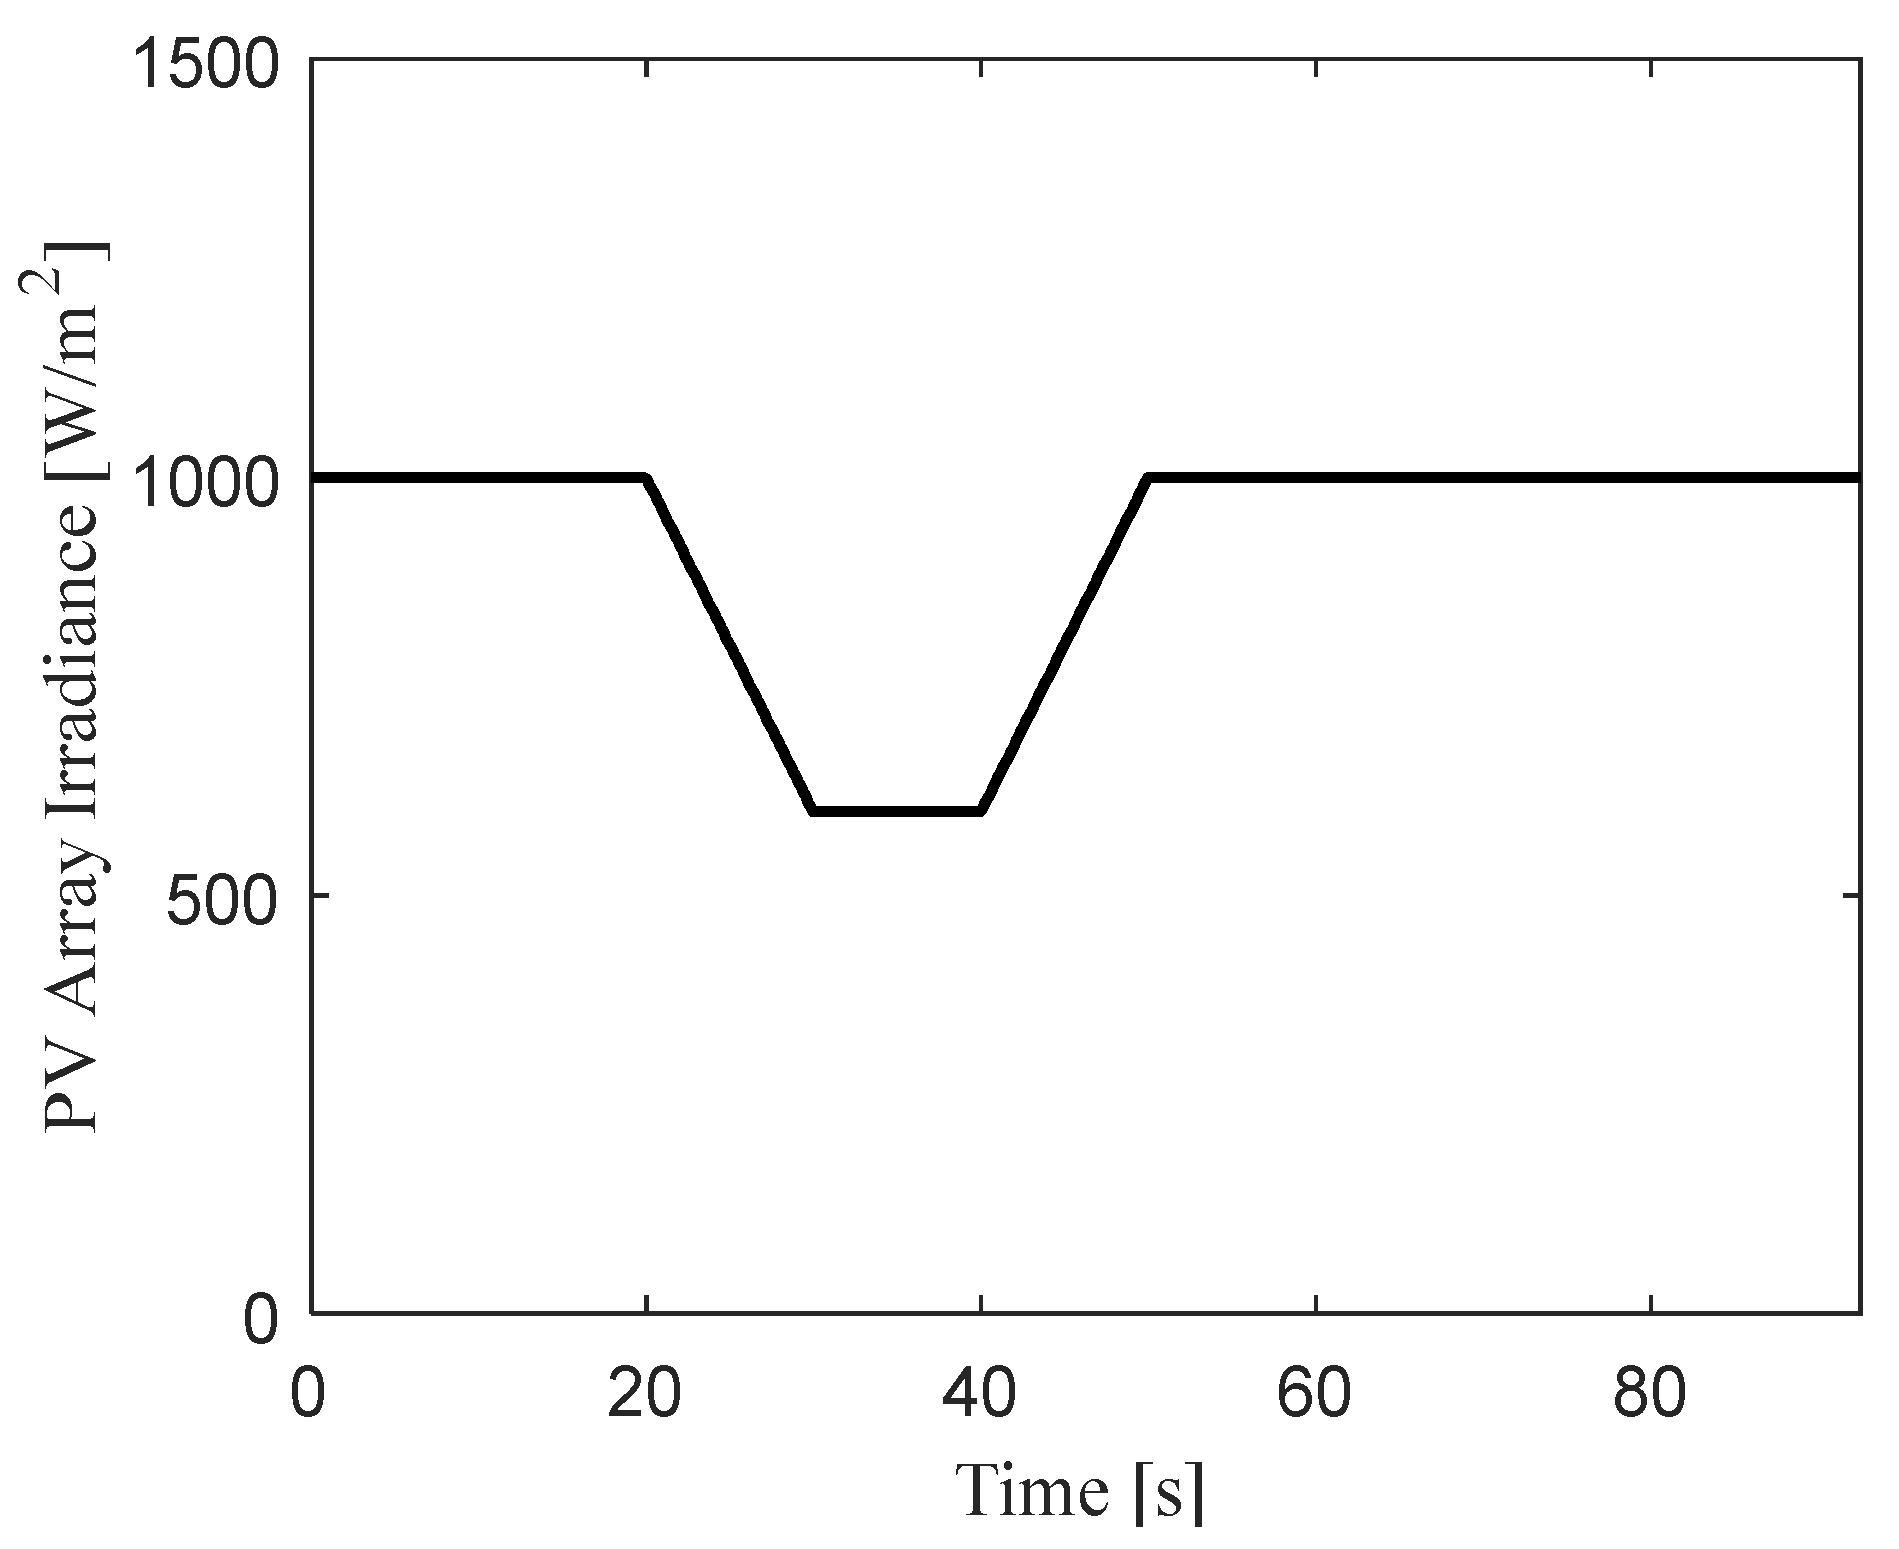
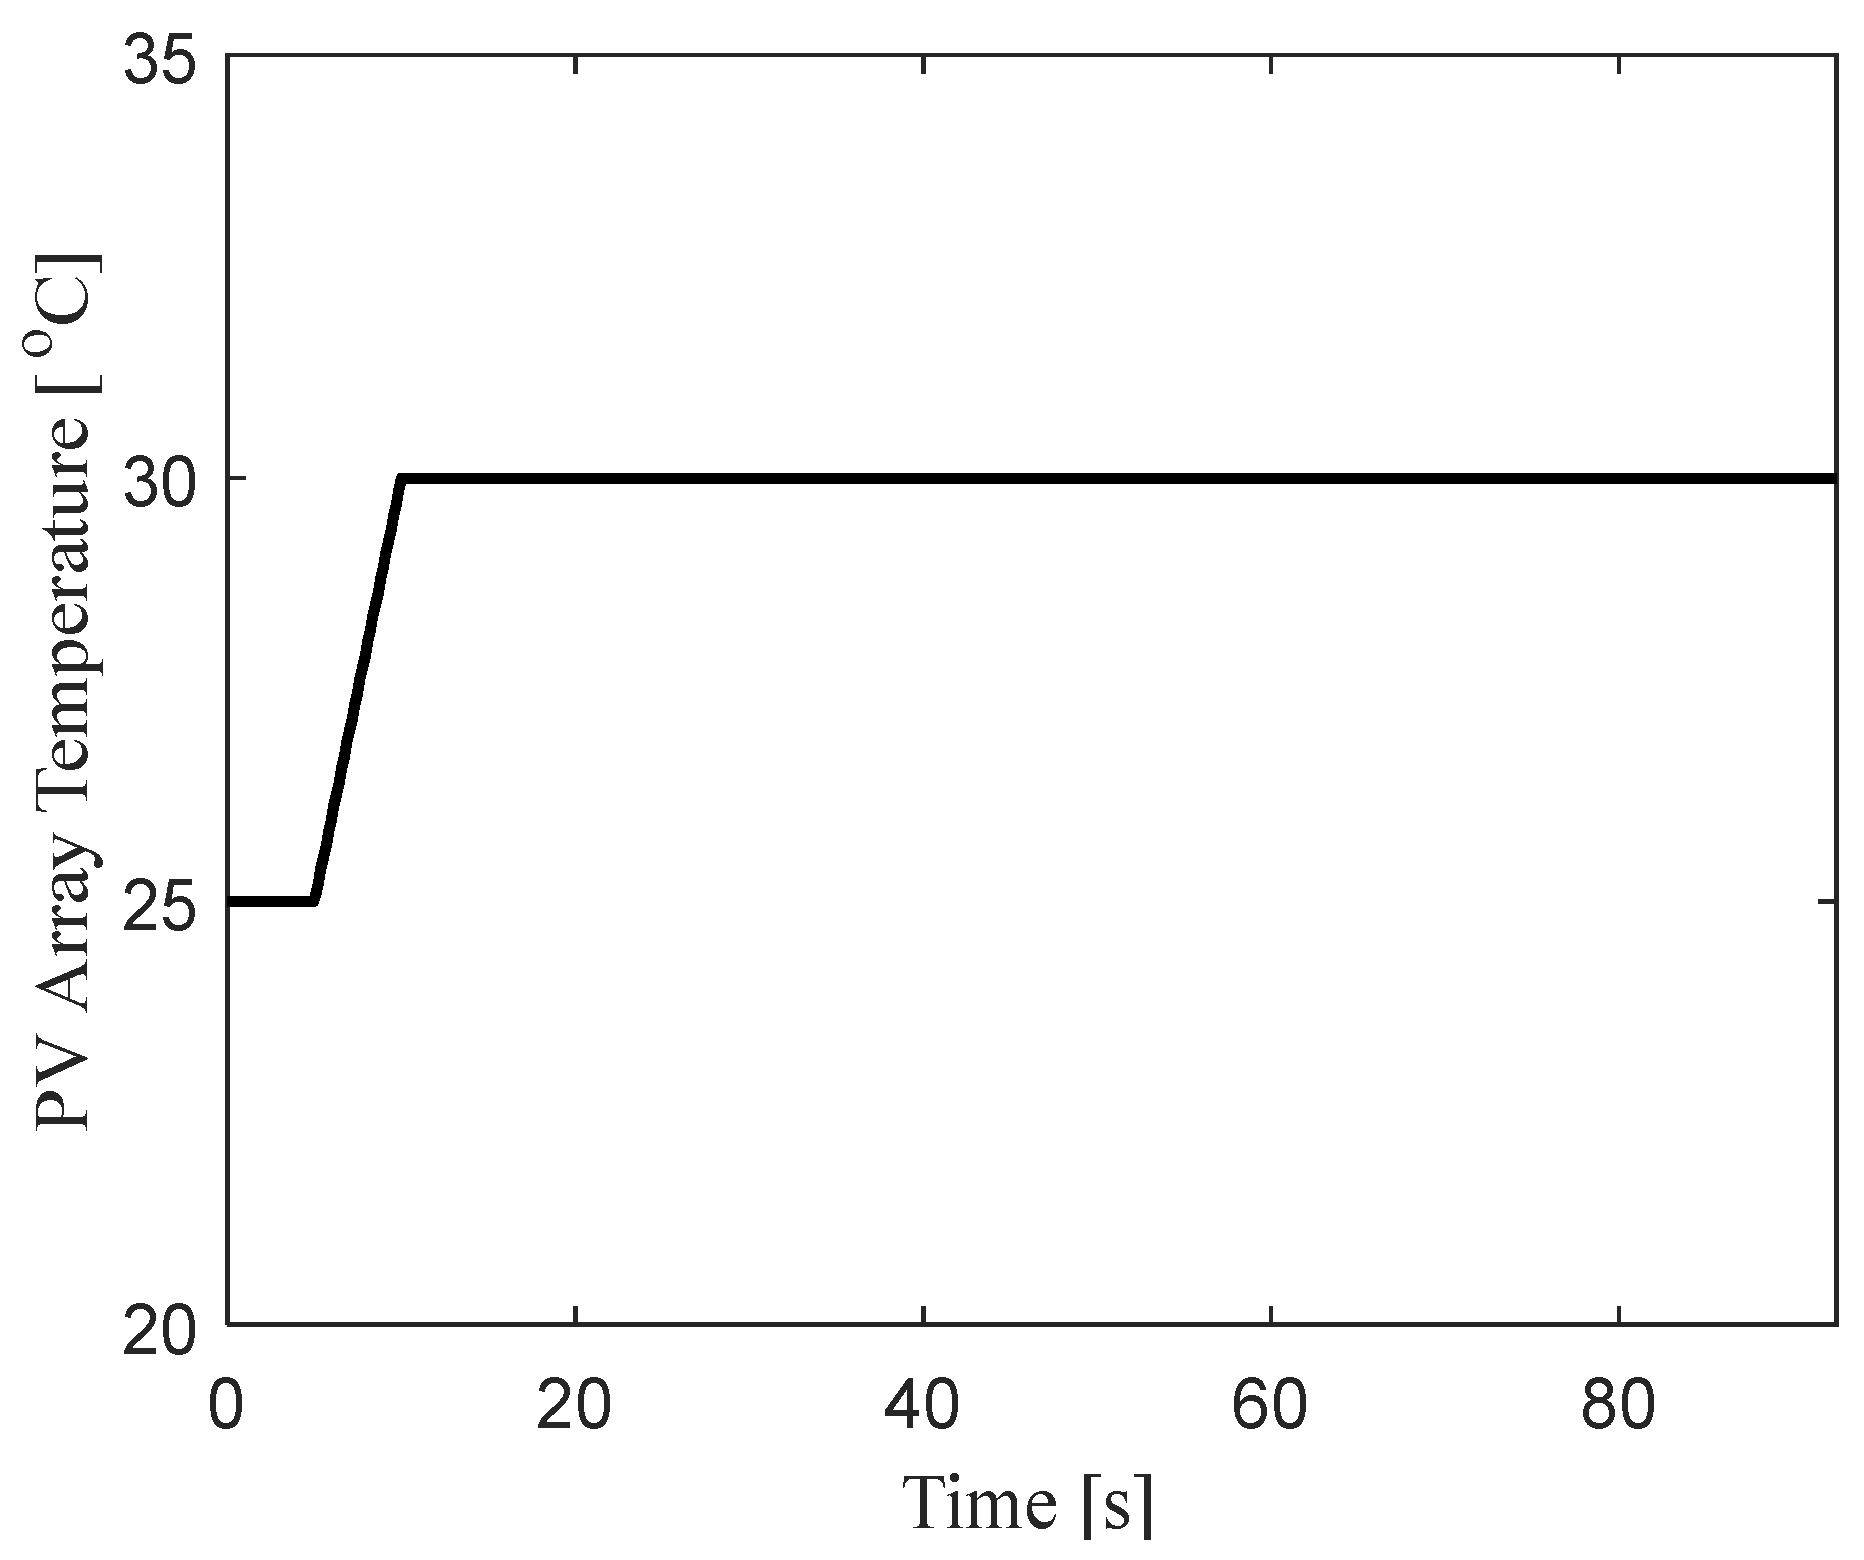
The PV irradiance and temperature conditions were varied, as shown in
Figure 8 and
Figure 9, respectively.
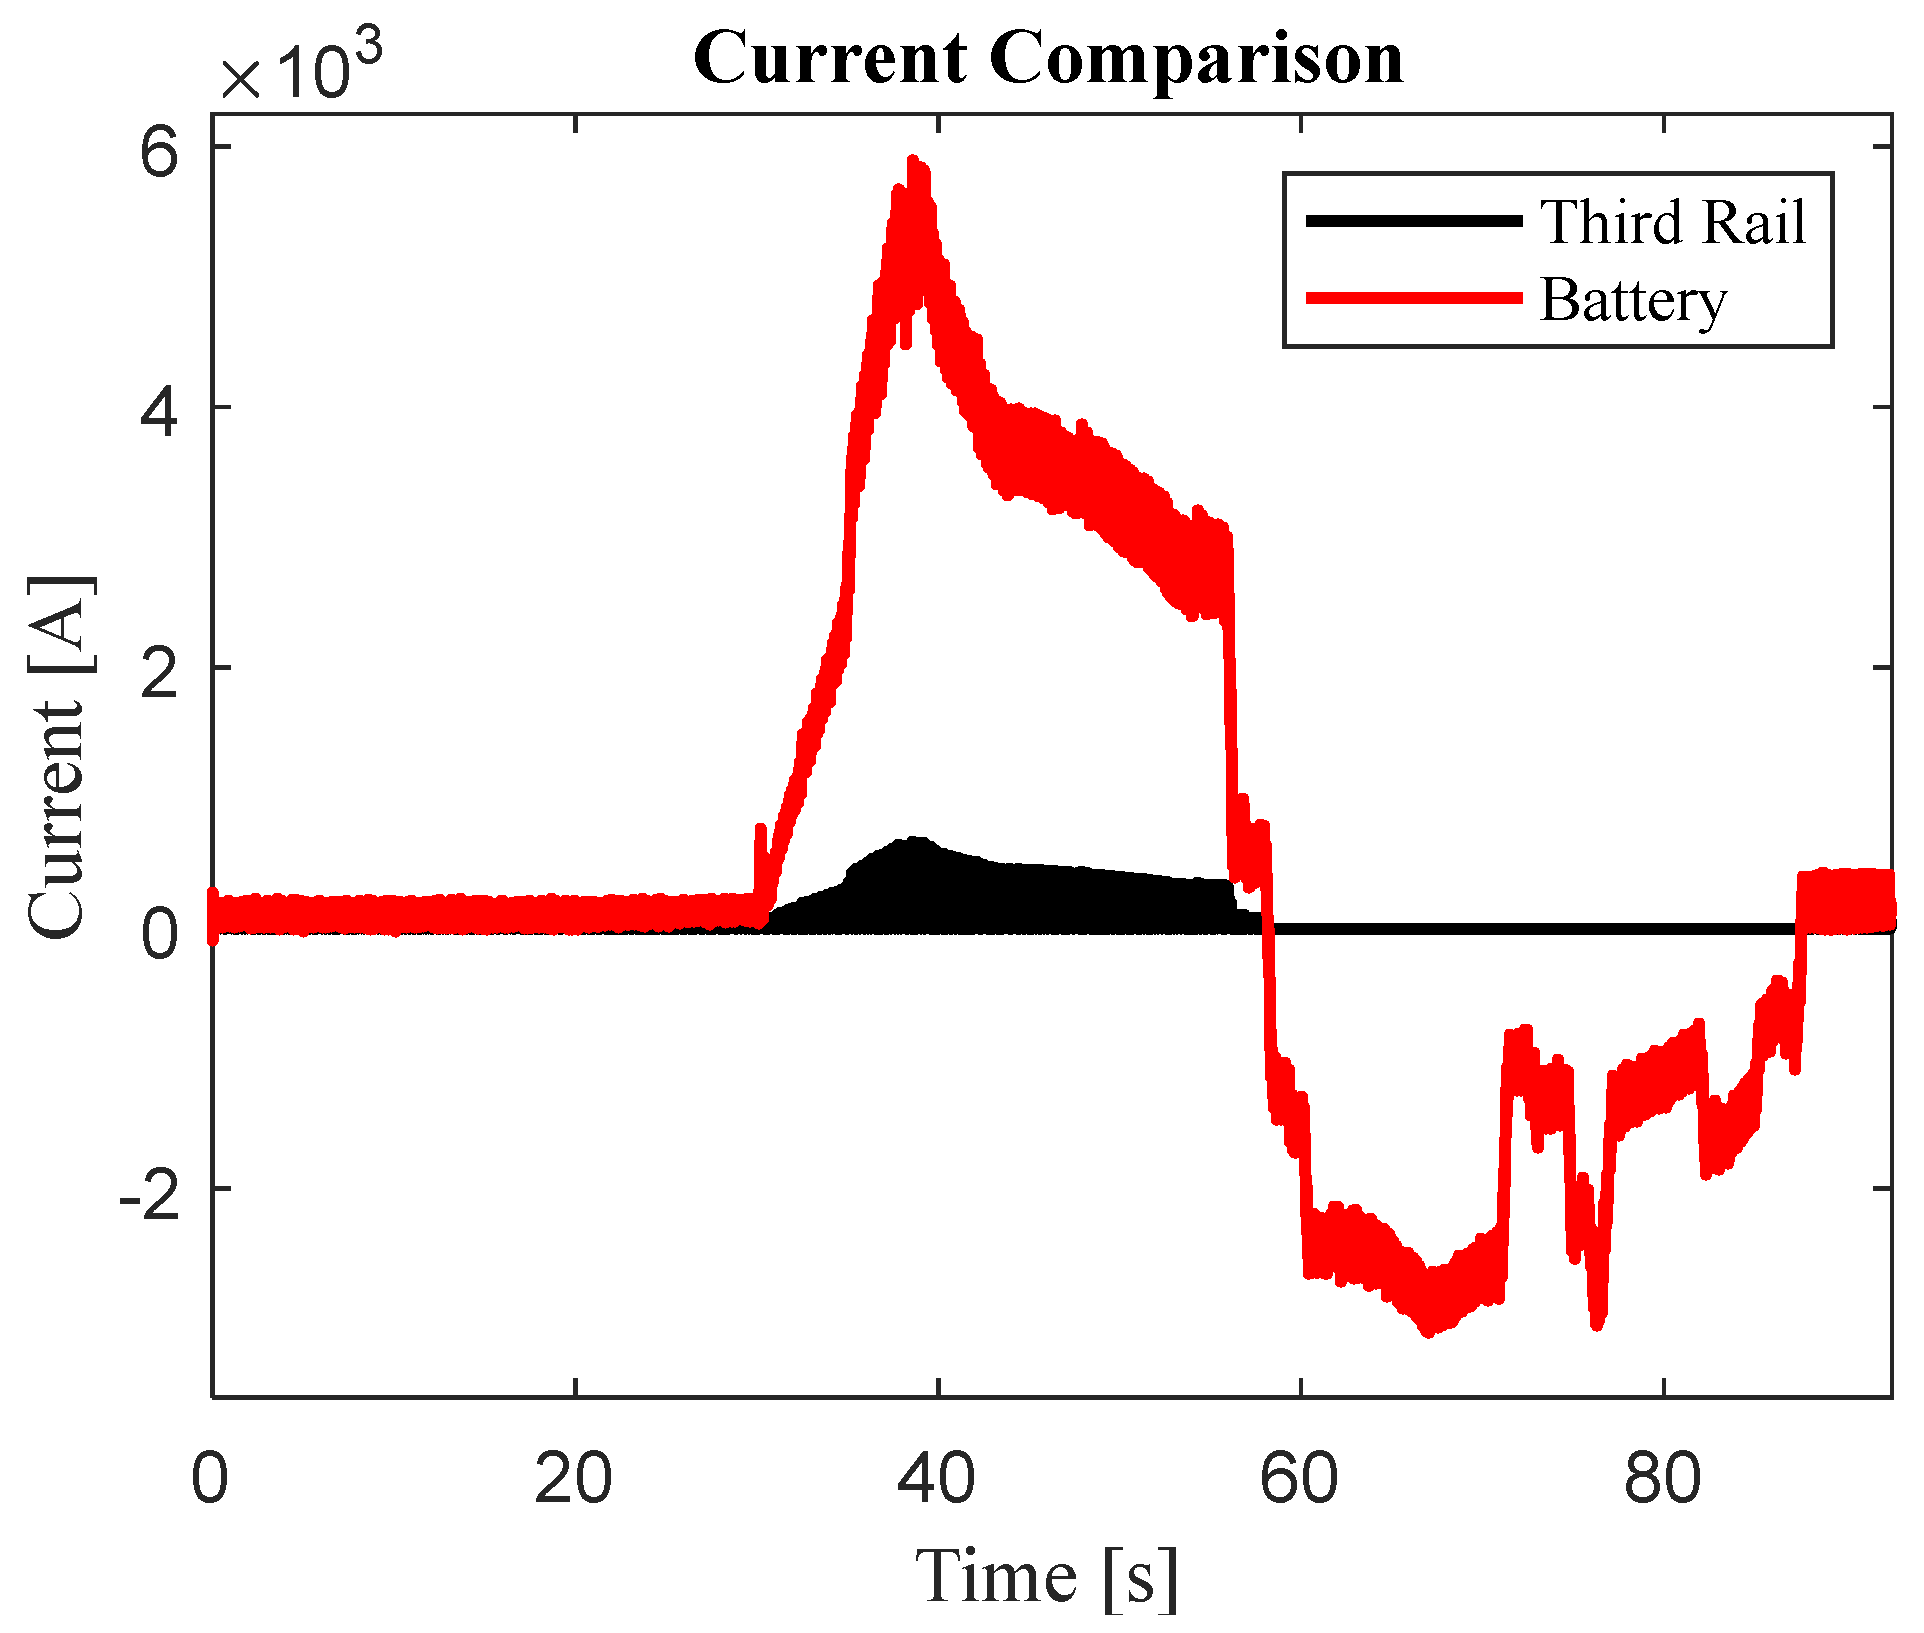
One of the main functions of the battery in this system is to act as a wayside ESS for the train. The train departs from the station, typically accelerating at a rate of around 2.5 mph/s. This results in a large draw of current/power that normally leads to a dip in the DC bus and third rail voltage. The battery needs to discharge current during this time. Furthermore, a train approaching a station typically decelerates at a rate of around −3 mph/s. This results in a large impulse of current, injected into the third rail in about 30 s. If not captured in a timely fashion, the voltage rises and the onboard protection system disconnects the train electrically. The battery will help regulate the voltage, such that it provides current when the train is accelerating. Ideally, the battery current profile resembles the train’s demand, as shown in
Figure 10. It can also be seen that a majority of the current is supplied from the battery now, rather than the third rail.
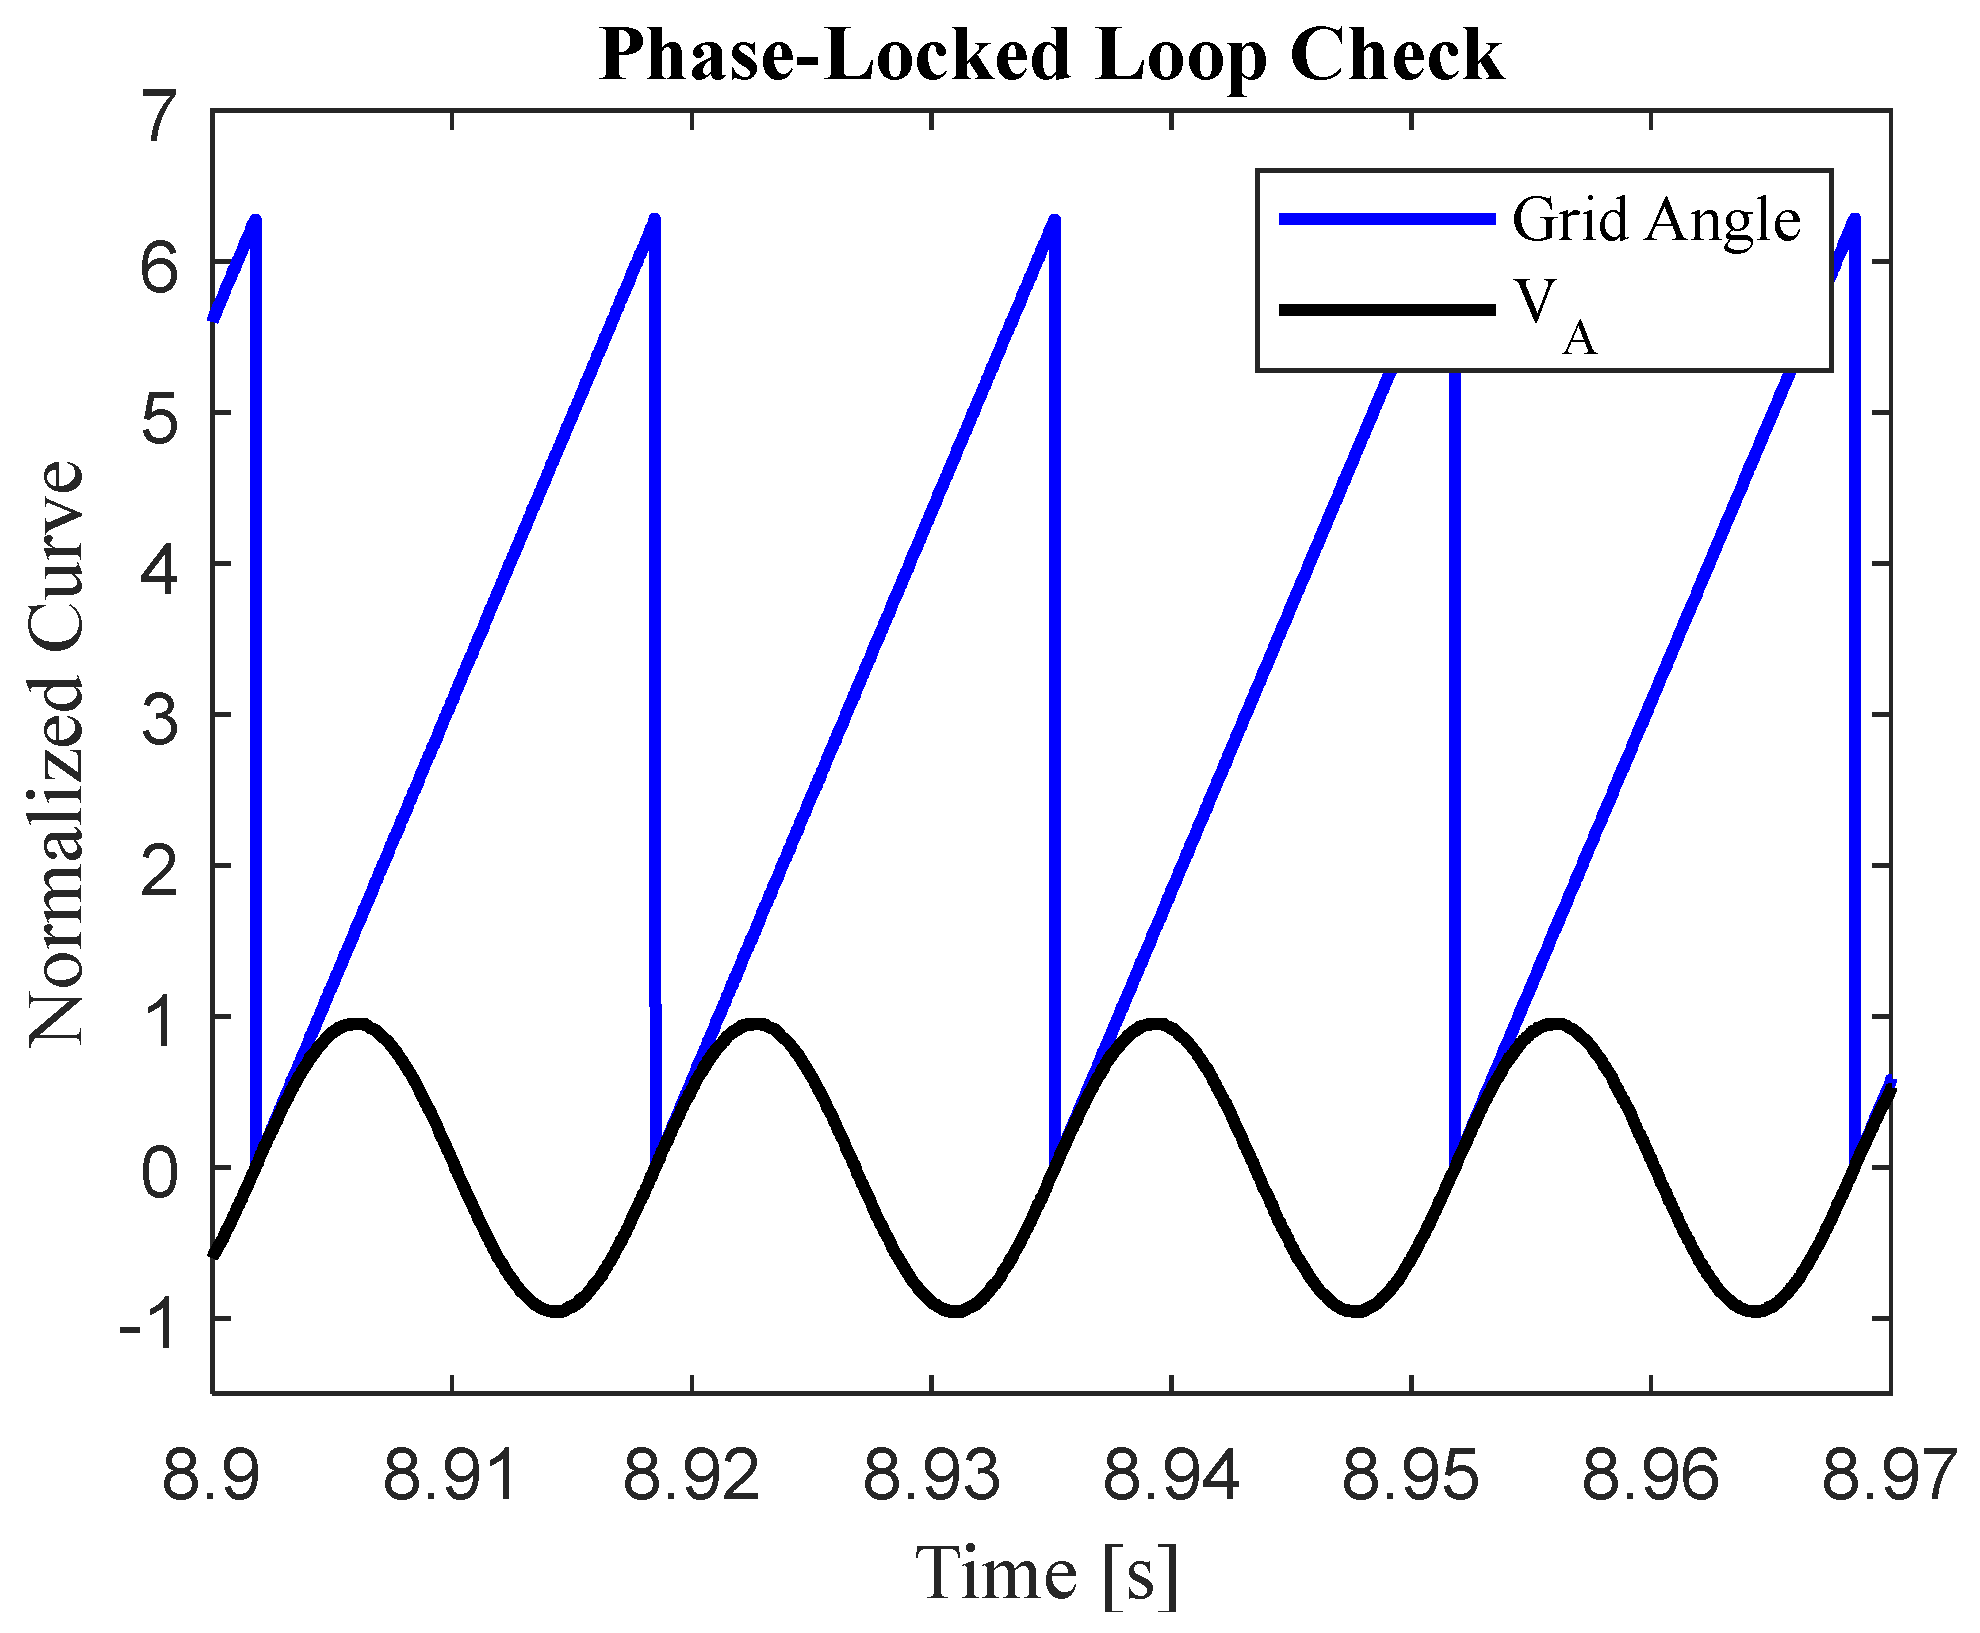
Figure 11 depicts the performance of the PLL. It can be seen that the PLL is able to accurately detect the grid phase angle. This information is fed to the controller to solve Park’s transformation equations.
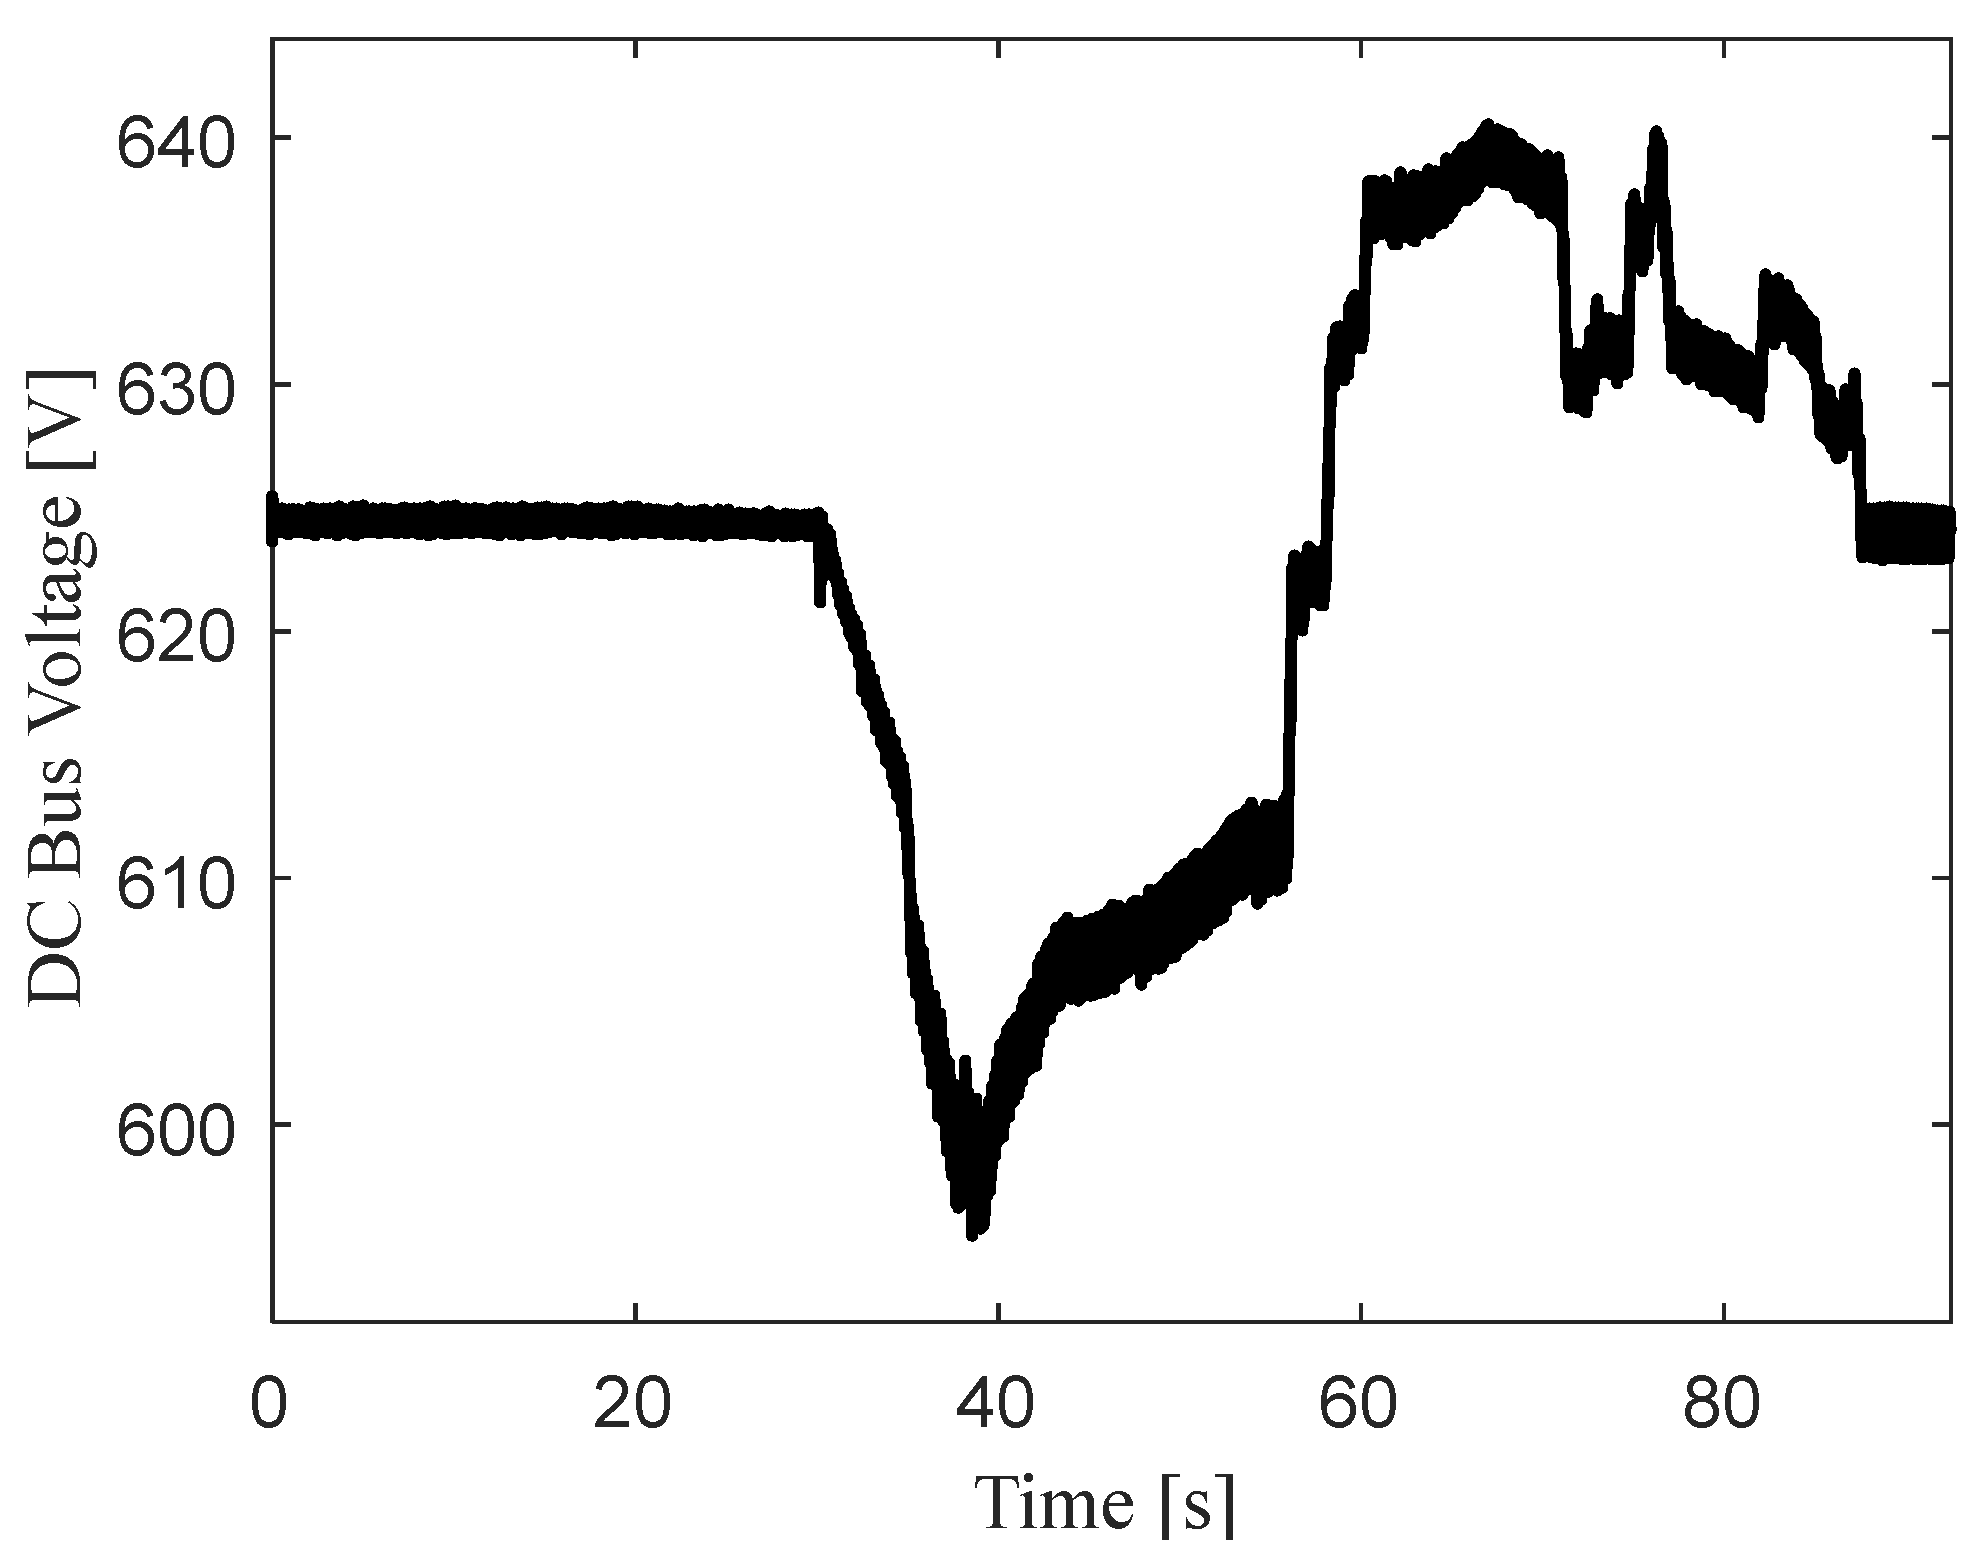
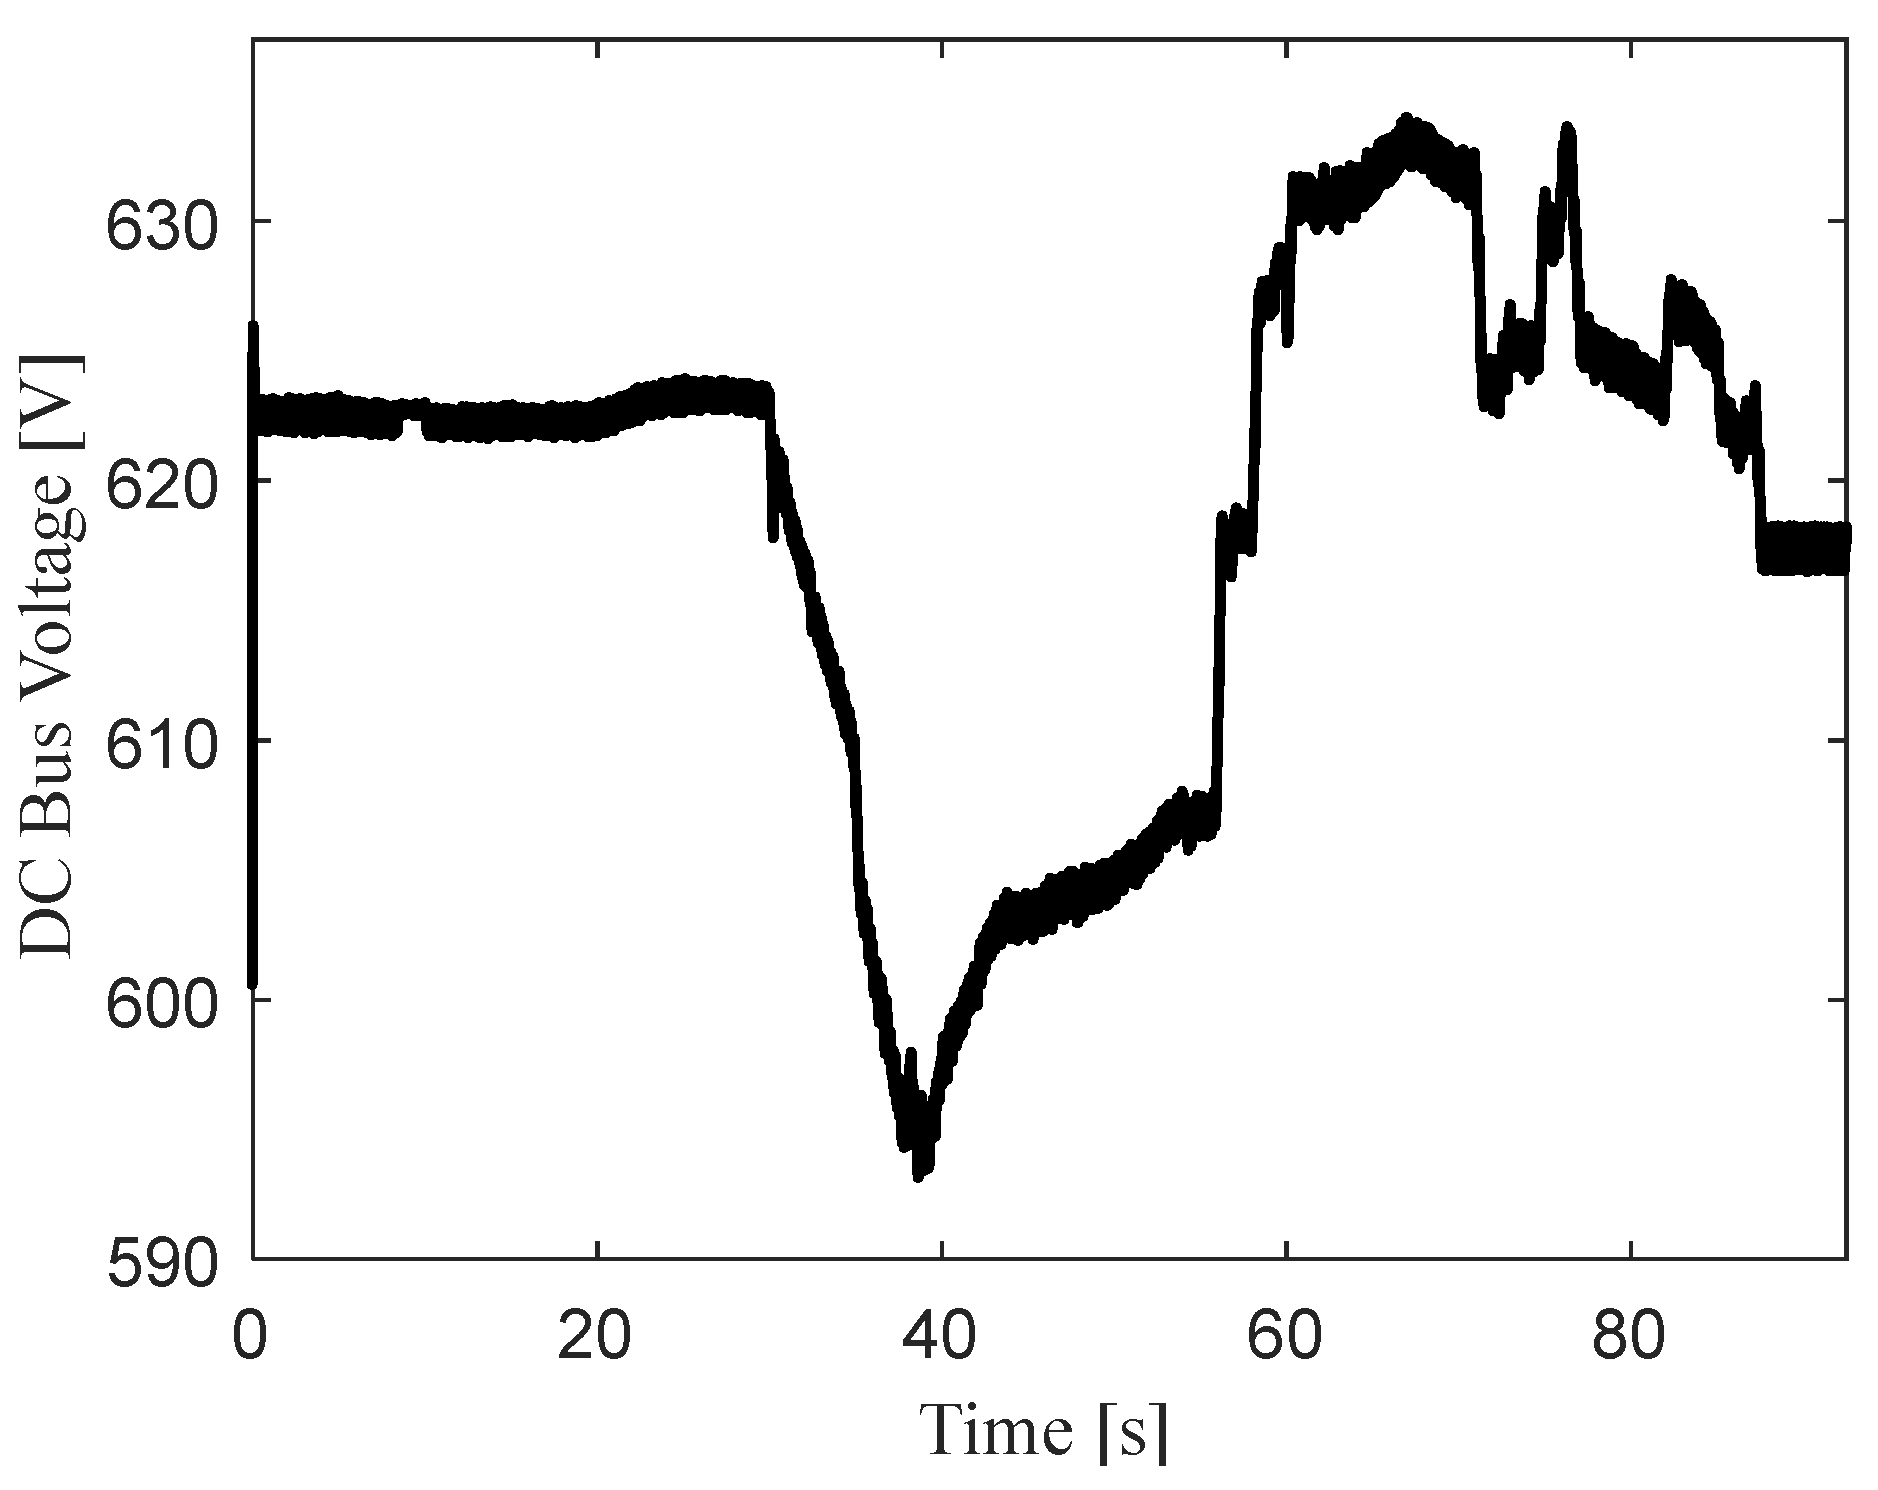
Figure 12 shows the voltage of the common DC bus. It can be seen that the voltage is maintained within about 595-V to 640-V. This range is acceptable, both for the operation of the PV, ESS, and EV, and to enable maximum recuperation of the train’s regenerative braking energy. As expected, the voltage dips significantly at around 30 s, when the train begins to accelerate. The voltage dip is detected and the battery discharges power to help regulate the DC bus voltage. The dip ends when the train reaches its maximum speed. At about 58 s, the voltage starts to rise, when the train is decelerating into the station. The battery charges during this time to capture regenerative braking energy, while still regulating the bus voltage.
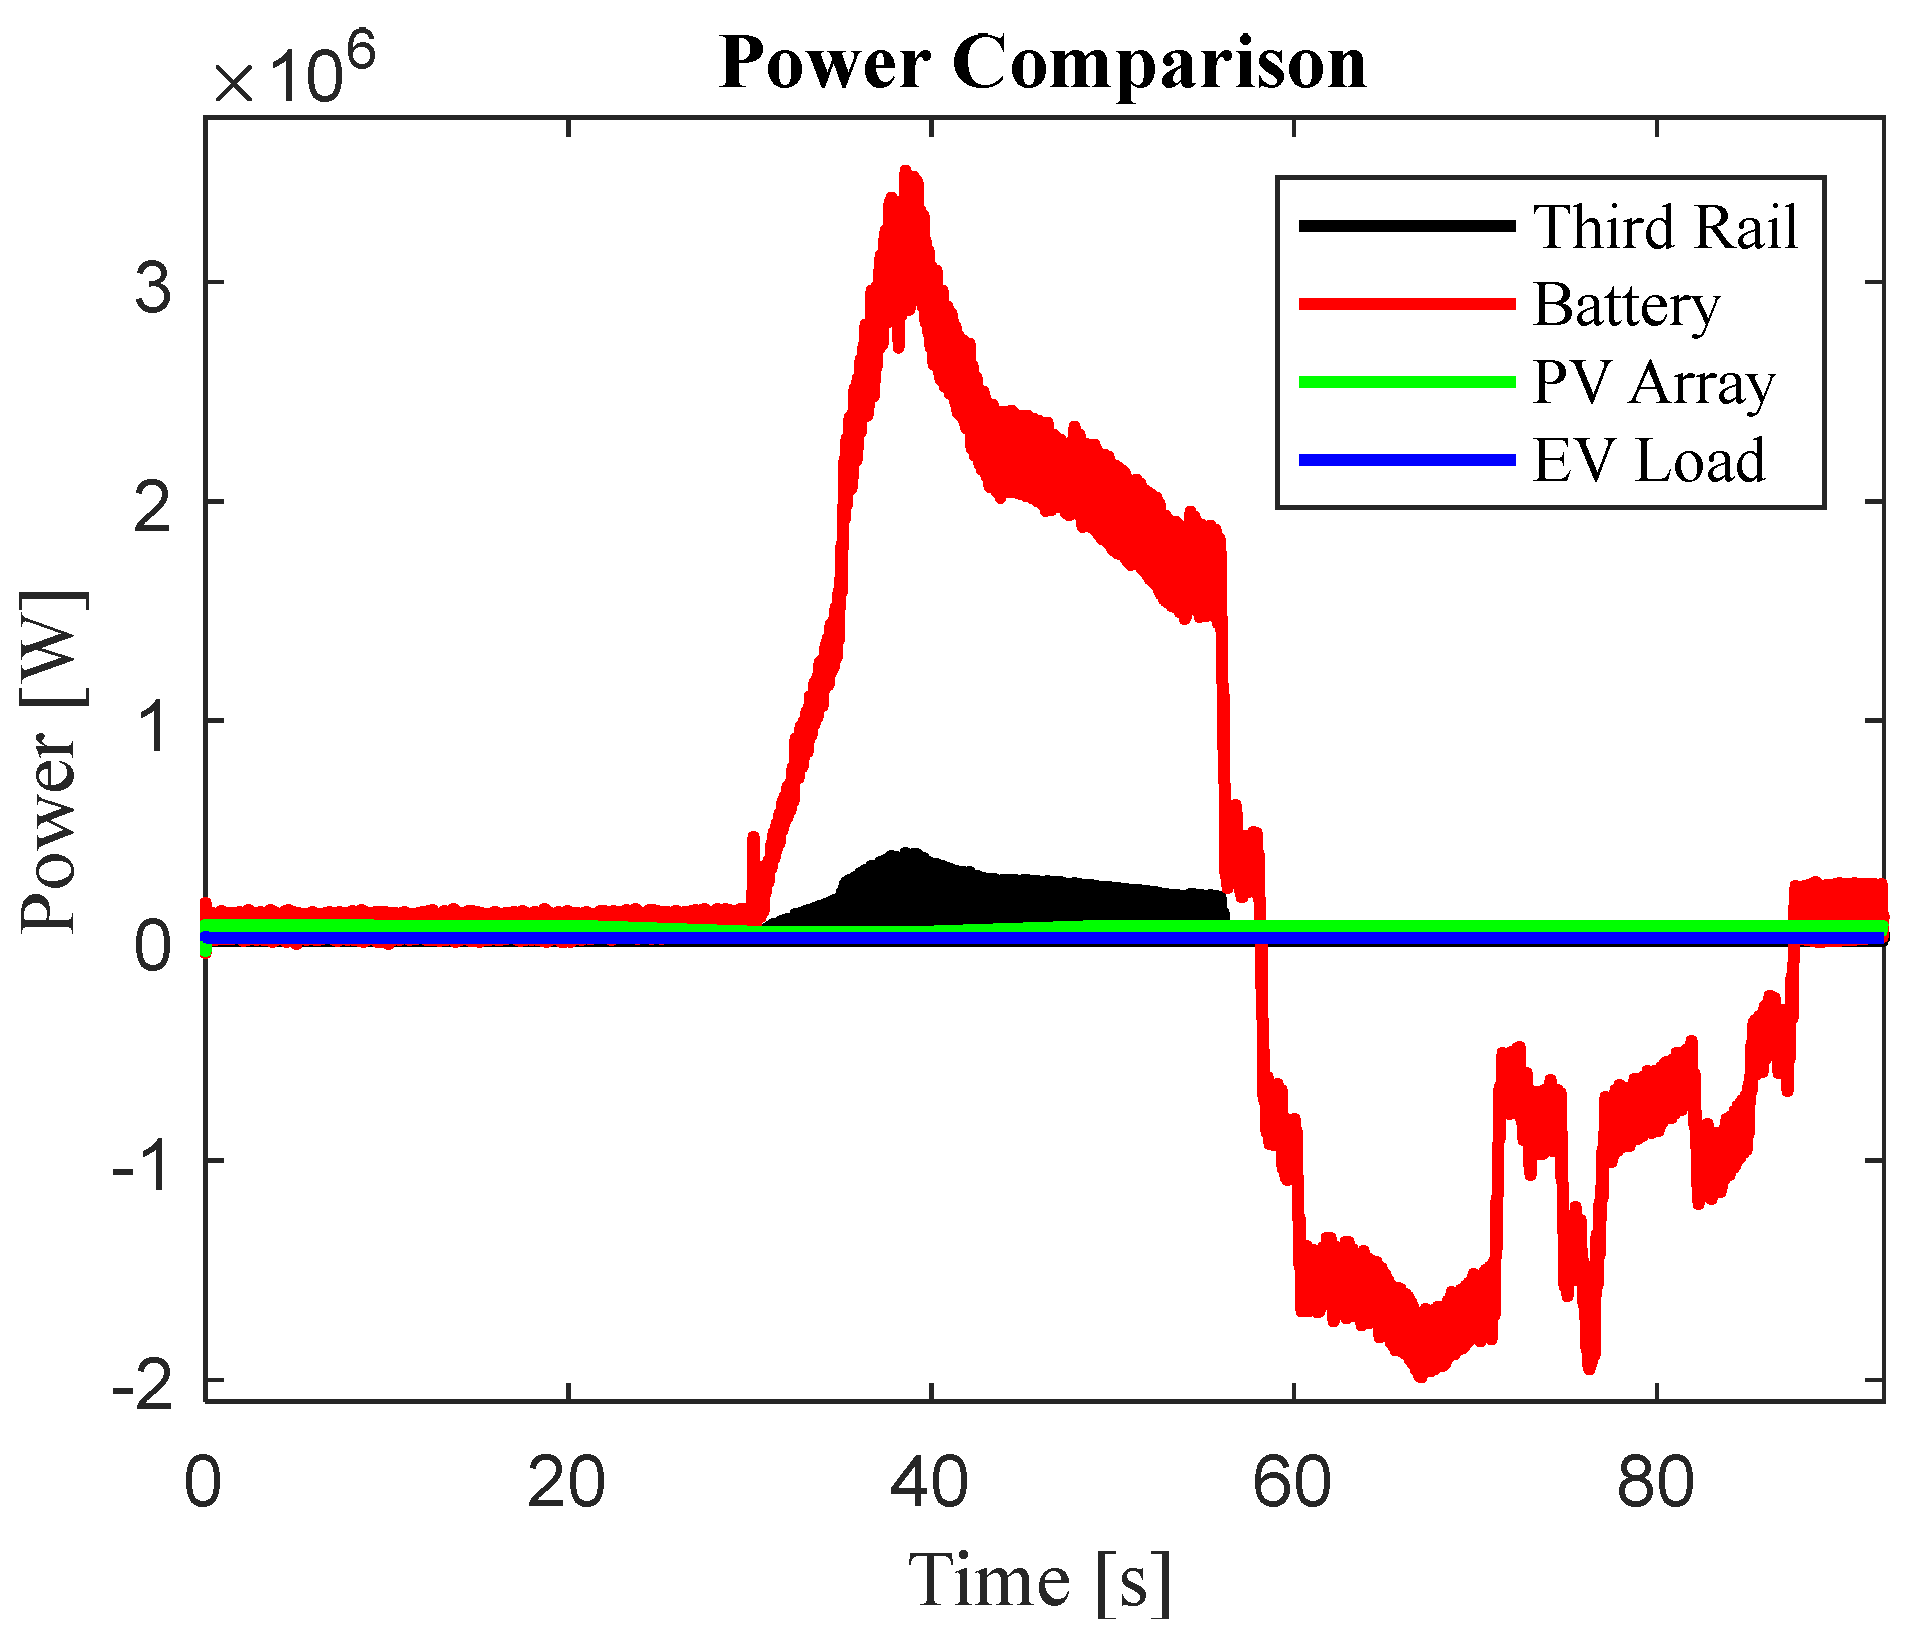
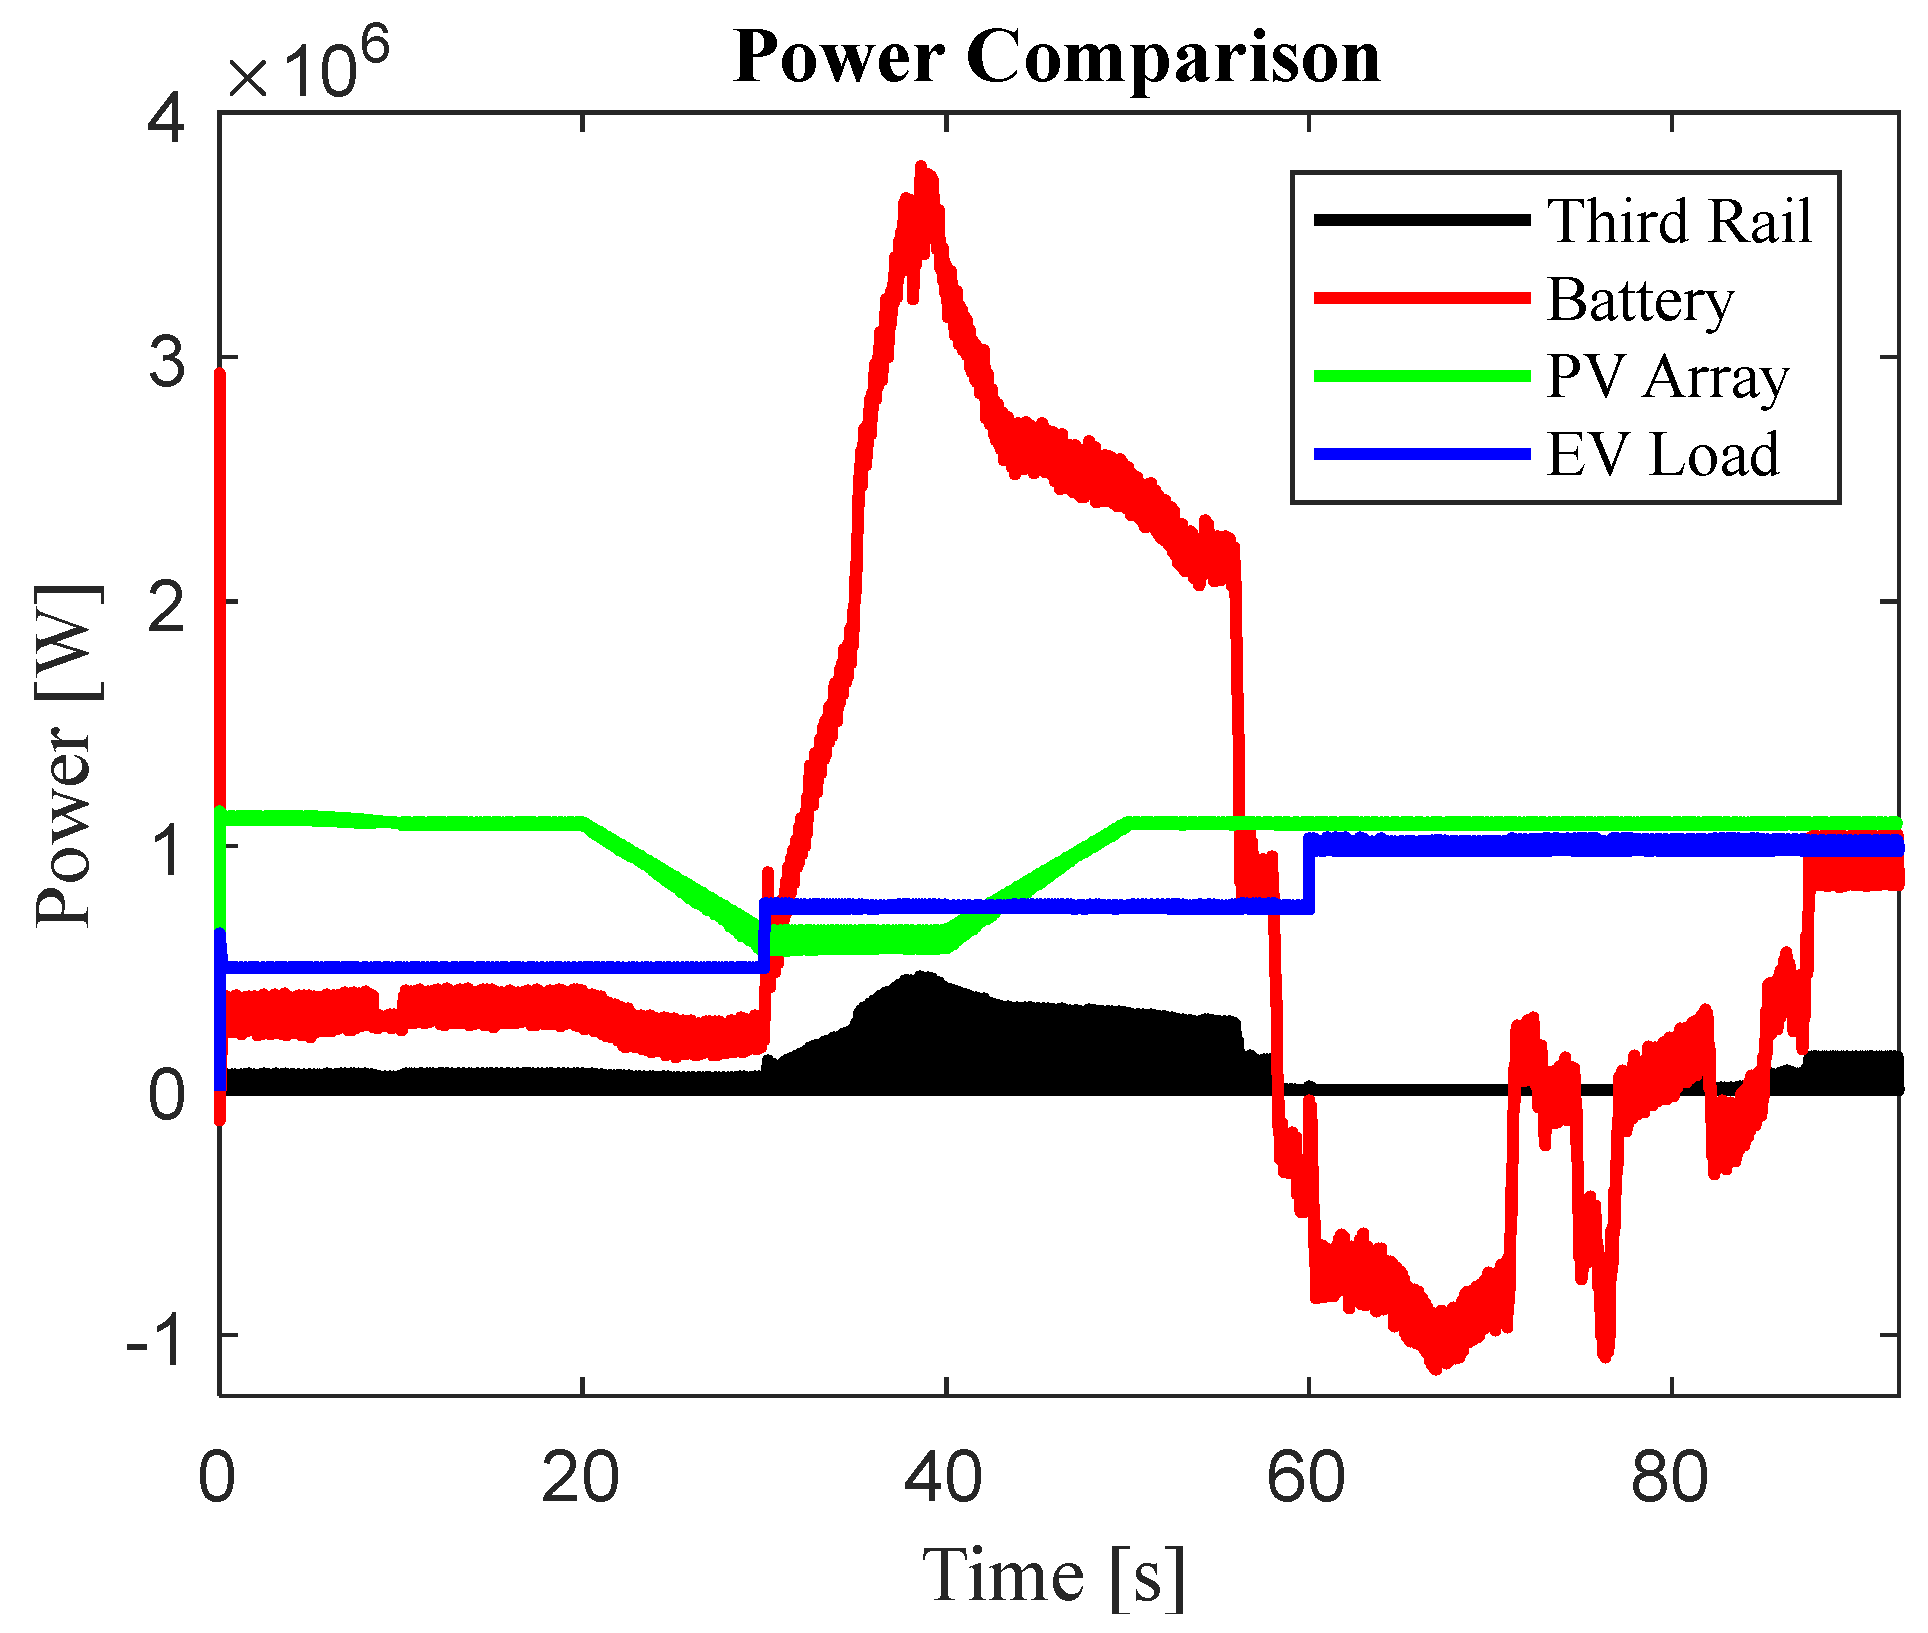
Figure 13 provides a more detailed description of the power response for the various elements. It can be seen that the battery behavior changes from discharging to charging, corresponding to the train’s movement, with minimal intervention from the substation (denoted “Third Rail” power), and that the EV load and PV power are unaffected throughout these train power variations.
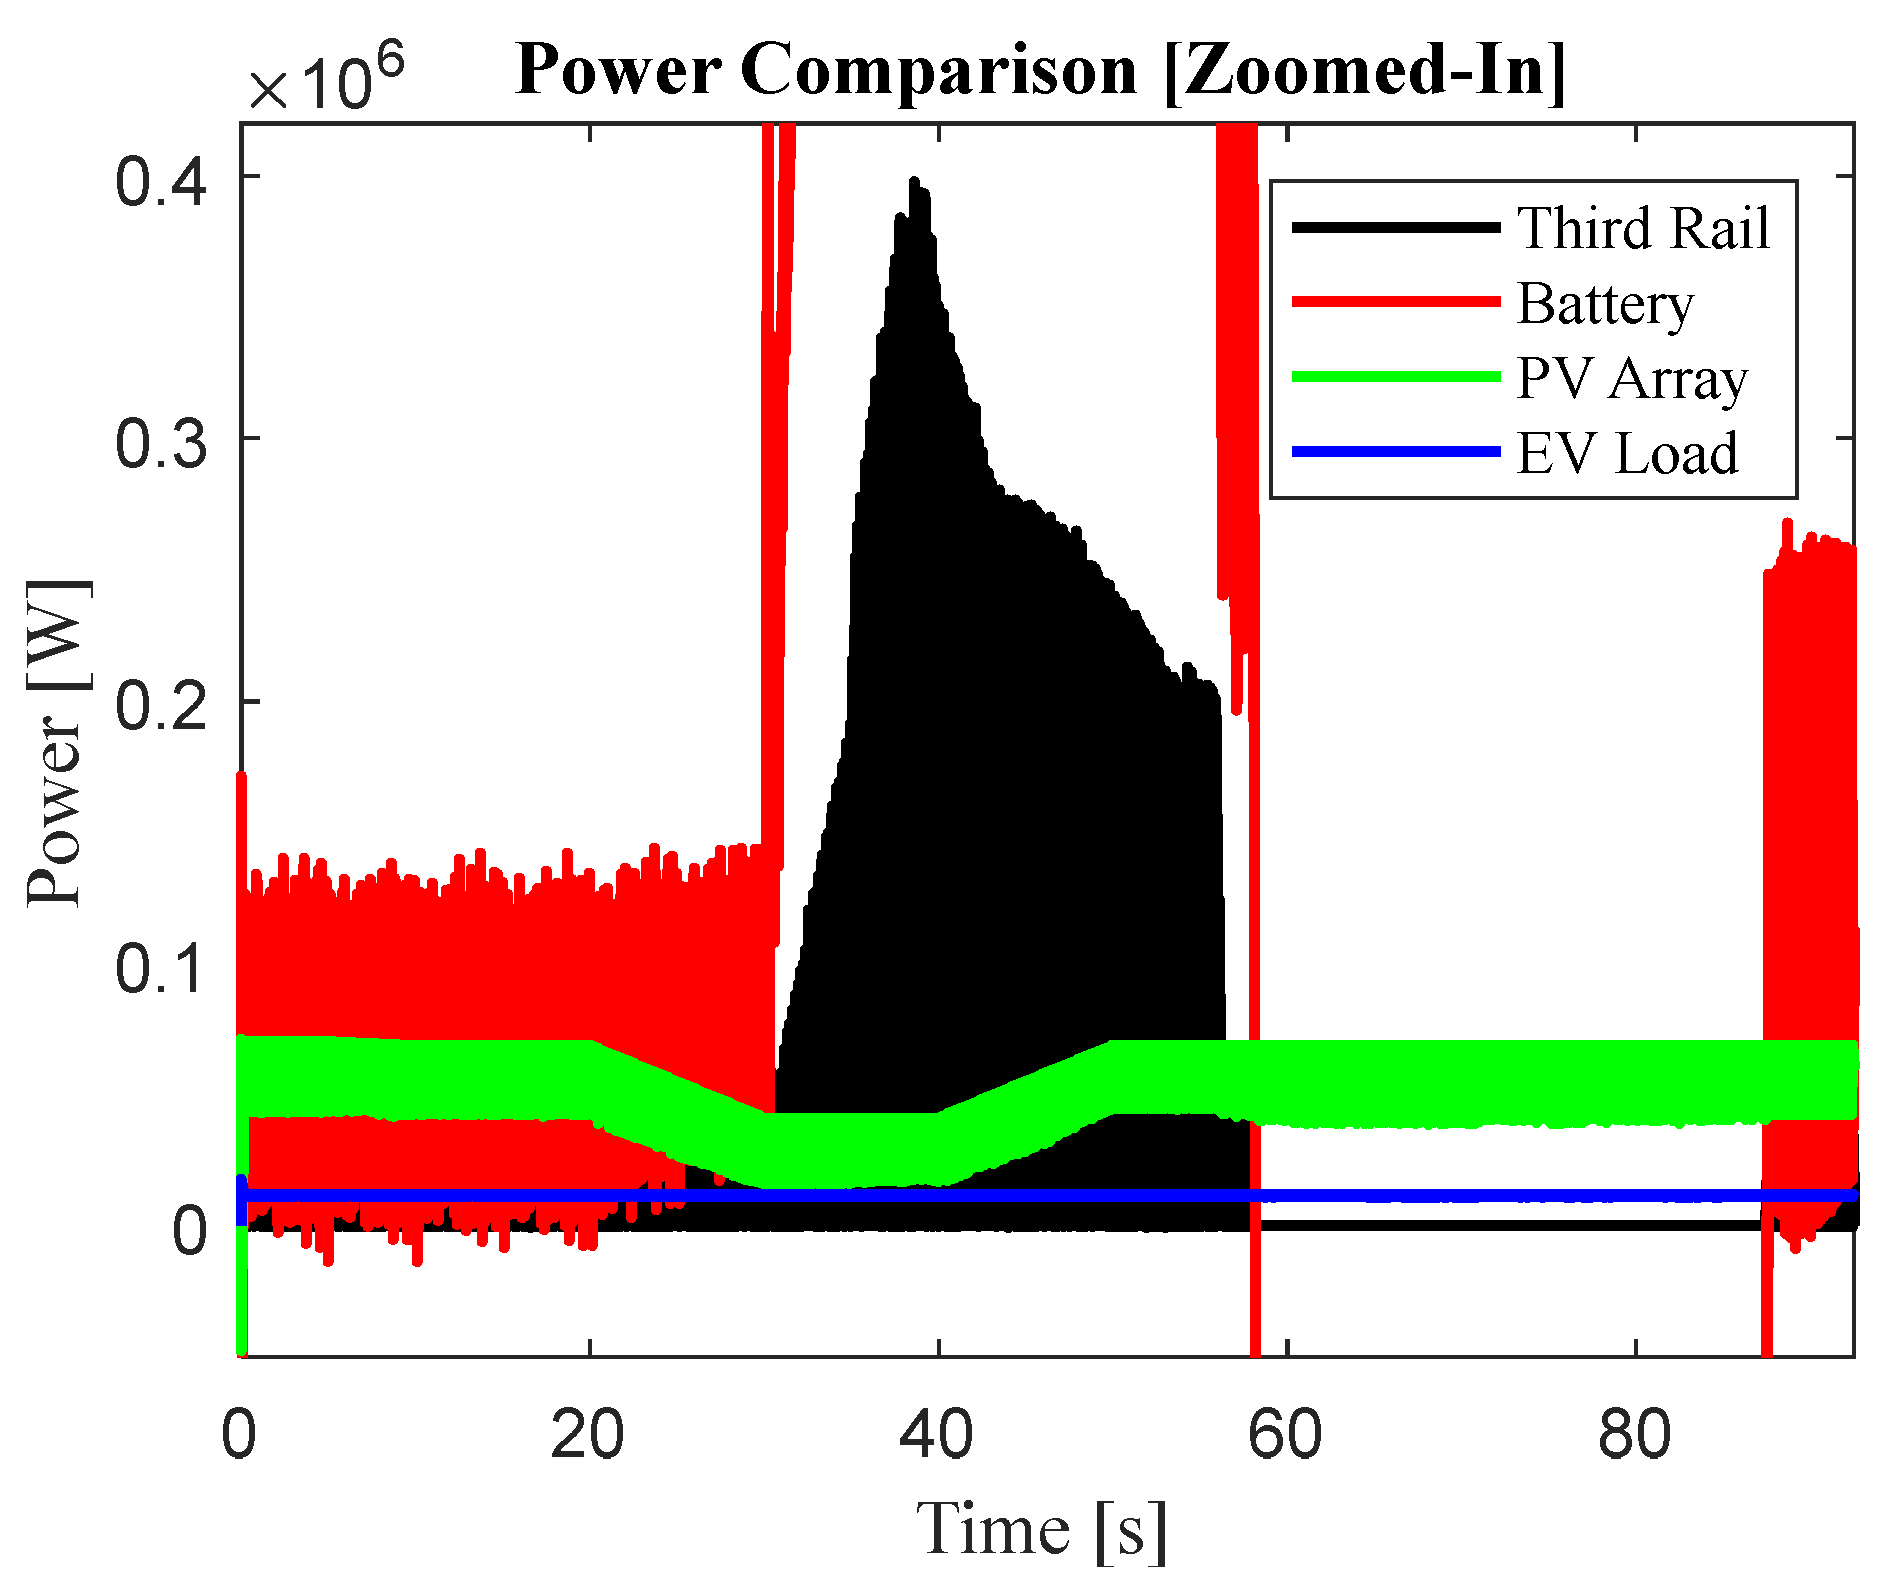
Figure 14 provides a magnified view of
Figure 13. It can be seen that the PV power dips and rises as expected, with regards to the solar radiation and temperature changes, and the EV power remains constant, with the system always providing the sufficient amount of power, according to charging demand.
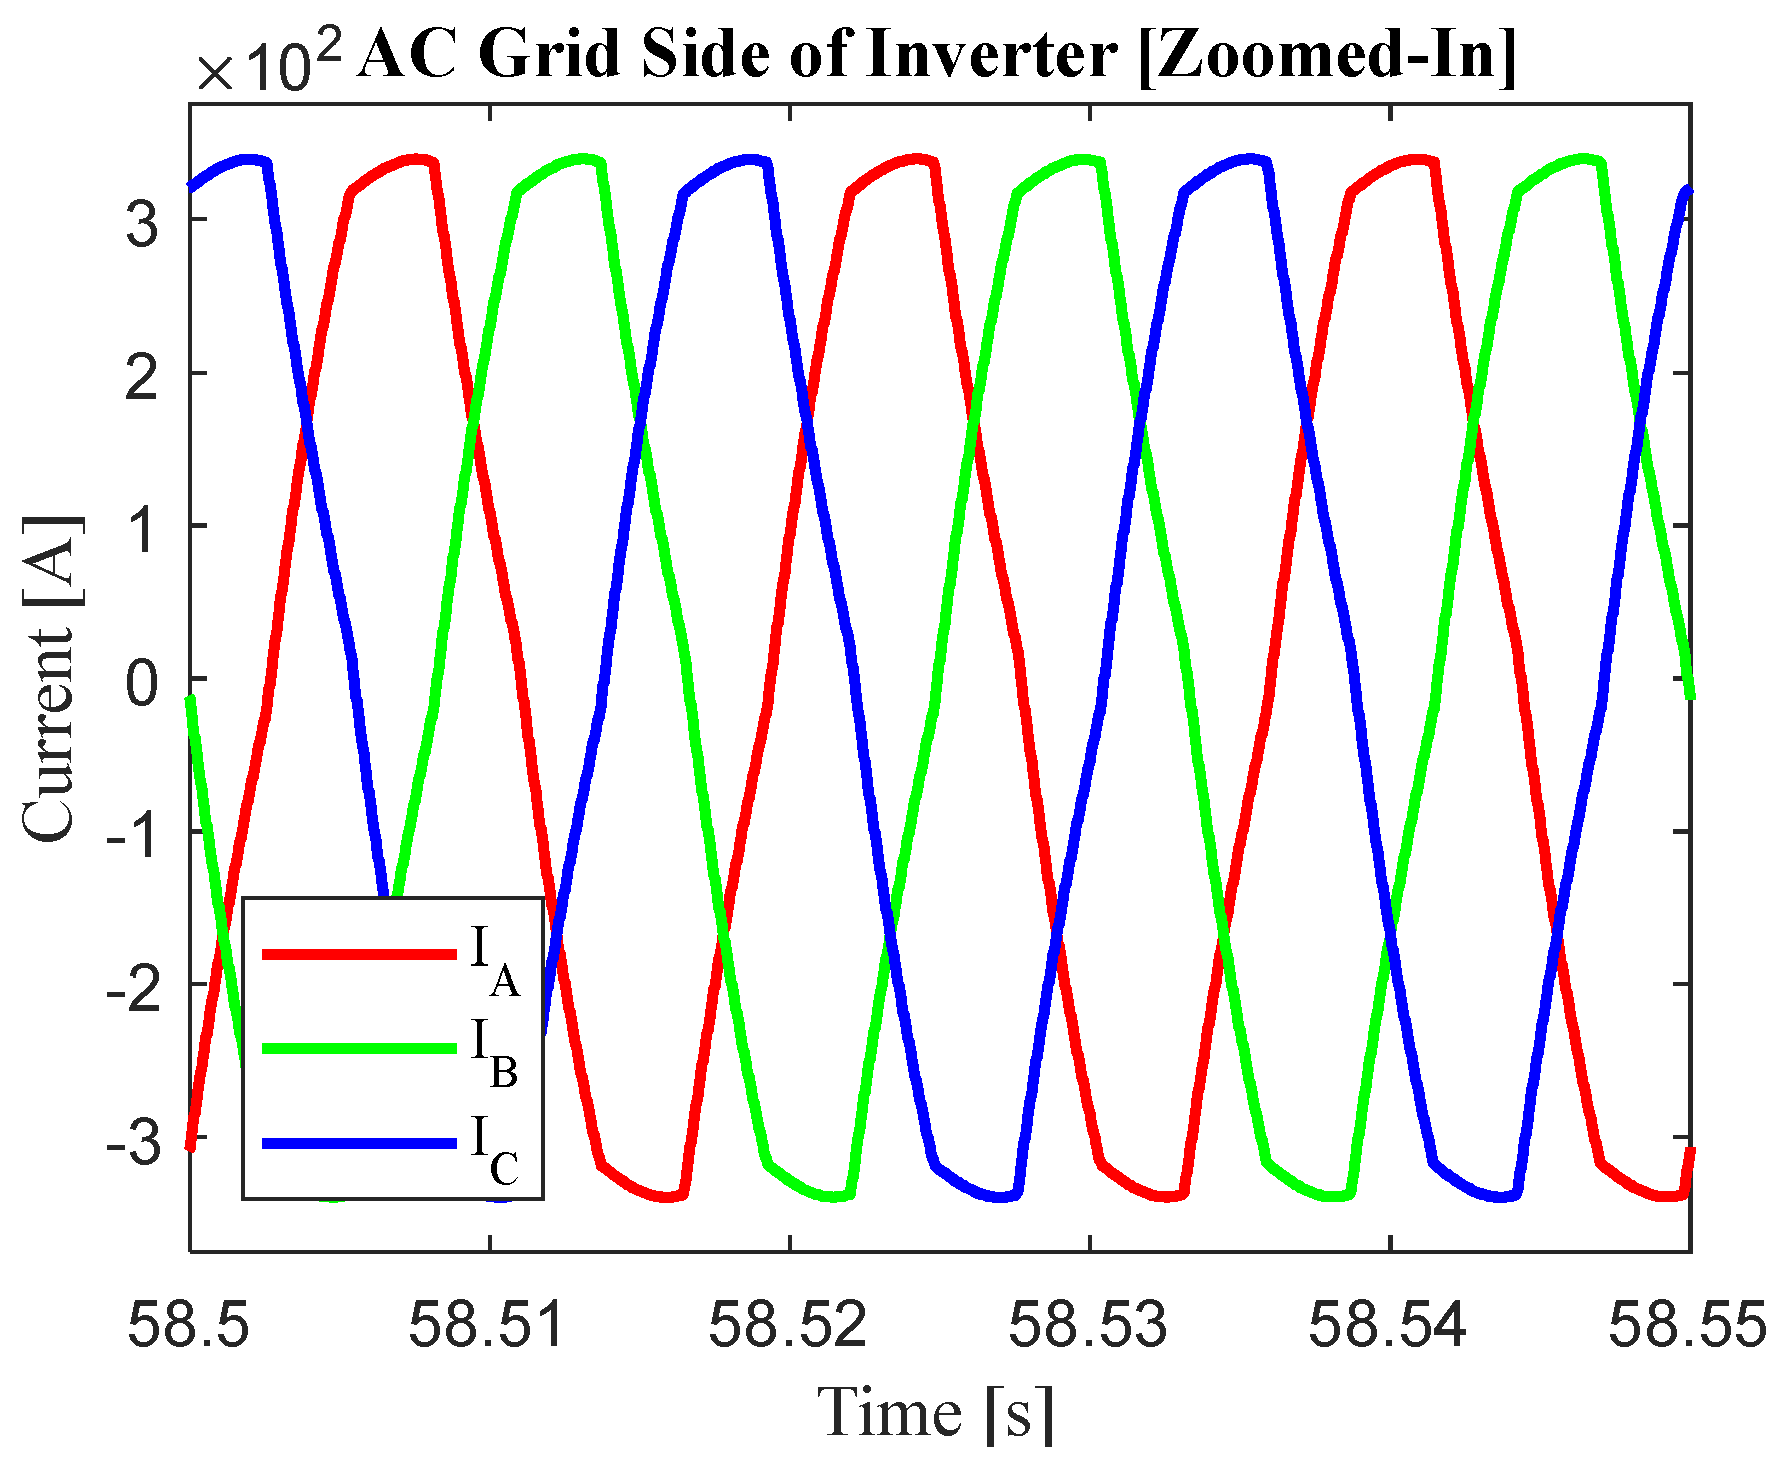
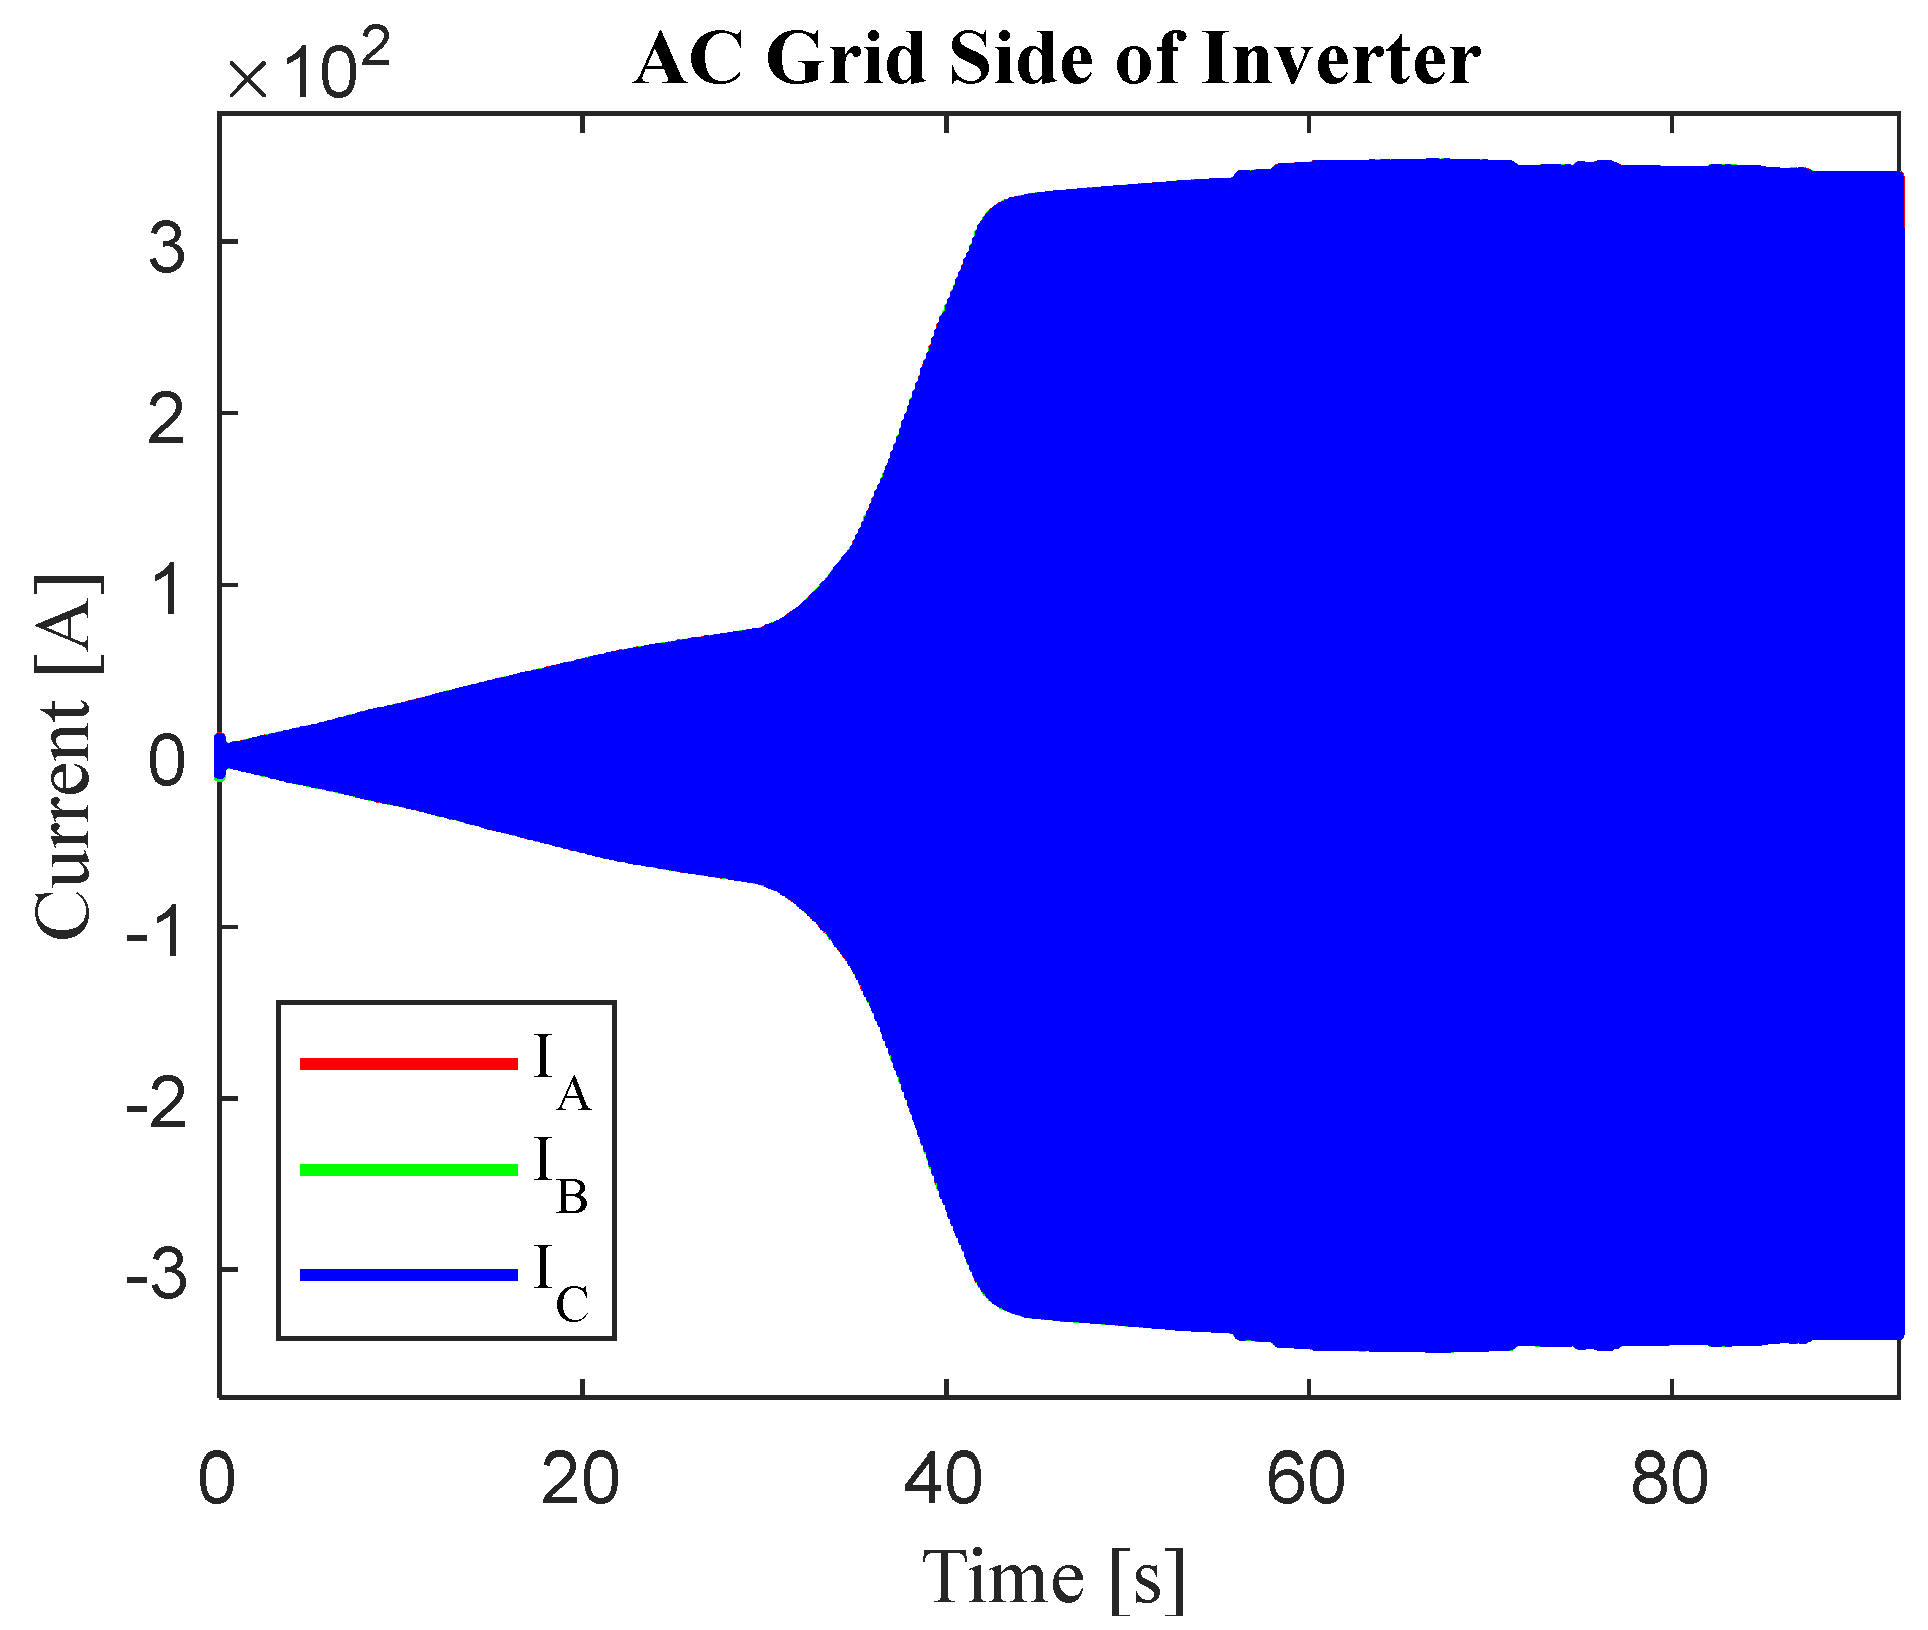
As previously mentioned, the proposed microgrid solution and included inverter provide a reversible path for energy, back into the utility grid.
Figure 15 shows current profiles of the AC grid side of the inverter. It is seen here, that current flow through the inverter is largest when regenerative braking energy is injected into the common DC bus.
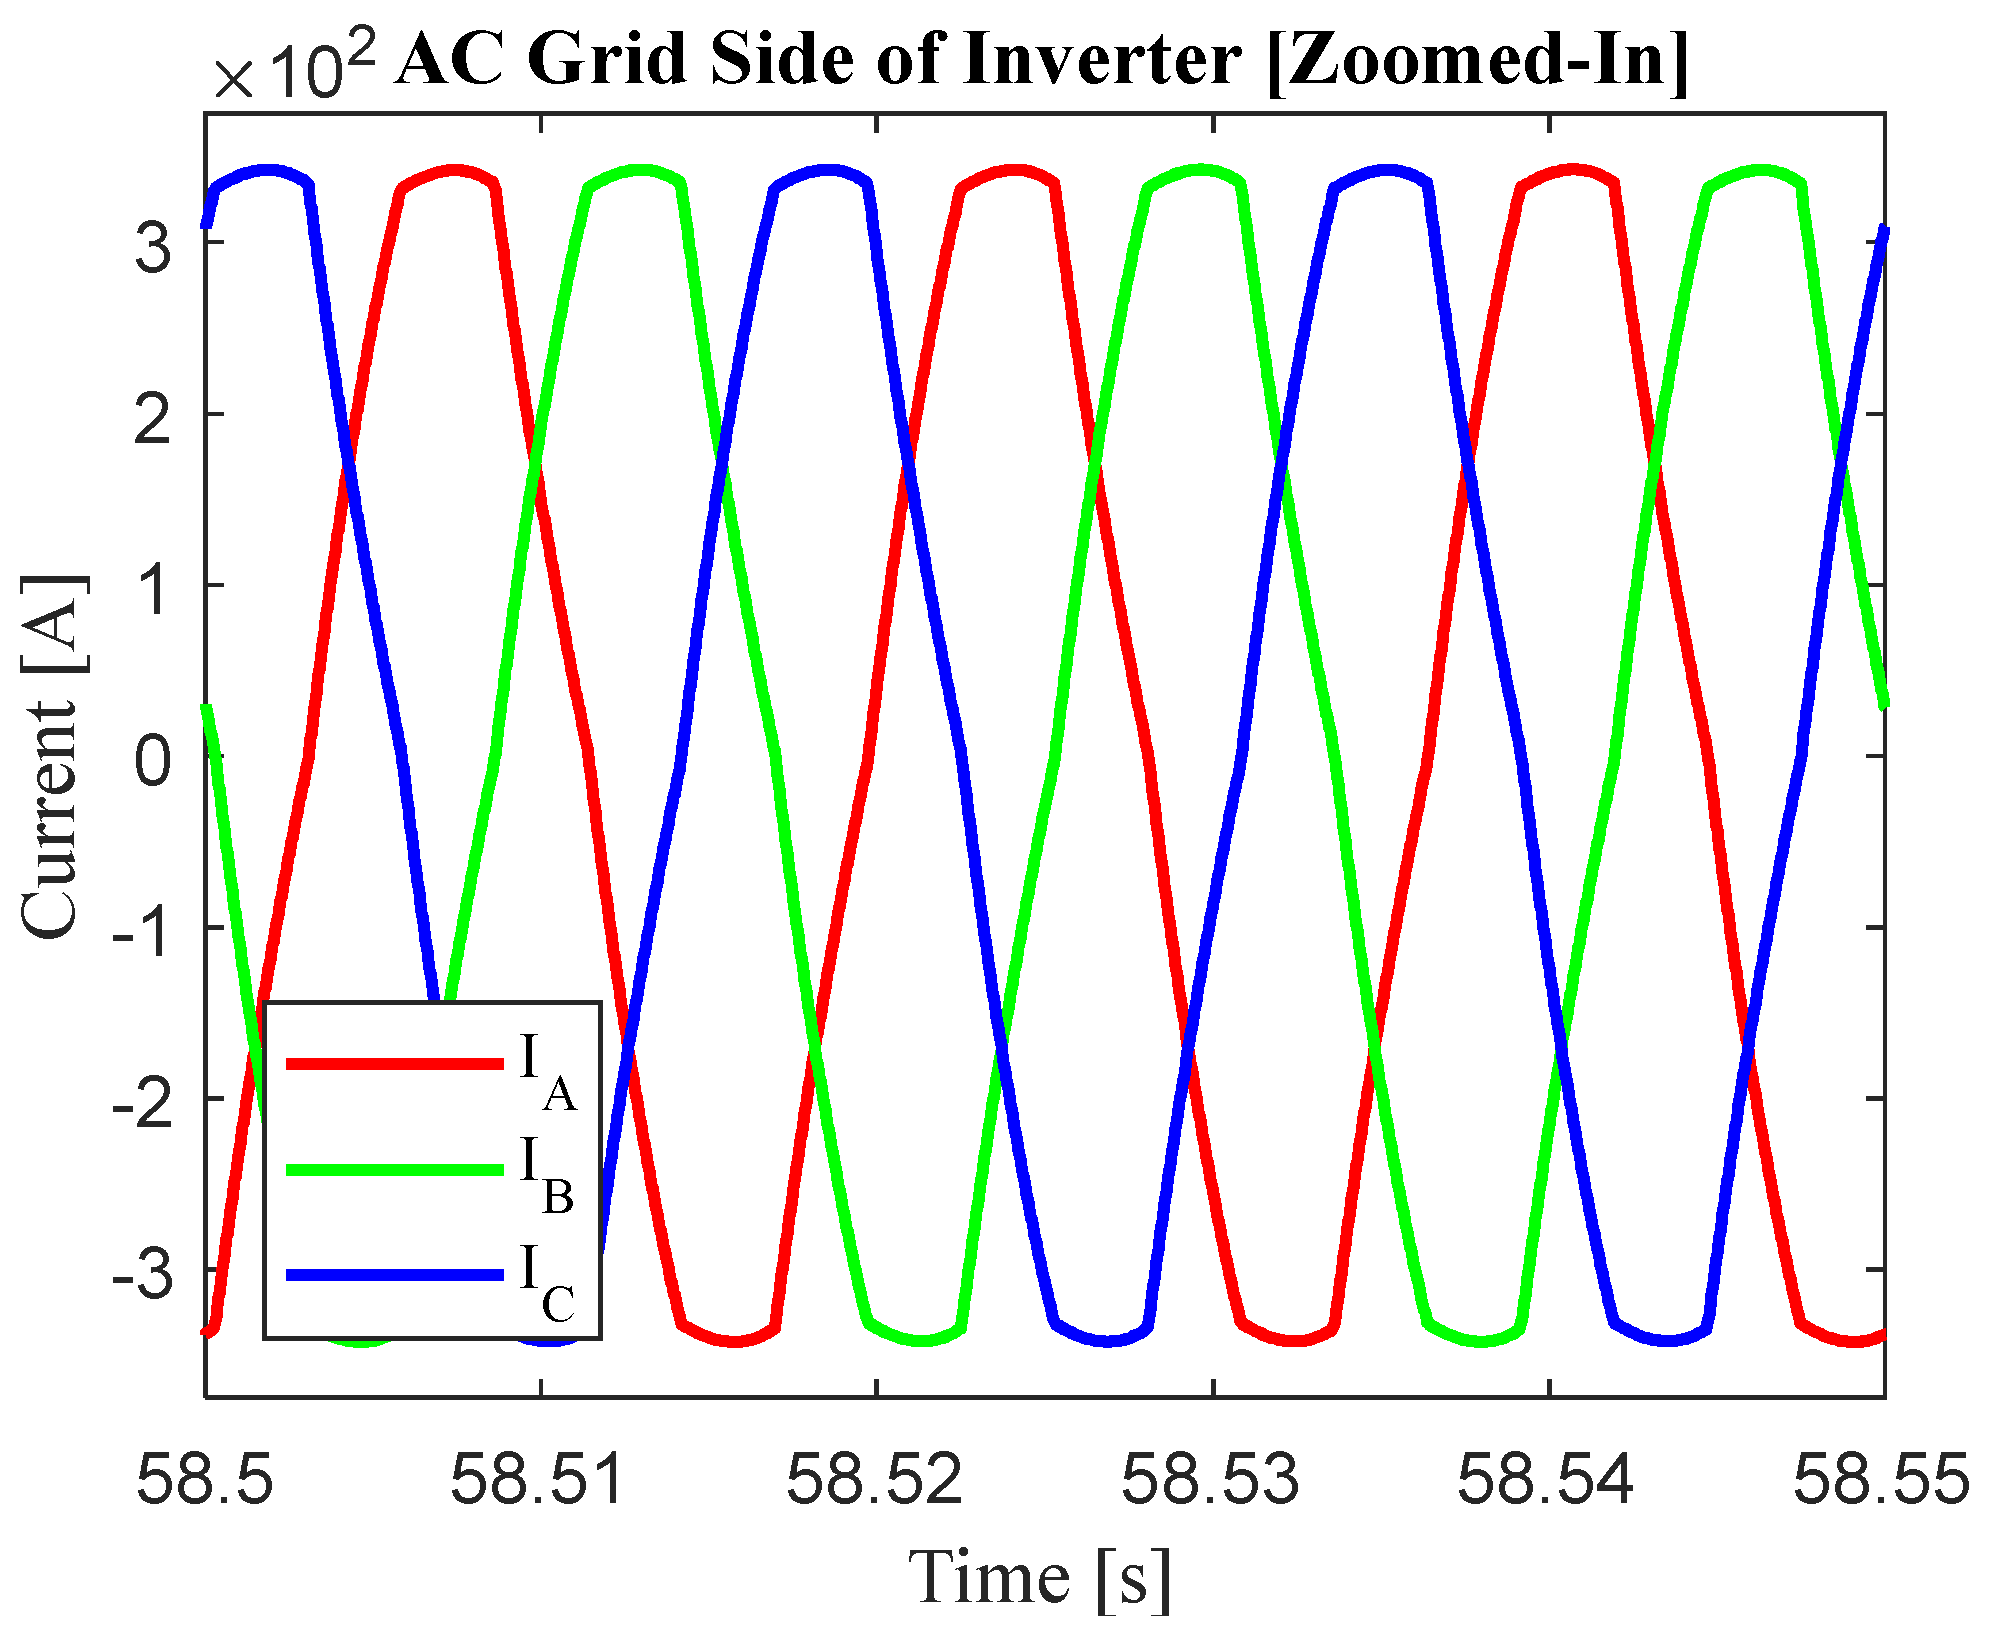
Figure 16 provides a magnified view of
Figure 15.
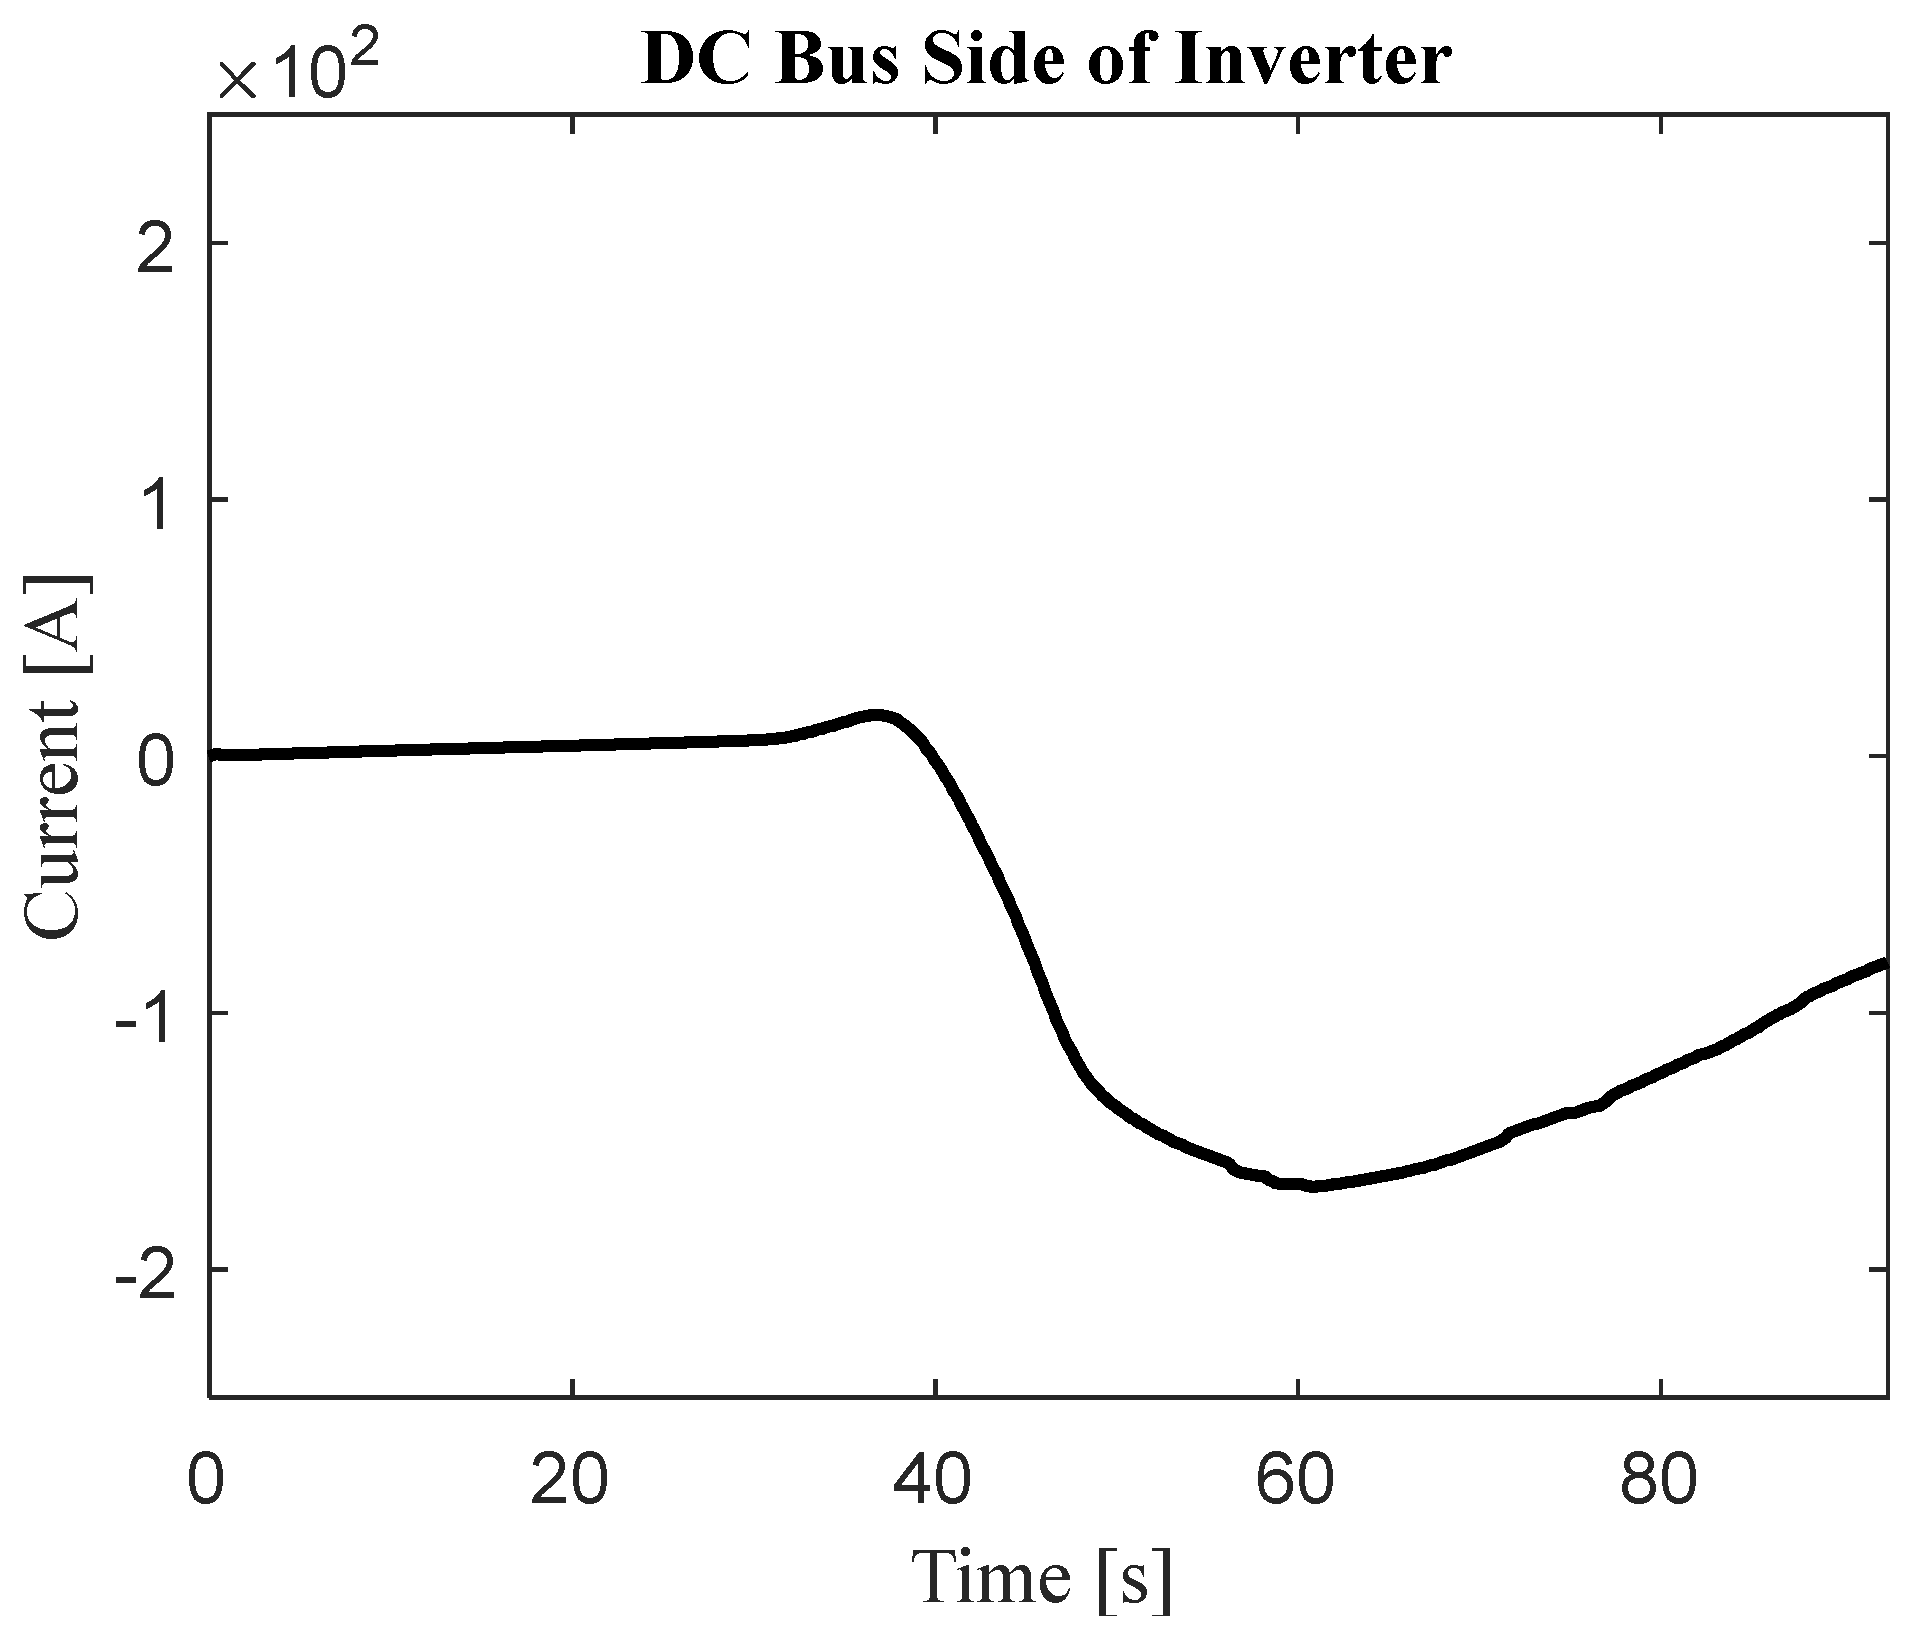
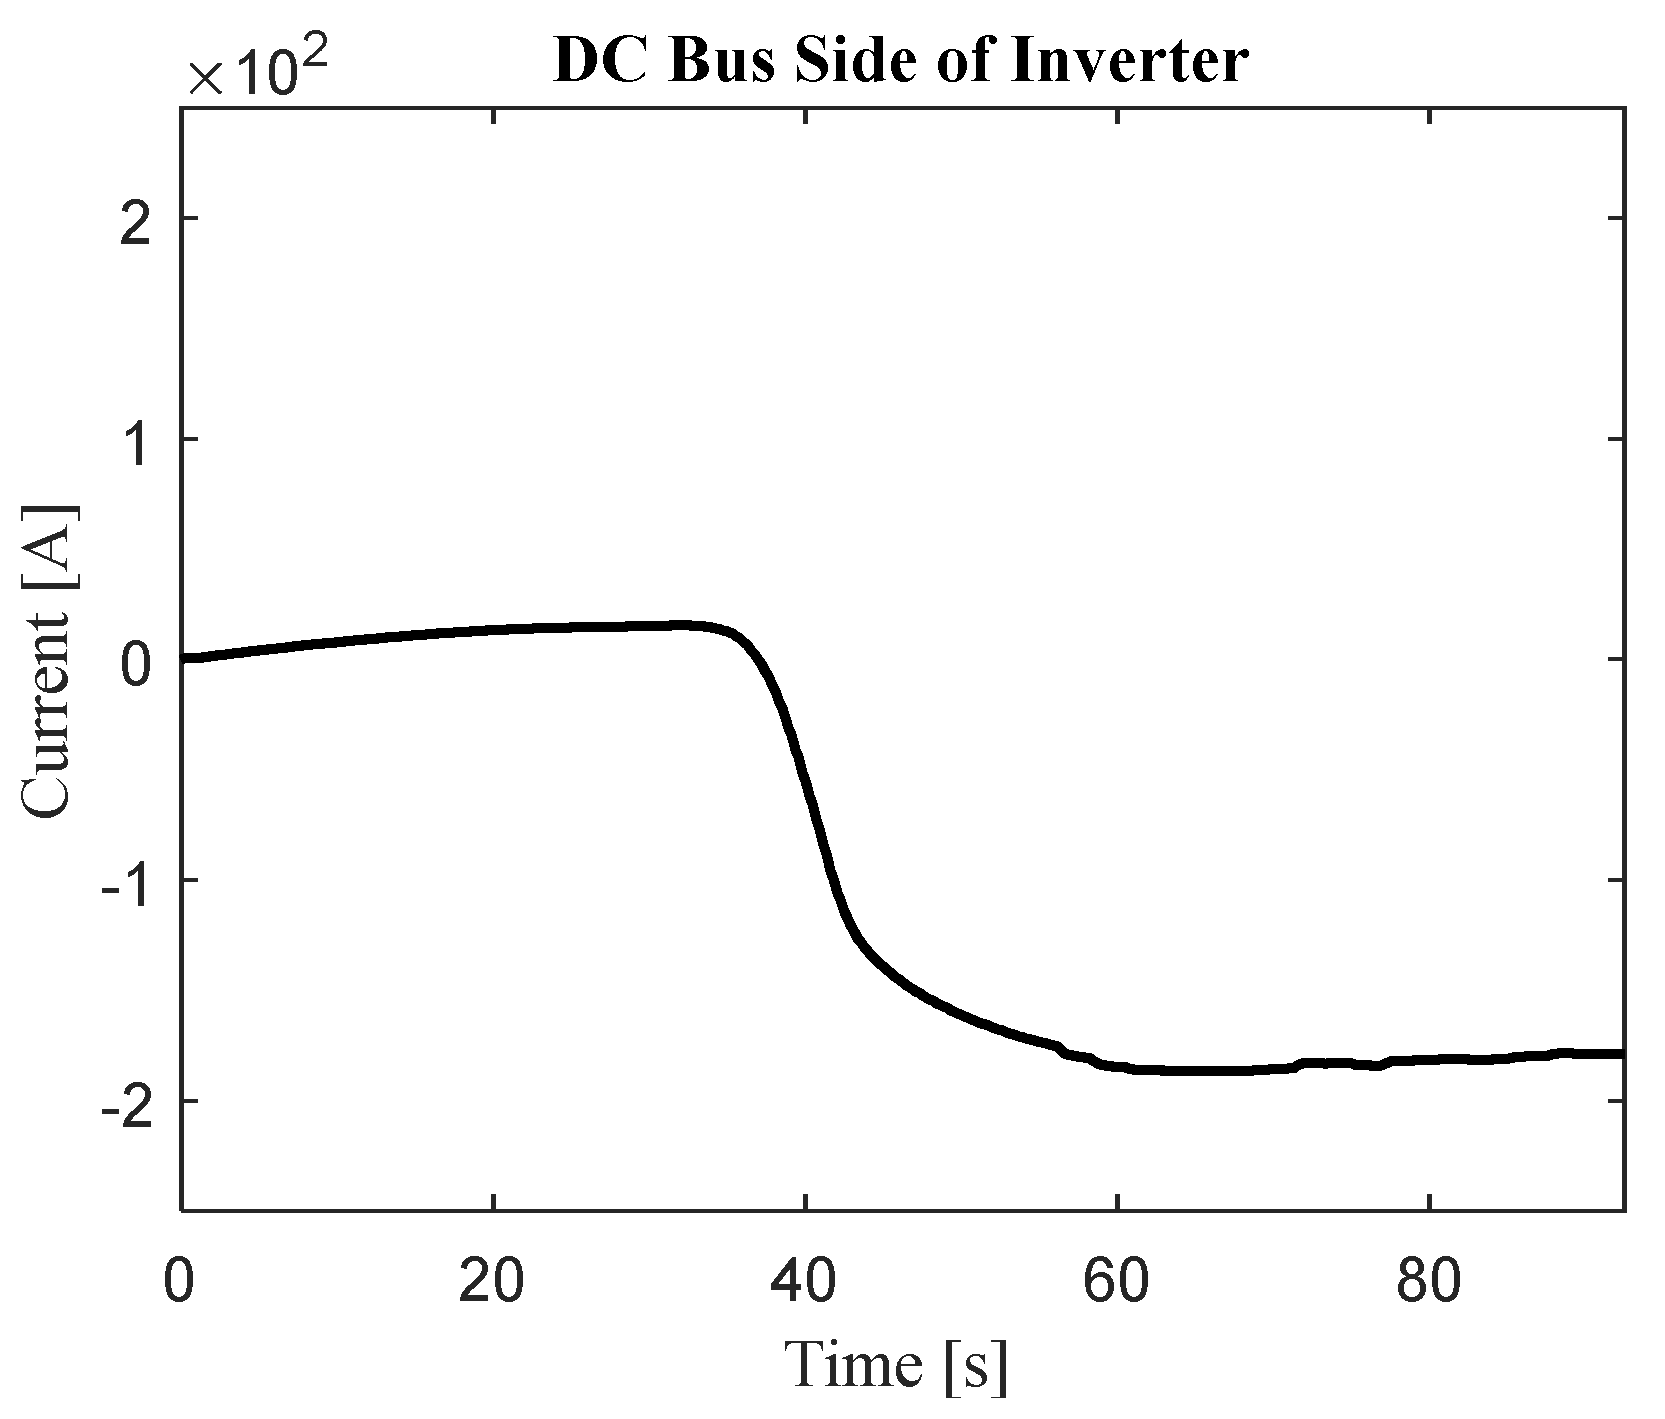
To get a better sense of the direction of power flow,
Figure 17 shows a profile of the output current, measured at the DC bus side of the inverter. This shows how more energy is sent back into the grid (negative current), for the times when the train decelerates.
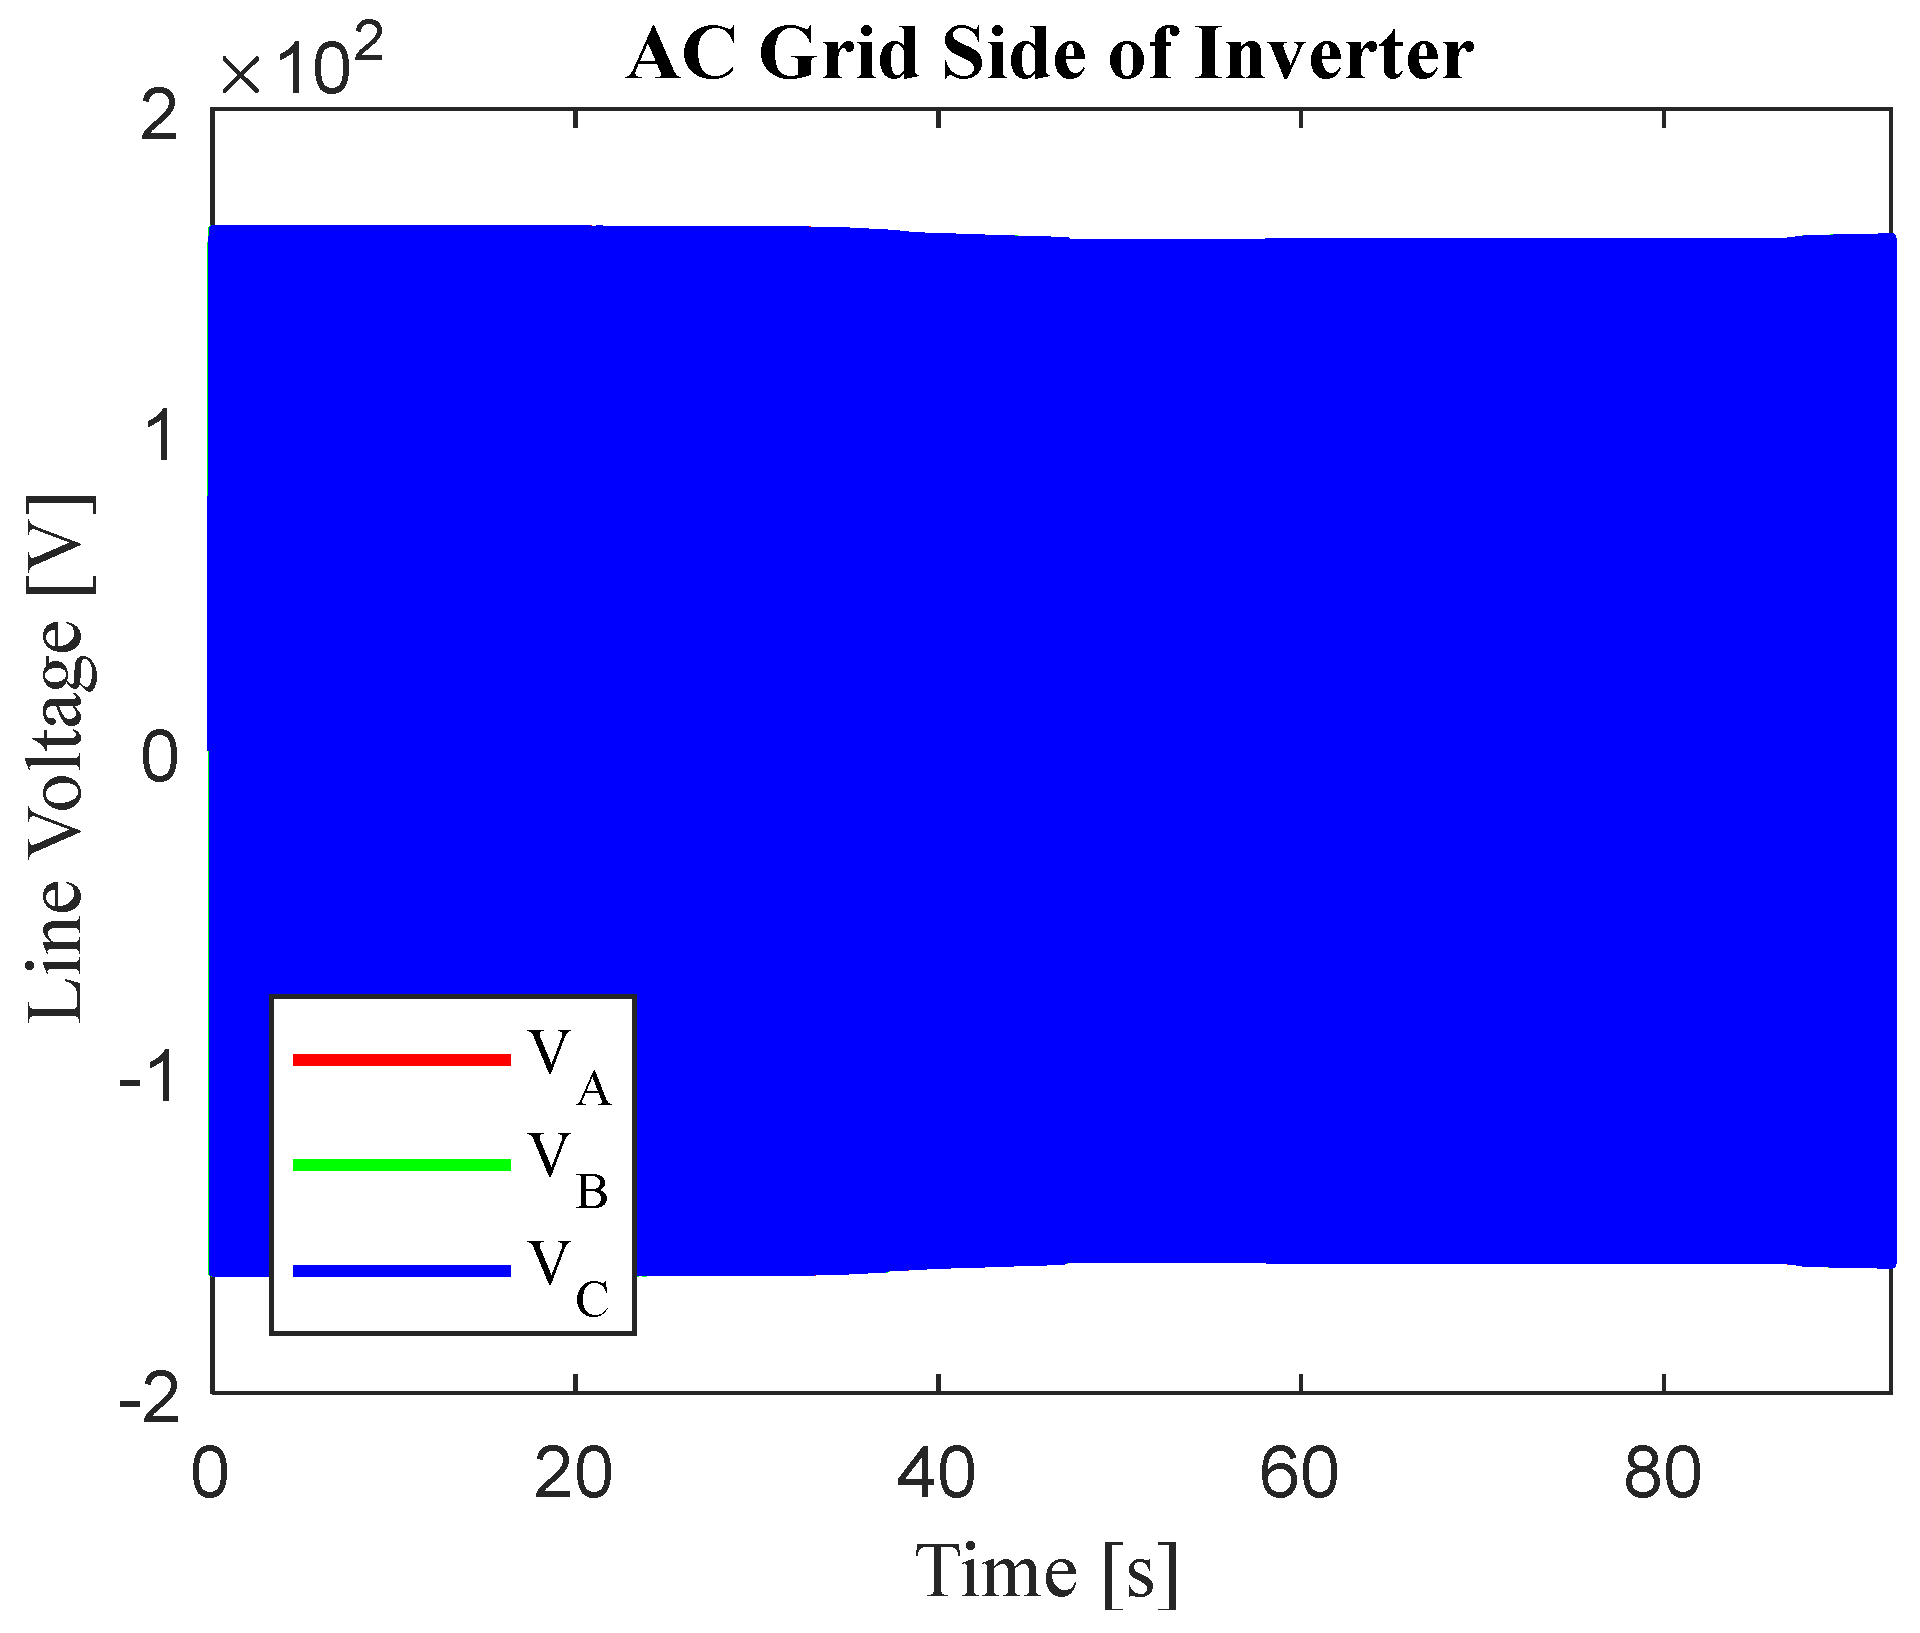
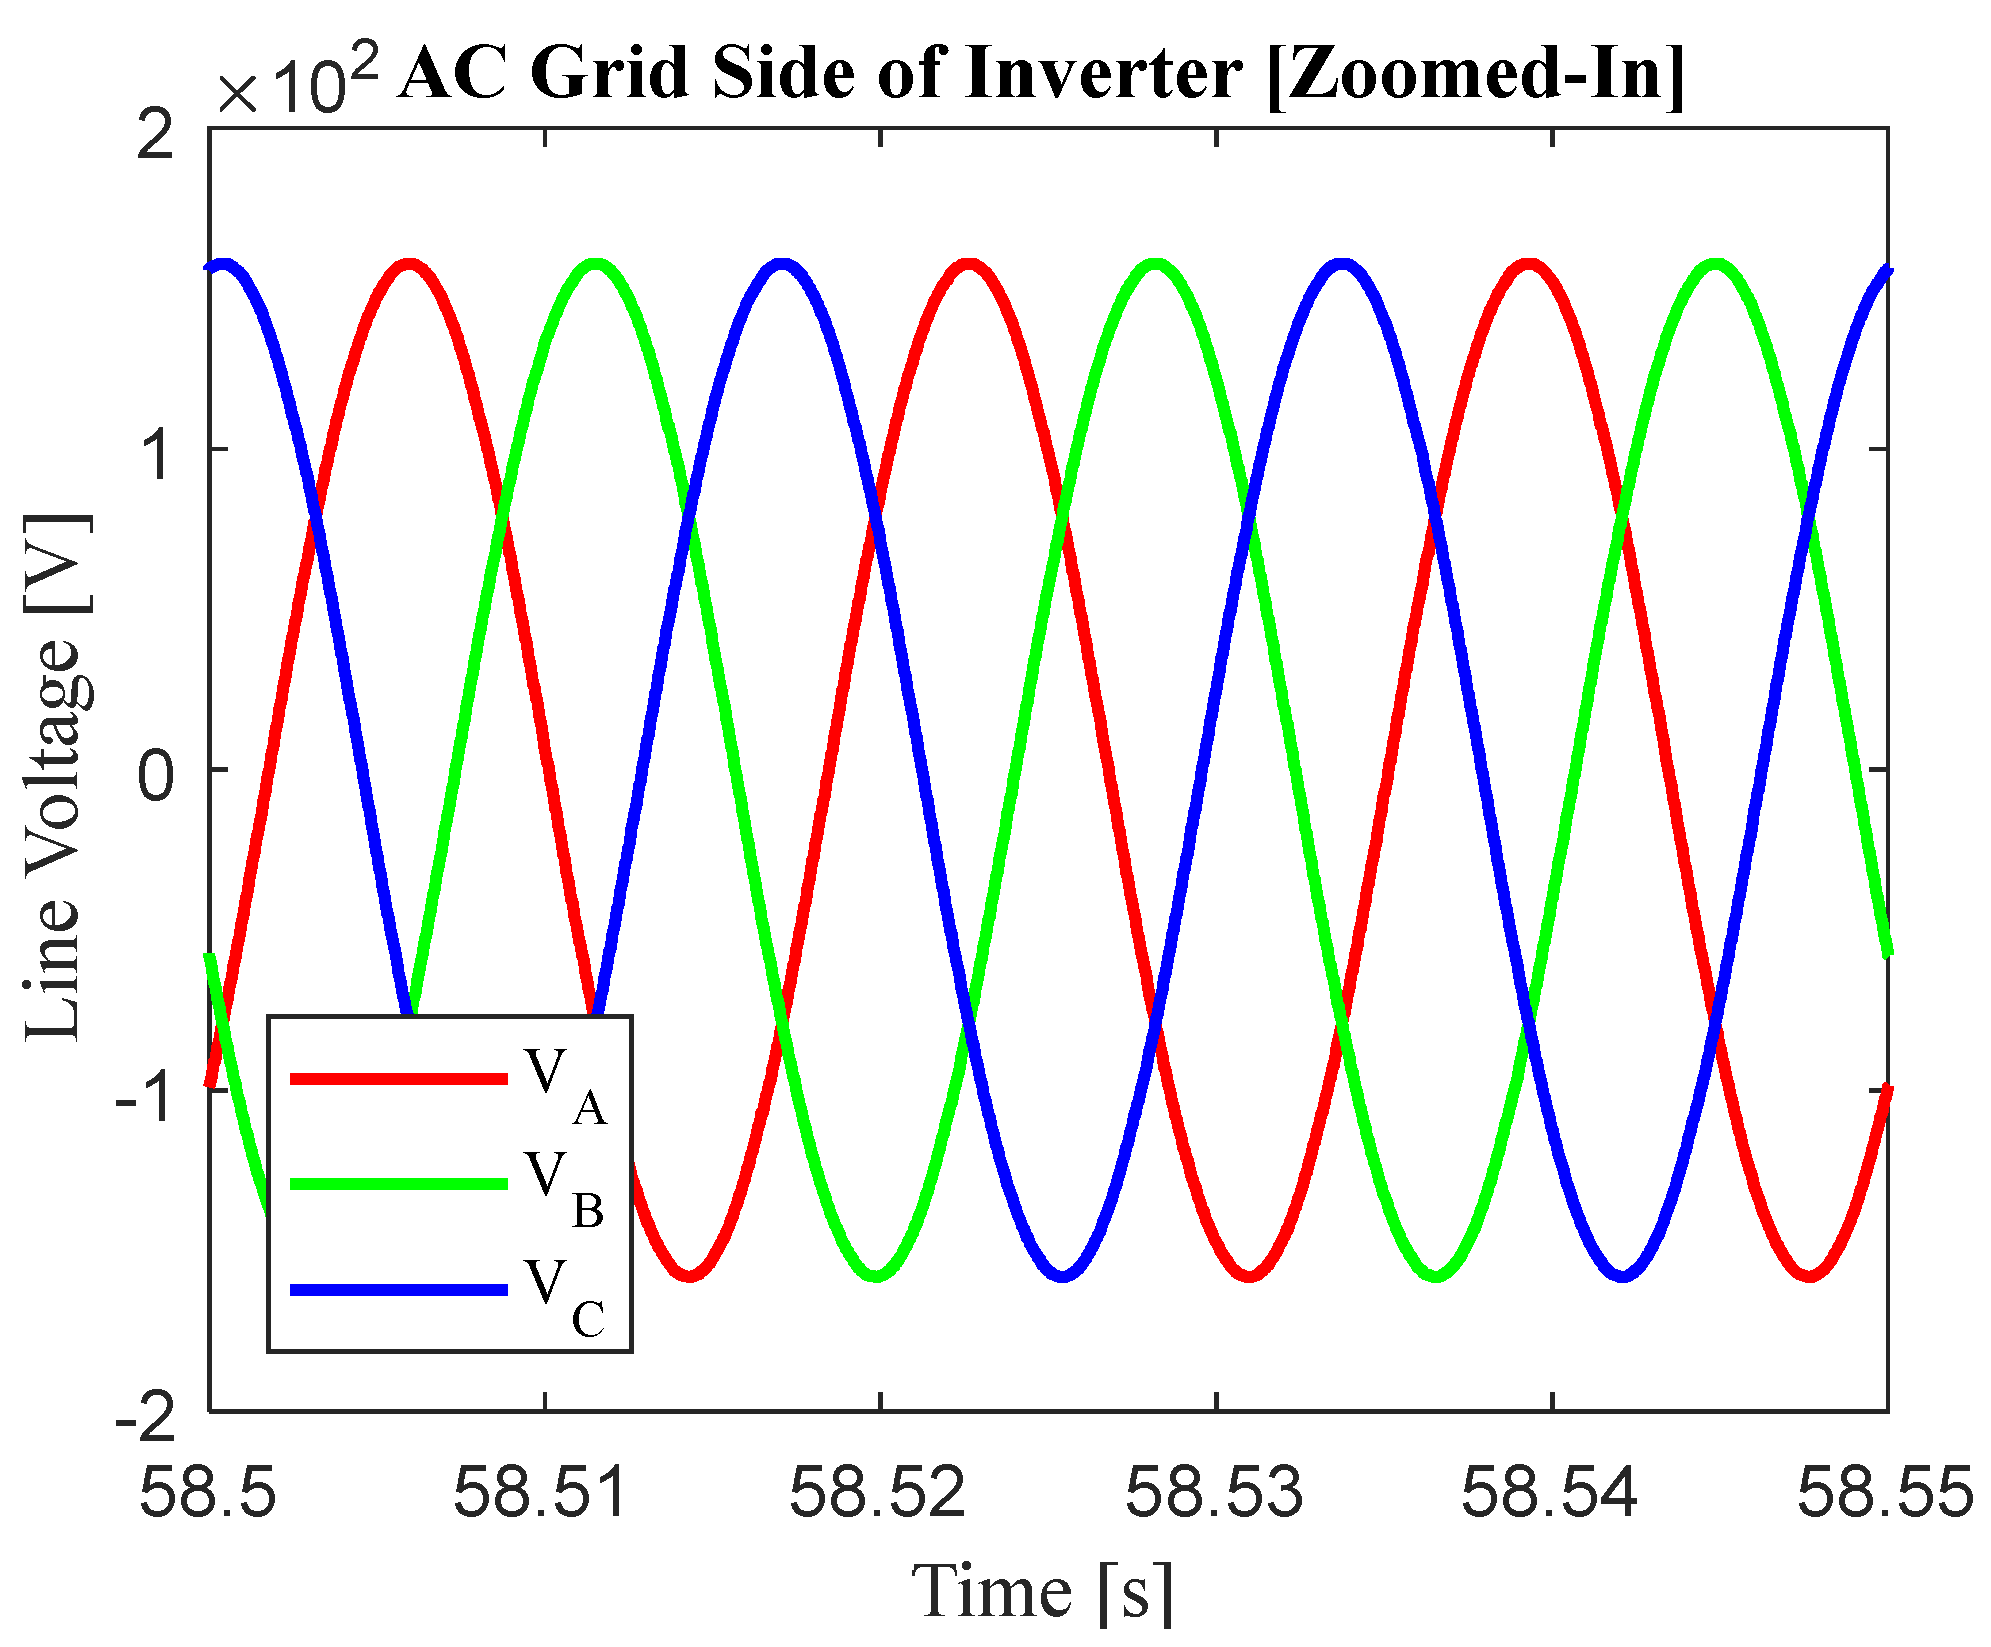
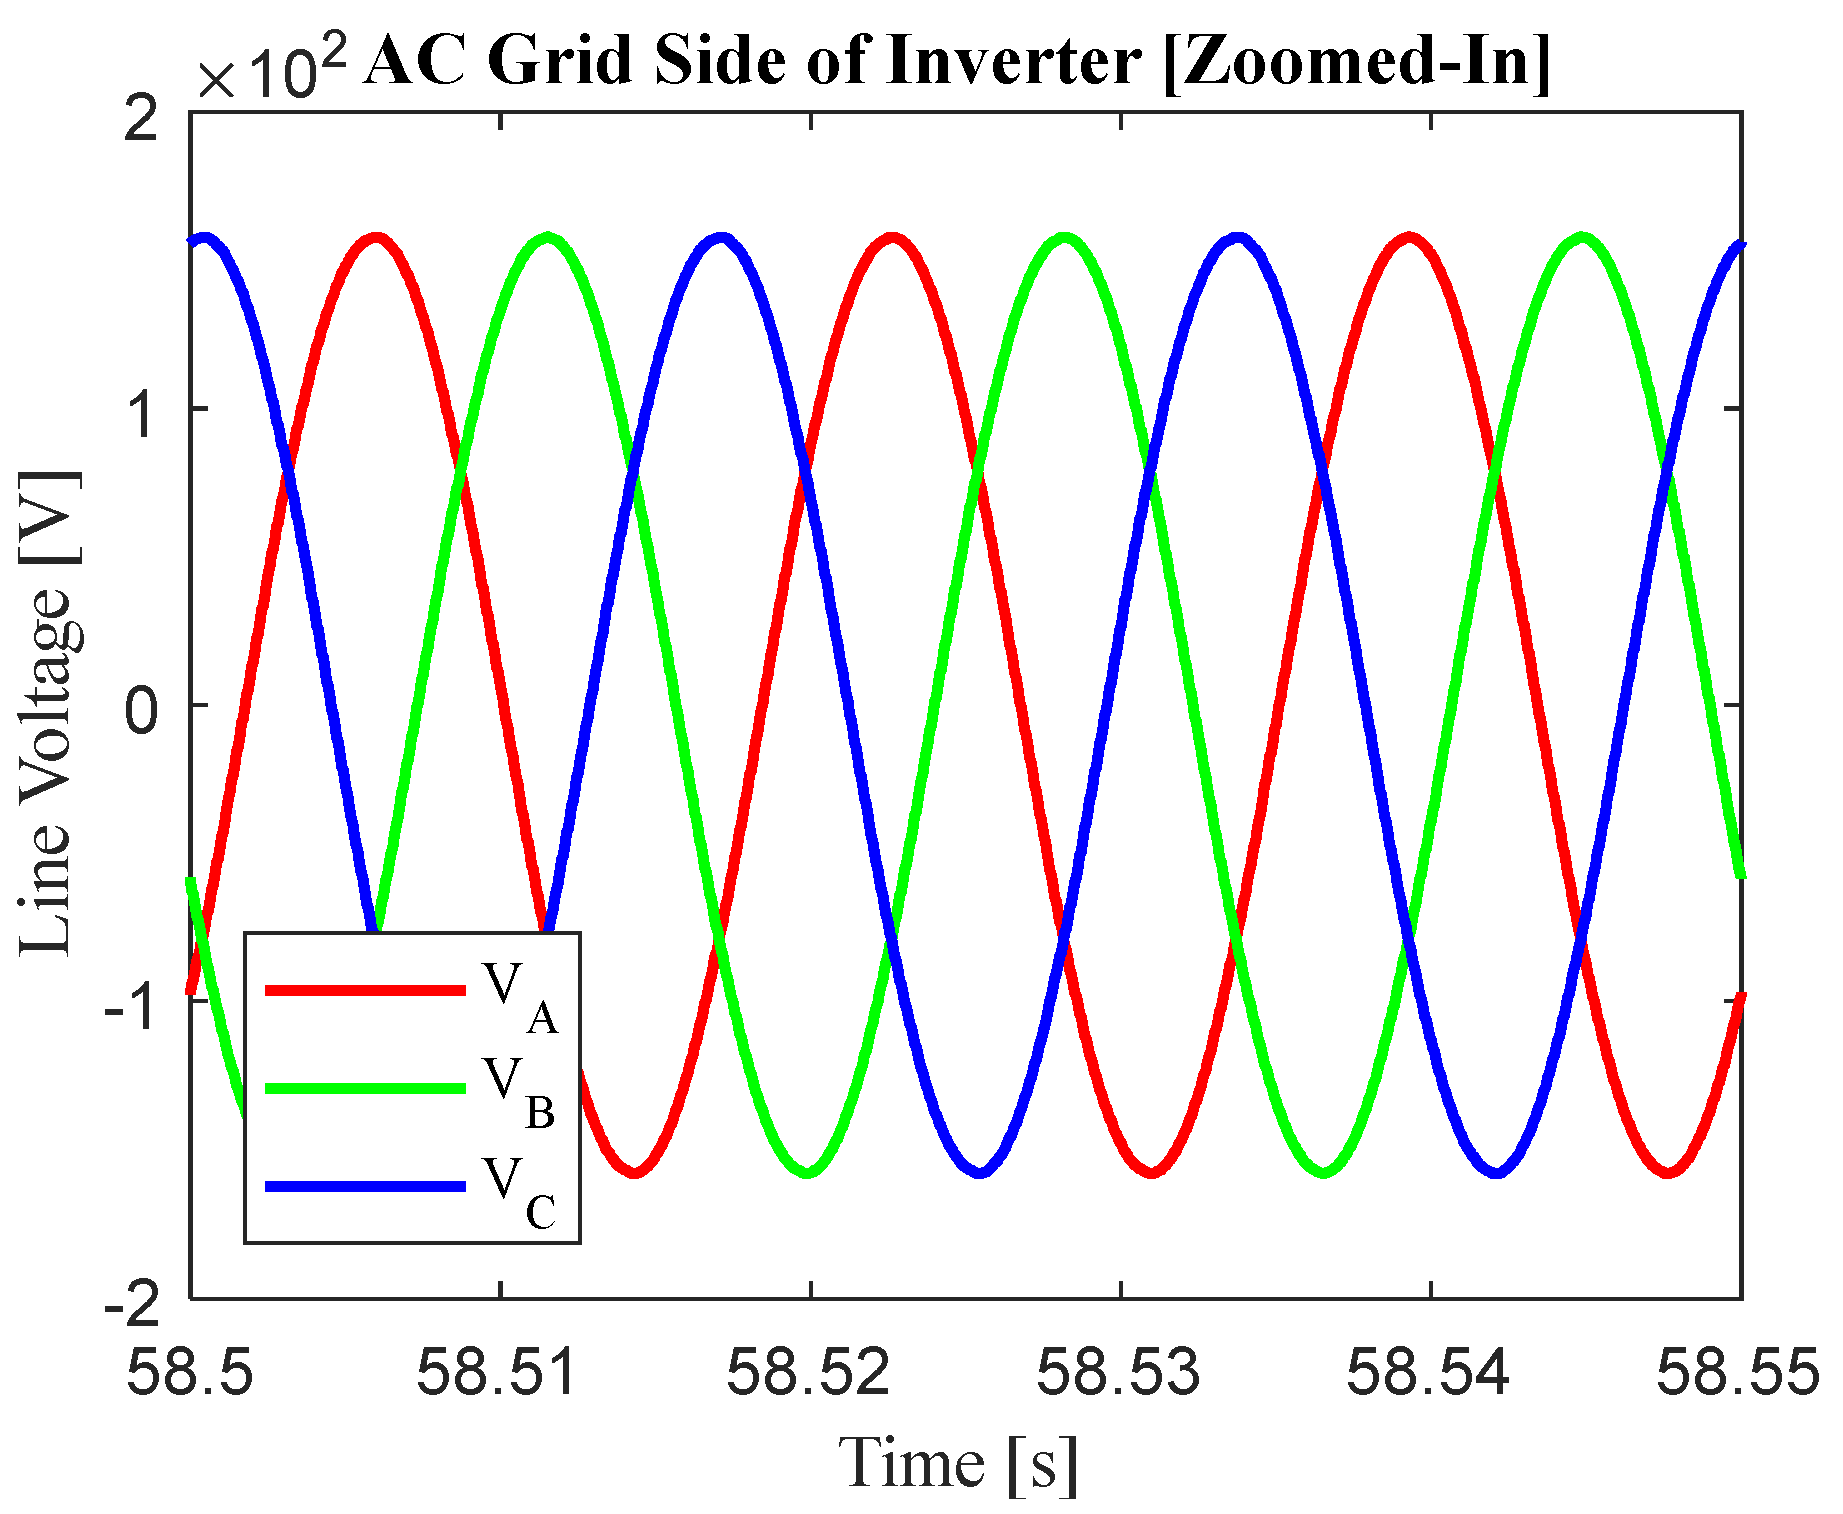
Figure 18 and
Figure 19 show how the voltage of the utility grid is minimally altered by the current injections, which is important in allowing the proper functioning of any AC auxiliary loads connected to the grid. The AC line voltages are appropriately maintained at around 120-V
RMS, with a peak of about 170-V.
The system studied thus far consists of a 55-kW PV system, and a 12-kW EV load, all of comparable sizing, with regard to the elements studied in the previously mentioned literature. Given that the proposed system in this paper incorporates a 3-MW railway system, the PV system and EV load can both be increased in size, to inject more power and draw more regenerative energy, respectively. Sizing the PV system up to about 1.1-MW (by adding more strings in parallel) and sizing the EV load up to a maximum of 1-MW as well (by reducing the equivalent load resistance, in turn allowing more power to flow for the same charging voltage of 480-V), produces the results shown in
Figure 20.
The EV load sizing is varied between 0.5-MW, 0.75-MW, and 1-MW, to account for random variations. For each variation, the system still behaves as desired, as most of the power is still drawn from the battery or PV array. When compared with the previous case, the third rail’s peak power output increases by approximately 65-kW, while the battery’s peak output power increases by approximately 270-kW. More regenerative braking energy is also recycled, as evident from the battery curve shifting upwards, when the train decelerates.
As depicted in
Figure 21, the EV load voltage is still successfully regulated at 480-V for all variations in sizing.
Figure 22 shows the common DC bus voltage after sizing up, as it is still maintained within an acceptable range of values.
Figure 23,
Figure 24,
Figure 25 and
Figure 26 show the AC voltage and current behaviors of the grid side of the inverter, with regenerative energy (and now more PV) being sent back into the grid at the same desired voltages as previously seen.
Figure 27 shows how more energy is sent back into the grid through the inverter, from the common DC bus side after sizing up, as the negative current values stay persistent for a longer time duration.


