Article

Redesigning the Production Process Using Simulation for Sustainable Development of the Enterprise

Faculty of Mining, Ecology, Process Control and Geotechnologies, Technical University of Kosice, Letna 9, 04200 Kosice, Slovakia
*
Author to whom correspondence should be addressed.
Sustainability 2022, 14(3), 1514; https://doi.org/10.3390/su14031514
Submission received: 7 January 2022 / Revised: 25 January 2022 / Accepted: 26 January 2022 / Published: 28 January 2022

Abstract

:
In this case study, the medium-sized enterprise is looking for ways to achieve sustainable development. Following the Industry 4.0 trend could get the enterprise closer. The rate of information technology usage is very low in the enterprise. The enterprise’s problem is the long production of orders. The orders had to be rejected many times because the customer’s time limit could not be met. The major cause seems to be two environmentally insufficient and obsolete machines in the blast cleaning operation. These machines are replaced in the production by one new wheel blast machine. However, the production process must be redesigned and the layout changed to use this machine effectively. This redesign is difficult to verify and evaluate in the pilot plant experiment. Simulation is the most suitable tool to do it quickly and relatively easily. The ExtendSim simulation program creates a real production process model and then applies the redesign of this process in the model. The model must be thoroughly verified concerning the real production process to not distort the results. The result of the redesign of the production process is the reduction of the production duration by almost 50% and elimination of two environmentally insufficient and obsolete machines. Improved machine blast cleaning has also significantly reduced the utilization of blast cleaning. Spared capacities can be used for pre-production or otherwise for the profit-making of the enterprise. However, a new bottleneck appeared elsewhere in the production process by removing the previous one. The innovation passed through barriers, and Slovak small and medium enterprises started building sustainable development. The enterprise still must focus on further innovation, and more investment will be needed to achieve the final sustainable development goal.

1. Introduction

In the cyber-technological era, enterprises began their journey to the sustainable development of the business with the Industry 4.0 approach. The idea of sustainable development is challenging to formulate specifically. Based on a systemic approach, sustainable development can be achieved by considering the economic, environmental, and social aspects [1]. Sustainable development means increasing productivity while reducing the need for resources and reducing environmental impacts. Business activities must also have positive social effects. For such a direction of the enterprise’s strategies, information is needed. The data can be properly obtained by involving information technologies (IT) in the processes of the enterprise [2]. Sustainable development in production can be achieved by looking for opportunities in the company to increase its competitiveness in production [3].
Small and medium-sized enterprises (SMEs) are the essence of many economies, and they have a huge impact on the environment and overall emissions. Owners of these enterprises are motivated to create sustainability [4]. SMEs can reach a maximum of 250 employees. Otherwise, they are considered large enterprises [5,6]. Currently, the world’s events are directed towards so-called green activities and the protection of the environment. Sustainable development in today’s SMEs is mainly associated with emphasizing nature protection and environmental enhancement. Enterprises are planning and implementing eco-innovations, which means a rise of eco-friendly production and emissions reductions [7]. Eco-innovation mostly affects the environmental side of sustainability. Its primary aims are new or improved processes, products, or services with decreased use of natural resources and release of dangerous substances through the life cycle. Eco-innovation becomes even more effective for SMEs if it is also characterized as open innovation [8,9]. SMEs encounter many challenges to implementing innovation towards sustainable development. The open innovation concept provides shared knowledge between enterprise and external subjects. Such a collaboration breaks down research and development challenges [10].
SMEs’ key challenges were specified as financial instability, financial loan constraint, inexperience, and lack of innovation and creativity in the field of business, regulatory licenses and taxes, increased production and manufacturing cost, lack of technical means, poor managerial skills, and technology. In addition, major external challenges such as competition, unfriendly business environment, and government regulatory and law issues have an impact [4,11,12]. However, studies [5,13,14,15] declare a positive relationship between sustainable development and SME’s innovation. Some previously mentioned studies even use more sophisticated and more expensive Industry 4.0 solutions towards sustainable development than ours. Many enterprises worldwide have already applied Industry 4.0 and try to adapt it to their specific processes and needs. Implementation of Industry 4.0 can provide enterprises competitiveness, flexibility, productivity, environmental improvement, ecological benefits, increasing employees’ expertise, and improving managerial skills. SMEs still prefer economic benefits from innovations instead of environmental and social ones [6,12].
However, the actual situation in Slovakia is different. In 2018, 73.2% of employees were employed in private sector SMEs. Of these SMEs, 61.6% did not perform any innovation activity, and 45.7% did not even consider it for the future. Most SMEs are still operating without sufficient support of cyber and IT or other sustainable development solutions [16]. Lesáková et al. [17] pointed out innovation barriers in Slovak SMEs: lack of financial sources, innovation costs, insufficient labor qualification, lack of external cooperation, an inappropriate system of state support, lack of knowledge about benefits of research and development, law ambiguity, bureaucracy and corruption, and lack of readiness to innovate. Enterprise readiness to innovate can be explained as a willingness to change, free implementation capacities, and the ability to achieve intention [12].
In the case study, an SME from Slovakia has established cooperation between the enterprise and an academic institution. This connection aims to lay down the basis of the sustainable development of the enterprise. Sustainable indicators such as energy consumption per unit and order acceptance rate are the most urgent. To satisfy these indicators, the Industry 4.0 approach is needed. Researchers must deal with barriers and find a suitable solution for the enterprise. The first step must be proper system analysis to identify the main problem. The most basic tool simulation model is created for the production process to achieve higher control of it. The simulation itself is not enough. A new blast cleaning machine is acquired according to system analysis results. Implementing new technology requires a change in the organization of the existing production process to exploit all the potential of the suggested innovation. The core of the innovation is the new machine positioning in the enterprise’s production process. Replaced machines are put out of service. Such a change in the production process requires sufficient investment means and sufficient time for verification. To avoid wasting resources, changes are firstly made to the virtual model in the ExtendSim simulation program. The creation of the model is preceded by a thorough analysis of the innovated system. The created model is verified and modified to match the real system.
This paper presents the case study that declares Slovak SME ability to start building sustainable development. The case study proves that even the simplest Industry 4.0 solution brings positive results and advantages for SMEs in Slovakia. The paper should encourage Slovak SMEs to implement innovations, even if there are many barriers in Slovakia. Despite obstacles in the implementation process, the advantages of sustainable development are worth it. The case study describes the implementation of a new machine and the creation of the production process model. To achieve sustainable development, Industry 4.0 tools are used. The new automated machine shortens production time, works on preprogrammed software, and decreases environmental pollution and energy consumption. The simulation model brings a basic digitalization in the production process and offers new possibilities for the enterprise, such as more precise forward control and quick capacity planning. The adapted model will be used for other solutions of sustainable development and Industry 4.0 in the enterprise.

2. Literature Review

In the Introduction, we present the aim of our case study and state the situation of Slovak SMEs according to sustainable development. Many terms are used, but only a few have a deeper explanation. This section aims to provide a deeper look at terms like production process, innovation, redesign process, and simulation so the management of Slovak SMEs will better understand the intentions, steps, and processes we use in the case study. From a logistics point of view, only a deep understanding of the steps and processes we present in the case study could bring other Slovak SMEs toward building the basics of their sustainable development.
Today, many factors influence the performance of production processes. These factors can be divided into external and internal groups. The external group includes customers’ needs, ecological pressure (zero waste), delivery cycles, flexibility demands, and market changes. Internal factors follow the enterprise’s best interest, such as quality control, cost reduction, lead times, and reliability of machines [18,19,20]. The customer has the largest share of the pressure to change production processes. Manufacturing enterprises are being forced to meet increasingly different and more demanding customer requirements. On the other side, enterprises are pushed into low production costs. The trend is the greatest possible flexibility of production processes at low costs [21]. Many enterprises need to switch to so-called lean production, where production time and costs are reduced to a minimum, of course, while leaving as much flexibility as possible to meet customers’ needs. The increased need for information is directly linked to the shortening of production time. Information and data are becoming the most important source for achieving the objectives set [18].
According to Tvrdoň and Fedorko [22], the design of production systems is a long-standing process, but there are constant demands to accelerate this process. When designing production processes, we must ensure that each model consists of static objects such as machines. These dynamic objects change the position in the model and connections with the external environment [23]. Linear programming and various mathematical methods can no longer keep up with the acceleration of designing production processes. With Industry 4.0 comes the trend of the digital twin and the promotion of simulation as a tool for designing production processes with great potential [21]. A wide range of different simulation programs is available on the market. They can distinguish even the smallest details of virtual models of systems. By careful, precise, and well-located monitoring of simulations in these programs, we can distinguish individual bottlenecks and all discrepancies in the model. The redesign of production processes often offers high investment options and options with little need for resources. Simulation is the most appropriate tool for deciding whether low-cost changes will be sufficient for us [24].
Innovation can be understood as introducing an unknown possibility into the system to improve the system. The upgrade can be done to all aspects of the business, from creating a new product through new planning to a change in the production process [25]. According to Roper et al. [26], innovation is the beginning of a process in which the performance of the enterprise may improve when certain characteristics occur and the specified conditions are met. Wojtaszek and Miciuła [27] offer a more detailed view of innovation, innovation activities, different innovative concepts, and the relationship between innovation and competitiveness. We can find a strong relationship between innovation and development and improving the performance of small and medium-sized enterprises, which, however, cannot be fully exploited by these enterprises because of their limited financial resources. Industry 4.0 technologies lead enterprises to innovations aimed at digitization, strengthening customer relationships and activities resulting in increased productivity [28].
Innovation uses many concepts and methods to achieve its goal. One of the most important methods used to improve processes is reengineering. If the word reengineering is used, the main meaning is a radical, often large and important change of the entire production process. However, it is necessary to realize that the term broader sense consists of three levels. The first level is a slight change at a particular place of the production process or only one process activity. At a higher level, we are talking about reengineering as a redesign of a process where change affects more than one part of the process, sometimes the whole process. The last third level is reengineering in the strict sense of the word, as a radical change of the whole production process [29].
Reengineering may not relate to the production process but may also include information flow from a logistics perspective. Bottani [30] describes reengineering in the information flow in the storage system for more efficient use of data stored in radio frequency identification (RFID) receivers. Reengineering can also improve the entire business process. Business process reengineering (BPR) is designed to analyze, manage, and modify the material flow and the entire business flow of the enterprise. BPR methods are highly unsuccessful, mainly due to the absence of a clear sequence of steps in these methods and the inability to identify fault factors [31].
In this case study, a redesign of the process is used as a tool for the sustainable development of production in the enterprise. The design of the process can take a dual approach. The first is a multicriterial design, where the model works with the same structure and units of variables while meeting multiple requirements and respecting limitations. The second way is two-phase stochastic optimization when it is designed in uncertain conditions. The second phase variables correspond to the selected option from a set of possible scenarios, so they adapt the first phase to the selected scenario [32]. The level of failure of reengineering projects is up to 50% due to the low success rate of predicting the impacts and results of changes made by reengineering and the dynamic nature of the processes. Another reason is the lack of options to evaluate changes before they are implemented. In recent years, simulation has become an integral part of reengineering projects as a tool for evaluating a given project before implementation. Simulation with the correct parameters corresponding to the real system is an essential factor preventing the waste of financial resources for projects with an inappropriate solution [29].
A simulation is an analytical tool which displays the object as a digital model. First, the displayed model must be verified on a functional and logical side to match the modelled system. If the model was not a copy of a real object, the statistics obtained would not correspond to reality and lead to incorrect conclusions. Subsequently, it is possible to experiment with the model, which brings a lot of data and information. It is possible to formulate solutions and apply them to the real object [33]. A simulation is a tool that has become widely used since the 1950s. Simulation is not a tool for optimizing real systems but for obtaining the statistics needed to optimize and test different solutions [34,35].
Simulation on real process models aims to obtain information, one of the most valuable sources today. Simulation eliminates the need for surplus financial resources from interventions in the real system. The information thus obtained is used to evaluate and improve the modelled system [35,36]. In the case of a new system or product, the simulation provides an overview of the selected design and functionality before implementing the new program or product [37]. According to Siderska [37], it is advisable to follow these steps:
  • To formulate the problem;
  • To test the possibilities of performing a simulation;
  • To formulate the objectives;
  • To gather and analyze data;
  • To perform the simulation;
  • To analyze and interpret the results;
  • To draw up documentation.
The advantages of the simulation are great flexibility, lower financial resource intensity compared to real object testing, relatively long-term usability, and it does not affect ongoing business processes. On the other hand, the minus is sometimes the need to comply with the limits of the simulation program, the need for quantification of parameters [38].
The creation of a simulation model is based on the nature of dynamic elements of the production process. Therefore, a discrete simulation is distinguished when dynamic elements are often subjects of a material nature, often declared in pieces. For such a type of simulation, the time is controlled by jumping, i.e., only the time of each event occurred is recorded. On the other hand, there is the possibility of a continuous, non-discrete simulation, used mainly for value flows. The continuous simulation time is controlled by a fixed time interval in which simulation statistics are recorded [33,38].
Many simulation programs are currently being used. The programs use a wide range of simulation languages. For discrete simulation, it is good to mention GPSS, TECNOMATIX, SIMUL8, and WITNESS, for purely continuous simulation, STEELA, and, for complex simulation programs, ExtendSim and ARENA [38,39].
The simulation is used to solve various problems. Ištokovic et al. [40] used simulation to determine the order and batch size in the production plant. To rationalize the downtime of traffic and services during the production process, the simulation was used by Ambriško et al. [41]. The collective Šaderová et al. [39] were among the first who presented the use of simulation using ExtendSim8 in the mining process. Several articles using simulation to demonstrate stock operations or their redesign have also been published [34,42,43]. Pekarcikova et al. [44,45] used the TECNOMATIX program to solve bottlenecks in production by applying KANBAN or e-KANBAN (in meaning to the Industry 4.0) of the system. In manufacturing enterprises, the priority is to avoid investment-intensive interventions in the production process. Simulation is an appropriate tool to evaluate the efficiency of the production process even in the case of non-invasive changes, such as adjusting production scheduling and rationalizing logistics operations [46,47].

3. Materials and Methods

Simulation is used to verify the proposed changes in the production process of the enterprise. ExtendSim version 9 simulation program was selected as the simulation tool. ExtendSim is a block-oriented simulation program that offers the possibility of discrete and continuous simulation. The program blocks are divided into value, item, plotter, rate, utilities, and animation libraries, and the number of blocks in the model is not limited. Pre-prepared blocks with embedded programming language make it easy for creators to work logically with the model. Simulation of the created model can also be presented by 2D or 3D animation [48].
Thick lines represent flows in ExtendSim models for requirements (material objects), and fine lines represent the information flow. Blocks are a model expression of the real facilities and operations of the modelled system. Each block, after opening, offers different specifications and features to make the created model as accurate as possible to match the real system. Only one output line can be connected to each block input connector, ensuring a logical sequence of operations as in a real system [49].
An overview and description of the blocks used to create the simulation model in the ExtendSim 9 is in Table 1.

4. Results

4.1. Analysis of the Production Enterprise

The focus of the enterprise in which the problem is solved is the production of machines for dressing plants in the mining industry. A vibrating screen with a high number of orders from customers is considered a representative product of the enterprise. The enterprise focuses mainly on the international market, where most customers also operate.
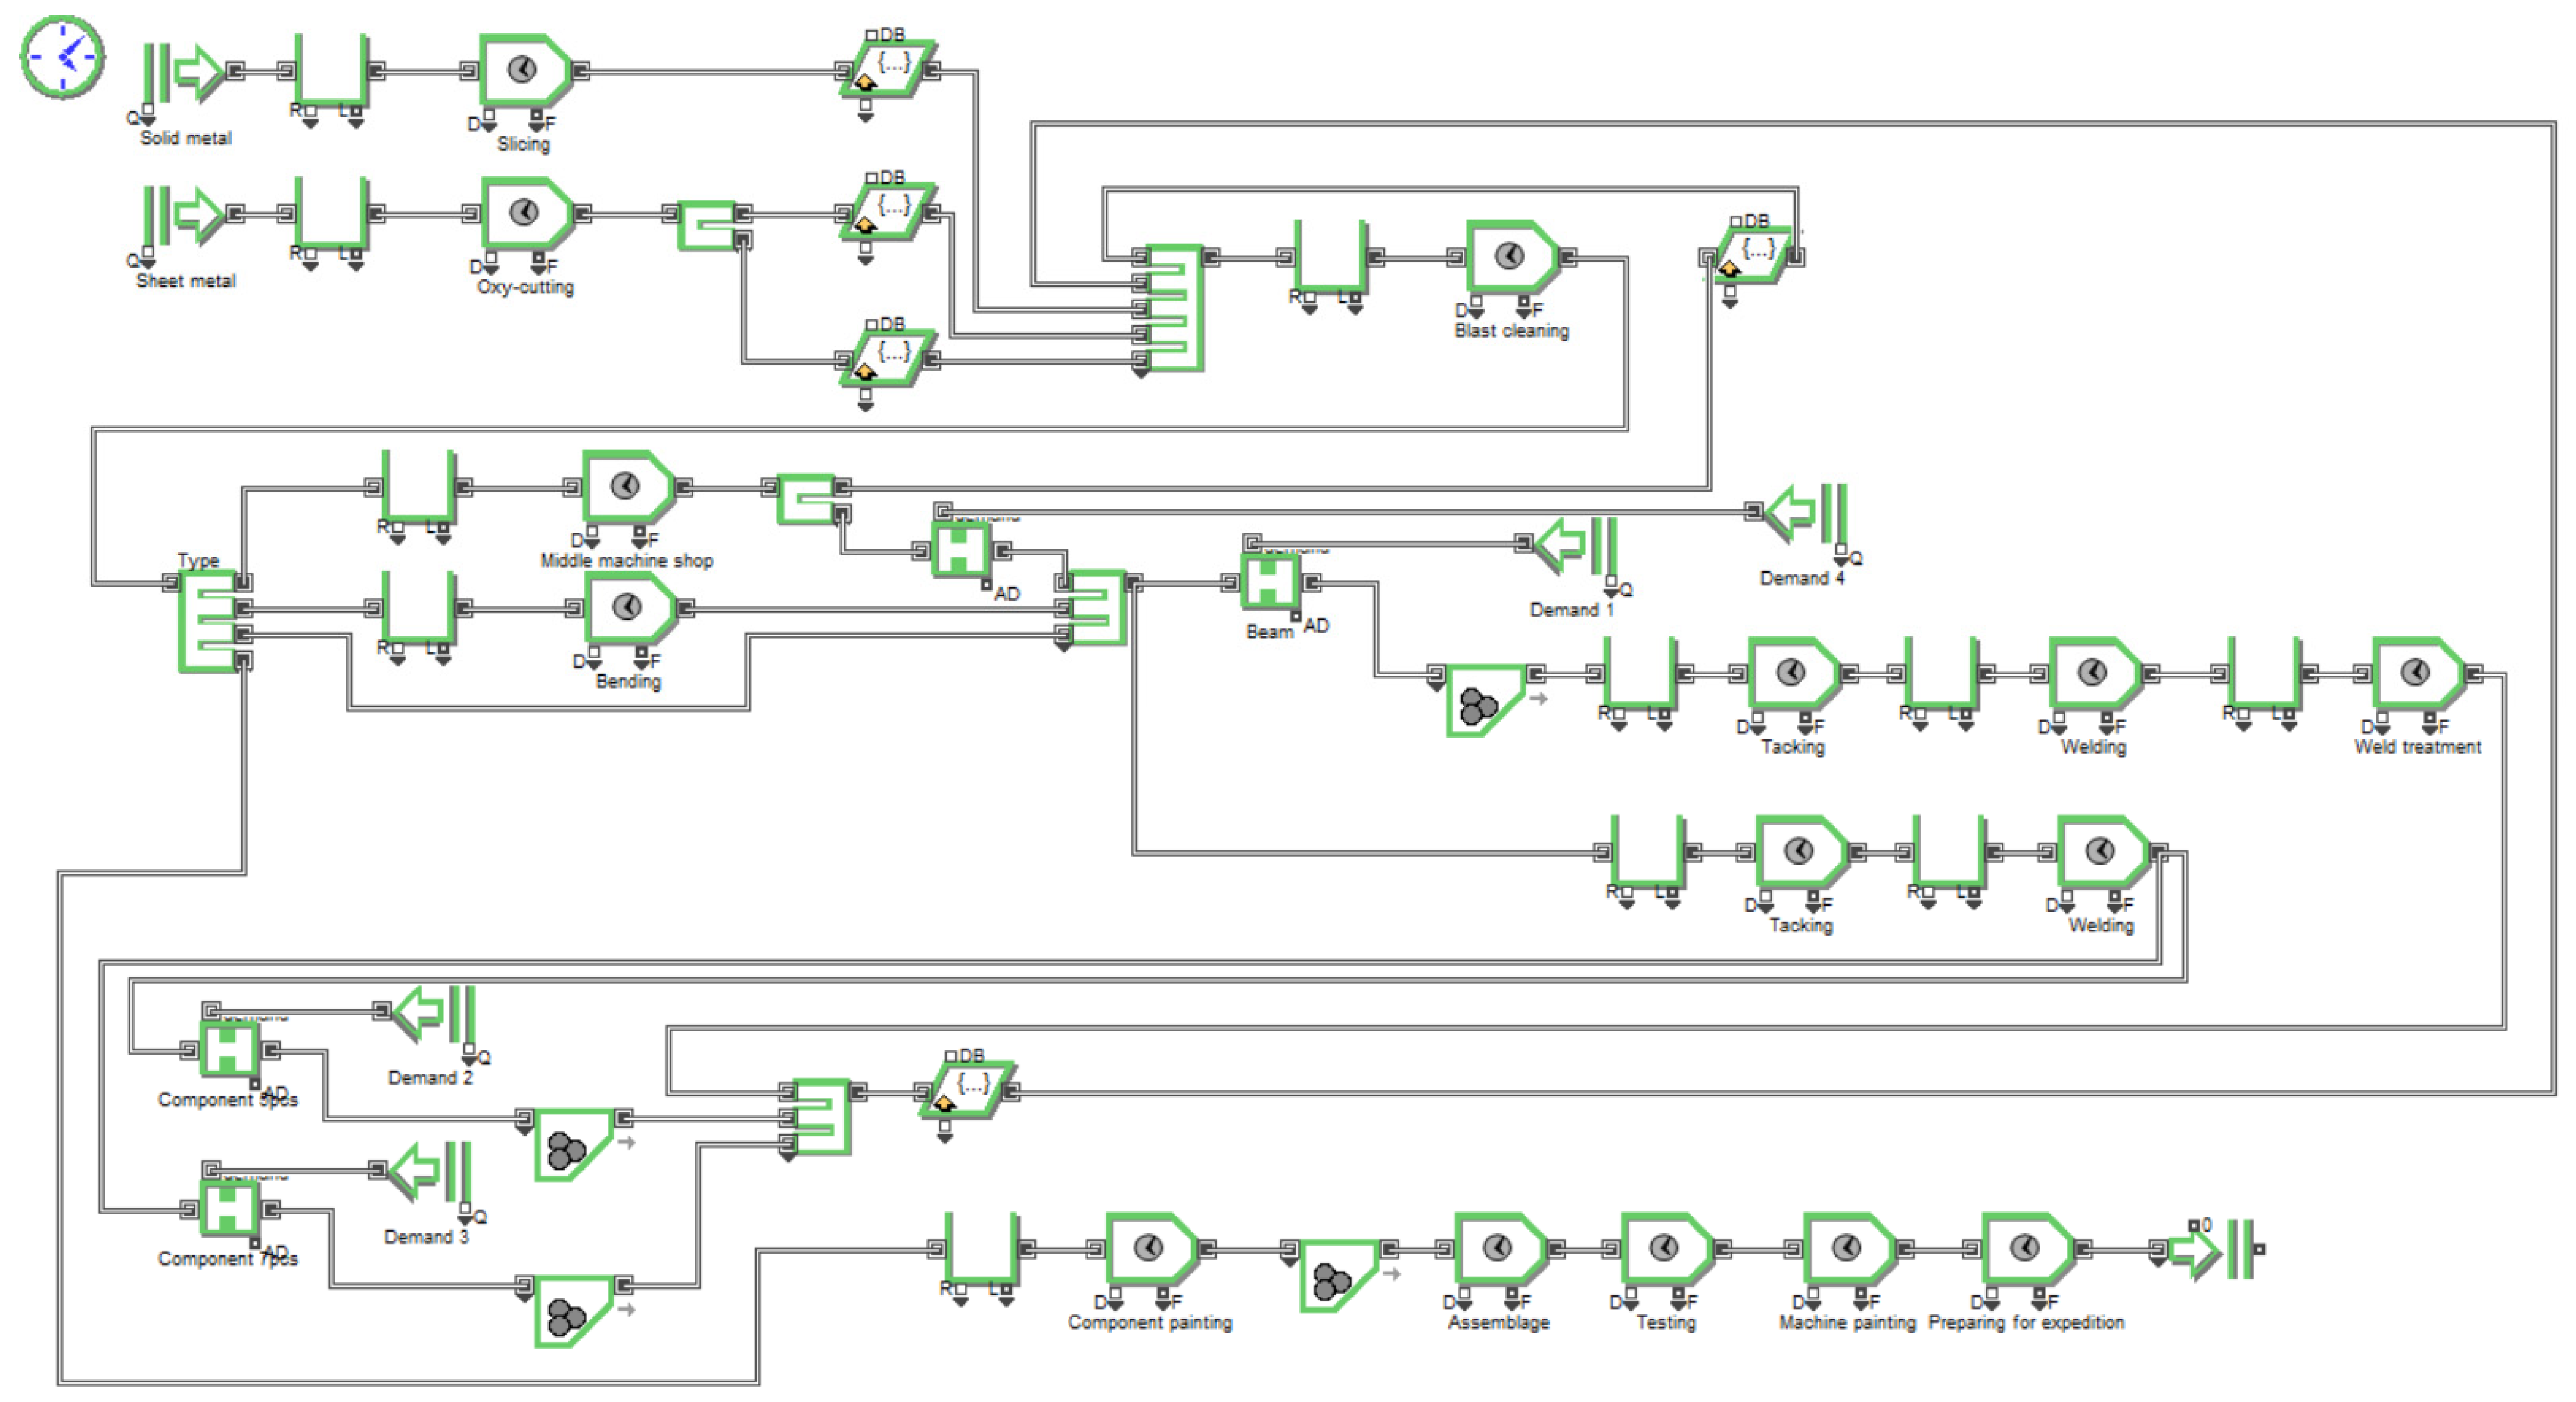
With the aim of sustainable production development, the production process has been upgraded. The enterprise starts to look for new possibilities for production, possibilities of involving new technologies in production, and, at the same time, possibilities of reducing the environmental impact of production operations. A detailed system analysis is carried out to understand the production process. From the described elements of the system from their relationships and functions, it is subsequently possible to create a simulation model of the enterprise (Figure 1) and make a simulation to assess the current state of the production process and possibilities of the enterprise for further heading.
Simulation analysis pointed out significant flaws in the blast cleaning operation. The blast cleaning operation is classified as hazardous due to the waste created in the form of particulate matter. The matter can include toxic metal particles such as arsenic, chromium, lead, nickel, etc. The matter could cause respiratory problems, decreased lung functions, and aesthetic and ecological problems. The operation decreases visibility at the workplace and may cause unwanted noise [51,52]. This operation is important for production in this enterprise and is also used several times in the production process. The simulation results showed the operation’s inability to achieve the required performance. The operation represents an obvious bottleneck in the process, with significant delays in material flow and a large number of requests waiting for processing before the operation. The system analysis also identified wastage of energy and environmental pollution around the machines carrying out this operation. The machines are very obsolete, energy-inefficient, and polluting the environment. From the point of the economic objectives of the company, the simulation pointed out the long production of the vibrating screen and the need to shorten the duration of the production.

Bottleneck Statistics

Based on the analysis, the blast cleaning operation appears to be a bottleneck of the production process. This bottleneck in the production process causes a long duration of the order production, increases the need for free space before it, or blocks other operations. This is due to the accumulation of unprocessed semi-finished products before the operation (see Table 2). It significantly burdens the working environment with small balls. These are generated as waste in this operation, and they are not absorbed, so they leak out into the area. The use of obsolete technology puts the worker’s health and the environment at risk, and the costs of performing this operation are high.
If the operation is used, it is necessary to point out 100% usage during the first 47 h. That is when the operation is processing demands continuously and without reserves. Subsequently, until the end of the production, the operation in the simulation is used at 0%. However, in an enterprise, they proceed to process the demands of the next order on a given operation. They do not wait for the previous order to be fully completed.

4.2. Solution for Bottleneck Elimination

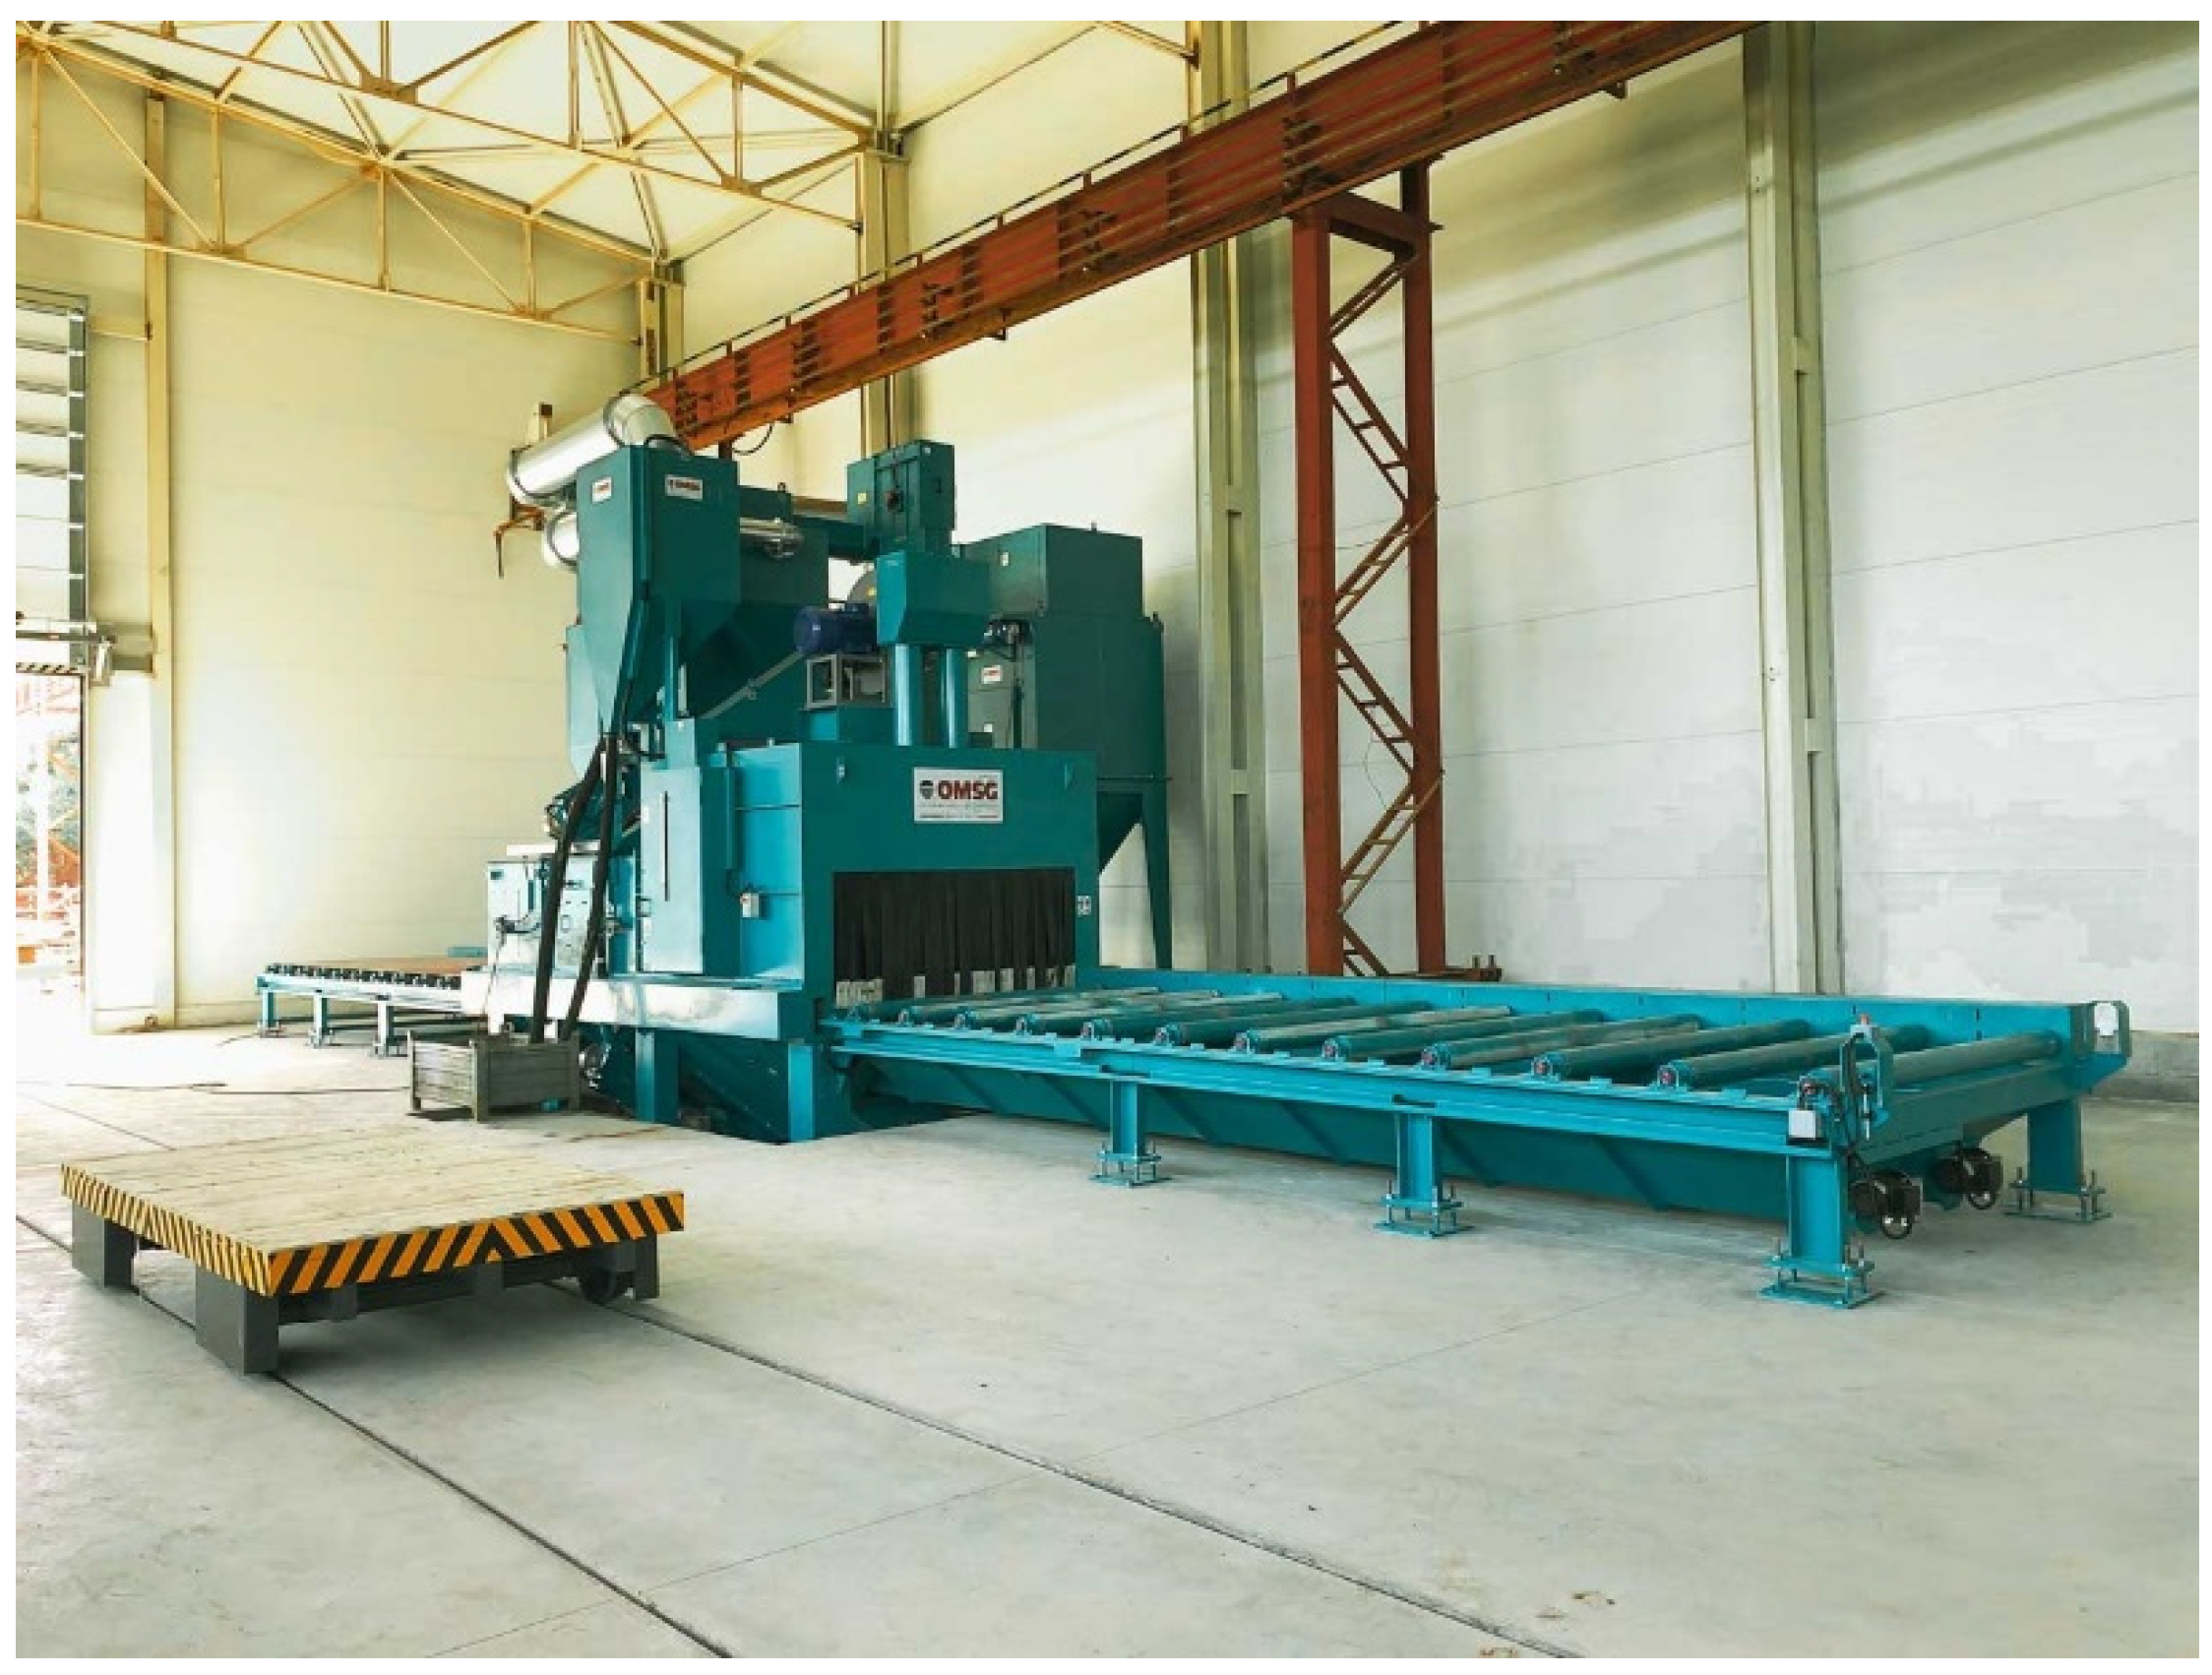
The blast cleaning operation is carried out in the production process on two obsolete machines. The problems arising from their use are stated in Section 4.1. The enterprise also uses a blast cleaning handgun as the third option of processing the blast cleaning operation. Its primary use is for blasting hard-to-access places of materials and large-sized components. The suggested solution of the bottleneck elimination should keep the handgun blasting, but it must shut down the use of obsolete machines. The production process is innovated by obtaining a new technologically advanced and automatic blasting machine, while, at the same time, removing two obsolete machines from the production process. Based on market analysis and consensus of the sales and production director, a wheel blast machine LAUCO 200 NS (Figure 2) is acquired. The Wista company offers the machine and also offers instructional training for working with this machine.
The acquisition of this machine can bring new possibilities for the production process of the enterprise in the blast cleaning operation processing:
  • Possibility to choose to process from the menu of prepared programs;
  • Operators needed only in case of loading and unloading of material from roller conveyor;
  • Seven meters long conveyor allows the processing of sheet metals even in their original dimensions of 6 × 2 m, unlike the previous approach when sheet metals were processed only after their division into smaller dimensions;
  • The machine is equipped with four blasting wheels and a rotary brush, which speeds up the processing, so the average length of the programs is from the interval of 3 to 6 min, compared to the previous 6 to 10 min;
  • The machine is equipped with FAC 12/10N EX1 filter and waste container, thus preventing waste from penetrating the environment.
However, the production process must be redesigned to use this new technology effectively. The redesign is then verified by simulation. After demonstrating the benefits and improvements based on the simulation, the new machine is purchased.

4.3. Redesign of the Production Process

The main reason for changing the organization of the production process is the possibility of blast cleaning sheets of metal in their original dimensions of large boards. According to the technical drawings, the original production process firstly divided these boards into pieces with the required dimensions. These pieces subsequently entered the blast cleaning operation, which represented a rapid increase in the demands that this operation must process. In the simulation model, the production redesign is manifested by inserting the blast cleaning operation on a new machine before oxy-cutting the sheets of metal. The sequence in the case of solid metals has been preserved. The second change that has occurred in the model is the division of the flow of components. The components are blasted in the model after welding. After implementing the new machine, the components can also be diverted to blast cleaning with a new machine. In this case, however, it is necessary to point out the disadvantage of the new machine. This machine cannot process large-sized components that do not fit in the machine chamber (Figure 2). Also, its blasting wheels do not get under the fold or have other protrusions. The decomposition of the component’s flow into two flows must be specified by the shape of the component. Medium-sized components come to the new machine. These components must be mostly a flat surface and without various folds and protrusion. Oversized components and very small components, e.g., flats and intricately shaped components, come to the handgun blast cleaning. The above changes show that the redesign of production reorganizes mostly the initial part of the production process (see Figure 3).

Impact of the Redesign on the Layout of the Enterprise

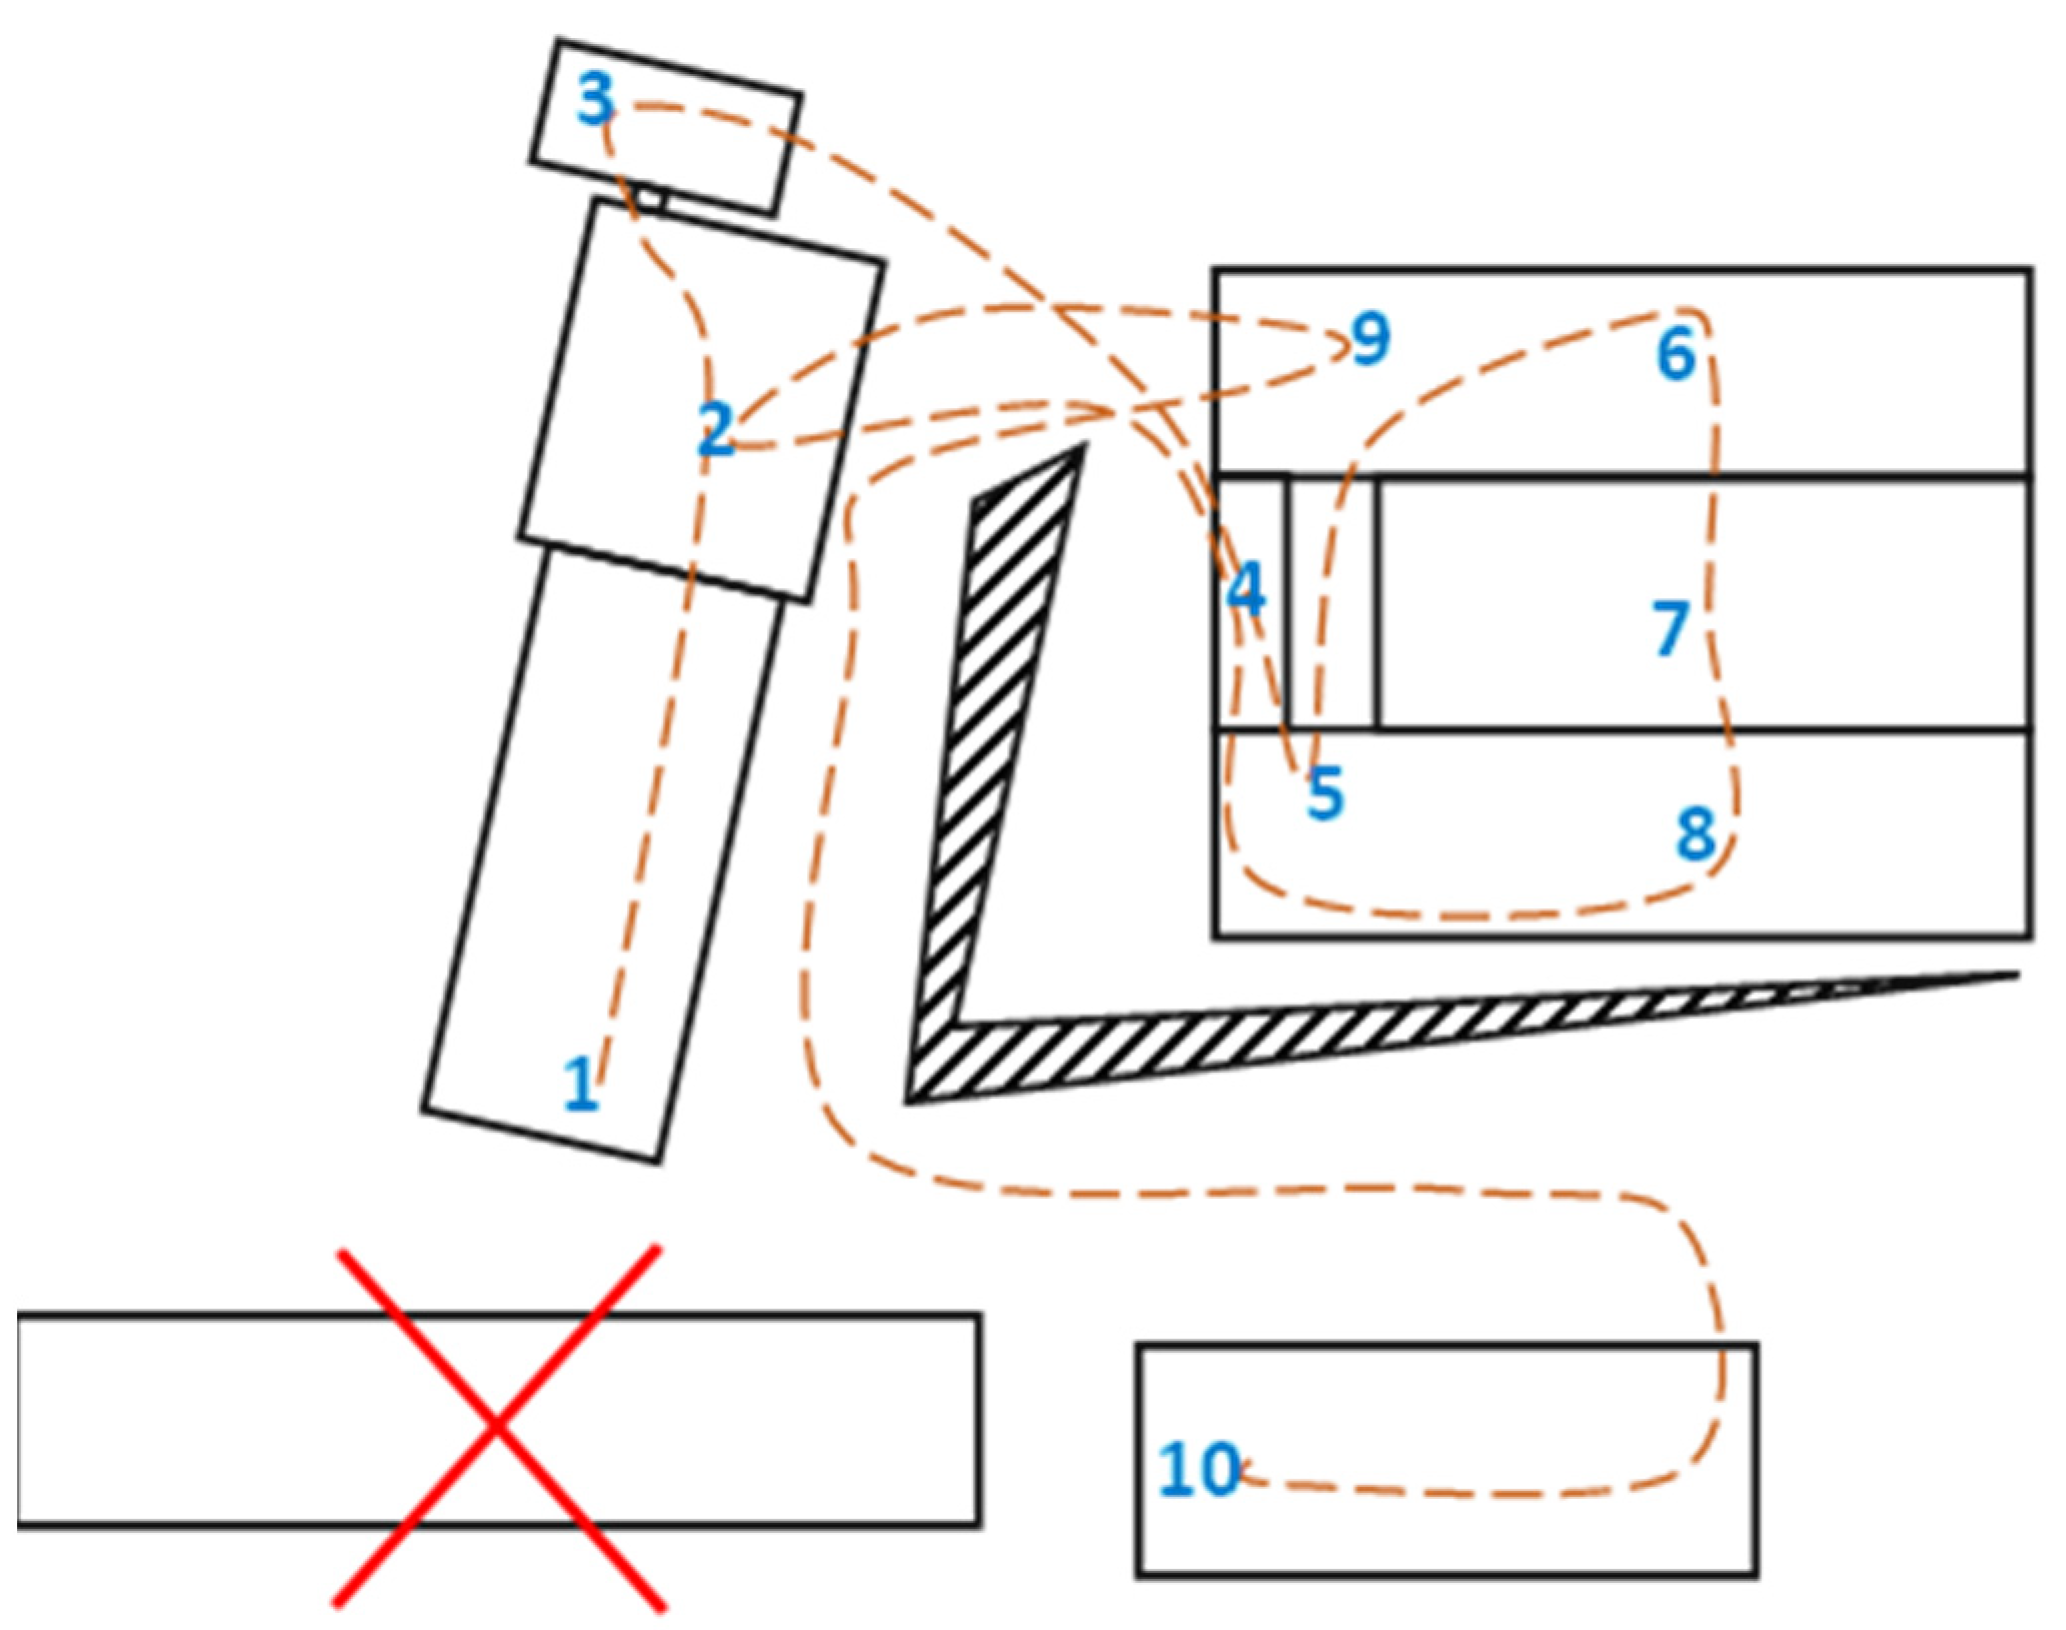
After implementing a new machine into the model and modifying the design of the production process, it is also necessary to deal with the reallocation of the machine in the enterprise area. A sufficient area is required for the machine’s location, not only for the machine itself but also for its operating staff, maintenance, and the material that will be processed on the machine. According to Figure 4, the production process begins by material leaving from the warehouse marked with the number 1. The material passes through an empty building, which is crossed out and comes to splitting operations, marked with numbers 2 and 4. In turn, the next operation is the already identified bottleneck, i.e., blast cleaning. The handgun blast cleaning is marked with the number 3, and the two obsolete machines have the number 5. The material must not pass through a black hatched area showing the height difference of the terrain. After blast cleaning, the material returns to the main hall, where, in places marked with numbers 6, 7, and 8, the machine components are made, e.g., welding and tacking. Subsequently, the manufactured components are blasted again, at positions marked with number 3 or 5. Components with places that cannot be painted after assemblage come back to the hall, and, at number 9, these places are painted. Then, all the components meet in the hall with the number 10. At this point, the final assemblage, testing, and painting of the manufactured product is carried out. After that, the products are prepared for the expedition and waiting for a transport vehicle.
For the allocation of the new machine, it is the most effective to use an empty hall (crossed in Figure 4). The hall is well-conceived so manufacturing operations follow up, and the placement of the machine in it also significantly shortens the material’s trajectory during production. With the shutdown of two obsolete machines, we acquire spaces in Hall 5 (crossed in Figure 5) for other business opportunities.
The material’s trajectory change is shown in Figure 5 where the production process begins as before in the warehouse. Then, the material goes to a new machine for blast cleaning into the hall right next to the warehouse (number 2 in Figure 5). The material is then divided (numbers 3 or 5 in Figure 5) into the required dimensions as in the original process. The material, which could not be processed on a new machine, is blasted with a handgun at the number 4 in Figure 5. Follow the production of components in the same place as before (numbers 6, 7, and 8 in Figure 5), and blast cleaning of components is divided between the new machine and the handgun based on their shapes. The end of the production process remains the same. The components with inaccessible places are painted in the main hall (number 9 in Figure 5). Then, all components go into the assembly hall (number 10 in Figure 5) for assemblage, testing, whole product painting, and preparation for the expedition.

4.4. Simulation of the Redesigned Production Process

After a presentation of the intended innovation of the production process and describing the redesign associated with this innovation, it is the priority of the enterprise to identify and evaluate the benefits of the change. The classic methods, e.g., prototype plant verification, is costly to introduce. Such a method represents a waste of the enterprise’s resources in the Industry 4.0 era. ExtendSim simulation is used to evaluate the innovation of the production process. The simulation model has been modified and refined based on the simulation model used in the system analysis (Figure 1). In the creation of the simulation model, the following steps are followed:
  • The labelling of materials and semi-products and products for easy orientation has been unified;
  • Tables have been created with individual parameters of the simulation model and its blocks;
  • A sketch of the model has been created based on the production process diagram after the redesign and simulation model used in the system analysis;
  • A simulation model of the production process has been constructed and verified for the need for accurate simulation results;
  • Model experimentation has taken place to obtain data that confirms or refutes the correctness of the innovation.

4.4.1. The Simulation Model Parameters

For the logical functioning of the model, the labelling must be uniform and as appropriate as possible. For these needs, a property material was created in the model. This property must have each demand in the model. This property is used to distinguish the status of the demands during the production process and for quick navigation in the simulation model. The general abbreviation of the material is for metal sheets P, for solid metal H, and for components D. In the simulation model, a closer specification is also needed. Not all metal sheets and solid metals have the same flow or processing times. Similarly, components must be more closely distinguished because not all of them have the same processing time, flow, or direction. Specific abbreviations of property material are listed in Table 3. These abbreviations are based on dividing three basic material groups into different types into each of these basic material groups.
After ensuring uniform orientation in the model, it is necessary to identify the individual parameters of the blocks used in the simulation model. Parameters must be as accurate as possible for model verification to be successful.
The Create block creates demands in the model. We can see it as a stock release from the storage in a real system. The trolley takes a metal sheet from the warehouse every 4 min in the real system. As a rule, always first thin sheets and then thick sheets in the quantity specified based on the order (Table 4). For better understanding, a thin sheet is any sheet with a thickness of up to 12 mm. Sheets with 12 mm or more are thick. Stock release of the solid metal works in the same way but every 5 min. As a rule, it begins with the stock release of bar stock on the structural material and only then on flat segment material.
Other important parameters necessary for the simulation model are the duration of processing individual demands by production operations (Table 5). These times were detected empirically by observation and measurement directly during production. The only exception is a new machine added due to innovation. Processing times of this machine are determined by information from the supplier.
In Table 5, processing times are based on distribution functions. The distribution functions represented in the table are:
  • Normal distribution function, characterized by the main processing time and deviation to this time;
  • A constant distribution function in which the processing time is the same, constant;
  • Triangular distribution function, based on 3 values, namely the shortest processing time, the longest processing time, and the most likely processing time.
Table 5 lists four possible processing times for the blast cleaning operation. This is due to two different methods in this production operation. The first is a handgun blast cleaning, where, on average, processing takes 8 ± 2 min, but, in the case of flat segments, the processing is shorter, only 2 ± 1 min. The second is a new machine blast cleaning that adjusts the intensity based on the thickness of the material. In the case of thin metal sheets, the intensity must be less, so the processing takes 5 ± 1 min, and, in the case of thick metal sheets and components, higher intensity can be used, so the processing takes 4 ± 1 min.
In Table 5, three processing times are behind the slash. This marking is intended to distinguish the production of a beam. The beam, as the largest and main component of the final product by the duration of its processing, does not fit in the processing intervals of other materials or components. Its production is especially long, and it must be very thorough. In this case, to avoid distorting processing intervals, a fictitious separate flow was created in the simulation model. In this flow, beams are produced with processing times in the table behind the slash. Weld treatment in the vibrating screen manufacture is carried out only for beam welds, i.e., the length of weld treatment is not specified for other components. Weld treatment means checking beam welds with ultraviolet light and smoothing the welds. Classic visual check happens during welding for each component.

4.4.2. Simulation Model of the Production Process

In previous sections, parameters, markings, and foundations for creating a simulation model are clearly defined to match the real production process as much as possible.
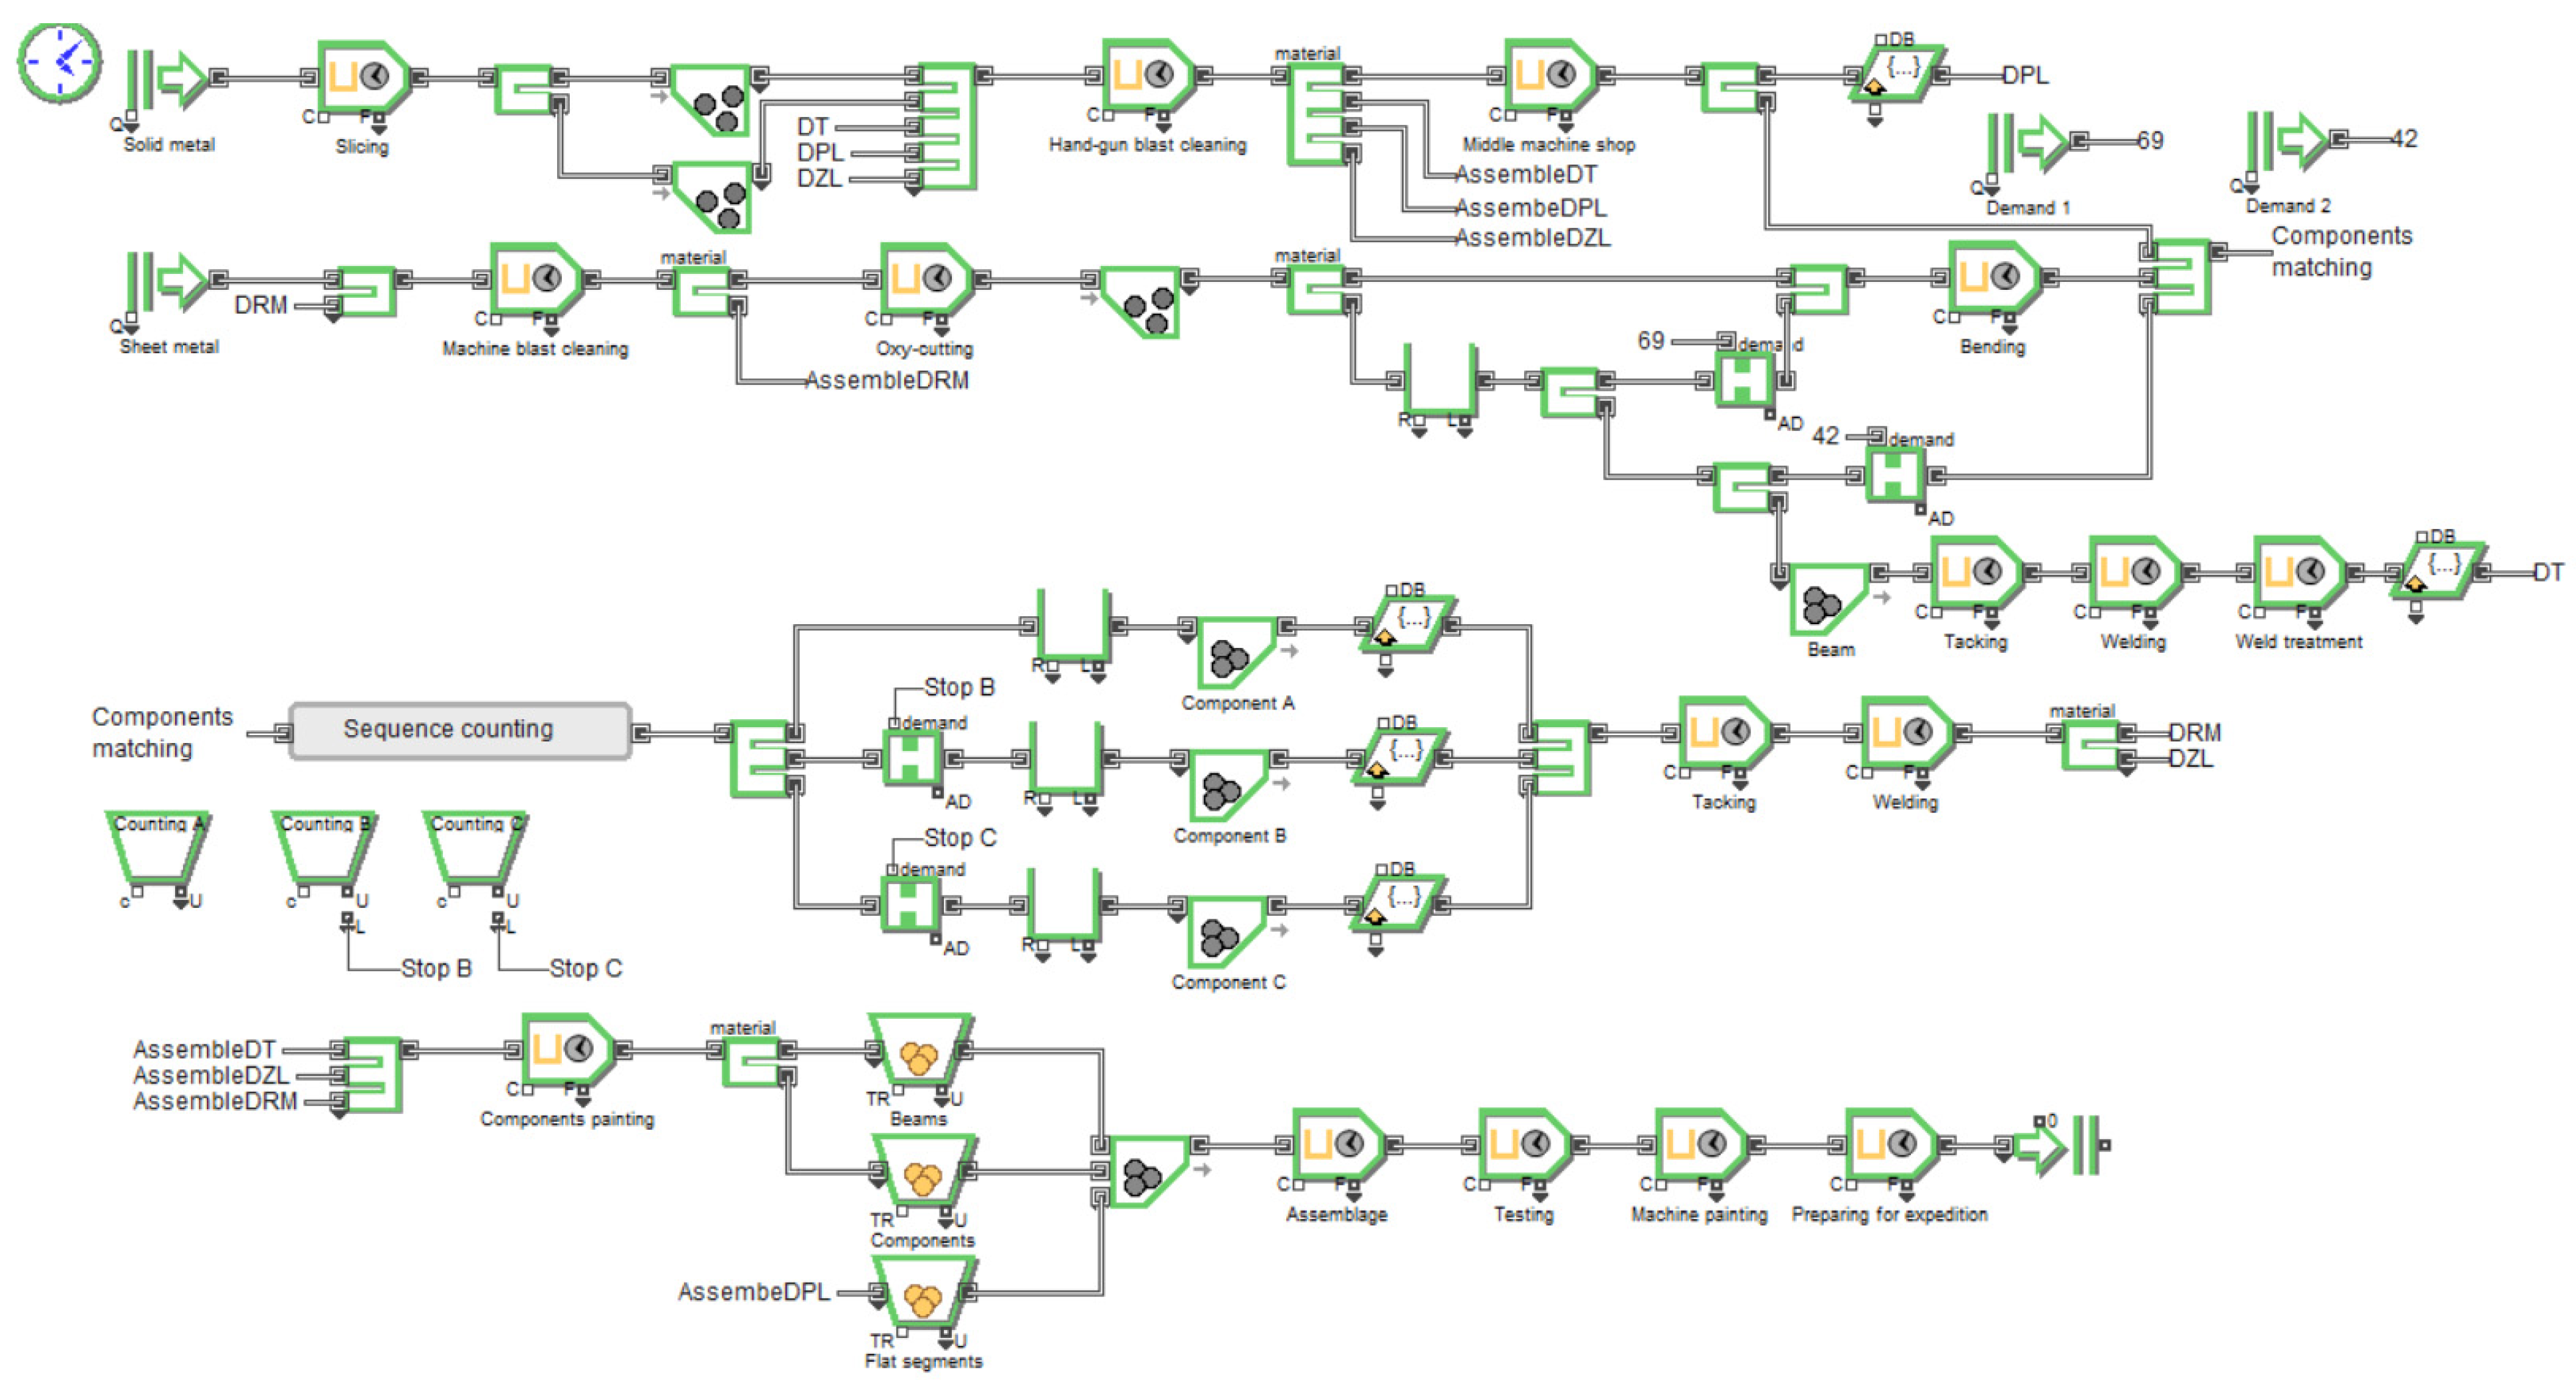
The redesigned process’s simulation model (Figure 6) begins with two create blocks. The blocks generate demands to the model based on the principle of material released from the storage. Subsequently, solid metals are sliced into smaller parts according to the technical drawings. These parts go to the handgun blast cleaning for surface treatment.
After generating, the metal sheets are surface treated on a new machine blast cleaning. The metal sheets are cut into smaller parts according to the technical drawings.
In the second phase, sliced solid metals are processed in the middle machine workshop. After this processing, from flat segment material, flat segments are created. The flat segments are components that return to handgun blast cleaning and then go to the Resource item block. They are waiting for the other necessary components to start the assemblage in the block Assemblage. Structural material continues through the Sequence counting block to the components batching.
After cutting the metal sheets, pieces are divided into two directions. The first direction goes to bending. All thin metal sheets and exactly 69 thick metal sheets are bent and go to components batching. Of the remaining thick metal sheets, 42 metal sheets go right to the components batching. The rest of the thick metal sheets left after subtracting 69 and 42 are beams-forming and go to a fictitious flow in the simulation model. In this flow, 13 pieces of these metal sheets are connected in the Batch block to form one beam. Before the beam becomes a component, it must be tacked and welded, and welds checked. After these operations, the component beam is surface treated by the handgun blast cleaning operation. The beam’s inaccessible places are painted by components painting operation. Such beams then wait in the Resource item block until the Batch block calls them before assemblage.
In the third phase, all the material that has been directed to the components batching pass through the Sequence counting block, which ensures the even formation of 3 types of components in the model. The three Batch blocks form the A, B, or C components. These components are tacked and welded. After these operations, the finished components are divided into consistent components and complex components. Consistent components are processed at machine blast cleaning, then at component painting and go to the Resource item block, where they are waiting for assemblage. The flow of complex components is similar but with one difference: they are surface treated by the handgun blast cleaning.
The Batch block requires 1 beam, 18 components, and 21 flat segments from Resource item blocks to assemble one vibrating screen in the final stage. These components are assembled, tested, painted, and prepared for the expedition. Sub deliveries, e.g., engine, are also entering the assembly. We can assume that these sub deliveries are already in the assemblage block. Orders for a vibrating screen usually require six pieces of vibrating screen, so all parameters and simulation are designed to produce six pieces of vibrating screen.
The Sequence counting block is a hierarchical block that contains several basic blocks of the ExtendSim simulation program. The Sequence counting block is used to ensure the batching of three types of components in the required quantity for each vibrating screen. A components need 9 pieces of material each, and the assemblage needs exactly 9 pieces of this component. B components require 6 pieces of material each, and there are exactly 5 in the vibrating screen. C components require 5 pieces of material each, and there are exactly 4 of them in the one vibrating screen. According to the previous numbers, Resource pool blocks ensure the right batching of A, B, and C components. These blocks are set on the exact number of materials needed to batch each type of component for one vibrating screen. Each time demand passes through the Queue block in front of the Batch block, the value in one of the Resource pools decrease by one. Which pool is decreased depends on which the demand has selected component Batch block. If the value in the Resource pool is zero, the Gate block in front of the corresponding Batch block is closed. The sequence counting block (Figure 7) resets values in the Resource pools when the last piece of material to the last component of one vibrating screen pass through. The Gates will open because Resource pools are no longer equal to zero, so component batching for the next vibrating screen can start.
In the Sequence counting block, block Equation compares numbers of passed demands with 131, 262, 393, 524, and 655. If the number of transitions reaches these values, the last material for the components batching has come per product. The equation changes the renew value from 1 to 0, and the Gate block closes. The last demand must pass through Release A, B, and C (Figure 7) to reset the value in the corresponding Resource pool. If there are values other than those mentioned above in the Equation block, the renew value is 1, and the block Gate is open.

4.5. Simulation Results

The simulation of the created model was performed 50 times. The subject of monitoring is mainly the utilization of the machine blast cleaning in the production process and the duration of the production of the order. In Section 4.1, a production time interval of 3800–4100 min is given. This interval is the result of simulation analysis prior to redesigning the production process. The simulation during the system analysis simulated the production of only one vibrating screen at a time. Simulation after the redesign is designed to simulate the production of the whole order, i.e., six vibrating screens. Table 6 shows the production times of the order from each simulation performed and then the average production time, as well as the average production time of only one vibrating screen.
According to the results of the simulations, we can say that with the machine blast cleaning in the production process and subsequent redesign of the production process, the enterprise can reduce the production time of one vibrating screen by almost 50%. If it is assumed that the enterprise is working two shifts of 8 h and we do not count possible over time, the enterprise will only need 2 days to produce one vibrating screen and 2 weeks to produce the entire order. Production is not expected on weekends.
Another desired output from the simulations is the utilization of the blast cleaning production operation. After the redesign, this operation is performed by a new wheel blast machine and handgun. The simulations monitor utilization and the queue’s occupancy before both blast cleaning options.
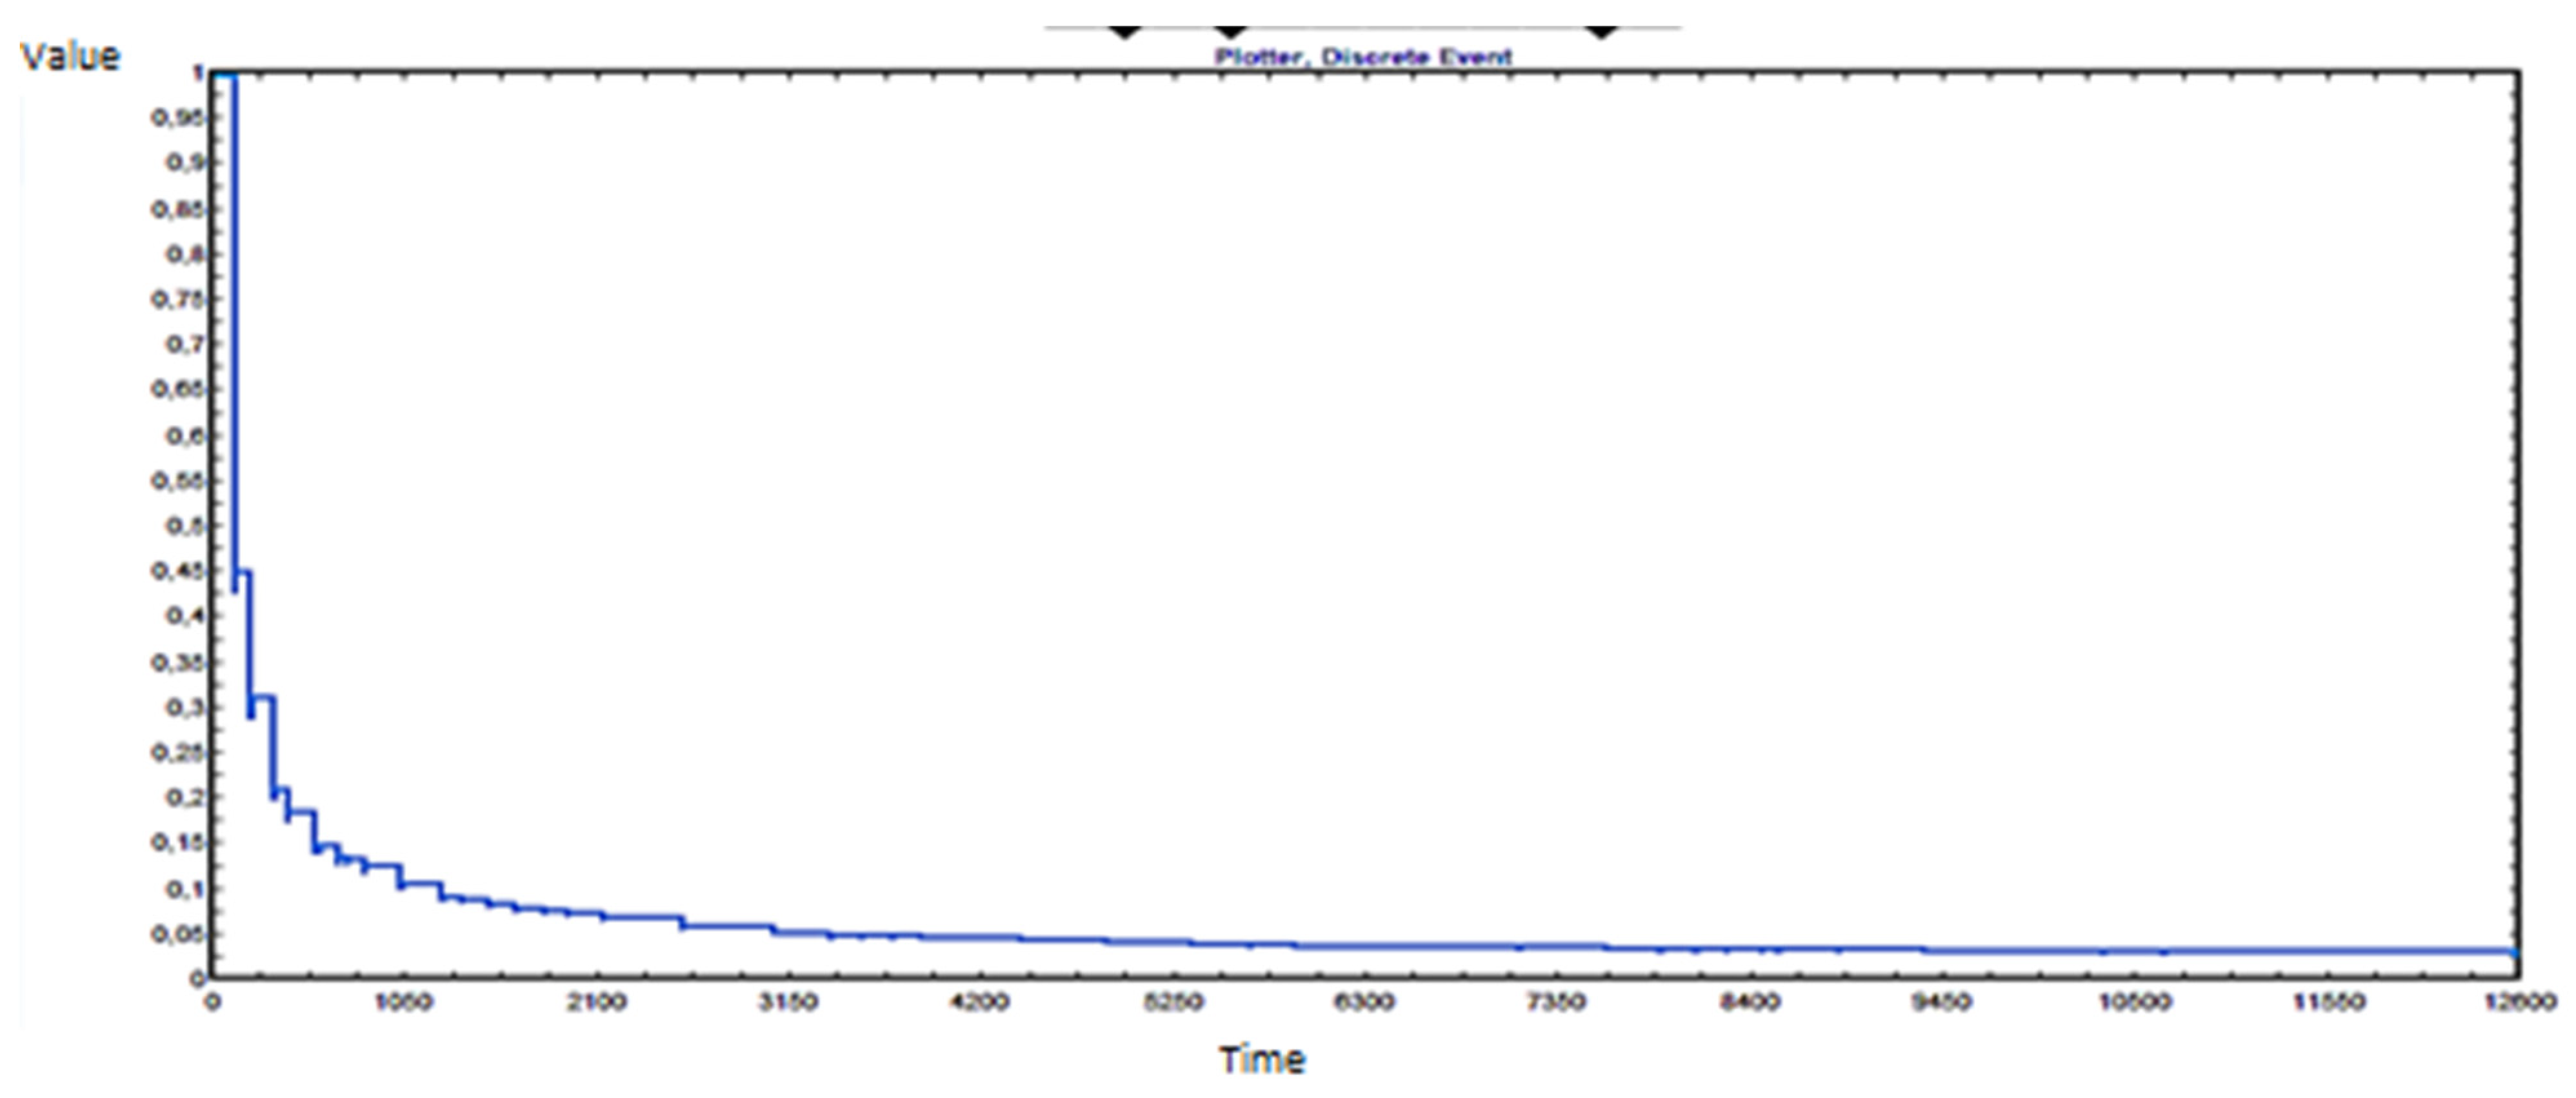
Machine blast cleaning is an operation that has significantly accelerated the production of the order, and its utilization is on a low level (Figure 8). Such utilization can be considered a positive since the enterprise in which the redesign is performed focuses on custom production. In the case of insufficient capacity utilization of the wheel blast machine on this order, the enterprise opens the possibility of transferring production capacities to other orders and thus make efficient use of the available production capacities. Another positive may be the possibility for the enterprise to use these free production capacities for pre-production, which can accelerate the production of individual orders.
The queue before this production activity is occupied rarely, so we have sufficient space. The maximum length of the queue reaches 3 demands.
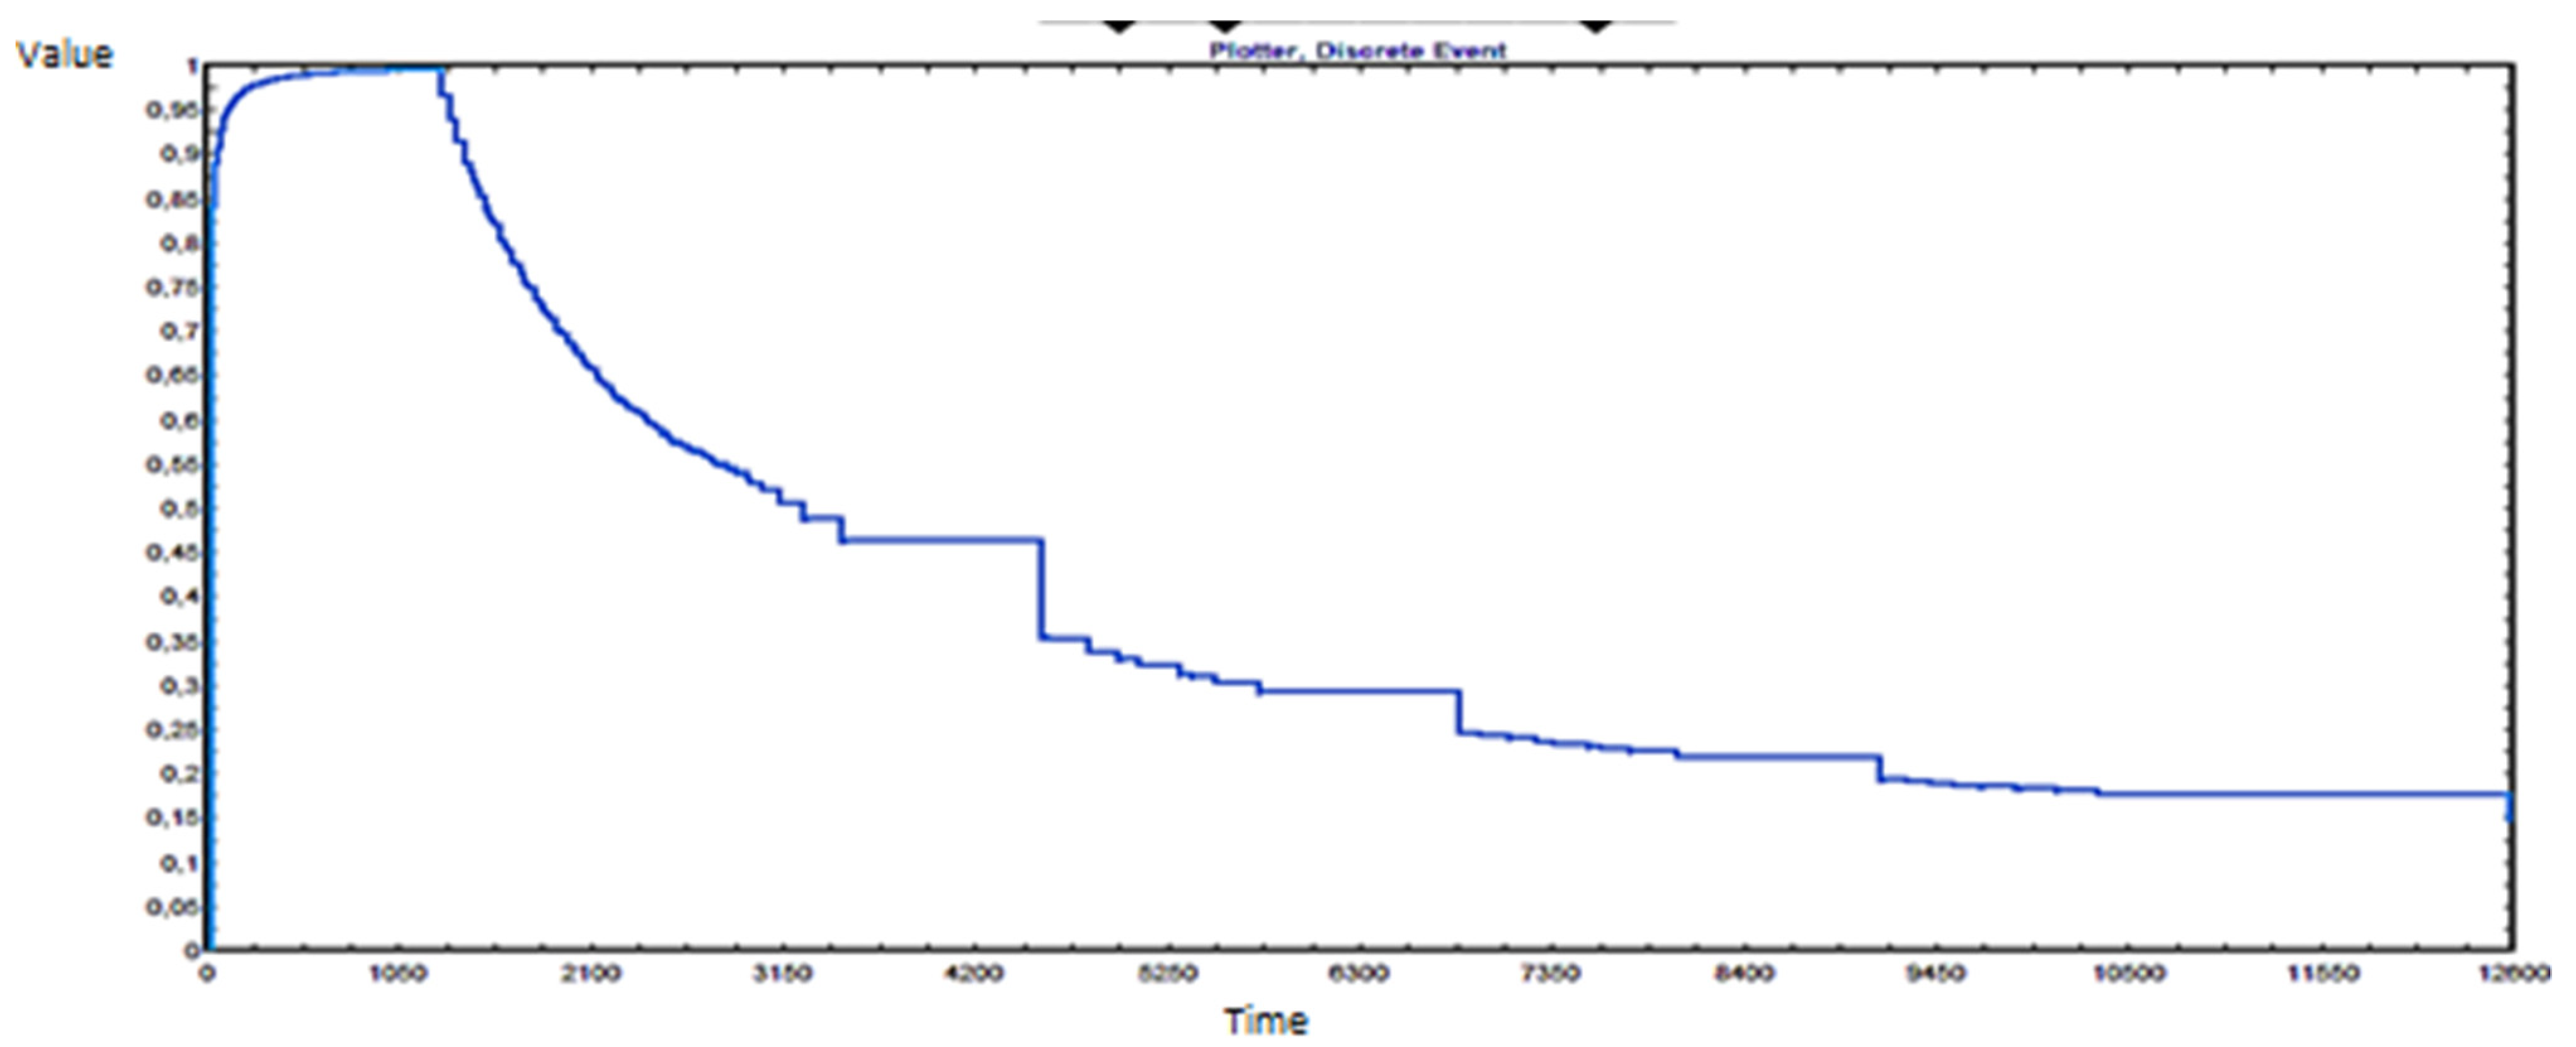
Handgun blast cleaning already reaches higher utilization (Figure 9). However, this activity still has a sufficient capacity reserve. From the logistics point of view, it would be advisable to find a solution to divide the incoming demands more equally between handgun and machine blast cleaning. The maximum length of the queue also declares this inequality before handgun blast cleaning, which sometimes reaches up to 221 demands. This number of demands also indicates the need for sufficient space in the location of the operation. The demands that may cause the high queue’s occupancy for this activity are flat segments, only a few centimeters in length. Technologists should look for the possibilities of mass blast cleaning of these flat segments by wheel blast machine.

5. Discussion

A simulation is a tool that offers more statistical results. Section 4.5 simulation results are mainly devoted to the decisive factors influencing the decision to implement the proposed innovation into the enterprise’s production process. However, the simulation also provided other results showing the direction of the production process (Table 7).
Most production operations in Table 7 are low utilized. In the case of custom production, it represents free production capacities for other orders. However, these questions also need to be asked:
  • Does the production process need so many workers at tacking operation?
  • Does the quantity of welders exceed the optimal need for the production process?
  • Does the production process need to reallocate the workforce more effectively?
  • Does the assemblage operation require reinforcement by the worker? Will such a reinforcement speed up assembly time?
Redesign plays a significant role in shortening production time and removing the identified bottleneck. However, the innovation of the production process of an enterprise should not end only with the redesign presented. A new bottleneck is created elsewhere in the production process by removing a bottleneck. According to the table above, we can identify the newly created bottleneck.
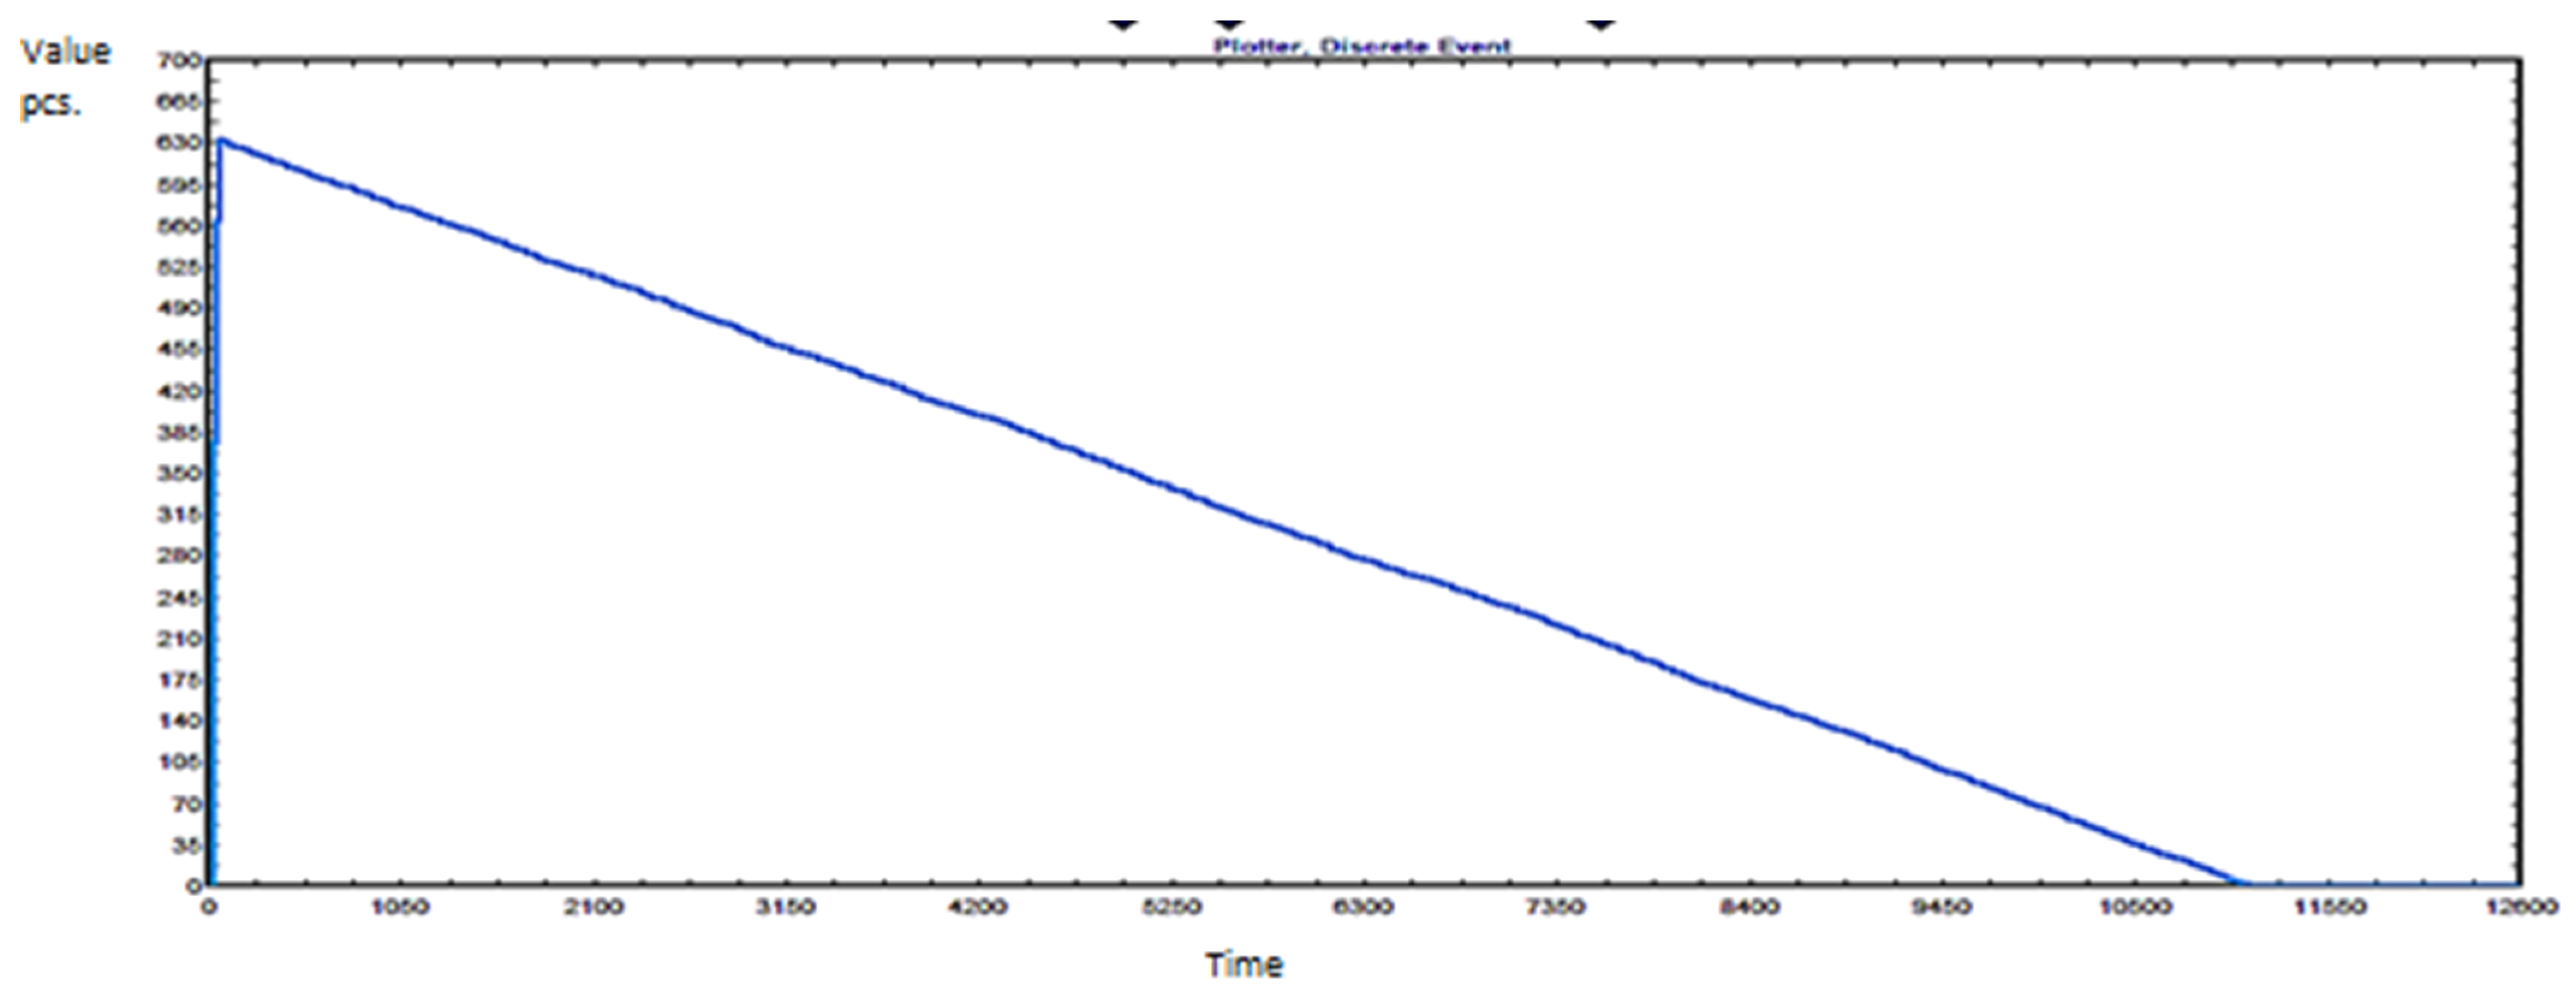
After streamlining the blast cleaning operation, bending does not meet production process requirements. During the production of the sample order, it processes a total of 636 demands, and the maximum length of the queue reaches, at some point, 632 demands waiting for the processing (Figure 10). Such a quantity also requires a large space in the location of the operation. The utilization of the operation is diametrically higher than other operations utilization (Figure 11). The enterprise should pay attention to this operation in the future. The question arises as to whether such a medium-sized enterprise can afford another investment after purchasing the LAUCO 200 NS machine. In this case, will it not be more advantageous for the enterprise to look for other options? For example, will outsourcing the bending activity be a sufficient and more economically acceptable solution to the new problem?

6. Conclusions

The case study carried out in the medium-sized enterprise aimed to take the first step towards the sustainable development of production, eliminate the bottleneck in production, and shorten the production process. The conditions of Slovak SMEs are tough, but, as our case study presents, there is always a way to start building the basics of sustainable development. The other Slovak SMEs may follow the presented example. We proved that even the simplest Industry 4.0 solution brings desirable improvement.
The means to verify and evaluate the suggested solution was a simulation in the program ExtendSim. Using simulation, the enterprise avoided the waste of resources and saved time needed to verify in classic and established ways. The model developed to evaluate the implemented innovation is a tool that enterprise can use even in the future. The model can be used to validate and evaluate future solutions to problems in the enterprise. The model can be used in the enterprise for capacity planning of agreed orders. This planning is based on one month period in the enterprise. In addition, simulation can quickly answer if spare time capacities are enough to sign special orders during the planning period. The custom production of the enterprise shows the flexibility of its production process. However, the core of the production process is essentially uniform, and the model created for the sample order, with the right modifications, can simulate the production of any order or solution to another problem. Slovak SMEs should start with proper system analysis. A deep understanding of their production process is the key. There are only small steps to the creation simulation model from system analysis. Simulation and simulation models could be used in many ways in the productions process, as declared above.
The results of the simulation are analyzed according to each production operation. The analysis demonstrates the correctness of the solution to the problem and confirms the main objectives requested. In addition to the main indicators, other outputs are evaluated after implementing the solution.
In the case of machine blast cleaning, the possibility of pre-production is open for the enterprise. The free production capacity of this operation can also be offered by the enterprise to external subjects and, thus, the enterprise can obtain additional profits. On the other hand, it also pointed to the shortcoming of this operation, which did not equal the demands from handgun blast cleaning. Although handgun blast cleaning is much less busy than in the original process, it still must process more demands than the machine blast cleaning. There is a challenge for technologists to reduce machine blast cleaning limitations and achieve greater balance.
Negative outputs include identifying a new bottleneck. After streamlining the blast cleaning operation, bending cannot quickly process the demands and holds back production. The acquisition of a wheel blast machine represents a high investment solution for the enterprise. Therefore, the enterprise must seek low-investment solutions to eliminate the new bottleneck. At first, bending metal sheets to stock or outsourcing the operation seems rational.
A question remains upon the allocation of workers of tacking and welding. To produce the beam, one tack worker and two welding workers are needed in the production process. In the case of the manufacture of other components of the product, seven workers are tacking, and seven workers are welding. Tacking and welding beams achieve higher utilization. On the contrary, the utilization of these operations for other components is relatively low. The enterprise should start to think about the analysis of the workforce. After analysis, the enterprise can answer questions about the optimal need for workers and their correct allocation between production operations.
Slovak SMEs must understand that sustainable development is a complex and complicated goal. In the beginning, the resolved problem shows other problems. There is no way to achieve sustainable development just by one simple solution. Therefore, when the basis is given, SMEs must realize that further work is needed and keep fighting with their problems towards sustainable development.
Based on simulation statistics, the suggested solution has been accepted by the enterprise and implemented and used in the company since 2021. After the redesign, the outputs of the real production process correspond to the expected outputs obtained by simulation before the solution was implemented.
After the implementation of the innovation, chosen sustainability indicators were improved. Indicators of energy use per production unit and environment and workplace pollution were decreased due to the elimination of obsolete machines. Indicators of order acceptance rate and worker satisfaction rate were increased. The enterprise has yet to start applying technologies to improve more indicators and create sustainable production development.
The implemented solution has brought the following improvements for the enterprise:
  • The basis for sustainable production development and deployment of Industry 4.0 technologies;
  • Shortening of the production time of the order by almost 50%;
  • Automation of the blast cleaning operation and increased speed of the processing of demands by this operation;
  • Shortening the handling movement trajectory during production;
  • Removing obsolete technology and thus reducing adverse impacts on the environment;
  • New possibilities for pre-production and transfer of production capacities to other orders in case of some production operations.
Simulation as a statistical tool is the right choice in a thorough analysis of the production process when it is possible to know all the elements of the process and the relationships between them so they can be sufficiently understood. In the case of innovation, simulation is an invaluable way to verify the suggested solution while not wasting financial and material resources. Simulation verification also offers, in addition to monitored outputs, outputs from each production process operation. This way, the enterprise can analyze statistics in advance and identify new problems that will show up when the original problem is resolved.
Author Contributions

Each author (M.O., A.R., M.S., J.F., J.C. and E.F.S.) has equally contributed to this publication. Conceptualization, M.O., A.R. and M.S.; methodology, A.R. and M.O.; validation, M.O., A.R. and M.S.; formal analysis, M.O., J.F. and J.C.; resources, M.O., J.F. and E.F.S.; data curation, M.O., J.C. and E.F.S.; writing—original draft preparation, M.O. and A.R.; writing—review and editing, M.O. and A.R.; visualization, M.O., J.F. and J.C; supervision, M.O. and M.S.; project administration, A.R. and M.S.; funding acquisition, A.R. and M.S. All authors have read and agreed to the published version of the manuscript.

Funding

This work is supported by the Scientific Grant Agency of the Ministry of Education, Science, Research, and Sport of the Slovak Republic and the Slovak Academy Sciences as part of the research project VEGA 1/0588/21 and as part of the research project VEGA 1/0430/22.

Institutional Review Board Statement

Not applicable.

Informed Consent Statement

Not applicable.

Data Availability Statement

The data presented in this article are available on request from the corresponding author.

Acknowledgments

The authors would like to thank the anonymous referees for their valuable comments that improved the quality of the manuscript.

Conflicts of Interest

The authors declare no conflict of interest.

References

  1. Labuschagne, C.; Brent, A.; van Erck, R.P. Assessing the sustainability performances of industries. J. Clean. Prod. 2005, 13, 373–385. [Google Scholar] [CrossRef] [Green Version]
  2. Patalas-Maliszewska, J.; Łosyk, H. An Approach to Assessing Sustainability in the Development of a Manufacturing Company. Sustainability 2020, 12, 8787. [Google Scholar] [CrossRef]
  3. Dou, Z.; Wu, B.; Sun, Y.; Wang, T. The Competitiveness of Manufacturing and Its Driving Factors: A Case Study of G20 Participating Countries. Sustainability 2021, 13, 1143. [Google Scholar] [CrossRef]
  4. Yacob, P.; Wong, L.S.; Khor, S.C. An empirical investigation of green initiatives and environmental sustainability for manufacturing SMEs. J. Manuf. Technol. Manag. 2019, 30, 2–25. [Google Scholar] [CrossRef]
  5. Pfeifer, M.R. Development of a Smart Manufacturing Execution System Architecture for SMEs: A Czech Case Study. Sustainability 2021, 13, 10181. [Google Scholar] [CrossRef]
  6. Brozzi, R.; Forti, D.; Rauch, E.; Matt, D.T. The Advantages of Industry 4.0 Applications for Sustainability: Results from a Sample of Manufacturing Companies. Sustainability 2020, 12, 3647. [Google Scholar] [CrossRef]
  7. Wysocki, J. Innovative Green Initiatives in the Manufacturing SME Sector in Poland. Sustainability 2021, 13, 2386. [Google Scholar] [CrossRef]
  8. Simboli, A.; Raggi, A.; Rosica, P. Life Cycle Assessment of Process Eco-Innovations in an SME Automotive Supply Network. Sustainability 2015, 7, 13761–13776. [Google Scholar] [CrossRef] [Green Version]
  9. Doloreux, D.; Kraft, L. A Taxonomy of Eco-Innovation Types in SMEs: Exploring Different Firm Profiles in the Canadian Wine Industry. Sustainability 2019, 11, 5776. [Google Scholar] [CrossRef] [Green Version]
  10. Sabando-Vera, D.; Yonfa-Medranda, M.; Montalván-Burbano, N.; Albors-Garrigos, J.; Parrales-Guerrero, K. Worldwide Research on Open Innovation in SMEs. J. Open Innov. Technol. Mark. Complex. 2022, 8, 20. [Google Scholar] [CrossRef]
  11. Andalib, T.W.; Halim, H.A. Convergence of Conceptual Innovation Model to Reduce Challenges Faced by the Small and Medium Sized Enterprises’ (SMEs) in Bangladesh. J. Open Innov. Technol. Mark. Complex. 2019, 5, 63. [Google Scholar] [CrossRef] [Green Version]
  12. Jamai, K.; Abidar, A.; De Steur, H.; Gellynck, X. Assessing Firm Readiness to Adopt Cluster-Based Innovative Projects: A Segmentation Analysis. Sustainability 2022, 14, 947. [Google Scholar] [CrossRef]
  13. Masocha, R. Does Environmental Sustainability Impact Innovation, Ecological and Social Measures of Firm Performance of SMEs? Evidence from South Africa. Sustainability 2018, 10, 3855. [Google Scholar] [CrossRef] [Green Version]
  14. Epping, K.; Zhang, H. A Sustainable Decision-Making Framework for Transitioning to Robotic Welding for Small and Medium Manufacturers. Sustainability 2018, 10, 3651. [Google Scholar] [CrossRef] [Green Version]
  15. Gualtieri, L.; Palomba, I.; Merati, F.A.; Rauch, E.; Vidoni, R. Design of Human-Centered Collaborative Assembly Workstations for the Improvement of Operators’ Physical Ergonomics and Production Efficiency: A Case Study. Sustainability 2020, 12, 3606. [Google Scholar] [CrossRef]
  16. European Commission. Eco-Innovation in Slovakia. EIO Country Profile 2018. Available online: https://www.researchgate.net/publication/345326091_Eco-innovation_in_Slovakia_EIO_Country_Profile_2018-2019 (accessed on 19 January 2022).
  17. Lesáková, Ľ.; Gundová, P.; Kráľ, P.; Ondrušová, A. Innovation Leaders, Modest Innovators and Non-innovative SMEs in Slovakia: Key Factors and Barriers of Innovation Activity. Organizacija 2017, 50, 325–338. [Google Scholar] [CrossRef] [Green Version]
  18. Gracanin, D.; Lalic, B.; Beker, I.; Lalic, D.; Buchmeister, B. Cost-Time Profile Simulation for Job Shop Scheduling Decisions. Int. J. Simul. Model. 2013, 12, 213–224. [Google Scholar] [CrossRef]
  19. Marodin, G.A.; Saurin, T. Implementing lean production systems: Research areas and opportunities for future studies. Int. J. Prod. Res. 2013, 51, 6663–6680. [Google Scholar] [CrossRef]
  20. Terkaj, W.; Tolio, T.; Valente, A. Focused Flexibility in Production Systems. In Changeable and Reconfigurable Manufacturing Systems; Springer: London, UK, 2009; pp. 47–66. [Google Scholar] [CrossRef]
  21. Grznár, P.; Gregor, M.; Krajčovič, M.; Mozol, Š.; Schickerle, M.; Vavrík, V.; Ďurica, L.; Marschall, M.; Bielik, T. Modeling and Simulation of Processes in a Factory of the Future. Appl. Sci. 2020, 10, 4503. [Google Scholar] [CrossRef]
  22. Tvrdon, L.; Fedorko, G. Usage of Dynamic Simulation in Pressing Shop Production System Design. Int. J. Simul. Model. 2020, 19, 185–196. [Google Scholar] [CrossRef]
  23. Fusko, M.; Bučková, M.; Gašo, M.; Krajčovič, M.; Dulina, Ľ.; Skokan, R. Concept of Long-Term Sustainable Intralogistics in Plastic Recycling Factory. Sustainability 2019, 11, 6750. [Google Scholar] [CrossRef] [Green Version]
  24. Kliment, M.; Trebuna, P.; Pekarcikova, M.; Straka, M.; Trojan, J.; Duda, R. Production Efficiency Evaluation and Products’ Quality Improvement Using Simulation. Int. J. Simul. Model. 2020, 19, 470–481. [Google Scholar] [CrossRef]
  25. Ngo, L.; O’Cass, A. Innovation and business success: The mediating role of customer participation. J. Bus. Res. 2013, 66, 1134–1142. [Google Scholar] [CrossRef]
  26. Roper, S.; Du, J.; Love, J.H. Modelling the innovation value chain. Res. Policy 2008, 37, 961–977. [Google Scholar] [CrossRef] [Green Version]
  27. Wojtaszek, H.; Miciuła, I. Analysis of Factors Giving the Opportunity for Implementation of Innovations on the Example of Manufacturing Enterprises in the Silesian Province. Sustainability 2019, 11, 5850. [Google Scholar] [CrossRef] [Green Version]
  28. Cerezo-Narváez, A.; García-Jurado, D.; González-Cruz, M.C.; Pastor-Fernández, A.; Otero-Mateo, M.; Ballesteros-Pérez, P. Standardizing Innovation Management: An Opportunity for SMEs in the Aerospace Industry. Processes 2019, 7, 282. [Google Scholar] [CrossRef] [Green Version]
  29. Calderón-Andrade, R.; Hernández-Gress, E.S.; Benítez, M.A.M. Productivity Improvement through Reengineering and Simulation: A Case Study in a Footwear-Industry. Appl. Sci. 2020, 10, 5590. [Google Scholar] [CrossRef]
  30. Bottani, E. Reengineering, Simulation and Data Analysis of an RFID System. J. Theor. Appl. Electron. Commer. Res. 2008, 3, 13–29. [Google Scholar] [CrossRef]
  31. Khan, A.; Butt, J.; Mebrahtu, H.; Shirvani, H. Analyzing the Effects of Tactical Dependence for Business Process Reengineering and Optimization. Designs 2020, 4, 23. [Google Scholar] [CrossRef]
  32. Marcos, M.; Pitarch, J.; de Prada, C. Integrated Process Re-Design with Operation in the Digital Era: Illustration through an Industrial Case Study. Processes 2021, 9, 1203. [Google Scholar] [CrossRef]
  33. Straka, M. Teoretické Východiská Simulácie—Simulačný Systém EXTENDSIM 9.x, The Theoretical Basis of Simulation—Simulation System EXTENDSIM 9.x, 1st ed.; Edičné stredisko/AMS: Košice, Slovak, 2017. [Google Scholar]
  34. Saderova, J.; Rosova, A.; Behunova, A.; Behun, M.; Sofranko, M.; Khouri, S. Case study: The simulation modelling of selected activity in a warehouse operation. Wirel. Netw. 2021, 28, 431–440. [Google Scholar] [CrossRef]
  35. Bindzar, P.; Saderova, J.; Sofranko, M.; Kacmary, P.; Brodny, J.; Tutak, M. A Case Study: Simulation Traffic Model as a Tool to Assess One-Way vs. Two-Way Traffic on Urban Roads around the City Center. Appl. Sci. 2021, 11, 5018. [Google Scholar] [CrossRef]
  36. Straka, M.; Lenort, R.; Khouri, S.; Feliks, J. Design of Large-Scale Logistics Systems Using Computer Simulation Hierarchic Structure. Int. J. Simul. Model. 2018, 17, 105–118. [Google Scholar] [CrossRef]
  37. Siderska, J. Application of Tecnomatix Plant Simulation for Modeling Production and Logistics Processes. Bus. Manag. Educ. 2016, 14, 64–73. [Google Scholar] [CrossRef]
  38. Pekarčíková, M.; Trebuňa, P.; Markovič, J. Simulation as Part of Industrial Practice. Acta Logist. 2015, 2, 5–8. [Google Scholar] [CrossRef]
  39. Saderova, J.; Rosova, A.; Kacmary, P.; Sofranko, M.; Bindzar, P.; Malkus, T. Modelling as a Tool for the Planning of the Transport System Performance in the Conditions of a Raw Material Mining. Sustainability 2020, 12, 8051. [Google Scholar] [CrossRef]
  40. Istokovic, D.; Perinić, M.; Dobovicek, S.; Bazina, T. Simulation framework for determining the order and size of the product batches in the flow shop: A case study. Adv. Prod. Eng. Manag. 2019, 14, 166–176. [Google Scholar] [CrossRef] [Green Version]
  41. Marasova, D.; Saderova, J.; Ambrisko, L. Simulation of the Use of the Material Handling Equipment in the Operation Process. Open Eng. 2020, 10, 216–223. [Google Scholar] [CrossRef]
  42. Kaźmierczak, M.; Sawicka, H. Redesign of warehousing process with an application of object-oriented simulation method. Res. Logist. Prod. 2017, 7, 351–366. [Google Scholar] [CrossRef] [Green Version]
  43. Šaderová, J.; Marasova, D.; Galliková, J. Simulation as Logistic Support to Handling in the Warehouse: Case Study. TEM J. 2018, 7, 112–117. [Google Scholar]
  44. Pekarcikova, M.; Trebuna, P.; Kliment, M.; Dic, M. Solution of Bottlenecks in the Logistics Flow by Applying the Kanban Module in the Tecnomatix Plant Simulation Software. Sustainability 2021, 13, 7989. [Google Scholar] [CrossRef]
  45. Pekarcikova, M.; Trebuna, P.; Kliment, M.; Rosocha, L. Material Flow Optimization through E-Kanban System Simulation. Int. J. Simul. Model. 2020, 19, 243–254. [Google Scholar] [CrossRef]
  46. Kaban, A.K.; Othman, Z.; Rohmah, D.S. Comparison of dispatching rules in job-shop scheduling problem using simulation: A case study. Int. J. Simul. Model. 2012, 11, 129–140. [Google Scholar] [CrossRef]
  47. Seebacher, G.; Winkler, H.; Oberegger, B. In-Plant Logistics Efficiency Valuation Using Discrete Event Simulation. Int. J. Simul. Model. 2015, 60–70. [Google Scholar] [CrossRef]
  48. Mihails, S.; Medvedev, A.; Sincova, E. Lomonosov Street. “RIGA AIRPORT BAGGAGE HANDLING SYSTEM SIMULATION”. Available online: https://www.scs-europe.net/dlib/2009/2009-0384.htm (accessed on 20 November 2021).
  49. Rosova, A.; Behun, M.; Khouri, S.; Cehlar, M.; Ferencz, V.; Sofranko, M. Case study: The simulation modeling to improve the efficiency and performance of production process. Wirel. Netw. 2020, 1–10. [Google Scholar] [CrossRef]
  50. Diamond, P.; Sackett, C.; Hansen, K. ExtendSim9 User Guide; Imagine That Inc.: San Jose, CA, USA, 2013; ISBN 978-0-9825040-4-8. [Google Scholar]
  51. Kura, B.; Kambham, K.; Sangameswaran, S.; Potana, S. Atmospheric Particulate Emissions from Dry Abrasive Blasting Using Coal Slag. J. Air Waste Manag. Assoc. 2006, 56, 1205–1215. [Google Scholar] [CrossRef] [Green Version]
  52. Lucas, E.; Boudreau, G.; Coletta, R. Industrial Health and Safety Criteria for Abrasive Blast Cleaning Operations; National Institute for Occupational Safety and Health: Cincinnati, OH, USA, 1974. [Google Scholar]
Figure 1. Simulation model of production of one vibrating screen in the ExtendSim software (source: elaborated by authors).
Sustainability 14 01514 g001
Figure 2. Wheel blast machine LAUCO 200 NS (source: elaborated by authors).
Sustainability 14 01514 g002
Figure 3. Presentation of the main impact of process redesign of the simulation model (source: elaborated by authors).
Sustainability 14 01514 g003
Figure 4. The enterprise’s original layout and the material’s trajectory during production (source: elaborated by authors).
Sustainability 14 01514 g004
Figure 5. Layout with efficient placement of wheel blast machine and new material trajectory during production (source: elaborated by authors).
Sustainability 14 01514 g005
Figure 6. Simulation model after redesigning the production process (source: elaborated by authors).
Sustainability 14 01514 g006
Figure 7. Blocks located in a hierarchical block sequence counting (source: elaborated by authors).
Sustainability 14 01514 g007
Figure 8. Utilization of the machine blast cleaning (source: elaborated by authors).
Sustainability 14 01514 g008
Figure 9. Utilization of the handgun blast cleaning (source: elaborated by authors).
Sustainability 14 01514 g009
Figure 10. Development of the queue length of the bending operation depending on the time (source: elaborated by authors).
Sustainability 14 01514 g010
Figure 11. Utilization of the bending operation during the order production (source: elaborated by authors).
Sustainability 14 01514 g011
Table 1. Blocks of the ExtendSim software (source: elaborated by authors based on [50]).
BlockNameFunction
Sustainability 14 01514 i001CreateThe main purpose is to create demands or values randomly, by schedule or infinitely. This block can also add properties and priority to the created demands.
Sustainability 14 01514 i002ExitExit takes away a simulation demand and calculates the total number of leaves.
Sustainability 14 01514 i003SetAdds properties or priority to requirements that pass through it.
Sustainability 14 01514 i004Equation (I)Block can set up, modify, or check the properties of passing demands. Recalculates the equation each time the demand enters the block.
Sustainability 14 01514 i005ExecutiveThe executive block is necessary for the simulation to run. It is used to manage the properties in the simulation.
Sustainability 14 01514 i006QueueMaintains demands until the next position in the simulation is free. It can be organized as FIFO, LIFO, by priority or properties. The block can be set up as a resource pool queue.
Sustainability 14 01514 i007Select item inCombines different demand flows into one flow.
Sustainability 14 01514 i008Select item outThe block divides the flow of demands into more, according to their properties or priorities, randomly or sequentially.
Sustainability 14 01514 i009GateLimits the flow of demands in the model behind the block. It supports a setting where only a certain number of demands can be located behind the block. The second setting is based on conditions brought to the block connector. Demand will pass through only if the condition is met.
Sustainability 14 01514 i010ActivityRepresents the operation on a demand with a time delay. Time delay can be constant, specified by distribution, taken from connector or table. The block can have different capacities.
Sustainability 14 01514 i011WorkstationIt simulates an operation on demands as an activity block but automatically has a FIFO organization queue attached to it.
Sustainability 14 01514 i012BatchCombines multiple demands in the model into one demand for further use. The demands required to create an output demand are destroyed in the block, and only a new one comes out.
Sustainability 14 01514 i013UnbatchDivides the demand that enters the block. It can be divided into parts previously combined in another block or duplicate the demand as many times as needed.
Sustainability 14 01514 i014Resource poolStores a certain number of resources needed for simulation. Resources from this block are taken by a queue set up as the resource pool queue.
Sustainability 14 01514 i015Resource pool releaseReleases a specified number of resources to a given resource pool. Allows them to be reused. This block can increase resources in the resource pool during simulation.
Sustainability 14 01514 i016Resource itemStores demands for later use in the model. Unlike a resource pool, a block batch is required to connect them to the simulation.
Table 2. Statistical values of blast cleaning resulting from the simulation producing one vibrating screen (source: elaborated by authors).
Blast Cleaning
Maximum queue length of unprocessed demands46 pcs
Total processed demands226 pcs
Start time of processing4th min
End time of processing2825th min
Duration of blast cleaning47 h and 1 min
Duration of the whole production65 h and 50 min
Table 3. Explanation of abbreviations used in the simulation model (source: elaborated by authors).
Metal Sheets (P)Solid Metals (H)Components for Assemblage (D)
PHThick sheetHPLFlat segment materialDPLFlat segments
PTThin sheetHPMStructural materialDRMConsistent components
DZLComplex components
DTBeam
Table 4. Quantity of material in the simulation model per order (source: elaborated by authors).
MaterialTypePcs from StoragePcs after Splitting
Metal sheetThick3189
Thin9567
Solid metalStructural material4108
Flat segment material18126
Table 5. Duration of processing demands by individual production operations (source: elaborated by authors).
Production OperationDuration [min]
Slicing7 ± 2
Oxy-cutting9 ± 5
Blast cleaning8 ± 2/2 ± 1/4 ± 1/5 ± 1
Bending15,60,30
Middle machine shop15,90,50
Tacking45 ± 15/120
Welding40 ± 10/500
Weld treatment-/150
Components painting8,15,10
Assemblage720
Testing120
Machine painting210
Preparing for expedition23 ± 5
Table 6. Order production durations resulting from simulations (source: elaborated by authors).
Production times of simulations [min]12,20312,24312,39812,36312,388
12,53712,42112,34612,31512,260
12,17412,59412,17112,09612,194
12,34512,27212,17212,28812,473
12,23012,45112,25612,40012,208
12,37712,34712,33712,25612,334
12,36212,21112,30012,34612,401
12,26512,57912,17112,35712,171
12,11512,37912,54412,30412,213
12,44812,28712,41312,51412,279
Complete order production interval [min]12,096–12,594
Average production time of the complete order [min]12,322
Average production time of one vibrating screen [min]2054
Table 7. Simulation results for the other production operations (source: elaborated by authors).
Production OperationMaximum Queue Length [pcs]Number of Processed DemandsUtilization
Middle machine shop14423424%
Bending63263687%
Tacking01086%
Welding01085%
Components painting11145%
Assemblage1634%
Testing066%
Machine painting0610%
Preparing for expedition062%
Publisher’s Note: MDPI stays neutral with regard to jurisdictional claims in published maps and institutional affiliations.