Abstract
The temperature difference in the weld area during the process of welding, cooling the welded product, and post-welding affect the formation of distortion. Therefore, this study aims to evaluate the distortion formed and hardness behavior on the ASTM A36 (EN S275) steel plate while welding using different cooling media including air, water, and ice. This involved using the MAG (Metal Active Gas) method, which used the AWS A5.18 ER70S-6 electrode with a 1 mm diameter and an 8 mm plate thickness. The value of distortion on the MAG-welded steel plate was measured using a digital dial indicator and evenly distributed by first making a grid. Moreover, the measuring points from the transverse and longitudinal directions were placed at 20 and 8 rows with a distance of 10 mm between points for each variation of the cooling media, such that 10 mm each was allowed left-right and top-down. The results showed that the highest distortion value of 3.13 was formed on the second row of the air cooling media, and this media was also used to determine the contours and distortion profiles.
1. Introduction
The development of technology in the advanced construction sector is significantly related to welding, which plays an important role in metal engineering and repair. Its application is observed in several fields such as shipping, bridges, steel frames, compression steel, transportation facilities, rails, pipelines, and several others. The factors associated with welding production include the manufacturing schedule, preparation process, seam type, machine and electrode selection, welder, tools, and the materials needed. However, certain problems are associated with this mechanical device, for example, distortion. which normally leads to bending of the welded rod or plate, which is usually caused by the influence of temperature during the welding process of the joint, and other factors capable of affecting the product design and specifications.
Several studies have been conducted recently to investigate welding distortion. For example, the mitigation of out-of-plane welding distortion was predicted by applying finite element analysis on the structure of a carrier through thermal elastic bands. Studies by [1,2] also showed that welding distortions such as buckling and bending were formed through the combination of stress and strain. Moreover, others focused on mitigating the distortion through a heat sinking method, which involved dissipating the heat by circulating water from a conduit placed under the welded plate. The investigation was conducted through the concept of pseudo linear equivalent stiffness, which is normally used to simultaneously analyze the thermo-mechanical object welded with heat sinking. This means it is possible to overcome the welding distortion by modeling the nonlinear thermo-elastic-plastic using the finite element method [3]. Furthermore, low-carbon steel butt-welded joints were also investigated using the thermo-elastic-plastic FEM method, and its ability to predict weld distortion was confirmed by experimental results [4]. Other studies also focused on the prediction of distortion and residual stresses through 3-dimensional FEM with thermo-metallurgical mechanics in autogenous, hybrid, submerged, and cold wire-assisted laser welding, and the result showed that lower heat input to the welded structure causes distortion as indicated by the analysis conducted using an unlimited scalar input variable [5]. This method has been successfully verified in several case studies of the welding process [6]. Another study also evaluated the distortion due to the influence of eight welding sequences in ship deck structures [7], and the damped arc welding process was observed to have caused residual stress and distortion. Therefore, an optimization process was conducted through single and multi-objective genetic algorithms as well as the Harmony search method [8]. The dynamically controlled, low-voltage, distortion-free welding process, or DCLSND, was used to reduce distortion and improve fatigue crack performance associated with the residual stresses [9]. The welding parameters on steel pipes with a high-frequency inductive process were also optimized using the Nakaoka coefficient value with the calculated procedure to shorten the thermal regime [10]. The distortion and residual stresses in thin-plate butt joints in Metal Inert Gas (MIG) welding were also investigated, and the results showed the significant contribution of the plate speed and thickness to welding distortion and residual stress [11]. Furthermore, the microstructure and hardness due to thermal cycling in the Heat-Affected Zone (HAZ) were analyzed by applying the Rosenthal equation to welding thick and thin plates [12], while the stress on the steel bridge frame (ferromagnetic steel) was evaluated using the undamaged eddy current method [13]. An analysis was also conducted on the welding hot-dip galvanized steel with the resistance welding process using component variations during tensile-shear strength and ultimate strain tests [14]. Another study also used the MAG (Metal Active Gas) method to analyze the elemental regeneration on C45 steel [15] while others focused on the characterization of the laser-welded joint specifically for laser power, welding speed, angle of incidence, tensile strength, and microhardness [16]. An investigation has also been previously conducted on the distortion behavior along the welding path of the A36 multi-pass butt-welded steel plate with the GMAW V-groove process while several analytical models were applied in another study to predict welding distortion using heat input interval parameters as well as the number of paths capable of affecting the amount of distortion [17]. Moreover, welding distortion on A36 steel with the T-joint connection type was also evaluated using the welding current and speed from the Taguchi method as the input parameters, and the highest longitudinal and angular bending distortions were found to be 64% and 53%, respectively [18].
Welding distortion is categorized into angular change, rotational, longitudinal bending, transverse and longitudinal shrinkage, as well as buckling distortions [19,20]. Moreover, the welding distortion and residual stress in the arc are usually simulated by considering the material and geometric nonlinearities in thin-plate joints while the heat input was observed to have been analyzed numerically [21]. The effect of transient thermal stress during welding on the formation of buckling distortion due to residual stress induction has also been examined [22]. It was also discovered that the effect of solid-state phase transformation in low–medium-carbon steels has been evaluated while the martensite fraction in the fusion zone and HAZ was predicted through the application of FEM. It was discovered that solid-state phase transformation has the ability to affect the distortion and residual welding stress on carbon steel [23]. Another study stimulated the residual stresses and welding distortion through a 3-dimensional nonlinear finite element. An analysis conducted on the axial compression condition of hull girder strength for welded rigid plates using Smith’s method showed that the ultimate tensile strength is higher while the load-shortening curve fits perfectly between the simulation and the experiment [24]. Furthermore, several studies on the application of finite element analysis of thin butt-welded plates to determine the maximum welding distortion amplitude under typical shipbuilding welding conditions found that the accuracy of the new regression equation was validated between the simulation and experiment [25]. The angle distortion behavior and stress modeling during gas metal arc welding (GMAW) were also observed for strain relaxation in another study through the removal of weld deposits [26]. There has also been the application of 2D–3D modeling processes on bending distortion due to the longitudinal residual stress in thin cross-sectional structures, while the efficiency and limitations of buckling distortion modeling guidelines were also analyzed [27].
The measurement of the residual stress on welded ASTM A36 steel plates through the MAG method has been examined using non-destructive techniques such as Magnetic Barkhausen Noise and X-ray Diffraction [28,29]. Moreover, process parameters such as the welding current and speed, arc voltage and distance, the laser-to-arc distance at the penetration depth, bead shape, arc stability, spark, and plasma formation have also been investigated in carbon steel [30]. Another study also compared the MAG process with MIG and TIG welding by focusing on the porosity formed by carbon steel welds based on the consideration of current, speed, and heat input during the welding process. The results showed an increase in the heat input affected the distribution and size of the porosity, thereby having further effects on the weld bead depth [31,32]. Meanwhile, other studies focused on the MAG welding process on a thin steel plate or low-carbon steel through cold metal transfer (CMT) [33]. This present study aims to evaluate the effect of cooling media on the distortion of two parts of the A36 steel plate due to MAG welding. The distortion contours formed were mapped sequentially at a distance of 10 mm, with each being evaluated using the results obtained from the dial indicator measurements. The experiment was also used to determine the effect of air, water, and ice cooling media on the hardness of ASTM A36 steel due to MAG welding.
2. Materials and Methods
The material used in this experiment was ASTM A36 (EN S275) low-carbon steel (mild steel) with the chemical composition presented in Table 1.

Table 1.
Chemical composition and mechanical properties of A36 steel in wt. %.
The A36 steel plate was cut in dimensions of 100 mm width, 200 mm length, and 8 mm thickness using a single V seam type at a slope angle of 70°. The dimensions of the weld sample and the preparation of the plate cut are shown in Figure 1.
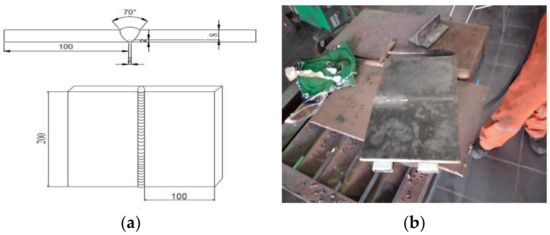
Figure 1.
(a) Dimensions of welding samples; (b) preparation of A36 steel plates.
MAG and MIG are arc welding processes with additional material fed by a coil of electrode wire and melted by the Joule effect and an electric arc. The inert and active gases generally used include argon based for MIG welding and CO2 based for MAG welding. These two gases were used as plasmas for arcing and shielding metals at high temperatures to avoid oxygen and nitrogen contamination.
The electrode used as a filler metal was AWS A5.18 ER70S-6, and its chemical composition is presented in Table 2 while the welding parameters used are indicated in Table 3. Each welding sample was cooled with air, water, and ice cooling media during the experiment to observe the amount of distortion formed in the weld sample. Figure 2 shows the process of welding a steel plate sample, its immersion in the cooling medium, and its status at room temperature.

Table 2.
Chemical composition and mechanical properties of AWS A5.18 ER70S-6 filler in wt.%.

Table 3.
Welding parameters used to evaluate welded products at different cooling media.
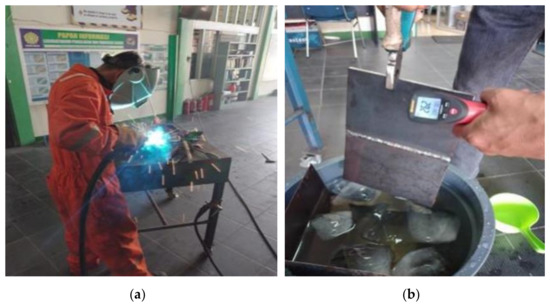
Figure 2.
(a) The welding process of the steel plate sample, (b) the sample is immersed in the cooling media.
The cooling media used include air, water, and ice as shown in Figure 3, and they were all used due to the difference in the ability of each type to cool the weld sample. This media determines the cooling speed of the materials that received heat during the welding process. The experiment conducted, therefore, focused on analyzing the response of the material’s properties, such as the hardness, to the temperature difference of the cooling media. Meanwhile, the temperature of the cooling media was measured through a K-type thermocouple and found to be 30, 26, and 3 °C for air, water, and ice, respectively.
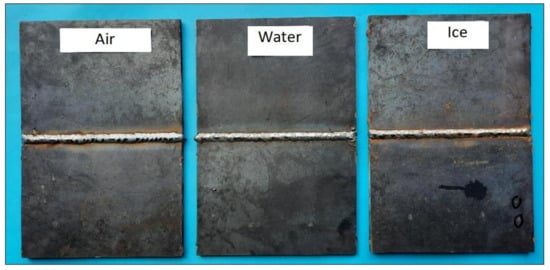
Figure 3.
Weld samples dipped with various cooling media.
A digital indicator with an accuracy level of 0.001 mm was used to measure the amount of distortion formed on the plate after treatment with 3 variations of the coolant. The distortion contour was mapped through the curve of the steel plate surface and evaluated in rows at a distance of 10 mm each in the transverse and longitudinal directions. The measurement direction is shown in Figure 4.
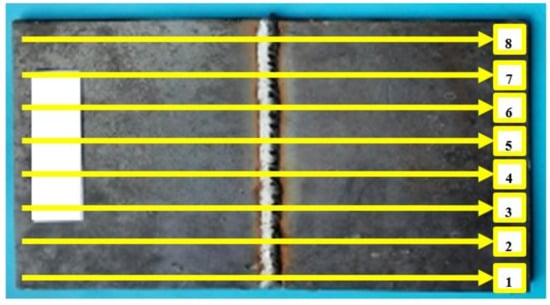
Figure 4.
Row-by-row distortion measurement direction for each cooling media variation.
The hardness of the welded samples was determined through the Rockwell B (HRB) test with a load of 100 Kgf placed at different distribution points and several zones including WM (weld metal), BM (base metal), and HAZ from both sides of the plate as indicated in Figure 5. Moreover, the hardness was evenly distributed at 30 points/hardness test position on the MAG-welded plate surface, and the distance between the points in the vertical and horizontal direction was 5 and 10 mm, respectively.
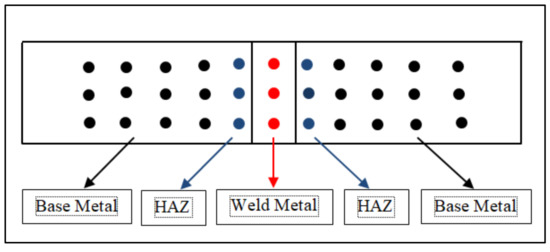
Figure 5.
Distribution points of the specimen hardness test (red dots is the weld area).
3. Results
3.1. Distortion
3.1.1. Steel Plate before Welding
Figure 6 shows the distortion contours of two parts of the A36 steel plate before welding with dimensions of 100 × 200 × 8 mm. It was discovered that the plate has insignificant distortion and tends to be flat as shown in Figure 7 and Table 4. The maximum value was 0.070 mm found in the eighth row and second column while the minimum value was 0.047 observed in some places. The distortion was discovered to have been formed during the metal cutting process.
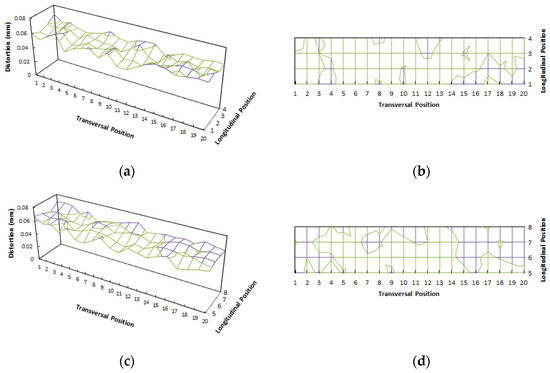
Figure 6.
Distortion contour of two parts of steel plate before welding: (a) isometric view of the first side, (b) top view of the first side, (c) isometric view of the second side, (d) top view of the second side.
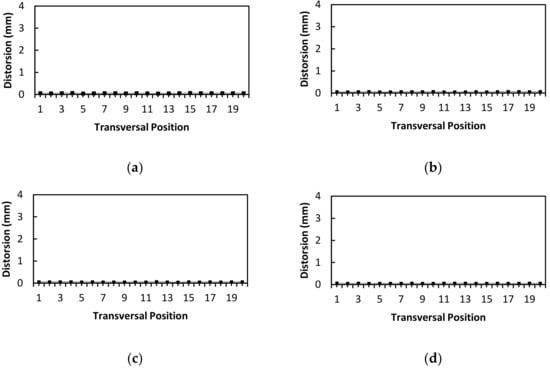
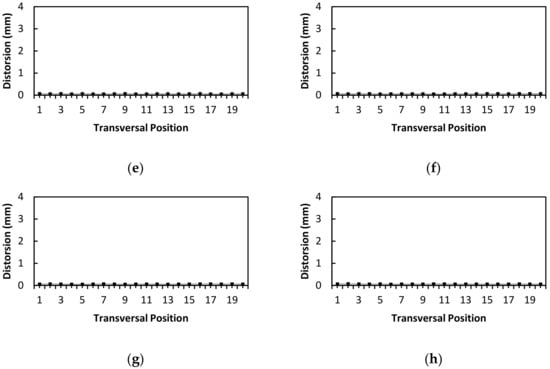
Figure 7.
Distortion profile on two parts of steel plate before welding (row by row): (a) Row 1, (b) row 2, (c) row 3, (d) row 4, (e) row 5, (f) row 6, (g) row 7, and (h) row 8.

Table 4.
Steel plate distortion value distribution on two plates before welding.
3.1.2. Cooling with Air Media
The data obtained by observing and measuring the torsion on the A36 steel plate using a dial indicator are presented in Figure 8 and Figure 9. Figure 8 illustrates the contours of the distortion distribution mapped on the surface of the plate due to air cooling, with the contour observed to be constructed from the values (in mm) of 20 columns and 8 rows in the transverse and longitudinal direction, respectively. The largest distortion was visualized at the end of the plate in columns 1 and 2 followed by 19 and 20 as indicated in Figure 8b. The maximum distortion was 3.131 mm in the first column of the second row while the distribution of the distortion value in 160 measurement points on the A35 steel plate due to the air cooling media is indicated in Table 5.
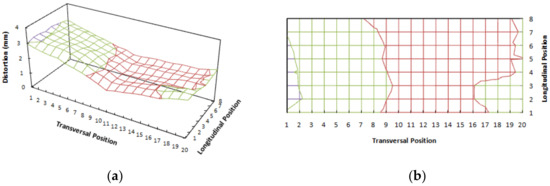
Figure 8.
Distortion distribution contour with air-cooling media: (a) isometric view, (b) top view.
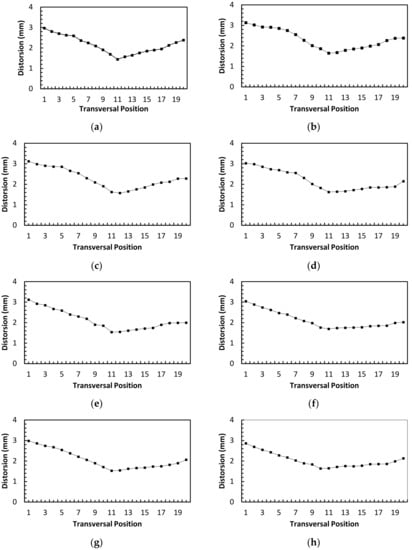
Figure 9.
Rated distortion profile on welded plate with row-by-row air-cooling media: (a) Row 1, (b) row 2, (c) row 3, (d) row 4, (e) row 5, (f) row 6, (g) row 7, and (h) row 8.

Table 5.
Steel plate distortion value distribution with air cooling media.
The profile of each row on the surface of the air-cooled welded plate is shown in Figure 9 with the distortion profile of the weld sample generally curved upwards to form a "V." This was due to the application of a single V-seam shape in this study, which led to the supply from above during the welding process. Moreover, the samples were divided into several areas including BM, HAZ, TMAZ (Thermomechanically Affected Zone), and weldment based on the identification from a microscope [34]. The weldment on the contour drawing and the distortion profile of the WM surface were observed in the area between columns 11 and 12 while the TMAZ was found between columns 9 and 10 in the steel plate distortion profile curve. Figure 9e shows that the torsion profile on the steel plate surface changes slightly with sloping values from 1901 mm in column 9 to 1855 mm in column 10. Moreover, the HAZ region was found by changing the distortion value from 2.551 mm in column 7 to 2015 mm in column 9 as indicated in Figure 9d. The BM was identified from the distortion curve profile starting from columns 1 to 7 as shown in Figure 9. It is necessary to observe the microstructure of steel metal alloys to determine other details.
3.1.3. Cooling with Water Media
The contour of the distortion formed while welding the A36 alloy steel plate cooled through the water media is presented in Figure 10 and mapped from the surface of the plate due to welding as shown in Figure 10b. The highest distortion, which formed an upward V-curve, was recorded in columns 19 and 20, and the two sides of the endplate were lifted due to the non-uniform heat on the plates. Moreover, the distribution values recorded from the measurement indicate that a water cooling media was used after welding as shown in Figure 11 and Table 6.
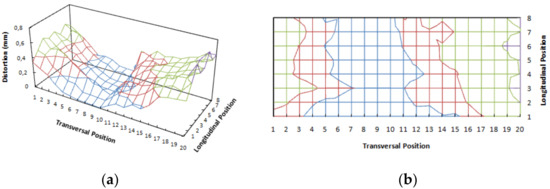
Figure 10.
The contour of distortion distribution on water-cooled slab: (a) isometric view, (b) top view.

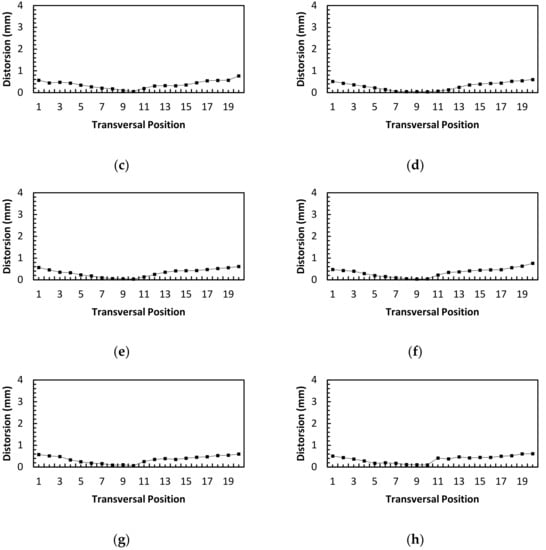
Figure 11.
Distortion profile measured on welded plate with row-by-row water cooling media: (a) Row 1, (b) row 2, (c) row 3, (d) row 4, (e) row 5, (f) row 6, (g) row 7, and (h) row 8.

Table 6.
Distribution of 160 points of steel plate distortion measurement with water cooling media.
Figure 11 shows the distortion profile formed on the surface of the A36 steel plate, and the values were observed to be spread over the plate surface and displayed in eight rows with the highest value of 0.768 mm obtained on the 20th column row 3. The weldment areas were generally identified in the column range of 9–10 for the overall distortion profile while TMAZ was observed in column ranges of 5 to 9 and 10 to 15. Meanwhile, the HAZ area was identified in column ranges of 3 to 5 and 14 to 15 and the remaining BM area was between columns 1 to 3 and 15 to 20.
3.1.4. Cooling with Ice Media
The distribution of the distortion contour on the welded A36 steel plate cooled with ice media is presented in Figure 12, and the highest distortion value was recorded in the range of columns 1–4 from one side of the welded plate. The shapes of the curve due to heat and distribution contours are shown in Figure 12a,b, while the distribution data of the welding distortion values of the plate cooled with ice media after welding are indicated in Figure 13 and Table 7.
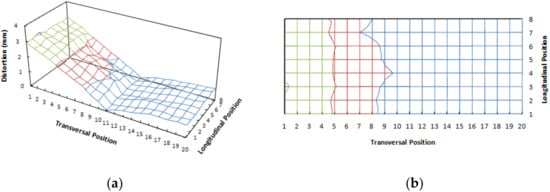
Figure 12.
The contour of distortion distribution on the plate with ice cooling media: (a) isometric view, (b) top view.

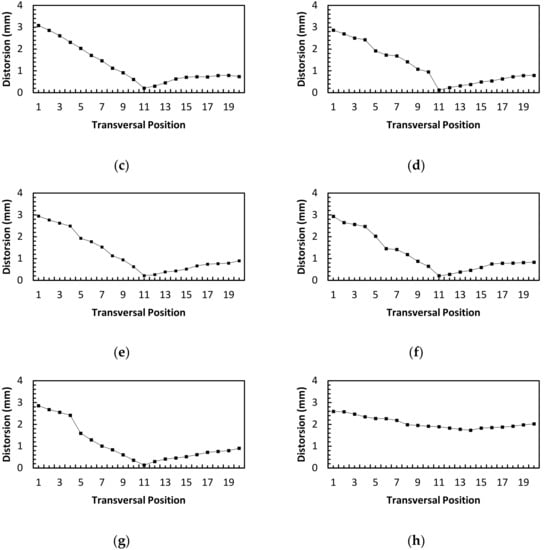
Figure 13.
Distortion profile measured on weld plate with row-by-row through ice media: (a) Row 1, (b) row 2, (c) row 3, (d) row 4, (e) row 5, (f) row 6, (g) row 7, and (h) row 8.

Table 7.
Distribution of distortion values of steel plates with ice cooling media (10 mm distance each).
The row-by-row distortion profile is presented in Figure 13 with the highest value, 2949 mm, recorded in column 1, row 8. The shape of the distortion profile resembled the letter V curved up on both sides and the weldment areas were found in the column ranging from 10 to 12. The profile was observed to be slightly sloppy when compared to water cooling media.
3.2. Hardness
The hardness was tested using the WM, BM, and HAZ areas of the weld samples cooled using air, water, and ice. The Rockwell hardness values distribution for the A36 steel plate cooled with air is presented in Figure 14 and the maximum value of 86.9 HRB was found in the WM while the minimum, 75.2 HRB, was in the HAZ. This means the highest hardness value for the air cooling media is in the WM followed by the BM while the lowest is in the HAZ. It is important to note that the heat generated in the weld area was cooled at room temperature, and this provides a long enough opportunity for the welded plate to release heat, thereby making the hardness values in the HAZ and BM the same. Meanwhile, the HAZ cooling in the MAG welding process was relatively short, from 800 to 500 °C [35] and this means the 1F and 2F welding processes were strongly influenced by the line energy formed, which serves as the common denominator in the process. It is possible to adjust the heat input control according to the welding geometry due to its direct relationship with the arc power and welding speed [36].
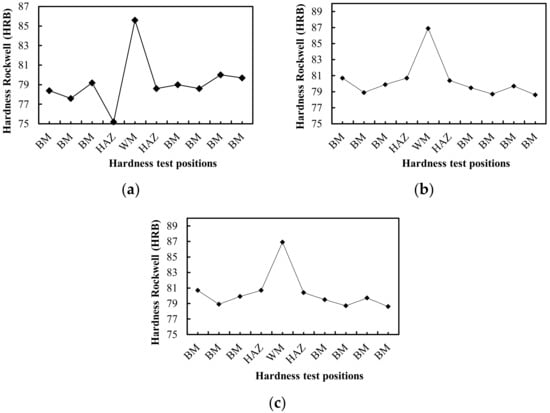
Figure 14.
Hardness distribution on the air cooling media for (a) line 1, (b) line 2, and (c) line 3.
The hardness distribution with water cooling media is presented in Figure 15 and the maximum value, 85.4 HRB, was also found in the WM followed by the BM with 75.5 HRB while the HAZ and the TMAZ generally had lower hardness values [34].
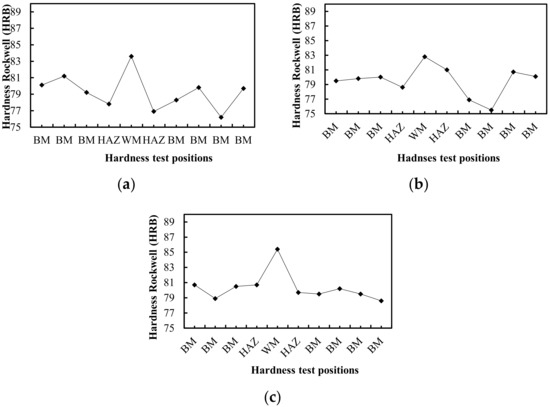
Figure 15.
Hardness distribution on water cooling media for (a) line 1, (b) line 2, and (c) line 3.
The hardness profile of the metal plate immersed in the ice cooling media is presented in Figure 16 and the highest value, 85.7 HRB, was recorded in the WM after which the value was reduced in the HAZ and increased again in the BM. This was associated with the rapid cooling process of the plate at 1400 °C after welding using 5–15 °C ice water [37].
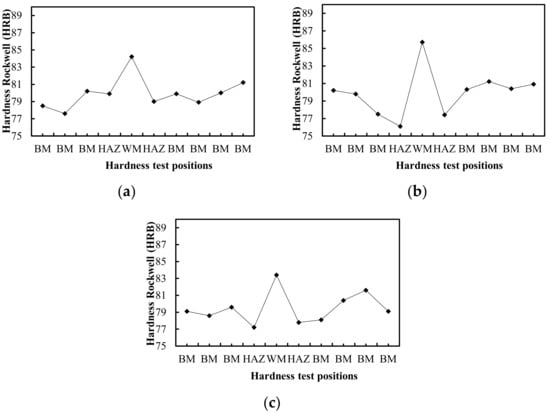
Figure 16.
Hardness distribution on ice cooling media for (a) line 1, (b) line 2, and (c) line3.
The hardness values of the welding steel plates cooled using water media presented in Figure 17 showed the highest, 83.9 HRB, which was recorded in the WM, while the HAZ had 79.0 HRB. It was also discovered that the WM also had the highest value of 84.4 HRB using ice cooling media while the HAZ had the lowest with 78.1 HRB.
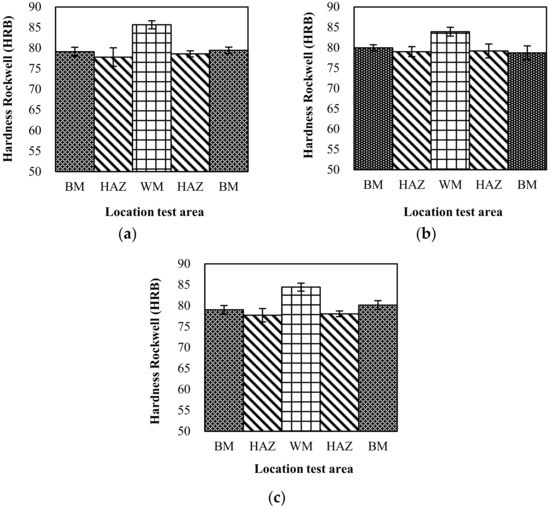
Figure 17.
Hardness value of A36 plate with different cooling media: (a) Air, (b) water, and (c) ice.
The hypotheses formulated were tested using one-way ANOVA after the homogeneity and normality tests showed the subjects used for the different cooling media are normally distributed and homogeneous as indicated in Table 8 [38].

Table 8.
Hardness experimental results.
Table 9 shows the results for the samples of each cooling media (Count.), the total Rockwell hardness value (Sum), the average Rockwell hardness value (Mean), the variance of the Rockwell hardness value (Variance), the sum of squares for the Rockwell hardness value (SS), the standard error of each cooling media (StdErr), as well as the lower and upper limits of each cooling media. Meanwhile, Table 10 was used to present the results of the one-way ANOVA including the Mean Square (MS) values recorded between groups, within groups, and the total, as well as their respective degrees of freedom (df).

Table 9.
Description hardness.

Table 10.
ANOVA hardness.
The criteria used to draw conclusions were based on the acceptance of H0 when F Sig. > 0.05, which indicates the cooling media did not have any significant effect on the Rockwell hardness value at the critical limit of
(>0.05) and was rejected when F Sig. < 0.05, which indicates a significant effect at the critical limit of (<0.05). The ANOVA results showed that the significance probability (Sig.) is 0.901 (>0.05) on the variation of the cooling media. This indicates the number of F Sig. was greater than 0.05 and this means the cooling media did not have a significant effect on the Rockwell hardness value in welding ASTM A36 steel.
4. Discussion
The distribution of contours and distortion profiles formed on the A36 steel surface due to welding were mapped against three cooling media while the torsion formed was also recorded. The distortion caused by air cooling was found to have higher values compared to water and ice cooling while the distortion profile of the water cooling was observed to be larger in the shape of the V curve followed by the ice media. This was caused by the thermal shock on both sides of the plate due to sudden cooling in these media. The contour distribution mapping and row-by-row profile further showed that air media is better due to the lack of thermal shock on both sides of the welded plate. This is important because the heat generated during welding causes distortion, which is capable of affecting the quality of the welded product. For instance, a low current makes it difficult to ignite an electric arc while a significantly large current increases the heat input to the BM, thereby causing greater distortion due to arc voltage, current, welding speed, and electrical polarity. This is because a greater welding heat input on the BM usually leads to higher non-uniform thermal strain (swelling and shrinkage) in the weld joint and its surroundings. It is also important to note that the construction joints due to welding are left free to move while the remaining thermal strain after room temperature has been reached is known as distortion. In the transverse plane and longitudinal direction, welded joints tend to decrease towards the side where the heat source originates (angular distortion).
An electric arc caused by an electric discharge that passes through a gap in the circuit while the heat is generated ionizes the gas. Meanwhile, a welding arc is produced when the electrode touches the workpiece and the electrical energy from the arc generates heat at high temperatures that melt the electrode and BM. Meanwhile, the large temperature difference in the weld arc area and the BM causes a non-uniform temperature distribution, melting, freezing, expansion, and thermal shrinkage in the joint and surrounding areas of the non-uniform weld construction. The heat input to the BM during welding causes distortion, which is the movement of the two parts of the joint due to thermal strain. The different types of distortions that can be formed in welded products include transverse and longitudinal shrinkage, weld line, changes in an angular shape, longitudinal, and wavy deformation. The distortion mapping conducted on the A36 steel plate showed the greatest formation on both sides of the transverse direction, and this is due to thermal strain and non-uniform heat distribution in the steel plate, which caused the shrinkage of the upper surface part of the plate. The distortion was followed by changes in the shape and size of the plate due to the jointing process by local heating (welding). This further leads to grain growth, stretching, and shrinkage of the metal, which occurred quickly and non-uniformly. It also allowed the surface of the plate to be curved or wavy, thereby leading to deviations from the planned dimensions, and this tends to complicate the subsequent processing because both sides of the plate are curved upwards. In addition to the heat, distortion is also influenced by the selection of the U- or V-shaped double seam, and this experiment was conducted using a single V joint at an inclination angle of 70°.
The cooling curve and rate of the material also affected its physical and mechanical properties such as the hardness value [39]. This was observed with the effect of the cooling rate on the microstructure evolution in the HAZ as indicated by the variation in the hardness values of the heat-affected area based on the grain size [40]. Moreover, the heat input also affected the cooling rate of the weld, thereby causing changes in the weld microstructure [41]. It is possible to classify the microstructure of A36 carbon steel welding results into four zones, which are the welding zone (WZ), the coarse-grain heat-affected zone (CG-HAZ), the fine-grain heat-affected zone (FG-HAZ), and the unaffected base metal (BM) [42].
5. Conclusions
This study evaluated the effect of three cooling media on the two-sided distortion of A36 steel plate due to MAG welding and also mapped the contours and distortion profiles of the columns and rows equipment. It was concluded that the air cooling media has the ability to reduce the distortion value within the range of 1584 mm while water and ice cooling media ranged between 0.572 mm and 2932 mm, respectively. Moreover, even though the lowest torque value was recorded in the water cooling media, the distortion profile formation was sloppier in the air cooling media with a wavy extreme temperature difference at a narrower V angle. This was caused by thermal shock on both sides of the plate where the high heat associated with the welding dropped suddenly when immersed in water and ice media.
The type of cooling media used in the MAG welding process was found to have influenced the welding joint strength in terms of the hardness of the material under load. This was observed with the highest hardness value in HAZ and WM recorded to be 79.6 HRB and 85.7 HRB, respectively, with the use of air cooling media, while the lowest was 79.0 HRB and 83.9 HRB in the water cooling media.
Author Contributions
Conceptualization, A. (Akhyar) and A.T.; methodology, A. (Akhyar), A. (Azwinur) and S. (Syukran); formal analysis, A. (Akhyar); investigation, A. (Akhyar); resources, A. (Azwinur) and S. (Syukran); data curation, A. (Akhyar) and T.A.F.; writing—original draft preparation, A. (Akhyar); writing—review and editing, A. (Akhyar), A.T., A.F., T.A.F., A. (Azwinur), S. (Syukran), T.A.F., T.F. and R.A.R.G.; project administration, Akhyar. All authors have read and agreed to the published version of the manuscript.
Funding
This research was funded by a grant from the Research Fund of the Ministry of Education, Culture, Research and Technology (Mendikbudristek), the Republic of Indonesia, and LPPM Universitas Syiah Kuala.
Institutional Review Board Statement
Not applicable.
Informed Consent Statement
Not applicable.
Data Availability Statement
Not applicable.
Conflicts of Interest
The authors declare no conflict of interest. All authors hereby declare there is no conflict of interest in this paper with respect to any personal circumstances or interest that may be perceived as inappropriately influencing the representation or interpretation of reported research results.
References
- Wang, J.; Rashed, S.; Murakawa, H.; Luo, Y. Numerical prediction and mitigation of out-of-plane welding distortion in ship panel structure by elastic FE analysis. Mar. Struct. 2013, 34, 135–155. [Google Scholar] [CrossRef]
- Denga, D.; Murakawa, H.; Liang, W. Prediction of welding distortion in a curved plate structure using elastic finite element method. J. Mater. Processing Technol. 2008, 203, 252–266. [Google Scholar] [CrossRef]
- Adak, M.; Mandal, N. Numerical and experimental study of mitigation of welding distortion. Appl. Math. Model. 2010, 34, 146–158. [Google Scholar] [CrossRef]
- Deng, D.; Murakawa, H. Prediction of welding distortion and residual stress in a thin plate butt-welded joint. Comput. Mater. Sci. 2008, 43, 353–365. [Google Scholar] [CrossRef]
- Derakhshan, E.D.; Yazdian, N.; Craft, B.; Smith, S.; Kovacevic, R. Numerical simulation and experimental validation of residual stress and welding distortion induced by laser-based welding processes of thin structural steel plates in butt joint configuration. Numerical simulation and experimental validation of residual stress and welding distortion induced by laser-based welding processes of thin structural steel plates in butt joint configuration. Opt. Laser Technol. 2018, 104, 170–182. [Google Scholar]
- Lee, J.M.; Seo, H.D. Chung, Efficient welding distortion analysis method for large welded structures. J. Mater. Processing Tech. 2018, 256, 36–50. [Google Scholar] [CrossRef]
- Azad, N.; Iranmanesh, M.; Darvazi, A.R. A study on the effect of welding sequence on welding distortion in ship deck structure. Ships Offshore Struct. 2019, 15(4), 355–367. [Google Scholar] [CrossRef]
- Ansaripour, N.; Heidari, A.; Eftekhari, S.A. Multi-objective optimization of residual stresses and distortion in submerged arc welding process using Genetic Algorithm and Harmony Search. Proc. Inst. Mech. Eng. Part C J. Mech. Eng. Sci. 2019, 234, 862–871. [Google Scholar] [CrossRef]
- Wibowo, H.; Ilman, M.N.; Iswanto, P.T.; Muslih, M.R. Reducing Distortion and Residual Stress Using Dynamically Controlled Low Stress No Distortion and Its Influence on Fatigue Crack Growth Properties of Steel Welded Joints. Trans. Indian Inst. Met. 2019, 72, 143–153. [Google Scholar] [CrossRef]
- Milićević, M.S. The Application of a New Formula of Nakaoka Coefficient in HF Inductive Welding. J. Mech. Eng. 2010, 56, 483–488. [Google Scholar]
- Long, H.; Gery, D.; Carlier, A.; Maropoulos, P.G. Prediction of welding distortion in butt joint of thin plates. Mater. Des. 2009, 30, 4126–4135. [Google Scholar] [CrossRef]
- López-Martínez, E.; Vergara-Hernández, H.J.; Serna, S.; Campillo, B. Artificial Neural Networks to Estimate the Thermal Properties of an Experimental Micro-Alloyed Steel and Their Application to the Welding Thermal Analysis. J. Mech. Eng. 2015, 61, 741–750. [Google Scholar] [CrossRef]
- Uchanin, V.; Minakov, S.; Nardoni, G.; Ostash, O.; Fomichov, S. Nondestructive Determination of Stresses in Steel Components by Eddy Current Method. J. Mech. Eng. 2018, 64, 690–697. [Google Scholar] [CrossRef]
- De Almeida, F.A.; Gomes, G.F.; Sabioni, R.C.; de Freitas Gomes, J.H.; de Paula, V.R.; de Paiva, A.P.; da Costa, S.C. A Gage Study Applied in Shear Test to Identify Variation Causes from a Resistance Spot Welding Measurement System. J. Mech. Eng. 2018, 64, 621–631. [Google Scholar]
- Kulawik, A.; Wróbel, J. Numerical Study of Stress Analysis for the Different Widths of Padding Welds. J. Mech. Eng. 2020, 66, 567–580. [Google Scholar] [CrossRef]
- Rahul, S.K.; Rao, T.V.; Harshad Natu, H.N.; Ishigaki, G.T.; Madhusudan, P. An Investigation on Laser Welding Parameters on the Strength of TRIP Steel. J. Mech. Eng. 2021, 67, 45–52. [Google Scholar] [CrossRef]
- Adamczuk, P.C.; Machado, I.G.; Esmerio Mazzaferro, J.A. Methodology for predicting the angular distortion in multi-pass butt-joint welding. J. Mater. Processing Technol. 2017, 240, 305–313. [Google Scholar] [CrossRef]
- Baskoro, A.S.; Hidayat, R.; Widyianto, A.; Amat, M.A.; Putra, D.U. Optimization of gas metal arc welding (GMAW) parameters for minimum distortion of T welded joints of A36 mild steel by Taguchi method. In Materials Science Forum; Trans Tech Publications Ltd.: Bäch, Switzerland, 2020; pp. 356–363. [Google Scholar]
- Chao, Y.J. Measuring welding-induced distortion. In Woodhead Publishing Series in Welding and Other Joining Technologies, Processes and Mechanisms of Welding Residual Stress and Distortion; Feng, Z., Ed.; Woodhead Publishing: Sawston, UK, 2005; pp. 209–224. [Google Scholar]
- Zhang, L.; Michaleris, P.; Marugabandhu, P. Evaluation of Applied Plastic Strain Methods for Welding Distortion Prediction. J. Manuf. Sci. Eng. 2006, 129, 1000–1010. [Google Scholar] [CrossRef]
- Deng, D.; Zhou, Y.; Bi, T.; Liu, X. Experimental and numerical investigations of welding distortion induced by CO2 gas arc welding in thin-plate bead-on joints. Mater. Des. 2013, 52, 720–729. [Google Scholar] [CrossRef]
- Li, M.; Ji, S.; Yan, D.; Yang, Z. Controlling welding residual stress and distortion by a hybrid technology of transient thermal tensioning and trailing intensive cooling. Sci. Technol. Weld. Join. 2019, 24, 527–537. [Google Scholar] [CrossRef]
- Deng, D. FEM prediction of welding residual stress and distortion in carbon steel considering phase transformation effects. Mater. Des. 2009, 30, 359–366. [Google Scholar] [CrossRef]
- Gannon, L.; Liu, Y.; Pegg, N.; Smith, M.J. Effect of welding-induced residual stress and distortion on ship hull girder ultimate strength. Mar. Struct. 2012, 28, 25–49. [Google Scholar] [CrossRef]
- Hashemzadeh, M.; Garbatov, Y.; Soares, C.G. Analytically based equations for distortion and residual stress estimations of thin butt-welded plates. Eng. Struct. 2017, 137, 115–124. [Google Scholar] [CrossRef]
- Mert, T.; Tsai, C.L.; Babu, S.; Yang, Y.-P. Strain-Based Assessment and Modeling for Low-Distortion Welding Procedure. Mater. Manuf. Process. 2012, 27, 943–948. [Google Scholar] [CrossRef]
- Michaleris, P.; Zhang, L.; Bhide, S.R.; Marugabandhu, P. Evaluation of 2D, 3D and applied plastic strain methods for predicting buckling welding distortion and residual stress. Sci. Technol. Weld. Join. 2006, 11, 707–716. [Google Scholar] [CrossRef]
- Correa, S.R.; de Campos, M.F.; Marcelo, C.; de Castro, J.A.; Fonseca, M.C.; Chuvas, T.; Campos, M.; Padovese, L.R. Evaluation of Residual Stresses in Welded ASTM A36 Structural Steel by Metal Active Gas (MAG) Welding Process. Mater. Sci. Forum 2016, 869, 567–571. [Google Scholar] [CrossRef]
- Nunez-Moreno, F.A.; Tole-Lozano, J.D. Correlation Study between the Surface-Magnetic Response and Sinusoidal Axial-Tensile Strain on a Butt-Weld Connection Performed on ASTM A36 Steel. J. Mater. Civ. Eng. 2020, 32, 04020204. [Google Scholar] [CrossRef]
- Kutsuna, M.; Chen, L. Interaction of both plasmas in CO2 laser-MAG hybrid welding of carbon steel. In First International Symposium on High-Power Laser Macro Processing; Society of Photo Optical: Bellingham, WA, USA, 2003; Volume 4831. [Google Scholar] [CrossRef]
- Roslan, R.A.E.; Ladin, L.H.M.; Mamat, S. Effect of welding process to the porosity formation in as welded carbon steel. In Proceedings of the International Conference on Science, Technology and Education (ICSTE 2020), Pattaya City Chonburi, Thailand, 16–18 September 2020. [Google Scholar]
- Roslan, R.A.E.; Ladin, L.H.M.; Mamat, S.; Ter Teo, P.; Abdullah, N.H.; Arlina, A.; Mohamad, F.; Toshifum, Y. Effect of Welding Process to the Porosity Formation in Carbon Steel. IOP Conf. Ser.Earth Environ. Sci. 2020, 596, 012045. [Google Scholar] [CrossRef]
- Stanciu, E.M.; Pascu, A.; Gheorghiu, I. CMT Welding of Low Carbon Steel Thin Sheets. IOP Conf. Ser. Mater. Sci. Eng. 2017, 209, 012051. [Google Scholar] [CrossRef]
- Wahyudianto, A.; Ilman, M.N.; Iswanto, P.T.; Akhyar, A. The Effect of Tool Rotation Speed on Hardness, Tensile Strength, and Microstructure of Dissimilar Friction Stir Welding of Dissimilar AA5083 and AA6061-T6 Alloys. Key Eng. Mater. 2021, 892, 159–168. [Google Scholar] [CrossRef]
- Skowrόnska, B.; Chmielewski, T.; Golański, D.; Szulc, J. Weldability of S700MC steel welded with the hybrid plasma + MAG method. Manuf. Rev. 2020, 7, 4. [Google Scholar]
- Unt, A.; Salminen, A. Effect of welding parameters and the heat input on weld bead profile of laser welded T-joint in structural steel. J. Laser Appl. 2015, 27, S29002. [Google Scholar] [CrossRef]
- Gáspár, M. Effect of Welding Heat Input on Simulated HAZ Areas in S960QL High Strength Steel. Metals 2019, 9, 1226. [Google Scholar] [CrossRef]
- Ali, N.; Husin, H.; Farhan, A. Differences in Pour Temperature Affect Hardness Properties of CuZn Brass Alloy through Metal Casting. IOP Conf. Ser. Mater. Sci. Eng. 2021, 1082, 012001. [Google Scholar] [CrossRef]
- Akhyar, H. Husaini Study on Cooling Curve Behavior During Solidification and Investigation of Impact Strength and Hardness of Recycled Al–Zn Aluminum Alloy. Int. J. Met. 2016, 10, 452–456. [Google Scholar]
- Preedawiphat, P.; Mahayotsanun, N.; Sa-ngoen, K.; Noipitak, M.; Tuengsook, P.; Sucharitpwatskul, S.; Dohda, K. Creep behaviors of ASTM A36 welded joints. Eng. Appl. Sci. Res. 2021, 48, 446–455. [Google Scholar]
- Popovic, O.; Cvetkovic, R.P.; Burzic, M.; Milutinovic, Z. The effect of heat input on the weld metal toughness of surface welded joint. In Proceedings of the 14th International Research/Expert Conference 14th, Mediterranean Cruise, 11–18 September 2010. [Google Scholar]
- Wibowo, H.; Ilman, M.N.; Iswanto, P.T. Analisa Heat Input Pengelasan terhadap Distorsi, Struktur Mikro dan Kekuatan Mekanis Baja A36. J. Rekayasa Mesin 2016, 7, 5–12. (In Indonesian) [Google Scholar] [CrossRef][Green Version]
Publisher’s Note: MDPI stays neutral with regard to jurisdictional claims in published maps and institutional affiliations. |
© 2022 by the authors. Licensee MDPI, Basel, Switzerland. This article is an open access article distributed under the terms and conditions of the Creative Commons Attribution (CC BY) license (https://creativecommons.org/licenses/by/4.0/).