Article

Fierce Heat and Players’ Health: Examining the View on Japan High School Baseball

Department of Economics, Seinan Gakuin University, Fukuoka 814-8511, Japan
Sustainability 2022, 14(3), 1399; https://doi.org/10.3390/su14031399
Submission received: 10 December 2021 / Revised: 11 January 2022 / Accepted: 22 January 2022 / Published: 26 January 2022
(This article belongs to the Section Economic and Business Aspects of Sustainability)

Abstract

:
A summer high school baseball tournament is held every mid-summer in Koshien Stadium. “Koshien Baseball” is very popular in Japan; however, it faces the problem of extremely high temperatures during games. Thus, high school players are threatened by harsh environmental conditions. For this reason, two Internet surveys were distributed to the same individuals. Then, their views regarding the Koshien tournament before and after the provision of information regarding environmental change in Japan were gathered. Using these data, this study examined how their views changed after being introduced to the information. Compared with their previous views, it was found that (1) respondents were more likely to agree that the management rules of the Koshien tournament should be altered to protect players’ health, and (2) the impact of providing information is greater for female respondents, young respondents, and highly educated respondents. This study provides evidence that the effect of information provision varies according to gender, age, and educational background. However, the mechanism causing this difference has not yet been analyzed. It would be valuable to consider this mechanism in future research.

1. Introduction

The impact of heatwaves on health has been increasingly analyzed [1]. Increased exposure to heat negatively affects human health, which leads to increased death in various geographical locations around the world, such as the USA [2], Taiwan [3], and China [4,5]. Temperatures increase in urban areas due to man-made activities, resulting in the urban heat island (UHI) effect. The UHI increased the detrimental influence of heatwaves on human health in urban areas in Europe [6] and China [7]. Heatwaves increased total ambulance calls by 19% in Australia [8] and increased all-cause admissions by 2.5% in Vietnamese hospitals [9]. The risk of death is increased by 10% on a heatwave day compared to a non-heatwave day in the USA [10]. This also holds true in Japan. The average temperature in Japan rises every year. Particularly, during mid-summer, temperatures greater than 35 °C are frequently recorded, accompanied by a high humidity. Due to climate change, the lives of Japanese people are jeopardized. Thus, during the final week of July 2019, a total of 5600 people were sent to the hospital because of heatstroke [11]. Furthermore, in the summer of 2019, a total of 162 people died of heatstroke during heatwaves [12]. During the Tokyo 2020 Summer Olympics, the players experienced serious heatwaves accompanied by high humidity. For example, during the match, a tennis player named Daniil Medvedev told the chair umpire, “I can finish the match, but I can also die” and asked him “If I die, are you going to be responsible?” [13]. By 2085, it will be too risky to hold the Summer Olympic Games in most cities in the Northern Hemisphere due to environmental changes [14].
Baseball is one of the most popular sports in Japan. The Japanese are attracted not only to professional baseball games, but also to amateur ones. During the annual spring and summer seasons in Japan, the national high school baseball tournament is held annually at Koshien Stadium in summer and spring. In the summer tournament, 49 teams are selected to represent 47 prefectures and play games in Koshien Stadium, while in the spring, only 30 teams are selected to play. The summer “Koshien Baseball” event is larger than the one in spring, and it is the most popular sporting event in Japan [4,5,6]. The high school summer break usually begins on 20 July and ends on 31 August, although there are differences among prefectures. During the summer high school break, the games for regional elimination and the main Koshien tournament games are held. In other words, the final game at Koshien Stadium must be completed before September when high schools reopen. Inevitably, the schedule is very tight. During the Koshien tournament, there are four games every day, except the days when the final or semi-final games are held. Koshien Stadium is an open-air stadium. “As hot as the action can be on the field, the soaring temperatures during the day can be dangerous for fans watching the games. Amid the relentless heatwave, shops at the stadium began selling portable electric fans, cooling mist spray bottles, and other items as part of efforts to prevent the crowd from suffering heatstroke” [15]. However, high school boys play under a scorching sun and high humidity. They are exhausted and face the risk of heatstroke. The Japan High School Baseball Federation (JHBF) has faced considerable difficulty in arranging the optimal conditions for games to protect players. Several measures have been adopted to address this problem. For instance, the JHBF postponed the starting times of two quarterfinal games to avoid the hottest times of the day. One game started at 7 p.m. and did not end until approximately 11 p.m. [16]. However, the problem was not fully solved, because most games take place during mid-day due to tight schedules.
The problem of the Koshien tournament has drawn attention in Japan [8,9,10]. However, the summer Koshien tournament started in 1915, when, 15 years before, Uruguay won soccer’s first World Cup [17,18,19,20,21]. For over 100 years, high school boys have played baseball during mid-summer. The history and experience of the Koshien tournament have led people to have a conservative view with regard to the current system and rules. However, the negative effects of heatwaves on society have been widely observed in previous studies [22,23,24,25,26,27,28]. For instance, a heatwave was accompanied by large excess mortality [24]. Furthermore, high temperatures reduce workers’ incentive to work [29] and reduce productivity [30].
It is unknown whether people who adhere to the traditional system of the Koshien tournament consider the effects of climate change over the past 100 years. Increasingly, various studies have conducted information-provision experiments and found that people’s behavior changed after information was provided [31,32,33,34,35,36]. There was a moderate reduction in partisan differences in beliefs regarding climate change if survey respondents were provided with incentives [37]. It is worth analyzing how information provision gives people an incentive to improve the situation and to sustain society. Through an Internet experiment, this study examined how, and to what extent, people’s views about the Koshien tournament changed when provided with information on climate change in Japan. A key finding was that respondents are more likely to agree that the management rules should be changed to protect the player’s health after viewing the information. Furthermore, the effect was greater for female, young, and highly educated respondents.
The remainder of this paper is organized as follows: Section 2 describes the research design and data. Section 3 presents the results and interpretations. Section 4 discusses the study’s findings. The final section provides reflections and conclusions.

2. Methods and Data

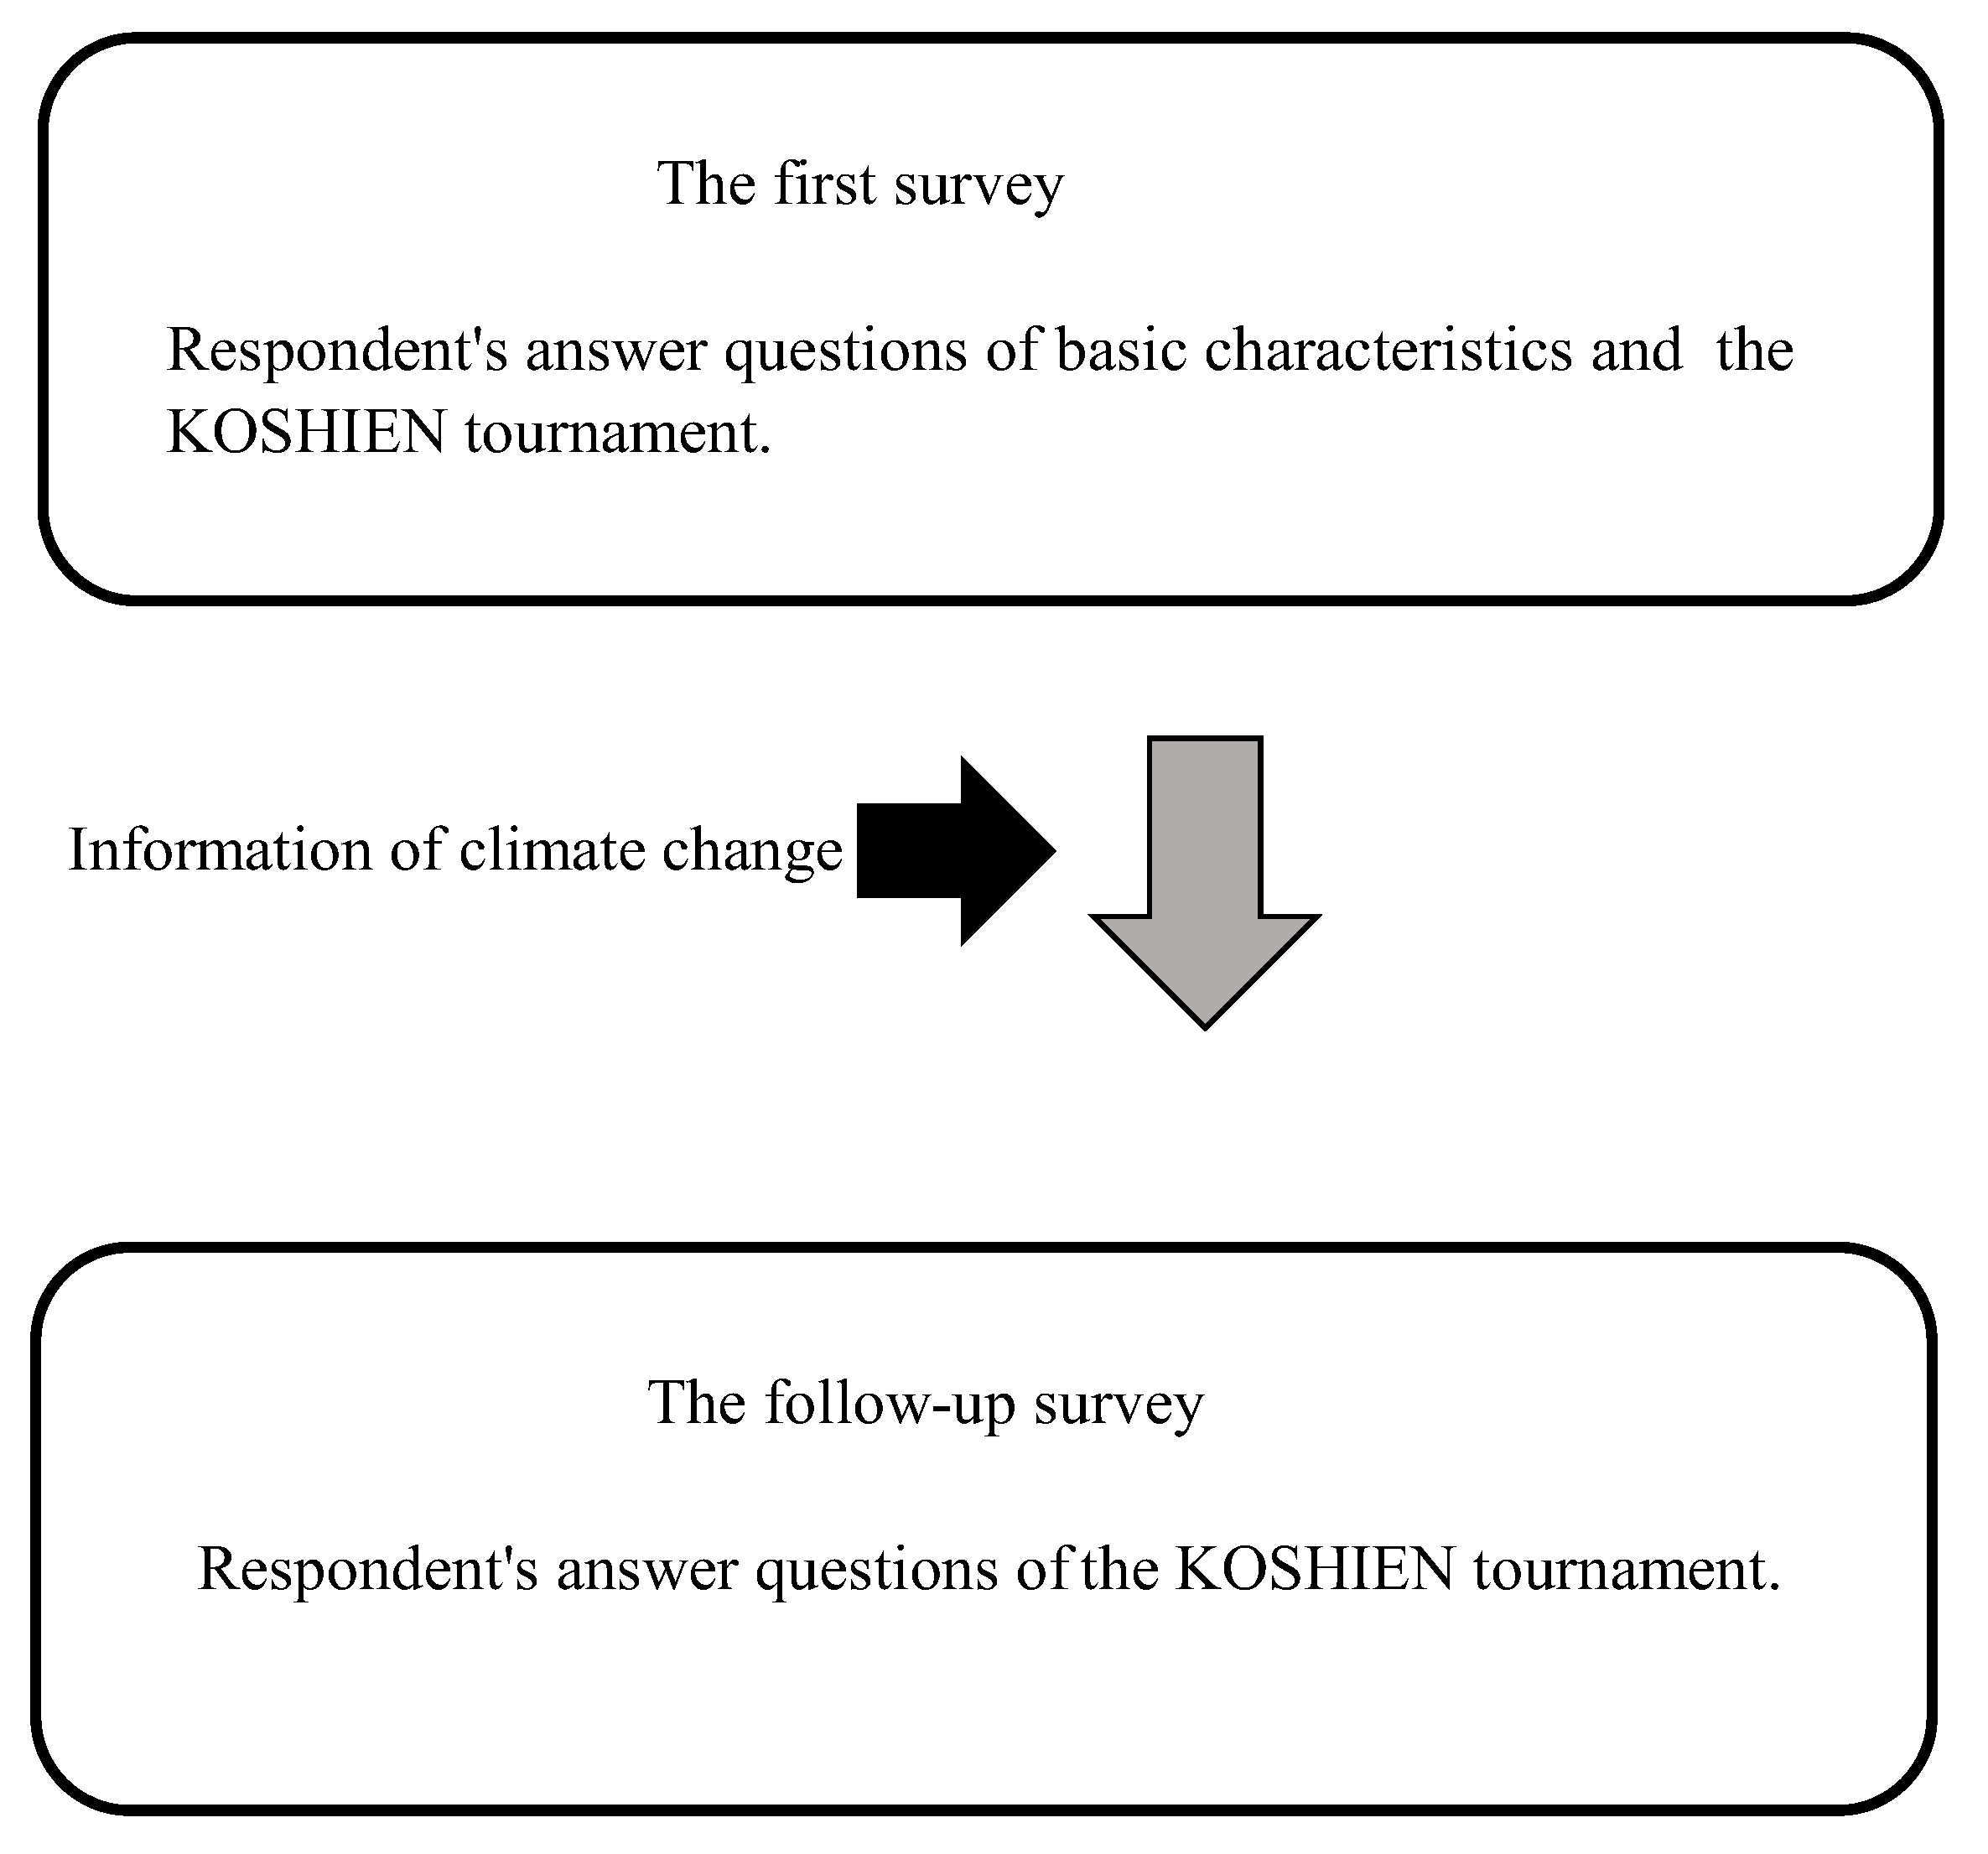
2.1. Experimental Design

A flowchart of the simple experiment used in this study is presented in Figure 1. As explained further in the text, the same respondents participated in the first and follow-up surveys, and answered the same questions regarding the system of the Koshien tournament. The differences that respondents were informed of the increase in extremely hot days in the follow-up survey. Therefore, the effect of information provision on the Koshien tournament was examined in the experimental design. In other words, this design examines how, and to what extent, participants change their views after learning about the increase in extreme heat days.

2.1.1. First Survey

In Japan, the Nikkei Research Company (NRC) has experience in academic research on Internet surveys [38,39,40]. Therefore, the NRC was commissioned to conduct a nationally representative web survey for Japan through 25–30 October 2018. A total of 9130 participants participated in the survey. In the first survey, 7855 observations were gathered, which were reduced to 7285 in the follow-up survey. Eventually, the response rate reached 79%. In the first survey, as basic information, respondents were asked about their residential locality, age, and educational background, and they were selected from 47 prefectures. They were then asked to report their subjective views about the Koshien tournament:
Do you agree that the operation system of the tournament should be changed to protect the school player’s health?
1 (Strongly disagree) to 5 (Strongly agree).

2.1.2. Follow-Up Survey

Two weeks after the first survey, the follow-up survey was distributed to the respondents who completed the original questionnaire. Hence, the two-period panel data were constructed through the first and follow-up surveys. As per the flow chart shown in Figure 1, information on climate change was provided directly before they answered the question about the Koshien tournament. The specific information on climate changes is demonstrated in Figure 2, where we indicate the total number of extreme heat days every five years from 1880 to 2015. An extremely hot day was defined as having a temperature >35 °C. However, the temperature varies according to the location where the temperature is measured. Therefore, we used the data for extremely hot days in Osaka because Osaka is nearby and has a climate similar to that of Koshien Stadium.
The average temperatures of August in Japan are 27.7 °C (2014), 26.7 °C (2015), 27.1 °C (2016), 26.4 °C (2017), and 28.1°C (2018). Therefore, the survey participants experienced the highest temperature of the past five years when the survey was conducted. High temperatures can have a significant effect on participants during the tournament. This possibly influences the estimation results if a cross-section analysis is conducted. However, a fixed-effects analysis is conducted using panel data, wherein the interval between the first and follow-up surveys is only two weeks. People who are seriously affected during the summer tournament have a relatively different view. However, the approach used in this study allows for a comparison of the same person’s view first in summer, and then in autumn. Accordingly, the effects of the temperatures and incidents that occurred during the tournament can be controlled.
A cursory examination of Figure 2 reveals that the total number of extremely hot days was <5 days for the first five years of the Koshien tournament, and so people averagely experienced these once every two or three years. After World War II, increasing trend was seen, although there was a wide variation. In particular, it is noteworthy that the number of extremely hot days increased drastically after the 1990s and reached 35 days in 2015. That is, on average, people living in Osaka experienced seven days with temperatures exceeding 35 °C. Furthermore, the hottest season is during the Koshien Tournament. Furthermore, most of the games in the Koshien Tournament were conducted during the daytime. Figure 2 implies that high school players face the risk of heatstroke, especially after 2000.

2.2. Data

Using data obtained from the Internet experiment described in Section 2.1, this paper presents an experiment on how people’s views about the Koshien tournament games changed after being presented with information of an increase in the day with the temperature exceeding 35 °C from 1880 to 2015.
Table 1 describes the variables and their mean values, and standard errors using the sample before and after the provision of the information. KOSHIEN is a discrete variable ranging from 1 (strongly disagree) to 5 (strongly agree). The mean value of KOSHIEN is 3.58 on a 5-point Likert-type scale. None of the respondents received any information in the first survey and obtained the information in the follow-up survey. This is reflected in the mean value of INFORMATION at 0.50. The mean value of UNIV is 0.25, suggesting that 25% of the respondents graduated from university. YOUNG_AGE is 0.18, indicating that 18% of the respondents were younger than 30 years. The mean value of FEMALE was 0.49, indicating that almost half of the respondents were women. This implies that respondents prefer the tournament system on average.
For a closer examination of KOSHIEN, Figure 3 illustrates the distribution of KOSHIEN by dividing it into sub-samples before and after providing the information. There was a striking difference in their distribution. Before providing the information, approximately 40% of respondents chose “3” and so were neutral with regard to the question. Respondents who selected “Agree” or “Strongly agree” were about 30% and 20%, respectively. After providing the information, respondents who selected neutral declined to slightly lower than 30%, while respondents who selected “Strongly agree” rose to slightly over 30%. Overall, many respondents were more likely to support changes in the system after being exposed to the information.

2.3. Method

This study aims to analyze how information provision gives people an incentive to protect human health. For this purpose, I examined a case study of a mid-summer high school baseball tournament in Japan. I examined how, and to what extent, people’s views about the tournament were changed by providing information on climate change in Japan. A fixed-effects model was used. The baseline estimated function took the following form:
KOSHIENit = α0 + α1 INFORMATION t + mi + uit,
where KOSHIENit represents the dependent variable for individual i and time point t. The regression parameters are denoted as α. The error term is denoted by u. The key independent variable was FORMATION. The sign of the coefficient of INFORMATION is expected to be positive if the information on increasing extreme heat days leads respondents to agree with the change in the tournament system.
Furthermore, the heterogeneity of people’s characteristics recently drew attention when researchers analyzed treatment effects such as information provision. Depending on participants’ prior beliefs, groups of participants may update their beliefs in different directions in response to information [31]. Prior beliefs cannot be observed directly but can be considered to depend on gender, age, and educational background. Hence, it is beneficial to explore how the effect of information varies according to respondent’s characteristics. For this purpose, several cross terms with INFORMATION were included in the alternative specifications.
INFORMATION*FEMALE, INFORMATION*YOUNG_AGE and INFORMATION*UNIV.
Various studies suggest that there are sex differences regarding risk and overconfidence. Women are more likely to exhibit risk aversion and be cautious [41,42,43]. They are also more benevolent and universally concerned [43]. From this, we infer that women are more likely to agree with the change in the tournament system to protect the health of high school boys. Hence, the predicted sign of the coefficient of INFORMATION*FEMALE is positive. The status quo bias is that people tend to do nothing or maintain their current or previous decisions, even if it is better to change their decisions [44,45,46]. Young people are less likely to have status quo biases [34,35,36,37,38,39,40,41,42,43,44,45,46,47]. Accordingly, people are more willing to change the existing traditional tournament system. Hence, the predicted sign of the coefficient of INFORMATION* YOUNG_AGE is positive. Turning to INFORMATION*UNIV, more educated people are more able to appropriately evaluate the effect of heatwaves on players’ health after learning about the situation of extreme temperature increases. Thus, the coefficient of INFORMATION* UNIV is predicted to have a positive sign.

3. Results

In Table 2, the estimates obtained from the fixed-effects (EF) estimations are presented. This table indicates a positive sign for INFORMATION and statistical significance at the 1% level in all columns, thus supporting the inference presented in the previous section. In column (1), the absolute value of the INFORMATION coefficient is 0.234. This implies that providing the information caused respondents to agree with the change in the tournament system by a 0.234 point on a 5-point scale.
In column (2), the sign of INFORMATION*FEMALE is positive and statistically significant at the 1% level, which is consistent with the inference in the previous section. The absolute value is 0.098, meaning that the effect of providing information for women is 0.098 points larger than that for men. The coefficient of INFORMATION is 0.187, meaning that the effect of information provision for men is 0.187 points. Based on these results, the information provision effect for women was 52% greater than that for men.
In column (3), the sign of INFORMATION*YOUNG_AGE is positive and statistically significant at the 1% level, which is consistent with the inference in the previous section. The absolute value is 0.077, implying that the effect of providing information for people below 30 years of age is 0.077 points larger than for people over 30 years of age. The coefficient of INFORMATION is 0.221, suggesting that the effect of information provision for older people is 0.221 points. Therefore, the information provision effect for young people is 35% larger than that for older people.
In column (4), the sign of INFORMATION*UNIV shows a positive sign and statistical significance at the 5% level. This is in line with the inference presented in the previous section. The absolute value is 0.047, indicating that the effect of providing information for those who graduated from university is 0.047 points greater than that of lower-educated people. The coefficient of INFORMATION is 0.223, suggesting that the effect of information provision for low-educated people is 0.223 points. Overall, the information provision effect for educated people is 21% greater than that for low-educated people.
The results jointly reveal that the predicted effect of information provision is more strongly observed for female, young, and highly educated people. However, the effect is also observed for men, old, and low-educated people, although its effect is smaller.

4. Discussion

From the findings, it follows that information on climate change is effective in directing people to change the tournament system to protect players’ health. This makes the tournament sustainable because sports events can be sustained, assuming that the system maintains players’ health. However, there is a problem of increased risk of heatstroke and death when high school baseball players are exposed to daytime heatwaves during mid-summer. Japanese people are likely to know through their experience that the average temperature rises. However, they are unlikely to connect climate change with summer sports and players’ health—hence their responses to questions about tournament systems change if they are asked directly after being provided with this information. Further, Japanese people’s perception about the rise in heat waves is possibly reinforced by the provision of objective information, such as the rising trend exhibited in the previous figures. One solution could be a change in stadium from Koshien to a roofed baseball park, an all-weather baseball stadium.
Turning to the difference in the effects of information provision between groups. The findings of this study made it evident that women are more sensitive to objective information about climate change than men. Compared to men, women tend to be more benevolent and universally concerned [43], which leads to paying attention to the health condition of sports players. Through social interaction, women’s responses influence men, which lead men to adopt a more positive view of activity in a sustainable society [39]. Similarly, the effect of information provision is larger for highly educated and young people when they consider the relation between heat waves and health. People can adapt to the risk of heatwaves by learning from past experiences [24]. The learning effect on disaster prevention can be strengthened through social interaction [48]. Hence, the provision of information should be more intensively provided to women and highly educated and young people. Then, spillover through social interaction generates the norm, which changes the view of men and less educated and older people.
In addition to health [24], the issue of temperature change can be considered in terms of productivity. The heatwave reduces the quality of play in baseball games. An increase in temperature has a detrimental effect not only on agricultural productivity [49], but also on manufacturing labor productivity [35,36], and years of high temperatures are associated with a lower economic output in developing countries, which can be explained by reduced worker productivity and increased absenteeism on hot days [29]. High temperatures >21 °C lead to drops in online game performance [50]. Online gaming requires intense engagement and the deployment of cognitive skills, which are key factors in other productive activities. Temperature anomalies at the time of birth have long-term negative impacts on an individuals’ economic productivity after they become adults, implying that human capital formation is hampered [51]. Climate control is thought to significantly mitigate productivity losses in various sectors.
The provision of information regarding the increase in hot days plays a critical role in changing the social system to protect workers’ health and to maintain their engagement in work and their productivity. This is the key to achieving sustainable development.
The simple and partial question used in this study is not sufficient to understand the opinions of the participants, although this holds in any positive analysis that considers the subjective view. A case study in a novel setting such as this is useful for providing the first step to bridge the gap between climate change and sports events from the behavioral economics perspective. Furthermore, experiences prior to the first survey can be controlled using fixed-effect estimations. However, there could be possible changes in survey participants’ health status and preventive behaviors between the first and follow-up surveys, which could influence the view of the high school baseball tournament. Unfortunately, in the questionnaire, preventive behaviors were not assessed. Health status was assessed in the first wave, but not in the second one. These issues should be addressed in future studies, although such drastic changes are unlikely to have occurred within two weeks, between the end of October (the first survey) and mid-November (the follow-up survey).

5. Conclusions

Extremely high temperatures have negative effects on labor productivity and health conditions. During the Tokyo 2020 Summer Olympics games, players experienced heatwaves, which led them to encountering difficulties. Athletes struggled with the heat accompanied by high humidity during games, and some of them experienced serious injuries by falling unconscious [52]. Under the same conditions, summer high school baseball tournaments have been held every mid-summer for over 100 years since 1915. The traditional tournament system has not been modified, although the number of extremely hot days has increased. This leads to the endangerment of high school players by unsafe environments. Internet surveys were conducted twice to purposefully test the same individuals. Then, the views of changing the tournament system before and after providing the information were compared. Using the data, it was found that, compared with their initial views, respondents were more likely to agree that the management rule of the Koshien tournaments should be changed to protect player’s health, and (2) the effect was greater for female respondents, young people, and highly educated respondents. However, the provision changed views for men, old people, and low-educated people. Through social interaction, the tournament system would change if people are provided with the correct information about climate change.
I found that information provision varies with gender, age, and educational background. It is valuable to consider this mechanism in future research. Further, the findings of this study are based on a simple question about the subjective view of the tournament system. Hence, the contribution of this study is that it simply provides facts in the novel setting of high school baseball games. This is not sufficient to derive a strong conclusion for policy implications. However, it is critical to consider the effect of information provision using alternative subjective and objective variables. The relationship between health issues and environmental sustainability should be analyzed by considering sports events in terms of behavioral science. These issues should be addressed in future studies.

Funding

This research was funded by the Japan Society for the Promotion of Science (grant number [16H03628]).

Institutional Review Board Statement

Ethical review and approval were waived for this study. The survey used in this study falls outside the scope of the Japanese government’s Ethical Guidelines for Medical and Health Research Involving Human Subjects, and there are no national guidelines in Japan for social and behavioral research. Therefore, our study was carried out in accordance with the Ethical Principles for Sociological Research of the Japan Sociological Society, which does not require an ethical review.

Informed Consent Statement

Informed consent was obtained from all subjects involved in the study. All survey participants gave their consent to participate in the anonymous online survey by the Nikkei Research Company. The authors did not obtain personal information about the participants. After being informed about the purpose of the study and their right to quit the survey, participants agreed to participate. They were provided with the option “I do not want to respond. The completion of the entire questionnaire was considered to indicate the participants’ consent.

Data Availability Statement

The data presented in this study are available upon request from the corresponding author.

Acknowledgments

We would like to thank four anonymous referees for their valuable suggestions to improve the paper.

Conflicts of Interest

The authors declare that there is no conflict of interest.

References

  1. Campbell, S.; Remenyi, T.A.; White, C.J.; Johnston, F.H. Heatwave and health impact research: A global review. Health Place 2018, 53, 210–218. [Google Scholar] [CrossRef] [PubMed]
  2. Sugg, M.M.; Konrad, C.E.; Fuhrmann, C.M. Relationships between maximum temperature and heat-related illness across North Carolina, USA. Int. J. Biometeorol. 2016, 60, 663–675. [Google Scholar] [CrossRef] [PubMed]
  3. Sung, T.-I.; Wu, P.-C.; Lung, S.-C.; Lin, C.-Y.; Chen, M.-J.; Su, H.-J. Relationship between heat index and mortality of 6 major cities in Taiwan. Sci. Total Environ. 2013, 442, 275–281. [Google Scholar] [CrossRef] [PubMed]
  4. Yin, Q.; Wang, J. The association between consecutive days’ heat wave and cardiovascular disease mortality in Beijing, China. BMC Public Health 2017, 17, 223. [Google Scholar] [CrossRef] [Green Version]
  5. Zeng, Q.; Li, G.; Cui, Y.; Jiang, G.; Pan, X. Estimating temperature-mortality exposure-response relationships and optimum ambient temperature at the multi-city level of China. Int. J. Environ. Res. Public Health 2016, 13, 279. [Google Scholar] [CrossRef] [Green Version]
  6. Ward, K.; Lauf, S.; Kleinschmit, B.; Endlicher, W. Heat waves and urban heat islands in Europe: A review of relevant drivers. Sci. Total Environ. 2016, 569–570, 527–539. [Google Scholar] [CrossRef]
  7. Tan, J.; Zheng, Y.; Tang, X.; Guo, C.; Li, L.; Song, G.; Zhen, X.; Yuan, D.; Kalkstein, A.J.; Li, F.; et al. The urban heat island and its impact on heat waves and human health in Shanghai. Int. J. Biometeorol. 2010, 54, 75–84. [Google Scholar] [CrossRef]
  8. Turner, L.R.; Connell, D.; Tong, S. The Effect of Heat Waves on Ambulance Attendances in Brisbane, Australia. Prehospital Disaster Med. 2013, 28, 482–487. [Google Scholar] [CrossRef] [Green Version]
  9. Phung, D.; Chu, C.; Rutherford, S.; Nguyen, H.L.T.; Do, C.M.; Huang, C. Heatwave and risk of hospitalization: A multi-province study in Vietnam. Environ. Pollut. 2017, 220, 597–607. [Google Scholar] [CrossRef]
  10. Isaksen, T.B.; Fenske, R.A.; Hom, E.K.; Ren, Y.; Lyons, H.; Yost, M.G. Increased mortality associated with extreme-heat exposure in King County, Washington, 1980–2010. Int. J. Biometeorol. 2016, 60, 85–98. [Google Scholar] [CrossRef] [Green Version]
  11. Kyodo News. 11 dead, 5600 people sent to hospitals in Japan heatwave. Kyodo News. 30 July 2019. Available online: https://english.kyodonews.net/news/2019/07/2c0b97e13870-11-dead-5600-people-sent-to-hospitals-in-japan-heatwave.html (accessed on 10 December 2021).
  12. Ando, I.; Takeuchi, A.; Araki, S. Japan heatstroke death toll hits 162; lack of air conditioning cited. Mainichi Newspaper. 10 August 2019. Available online: https://mainichi.jp/english/articles/20190810/p2a/00m/0na/013000c (accessed on 10 December 2021).
  13. Durkee, A. Tokyo Olympics: Tennis shifts later due to extreme heat after player Medvedev says he ‘can die’ during match. Forbs. 28 July 2021. Available online: https://www.forbes.com/sites/alisondurkee/2021/07/28/tokyo-olympics-tennis-shifts-later-due-to-extreme-heat-after-player-medvedev-says-he-can-die-during-match/?sh=763ae92a162b (accessed on 10 December 2021).
  14. Smith, K.R.; Woodward, A.; Lemke, B.; Otto, M.; Chang, C.J.; A Mance, A.; Balmes, J.; Kjellstrom, T. The last Summer Olympics? Climate change, health, and work outdoors. Lancet 2016, 388, 642–644. [Google Scholar] [CrossRef]
  15. Yomiuri Newspaper. Fans at Koshien finding ways to beat the heat Baseball Federation of Japan. Yomiuri Newspaper. 12 August 2019. Available online: https://baseballjapan.org/system/prog/news.php?l=e&i=1802 (accessed on 10 December 2021).
  16. Rich, M.; Ueno, H.; Inoue, M. In Japan, Deadly Heat Wave Tests Endurance of Even the Most Stoic. New York Times (Online). 25 July 2018. Available online: https://www.nytimes.com/2018/07/25/world/asia/japan-heat-wave.html (accessed on 10 December 2021).
  17. Yamamura, E. Identity, nostalgia and happiness among migrants: The case of the Kōshien High School Baseball Tournament in Japan. Pac. Econ. Rev. 2017, 22, 792–813. [Google Scholar] [CrossRef]
  18. Whiting, R. Agony and ecstasy: Why Japan is obsessed with high school baseball. Nikkei Asia. 24 July 2019. Available online: https://asia.nikkei.com/Life-Arts/Life/Agony-and-ecstasy-Why-Japan-is-obsessed-with-high-school-baseball (accessed on 10 December 2021).
  19. Lefton, B. In Japan, 100 Years of Glory Days for High School Baseball. New York Times (Online). 16 August 2018. Available online: https://www.nytimes.com/2018/08/16/sports/japan-high-school-baseball.html (accessed on 10 December 2021).
  20. Arai, R.; Fujita, T.; Yasuda, M. Japan Koshien HS ballplayers using white spikes to counter heat in substitute event. Mainichi Newspaper. 14 August 2020. Available online: https://mainichi.jp/english/articles/20200813/p2a/00m/0na/015000c#:~:text=Japan%20Koshien%20HS%20ballplayers%20using%20white%20spikes%20to%20counter%20heat%20in%20substitute%20event,-August%2014%2C%202020&text=OSAKA%20%2D%2D%20Japan%20high%20school,championship%20that%20began%20on%20Aug (accessed on 10 December 2021).
  21. Yomiuri Newspaper. Editorial: Use tiebreakers as 1st step to ease burden on high school baseball players. Yomiuri Newspaper. 25 September 2017. Available online: https://www.staradvertiser.com/2017/11/09/news/use-tiebreakers-as-1st-step-to-ease-burden-on-high-school-baseball-players/ (accessed on 10 December 2021).
  22. Orlov, A.; Sillmann, J.; Aaheim, A.; Aunanm, K.; Bruin, K. Economic Losses of Heat-Induced Reductions in Outdoor Worker Productivity: A Case Study of Europe. Econ. Disasters Clim. Change 2019, 3, 191–211. [Google Scholar] [CrossRef]
  23. Das, S. Television Is More Effective in Bringing Behavioral Change: Evidence from Heat-Wave Awareness Campaign in India. World Dev. 2016, 88, 107–121. [Google Scholar] [CrossRef]
  24. Rey, G.; Fouillet, A.; Jougla, E.; Hemon, D. Heat Waves, Ordinary Temperature Fluctuations and Mortality in France since 1971. Population 2007, 62, 457–485. [Google Scholar] [CrossRef]
  25. Hota, P.; Behera, B. Understanding the Household Perceptions of and Adaptations to Heat Wave: A Case Study. Int. J. Ecol. Econ. Stat. 2014, 33, 98–117. [Google Scholar]
  26. Zaidi, R.Z.; Pelling, M. Institutionally Configured Risk: Assessing Urban Resilience and Disaster Risk Reduction to Heat Wave Risk in London. Urban Stud. 2015, 52, 1218–1233. [Google Scholar] [CrossRef]
  27. Das, S.; Smith, S.C. Awareness as an Adaptation Strategy for Reducing Mortality from Heat Waves: Evidence from a Disaster Risk Management Program in India. Clim. Change Econ. 2012, 3, 1250010. [Google Scholar] [CrossRef]
  28. Pechan, A.; Eisenack, K. The impact of heat waves on electricity spot markets. Energy Econ. 2014, 43, 63–71. [Google Scholar] [CrossRef] [Green Version]
  29. Somanathan, E.; Somanathan, R.; Sudarshan, A.; Tewari, M. The Impact of Temperature on Productivity and Labor Supply: Evidence from Indian Manufacturing. J. Political Econ. 2021, 129, 1797–1827. [Google Scholar] [CrossRef]
  30. Cai, X.; Lu, Y.; Wang, J. The impact of temperature on manufacturing worker productivity: Evidence from personnel data. J. Comp. Econ. 2018, 46, 889–905. [Google Scholar] [CrossRef]
  31. Haaland, I.; Roth, C.; Wohlfart, J. Designing Information Provision Experiments. J. Econ. Lit. (Forthcom.). Available online: www.RePEc.org (accessed on 10 December 2021).
  32. Dupas, P. Do teenagers respond to HIV risk information? Evidence from a field experiment in Kenya. Am. Econ. J. Appl. Econ. 2011, 3, 1–34. [Google Scholar] [CrossRef] [Green Version]
  33. Bennear, L.; Tarozzi, A.; Pfaff, A.; Balasubramanya, S.; Ahmed, K.M.; van Geen, A. Impact of a randomized controlled trial in arsenic risk communication on household water-source choices in Bangladesh. J. Environ. Econ. Manag. 2013, 65, 225–240. [Google Scholar] [CrossRef] [Green Version]
  34. Allcott, H.; Knittel, C. Are consumers poorly informed about fuel economy? Evidence from two experiments. Am. Econ. J. Econ. Policy 2019, 11, 236–276. Available online: https://www.aeaweb.org/articles?id=10.1257/app.20170328 (accessed on 10 December 2021). [CrossRef] [Green Version]
  35. Allcott, H. Social norms and energy conservation. J. Public Econ. 2011, 95, 1082–1095. Available online: https://mail.google.com/mail/u/0/?tab=wm&ogbl#inbox (accessed on 10 December 2021). [CrossRef] [Green Version]
  36. Fetzer, T.; Hensel, L.; Hermle, J.; Roth, C. Coronavirus Perceptions and Economic Anxiety. Rev. Econ. Stat. 2020, 103, 968–978. [Google Scholar] [CrossRef]
  37. Peterson, E.; Iyengar, S. Partisan Gaps in Political Information and Information-Seeking Behavior: Motivated Reasoning or Cheerleading? Am. J. Political Sci. 2021, 65, 133–147. [Google Scholar] [CrossRef]
  38. Yamamura, E.; Tsutsui, Y. Trade policy preference, childhood sporting experience, and informal school curriculum: An examination of views of the TPP from the viewpoint of behavioral economics. Rev. Int. Econ. 2019, 27, 61–90. [Google Scholar] [CrossRef] [Green Version]
  39. Yamamura, E.; Managi, S.; Tsutsui, Y. Male pupils taught by female homeroom teachers show a higher preference for Corporate Social Responsibility in adulthood. J. Jpn. Int. Econ. 2019, 54, 101048. [Google Scholar] [CrossRef] [Green Version]
  40. Clark, A.; Senik, C.; Yamada, K. The Joneses in Japan: Income comparisons and financial satisfaction. Jpn. Econ. Rev. 2020. [Google Scholar] [CrossRef] [Green Version]
  41. Barber, B.M.; Odean, T. Boys Will Be Boys: Gender, Overconfidence, and Common Stock Investment. Q. J. Econ. 2001, 116, 261–292. [Google Scholar] [CrossRef]
  42. Beutel, A.; Marini, M. Gender and values. Am. Sociol. Rev. 1995, 60, 436–448. [Google Scholar] [CrossRef]
  43. Adams, R.; Funk, P. Beyond the glass ceiling: Does gender matter? Manag. Sci. 2012, 58, 219–235. [Google Scholar] [CrossRef] [Green Version]
  44. Samuelson, W.; Zeckhauser, R. Status Quo Bias in Decision Making. J. Risk Uncertain. 1988, 1, 7–59. [Google Scholar] [CrossRef]
  45. Fernandez, R.; Rodrik, D. Resistance to Reform: Status Quo Bias in the Presence of Individual- Specific Uncertainty. Am. Econ. Rev. 1991, 81, 1146–1155. [Google Scholar]
  46. Kahneman, D.; Knetsch, J.L.; Thaler, R.H. Anomalies the Endowment Effect, Loss Aversion, and Status Quo Bias. J. Econ. Perspect. 1991, 5, 193–206. [Google Scholar] [CrossRef] [Green Version]
  47. van Dalen, H.P.; Henkens, K.; Hershey, D.A. Why do older adults avoid seeking financial advice? Adviser anxiety in the Netherlands. Ageing Soc. 2017, 37, 1268–1290. [Google Scholar] [CrossRef] [Green Version]
  48. Yamamura, E. Effects of Interactions among Social Capital, Income and Learning from Experiences of Natural Disasters: A case study from Japan. Reg. Stud. 2010, 44, 1019–1032. [Google Scholar] [CrossRef] [Green Version]
  49. Salim, R.; Hassan, K.; Rahman, S. Impact of R&D expenditures, rainfall and temperature variations in agricultural productivity: Empirical evidence from Bangladesh. Appl. Econ. 2020, 52, 2977–2990. [Google Scholar] [CrossRef]
  50. Bao, X.; Fan, Q. The impact of temperature on gaming productivity: Evidence from online games. Empir. Econ. 2020, 58, 835–867. [Google Scholar] [CrossRef]
  51. Fishman, R.; Carrillo, P.; Russ, J. Long-term impacts of exposure to high temperatures on human capital and economic productivity. J. Environ. Econ. Manag. 2019, 93, 221–238. [Google Scholar] [CrossRef]
  52. Yamamura, E. Do You Want Sustainable Olympics? Environment, Disaster, Gender, and the 2020 Tokyo Olympics. Sustainability 2021, 13, 12879. [Google Scholar] [CrossRef]
Figure 1. Flow-chart of the Internet experiment.
Sustainability 14 01399 g001
Figure 2. Total number of extremely hot days in October in Osaka (Japan) every five years, in the period 1880–2015. Note: An extremely hot day is defined when the temperature exceeds 35 °C. Source: Website of Japan Meteorological Agency. http://www.data.jma.go.jp/risk/obsdl/index.php (accessed on 23 August 2018).
Sustainability 14 01399 g002
Figure 3. Distribution of view about the Koshien baseball tournament before and after provision of information.
Sustainability 14 01399 g003
Table 1. Description of variables and its means and standard deviation.
DescriptionMeans.d.
KOSHIENDo you agree that the operation system of the tournament should be changed to protect the school player’s health.?1 (strongly disagree)–5 (strongly agree)3.581.00
INFORMATIONEquals 1 if the information of climate change is provided, 0 otherwise.0.500.50
UNIVEquals 1 if respondents graduated from university, 0 otherwise.0.250.43
YOUNG_AGEEquals 1 if respondents are younger than 30 years old, 0 otherwise.0.180.38
FEMALEEquals 1 if respondents are women, 0 otherwise0.490.50
Observations 14,570
Note: The samples before and after providing the information are included. Information on climate change was provided to all respondents. INFORMATION is equivalent to the follow-up survey dummy, which equals 1 if data is from the follow-up survey, and 0 otherwise.
Table 2. Estimation results of the FE model (dependent variable is “KOSHIEN”).
KOSHIEN
(1)(2)(3)(4)
INFORMATION0.234 ***0.187 ***0.221 ***0.223 ***
(0.01)(0.02)(0.02)(0.01)
INFORMATION*FEMALE 0.098 ***
(0.02)
INFORMATION*YOUNG AGE 0.077 **
(0.03)
INFORMATION*UNIV 0.047 **
(0.02)
Within R-squared0.060.060.080.08
Observations14,57014,57014,57014,570
Note: Numbers within parentheses are robust standard errors clustered by individuals. *** p < 0.01, ** p < 0.05.
Publisher’s Note: MDPI stays neutral with regard to jurisdictional claims in published maps and institutional affiliations.

