Article

The Impact of Institutional Creativity and Innovation Capability on Innovation Performance of Public Sector Organizations in Ghana

School of Management and Economics, University of Electronic Science and Technology of China, No. 2006, Xiyuan Ave. West High-Tech Zone, Chengdu 611731, China
*
Authors to whom correspondence should be addressed.
Sustainability 2022, 14(3), 1378; https://doi.org/10.3390/su14031378
Submission received: 11 December 2021 / Revised: 5 January 2022 / Accepted: 12 January 2022 / Published: 26 January 2022
(This article belongs to the Topic Digital Transformation and E-Government)

Abstract

:
The public sector continues to be under intense pressure to improve its innovation performance. Consequently, stakeholders are calling for more empirical studies on the antecedents of innovation, especially from a developing country’s perspective. Motivated by this call, we investigate the impact of institutional creativity and institutional innovation capacity on public innovation performance in the context of Ghana. Key to our model is that, institutional creativity and institutional innovation capacity are also enabled by inter-agency collaborations, institutional leadership, and stakeholder pressure. The partial least squares structural equation model is employed to estimate the survey responses of 195 respondents from fifty public sector institutions. The empirical analysis confirms that organizational creativity has a positive and significant impact on innovation performance, innovation capacity has a negative and insignificant impact on innovation performance, and inter-agency collaboration and institutional leadership contribute positively to institutional creativity and innovation capacity. However, stakeholder pressure negatively impacts both institutional creativity and innovation performance. This study contributes to knowledge on the antecedents of public innovation performance from a developing country’s perspective. It also advances theories on public innovation performance.

1. Introduction

Innovation is acknowledged in management and business literature to be the panacea for organizational growth and performance [1,2]. Innovative firms have the tendency to outperform their competitors due to the varied products and services they offer to meet the needs and expectations of users in terms of value and quality [3,4]. Again, to survive in an environment that is constantly changing, constant innovation is required [5]. Public sector organizations operate in environments that are complex and uncertain; hence the relevance of innovation [6]. Following this, both scholars and practitioners have, in recent years, become interested in innovation in public organizations [2,7]. This is key, due to the ever-changing business, regulatory, and policy landscape [8] of public organizations. The public sector is comparatively different from the private sector in terms of underlying factors that simulate innovation activities. For instance, public organizations have more complex and ambiguous goals [9] and the decision-making process is more open and political, given the multiple stakeholder interests to be met [10]. These unique characteristics of the public sector, according to [11], are what makes it theoretically relevant to understand the distinct motivations toward innovation in public organizations.
Although extant studies exist on public innovation, most of the studies are based on a single case study from developed economies [12]. Africa, in general, and West African countries, in particular, have seen uninspiring research on public sector innovation, limiting the understanding of the underlying factors that drive or hinder public sector innovation [1]. Furthermore, while existing literature on public innovation is focused on the antecedents of public innovation, scant literature exists on the relationship between the antecedents and public innovation performance [12]. This study addresses this gap by examining the relationship between the factors influencing the innovation performance of public institutions in the era of Ghana’s digital transformation agenda. The choice of Ghana as the case study is because, since 2005, the Government of Ghana has embarked on a strategy to digitally transform public institutions—for instance, the digitalization of port processes and the adoption of other process-innovation mechanisms to boost public service delivery.
Institutional leadership is critical to shaping the direction of innovation. A leadership style that supports innovative ideas is presumed to influence the innovation process positively [13,14,15]. Moreover, the continuous demands from civil society and stakeholders for transparency, accountability, and improved services at public agencies serve as a driving factor for innovation [12,16,17]. While inter-organizational collaborations have also been found to be related to the organizational ability to acquire and use external knowledge to improve performance [18], institutional creativity, defined by an organization’s ability to adapt knowledge, information, and experience from both internal and external environments, is also conceptualized to positively influence innovation performance [19]. Organizations that support creativity were found to introduce more new products and have more success in terms of new product sales [20]. Again, institutional innovation capability, which represents the set of conditions that support innovation or provide support for it, was found to significantly affect innovation performance in a positive way [21]. According to [22], while there is much talk about the need for a change in the public sector and about what changes need to be made, little is known about how to build systems in preparation for greater innovation capacity. Consequently, the study conceptualizes that inter-agency collaboration, institutional leadership, and stakeholder demand/pressures might not have a direct influence on the innovation performance of public institutions but rather contribute directly to the institutional creativity and innovation capability, which then influence public sector innovation performance.
The significance of this paper is, arguably, far reaching, given the need to innovate processes in the public sector. In this light, the study examines the cogent factors propelling the innovation performance of public sector organizations from a developing country’s point of view. This is significant, given the limited empirical research on public sector innovation in Ghana. Empirically, the study shows a positive relationship between organizational creativity and the innovation performance of public institutions. Gaining the relevant competence offers institutions the requisite platform to transform external knowledge and pressure into new improved services and products, and to gain trust and legitimacy [23] from citizens. Furthermore, the study contributes to the discourse on the relationship between institutional creativity and innovation performance by offering empirical insights into how both organizational creativity and institutional innovation capability influence the innovation activities of public sector organizations. Additionally, we provide insights from the perspective of a developing country that has, over the years, expressed a research void in terms of public innovation. The remainder of the study is arranged as follows: Section 2 focuses on the literature review and theoretical background of the study; Section 3 focuses on the research methodology of the study; Section 4 presents the outcome of empirical analysis, and lastly, Section 5 presents the conclusion of the study.

2. Literature Review

2.1. Public Sector Innovation

Though not much difference exists between what constitutes innovation in the private sector and what it is in the public sector [24], previous studies on public innovation have defined public innovation using different perspectives: “the generation or creation of new ideas or processes that lead to a discontinuous change” [25]; “innovation is considered as a process from ideas to successful implementation of these, which makes a substantial difference to an organization’s understanding of the needs it is addressing and the services it delivers” [13]; “the introduction of new elements into a public service that represents a discontinuity with the past” [12].
According to [26,27], public sector innovation is driven by internal and external factors acting together to make organizations meet their purpose of delivering excellent services to society. These factors include those factors which are related to the environment of the organization, factors related to the organization itself, factors related to the employee or the individual in the organization, and factors related to the innovation [12]. Among these, organizational antecedents such as institutional leadership [13,28,29], environmental antecedents such as participation in networks [18,30] and pressure from stakeholders [31], and organizational slack resources such as talented employees [32] and innovation capacity [33] were found to greatly impact innovation.
Studies have enumerated how pressures on governments from stakeholders demanding better services often serve as a major stimulant for innovation in the public sector [31]. One study found that public sector innovation is influenced extensively by demands from the external environment [26]. Regulatory demands and public agitation for fair and equitable public services serve as a core foundation in institutional innovation processes. Another study found that political pressure is an important factor for large-scale adoptions of organizational innovations in the public sector [34].
Furthermore, literature on innovation and creativity emphasizes the importance of the connection between individuals, groups, and organizations to their ability to absorb new information, to learn, and to alter existing insights to improve innovation performance [19]. Organizations are able to enhance their creative abilities through such connections [18]. Inter-agency collaborations are important for achieving successful outcomes [35]. This is because social networks based on interpersonal communication generate embedded resources, such as social capital and trust relations [13,36]. These networks further facilitate innovation pathways at the organizational, sectoral, and national levels, at least in the private sector, and recent studies have started seeing similar trends in the public sector [37]. For example, [38] studied empirically the impact of collaboration on the innovation performance of 137 Chinese manufacturing SMEs, concluding that inter-firm cooperation has the most significant positive impact on the innovation performance of SMEs. In another study, [18] reports that public innovation performance is driven by inter-organizational learning.
Recent studies have also shown that organizational leadership is positively associated with the innovation performance of public sector organizations. One study found a positive relationship between organizational leadership and employee motivation for creativity and innovation [29]. Another study found that institutional leadership styles that support employees to initiate and implement innovative ideas has a stronger effect on public innovation performance [13].
Inspired by theories on dynamic capabilities, [39,40] define public sector innovation capacity as the ability of public sector managers and other key stakeholders within the organizations to make continuous changes in resource distribution towards new thinking. The possession of such an ability helps to develop and realize new ideas for solving societal problems [41] through the delivery of efficient services [23].
Many studies have argued that innovation capabilities, in particular, influence the innovation process [26]. According to [42], the ability of public service organizations to deliver efficient services depends on the contributions of service users and the larger local community of stakeholders. The authors of [18] corroborate this finding, as they found that stakeholder engagement enhances the innovation capabilities of public sector organizations. These stakeholder engagements place conformity responsibilities on organizations. In another study, [13,29] found that public innovation capacity is strongly associated with the leadership style of the organization.

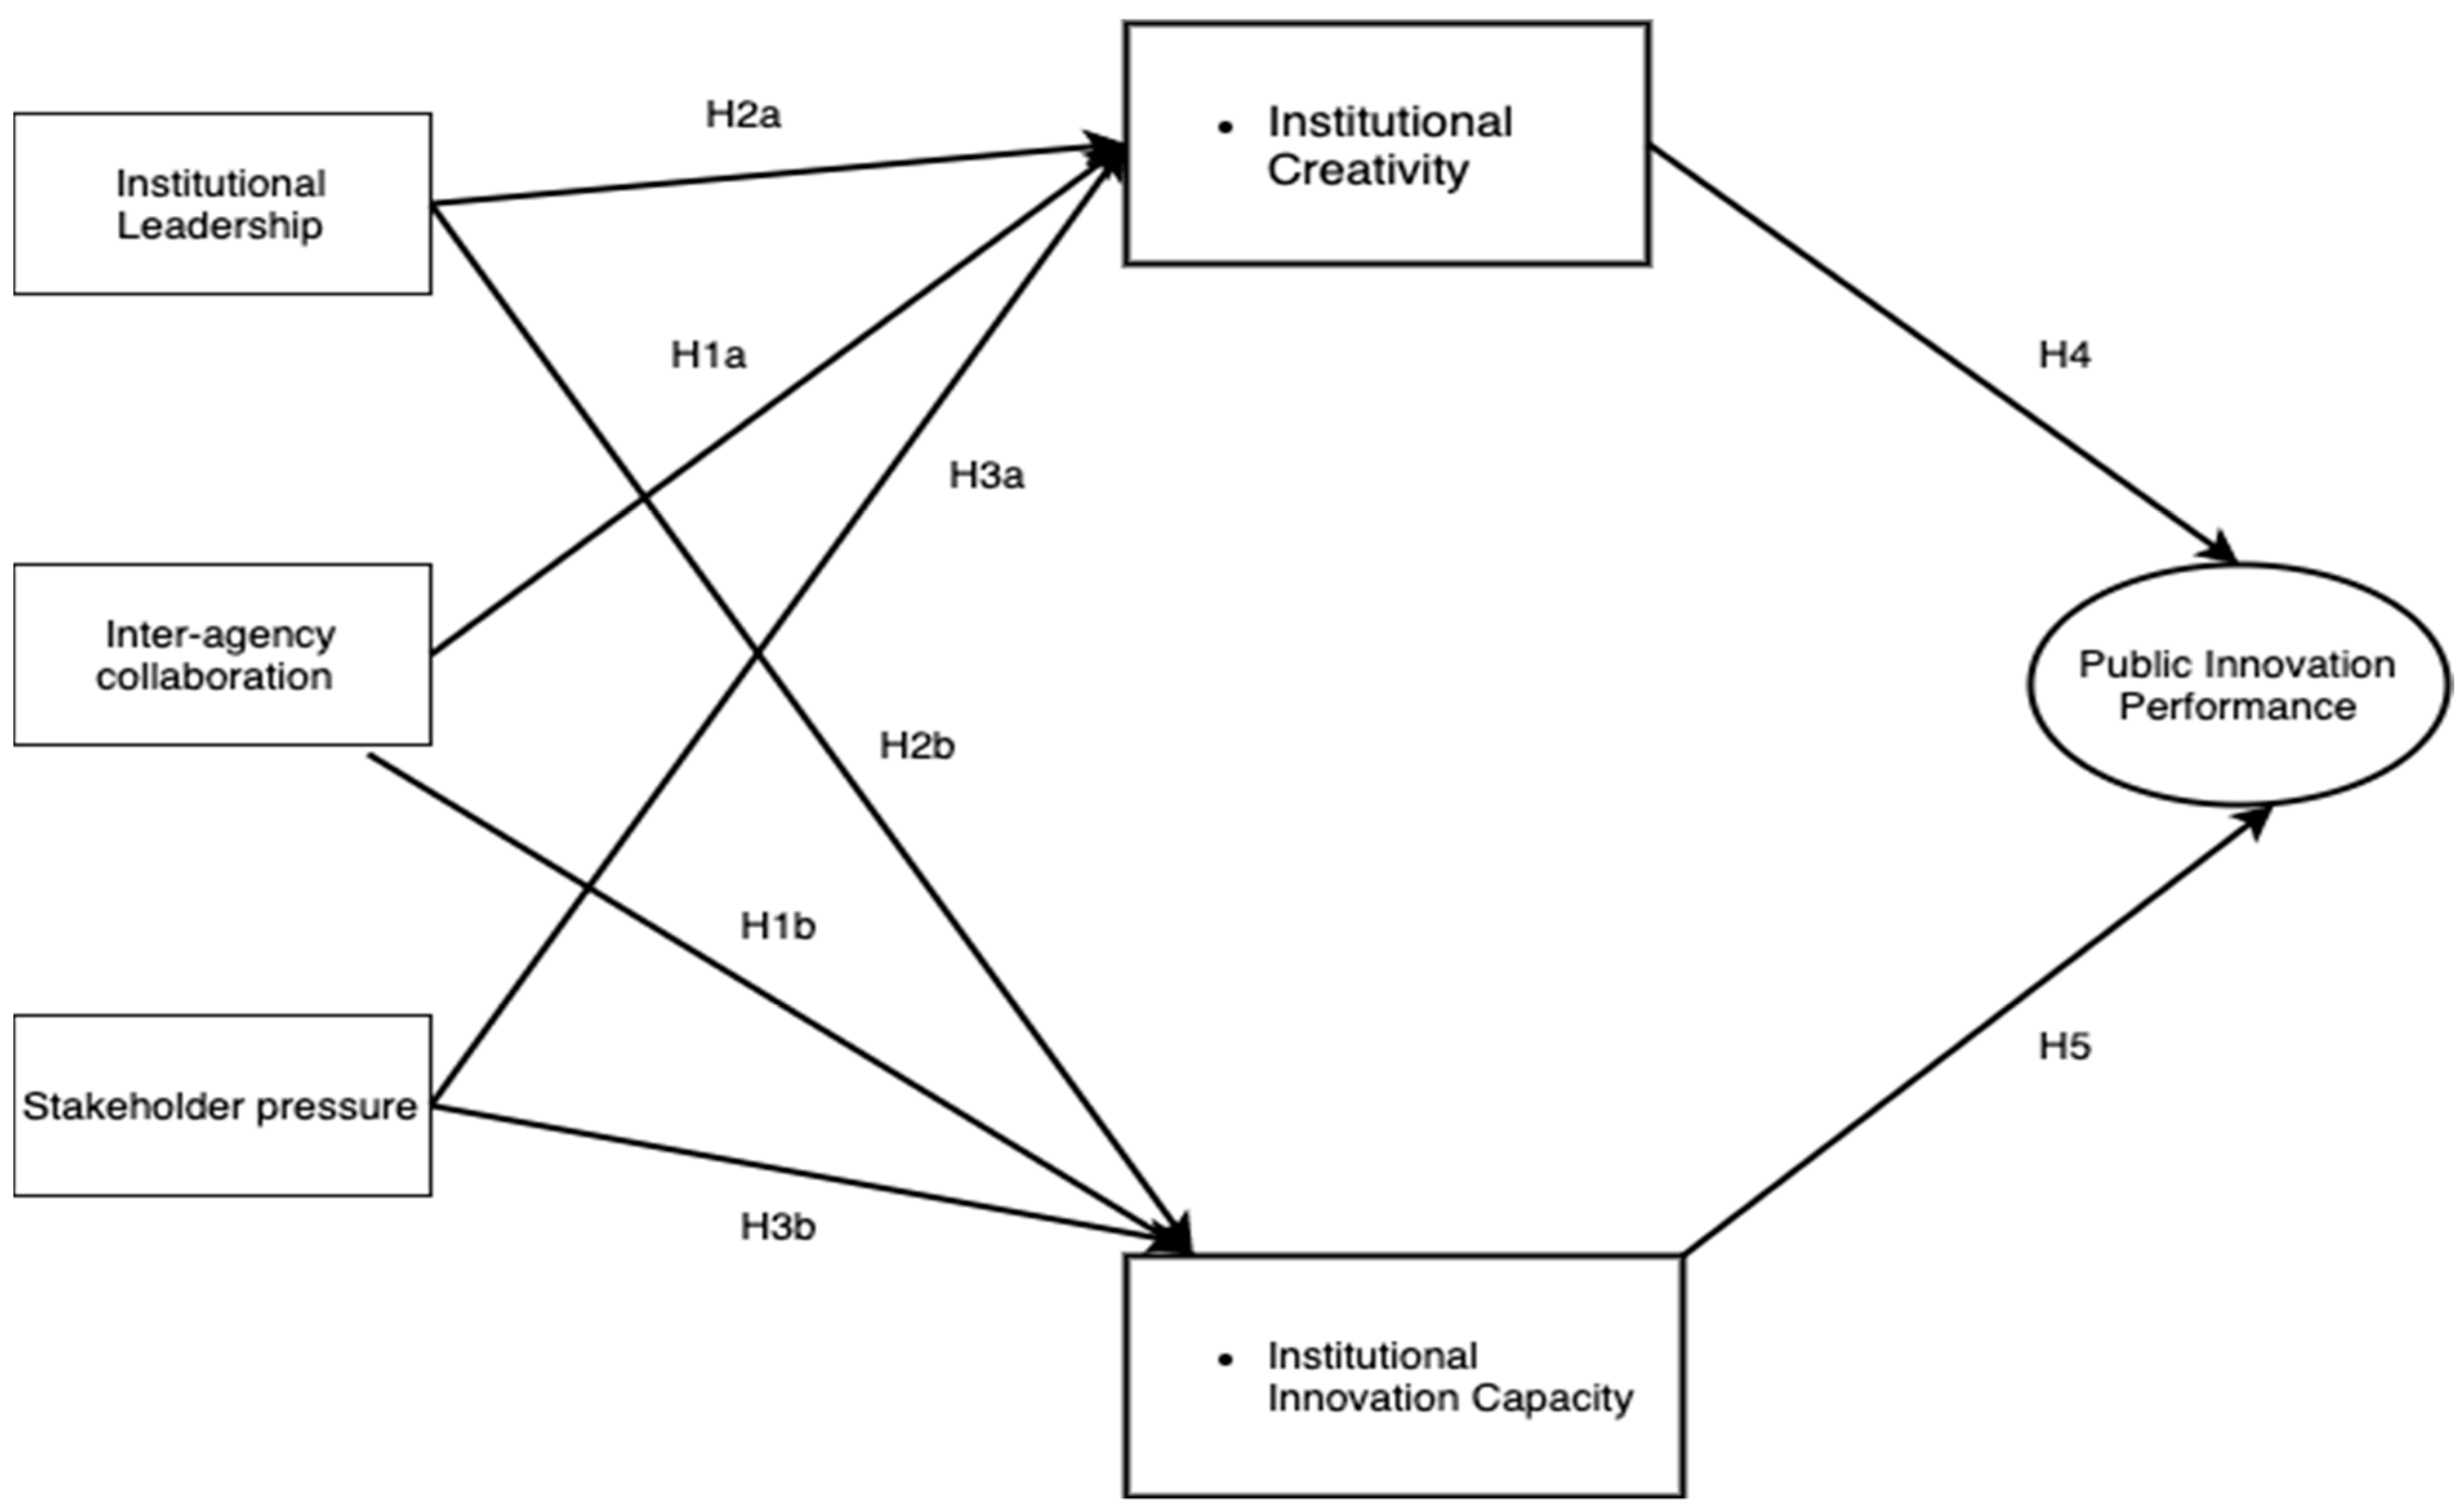
2.2. Theoretical Framework and Hypotheses Development

In this section, we discuss the theories underlining the study and develop our hypotheses. This study proposes a conceptual framework based on the discussions grounded in the theories and hypotheses represented in Figure 1.

2.2.1. Inter-Agency Collaboration, Institutional Creativity and Public Innovation Capacity

According to network social capital theory, social relationships are resources that can help people develop and accumulate human capital. The theory posits that the process of innovation is not based on contextual factors alone, but also on accrued resources that arise from interpersonal interactions and inter-firm exchanges [18]. From a network social capital perspective, inter-agency collaborations provide the platform and synergy necessary for enriching the creativity of individuals and firms alike. Additionally, network social capital in organizational networks provides slack resources and an impetus for creative cooperation among employees across diverse institutions [43]. Given that, especially in public institutions, innovation occurs when knowledge is shared, employees are offered incentives to innovate [44]. Institutional creativity is also seen not as a one-off activity, but a constant flow of exchanges among people working in an organization [45]. For instance, [43] found that social capital has a positive effect on institutional creativity and efficiency. In this study, actor embeddedness and inter-firm networks facilitate the sustainability of relational trust, which is crucial to the exchange of the tacit and explicit knowledge necessary for transforming the innovation processes and competences of institutions.
Furthermore, research affirms that inter-agency collaboration enhances the innovation capacity of public institutions. Typically, effective service delivery systems are enriched through continuous interaction with actors. Prior studies show that the collective efforts of individuals guarantee the proper and relevant structures for the implementation of novel ideas to improve the efficiency and performance of public institutions [42,46]. Again, recent studies on innovation in public organizations have found that inter-agency collaboration has a positive effect on innovative work behavior [35] and complex innovation [47]. Following this, we argue that inter-agency collaboration positively impacts institutional creativity and public institutions’ innovation capacity. Based on the above, we hypothesize that:
Hypothesis 1a (H1a).
Inter-agency collaboration has a positive impact on the creativity of institutions;
Hypothesis 1b (H1b).
Inter-agency collaboration has a positive impact on the innovation capacity of institutions.

2.2.2. Institutional Leadership, Institutional Creativity and Public Innovation Capacity

Theoretical explanations of how and why certain people become leaders are known as leadership theories. They concentrate on the qualities and behaviors that people can develop to improve their leadership abilities. Strong ethics and high moral standards, great self-organizational skills, and the ability to learn efficiently, nurture employee growth, and foster connection and belonging are some of the top traits that leaders say are essential to good leadership [48,49].
The leadership style of leaders shapes the behavior and the structure of the organization towards attaining formulated organizational goals and objectives [29,50]. For instance, [51] affirmed that the transformational leadership style led to an improvement in the creativity of employees in specific organizations Through cognitive empowerment and cordial workplace relationships between employees and leaders, the creativity of institutions is said to be positively impacted [50]. Moreover, the leadership style of an organization has an impact on the culture and the learning structure of the organization, which has a direct impact on such an institution’s innovation capacity [52,53]. Based on these propositions, this study hypothesizes that:
Hypothesis 2a (H2a).
The institutional leadership of public institutions has a positive impact on the creativity of institutions;
Hypothesis 2b (H2b).
The institutional leadership of public institutions has a positive impact on the innovation capacity of institutions.

2.2.3. Stakeholder Pressures, Institutional Creativity and Public Innovation Capacity

Institutional theory focuses on how individuals, groups, and organizations are enhanced by adhering to regulations coming from administrative systems, bodies, courts and many other socio-cultural norms that impose conformance demands and standards [54]. Institutional theory emphasizes the importance of the institutional environment in the pursuit of legitimacy in the eyes of key societal stakeholders [55]. According to [56], formal and informal pressure from regulatory agencies, customers, and other key stakeholders can make organizations deploy resources to improve performance. For instance, a recent study found that regulatory pressure has positive effects on the firm’s environmental innovation [57]. Thus, constant pressure from such key stakeholders contribute to employees or organizations adopting new modes of thinking and interpreting the consequences of service delivery on its environment [58]. Institutional creativity, by far, is shaped by demands and criticism, especially from external stakeholders [59,60,61]. Upon the above discussions, the study conceptualizes that demand and pressure from stakeholders have a positive impact on institutional creativity and innovation capacity. Hence, this study hypotheses that:
Hypothesis 3a (H3a).
Demand and pressure from stakeholders have a positive impact on the creativity of institutions;
Hypothesis 3b (H3b).
Demand and pressure from stakeholders have a positive impact on the innovation capacity of institutions.

2.2.4. Institutional Creativity, Public Innovation Capacity and Public Innovation Performance

According to the resource-based view, organizations draw their competitive advantages from the resources available to them. The theory is used, in most cases, to evaluate the internal strengths and weaknesses of firms [62]. These resources must be valuable and rare, inimitable, immobile [39], or heterogeneous [63]. Firms with such resources can produce more cheaply and/or better satisfy customer desires [64]. Knowledge, skills, reputation, and entrepreneurial orientation traits, such as proactiveness, innovation, and risk-taking ability, are examples of intangible organizational resources. Tangible resources include capital, access to capital, location, buildings, warehouses, and other facilities [65].
Organizational creativity is an intangible organizational resource documented to generate innovation among audio-visual SMEs in Brazil [66]. Again, the collective creativity of employees was found to have a direct influence on the innovation performance of firms, especially under high levels of climate for innovation [67]. Entrepreneurial creativity, or the personal capacity of employees, directly affects the level of innovation outputs [68]. Furthermore, perspectives from capabilities theory have argued that certain processes, conditions, and structures, referred to as innovation capabilities, also support innovation. Organizational vision, strategy, creativity, intelligence, idea management, structures, systems and climate, and the management of technology help to achieve high innovation performance [69]. Following this, we argue that institutional creativity and institutional innovation capacity would have a positive impact on public innovation performance. Based on this theory, hypotheses 4 and 5 are proposed:
Hypothesis 4 (H4).
Institutional creativity has a positive impact on public innovation performance;
Hypothesis 5 (H5).
The innovation capacity of public enterprises has a positive impact on public innovation performance.

3. Research Methodology

3.1. Method and Data

To address the hypotheses developed for the study, the study adopted a methodological survey to acquire and collect data from key informants in the public sector of Ghana. The study targeted the public sector because of its significant contributions to economic development and growth. In addition, the public sector reform agenda has transformed the operational activities and processes of public sector enterprises. This transformation agenda has resulted in the continuous digitization of public sector service delivery processes [70], and public sector innovation is at the core of agile service design and delivery.
Again, the choice of the survey approach to data collection is consistent with studies in the management and organization studies literature [71,72]. In addition, there is no readily available secondary data on public sector innovation, especially in developing economies such as Ghana’s. To augment the robustness of the methodology and to mitigate issues of common method bias associated with the survey data, diverse techniques were employed.

3.2. Measurement Instrument Development

The measurements in our questionnaire were all adopted from related literature. However, to elucidate precise and accurate insights from the questionnaires, we adhered to specific preparations and processes in the design, testing, and administering of them. In this study, the questionnaire was designed based on recommendations outlined by [73,74]. We performed Harman’s single-factor test to ascertain the extent of common method bias and reduce it [75]. Other controls, such as the arrangement of the questionnaire items, the asking of clear questions, and the use of better scale items [76], were employed to make it difficult for respondents to predict the outcome of the survey. Again, to further deal with this bias, measurement items of independent and dependent variables were arranged in different parts of the questionnaire [77].
In addition, the reliability and validity of the questionnaire were tested through a series of pilot tests and expert reviews. The pre-test helped revise the questions that produced the final survey instrument. Based on this, we were able to improve the instrument’s validity and reliability, and earlier results showed that Cronbach’s alpha scores were adequate. The utilized questionnaire contained mainly statements to which respondents expressed their level of agreement/disagreement. All the measurement items on the questionnaire were measured on a 7-point Likert scale.

3.3. Sample and Procedure

To obtain the minimum sample size used in the study, an a priori power analysis was performed. This was meant to ascertain the probability for avoiding a type II error—in other words, identifying an effect when it exists [78]. The G*Power Analysis software, version 3.1.9 [79], was used to determine the sample of the study. The following assumptions were set to obtain the minimum sample size that can possibly be used for the study: a significance level of 0.05 (two-tailed), a power of 0.95 (the threshold for social sciences), a minimum effect (f2) of 0.5, and two predictors. From the results, the required sample size is 236; our sample size is 315 respondents. The study population was made up of top public sector workers—these individuals work in diverse public sector agencies and institutions that are part of the digital transformation program of Ghana’s public institutions. The operations and business models of these entities are being transformed digitally to streamline service delivery and customer satisfaction.
Initial samples were drawn from a list of public sector organizations obtained from the Ghana Public Sector Commission and Public Sector Reform Agency. The list contains institutions that are currently undergoing some form of technological or digital transformation processes. These include the usage of in-house innovation processes or third-party services. The Human Resource Officers/Managers of each institution were contacted first to obtain authorization to conduct the research survey. Corporate Affairs Managers were also contacted in certain organizations when we could not make contact with the Human Resource Officials in those organizations. This is owing to the diverse organizational structure of public organizations.
Upon gaining authorization, a purposive sampling approach was used to identify and collect data from Chief Executive Officers, Managing Directors, Heads of the Information Technology Department, and Digital Managers in selected public institutions at the organizational level. These individuals were considered knowledgeable, with sufficient knowledge about the innovation processes and activities of their organizations. Although all public enterprises were the target of the study’s population, the samples utilized in the final analysis were limited mostly to the urban centers. This is because most government agencies and institutions in Ghana have their headquarters located in the major urban cities such as Accra and Kumasi. In total, 315 respondents were selected from over fifty (50) government agencies and institutions. The questionnaire was administered to these individuals between 11 March and 28 April 2021. The survey tool was administered in person, with the help of volunteers from each organization in most cases. After data collection was over, a response rate of 62 percent was achieved, translating into 195 answered questionnaires. Respondents mostly blamed the change in the work environment and other COVID-19-related restrictions as the reasons for their inability to respond to the questions in the survey tool.

3.4. Measures

3.4.1. Independent Variables

Inter-Agency Collaboration: This is measured as the extent to which public institutions cooperate and collaborate with external stakeholders to develop new and improved knowledge, processes, and value-addition to products and services. Measurement items were drawn from literature on innovation management and organizational studies—specifically, from [43,80,81].
Stakeholder Pressures: This is measured in terms of the continuous demand by civil society and relevant stakeholders on public enterprises for more equitable and transparent service delivery, and in terms of how this has ushered organizations into a new phase of innovation. Measurement items were adopted from [57,82,83].
Institutional Leadership: Institutional leadership is defined as the ability of an individual to support the employee and individuals around him/her to achieve the stipulated goals of an organization. Measurement items were drawn from organizational leadership literature. Specifically, items were adopted, and in some cases adapted, from [51,84,85] to ensure sufficient variability in the questionnaire.
Institutional Creativity: This is considered the ability to observe and acquire knowledge, and interpret and utilize that knowledge it in a new model. Measurement items for this variable were adopted from organizational creativity literature—specifically, from studies such as [86,87].
Institutional Innovation Capacity: This includes the organizational culture, structure, and an enabling environment that support the implementation of creative ideas. Measurement items were adopted from organization and innovation management literature, specifically from [88,89].

3.4.2. Dependent Variable

Public Sector Innovation Performance: This defines the rate at which institutions can translate innovative ideas into value-added services and, in some cases, products. Public sector innovation is most centered on service innovation. Measurement items were synthesized from studies conducted by [12,90,91].

4. Analysis and Results

Data analysis was done using partial least squares structural equation modelling (SEM) with SmartPLS 3 (https://www.smartpls.com/, accessed on 15 August 2021). PLS-SEM was chosen because it has the ability to examine the relationship between several variables simultaneously. Our model examines six variables.

4.1. Profile of Respondents

The study utilized data, acquired at the organizational level, from 195 responses from individuals working in public sector institutions and agencies in Ghana. These individuals were selected from diverse government agencies and institutions. They were carefully selected to sufficiently represent the requirement of the survey instrument based on the fact that they have sufficient knowledge and have participated in high-level meetings aimed at achieving high degrees of innovation and digitalization in the public sector. In addition, these respondents have spent a considerable number of years on the job, therefore making them appropriate informants with sufficient knowledge about the innovative culture and structure of their organization. Table 1 presents a summary of the profile of the respondents.
The characteristics and distribution of data points are presented in Table 2. Data characteristics include standard deviations, means, kurtosis, and skewness. Outliers were not reported in this study. In addition, minimum and maximum points of variables are highlighted.

4.2. Construct Reliability and Validity

The data was checked for construct reliability and validity. Two measures of construct reliability were applied: construct indicator reliability and construct internal consistency reliability. Construct indicator reliability is a measure of the extent to which an indicator’s variance is explained by its construct. Item loadings above 0.708 are recommended. Item loadings between 0.40 and 0.708 should be removed if removing them will increase construct internal consistency reliability or convergent validity above their threshold values [92]. Removing items that do not meet the indicator reliability threshold value of 0.708 does not increase the construct internal consistency reliability or convergent validity above their threshold values. Thus, we kept all items as presented in Table 3.
Construct reliability assesses the level of internal consistency of the measures used [93]. Jöreskog’s composite reliability rho and Cronbach’s coefficient alpha were used as the metrics [94,95]. Both metrics assume 0.70 and above as the reliability threshold [92]. The authors of [96,97] suggested a third measure: reliability coefficient rho_A. This lies between the Cronbach’s alpha and the composite reliability. The data meet this criterion since all constructs have 0.70 or above for the Cronbach’s alpha and reliability coefficient rho_A, but below the composite reliability values to the left [92].
Construct validity measures how well a measurement represents and logically connects the observed phenomenon to the construct via the fundamental theory [98]. It is assessed via convergent validity and discriminant validity [99]. Convergent validity is the extent to which the construct converges to explain the variance of its indicators [92]. Convergent validity of the constructs was established as the average variance extracted (AVE) for every construct was above the 0.50 minimum acceptable threshold, meaning the constructs explain more than 50% of their indicator’s variance [100], as shown in Table 4.
Discriminant validity is assessed through the Fornell–Larcker and the Heterotrait–Monotrait Ratio (HTMT) and cross-loadings [98,101]. The Heterotrait–Monotrait Ratio (HTMT) is often used when both the cross-loadings and the Fornell–Larcker criteria fail [101]. Discriminant validity is established based on two threshold values: when the HTMT value is less than 0.90 [100] or less than 0.85 [102]. From Table 4, the maximum HTMT value is 0.867. Hence, discriminant validity is established.
We assessed collinearity among latent variables using the VIF values in Table 3. All our values are below 5, indicating collinearity was not a problem. Collinearity issues are typically uncritical if VIF = 3–5 [92].

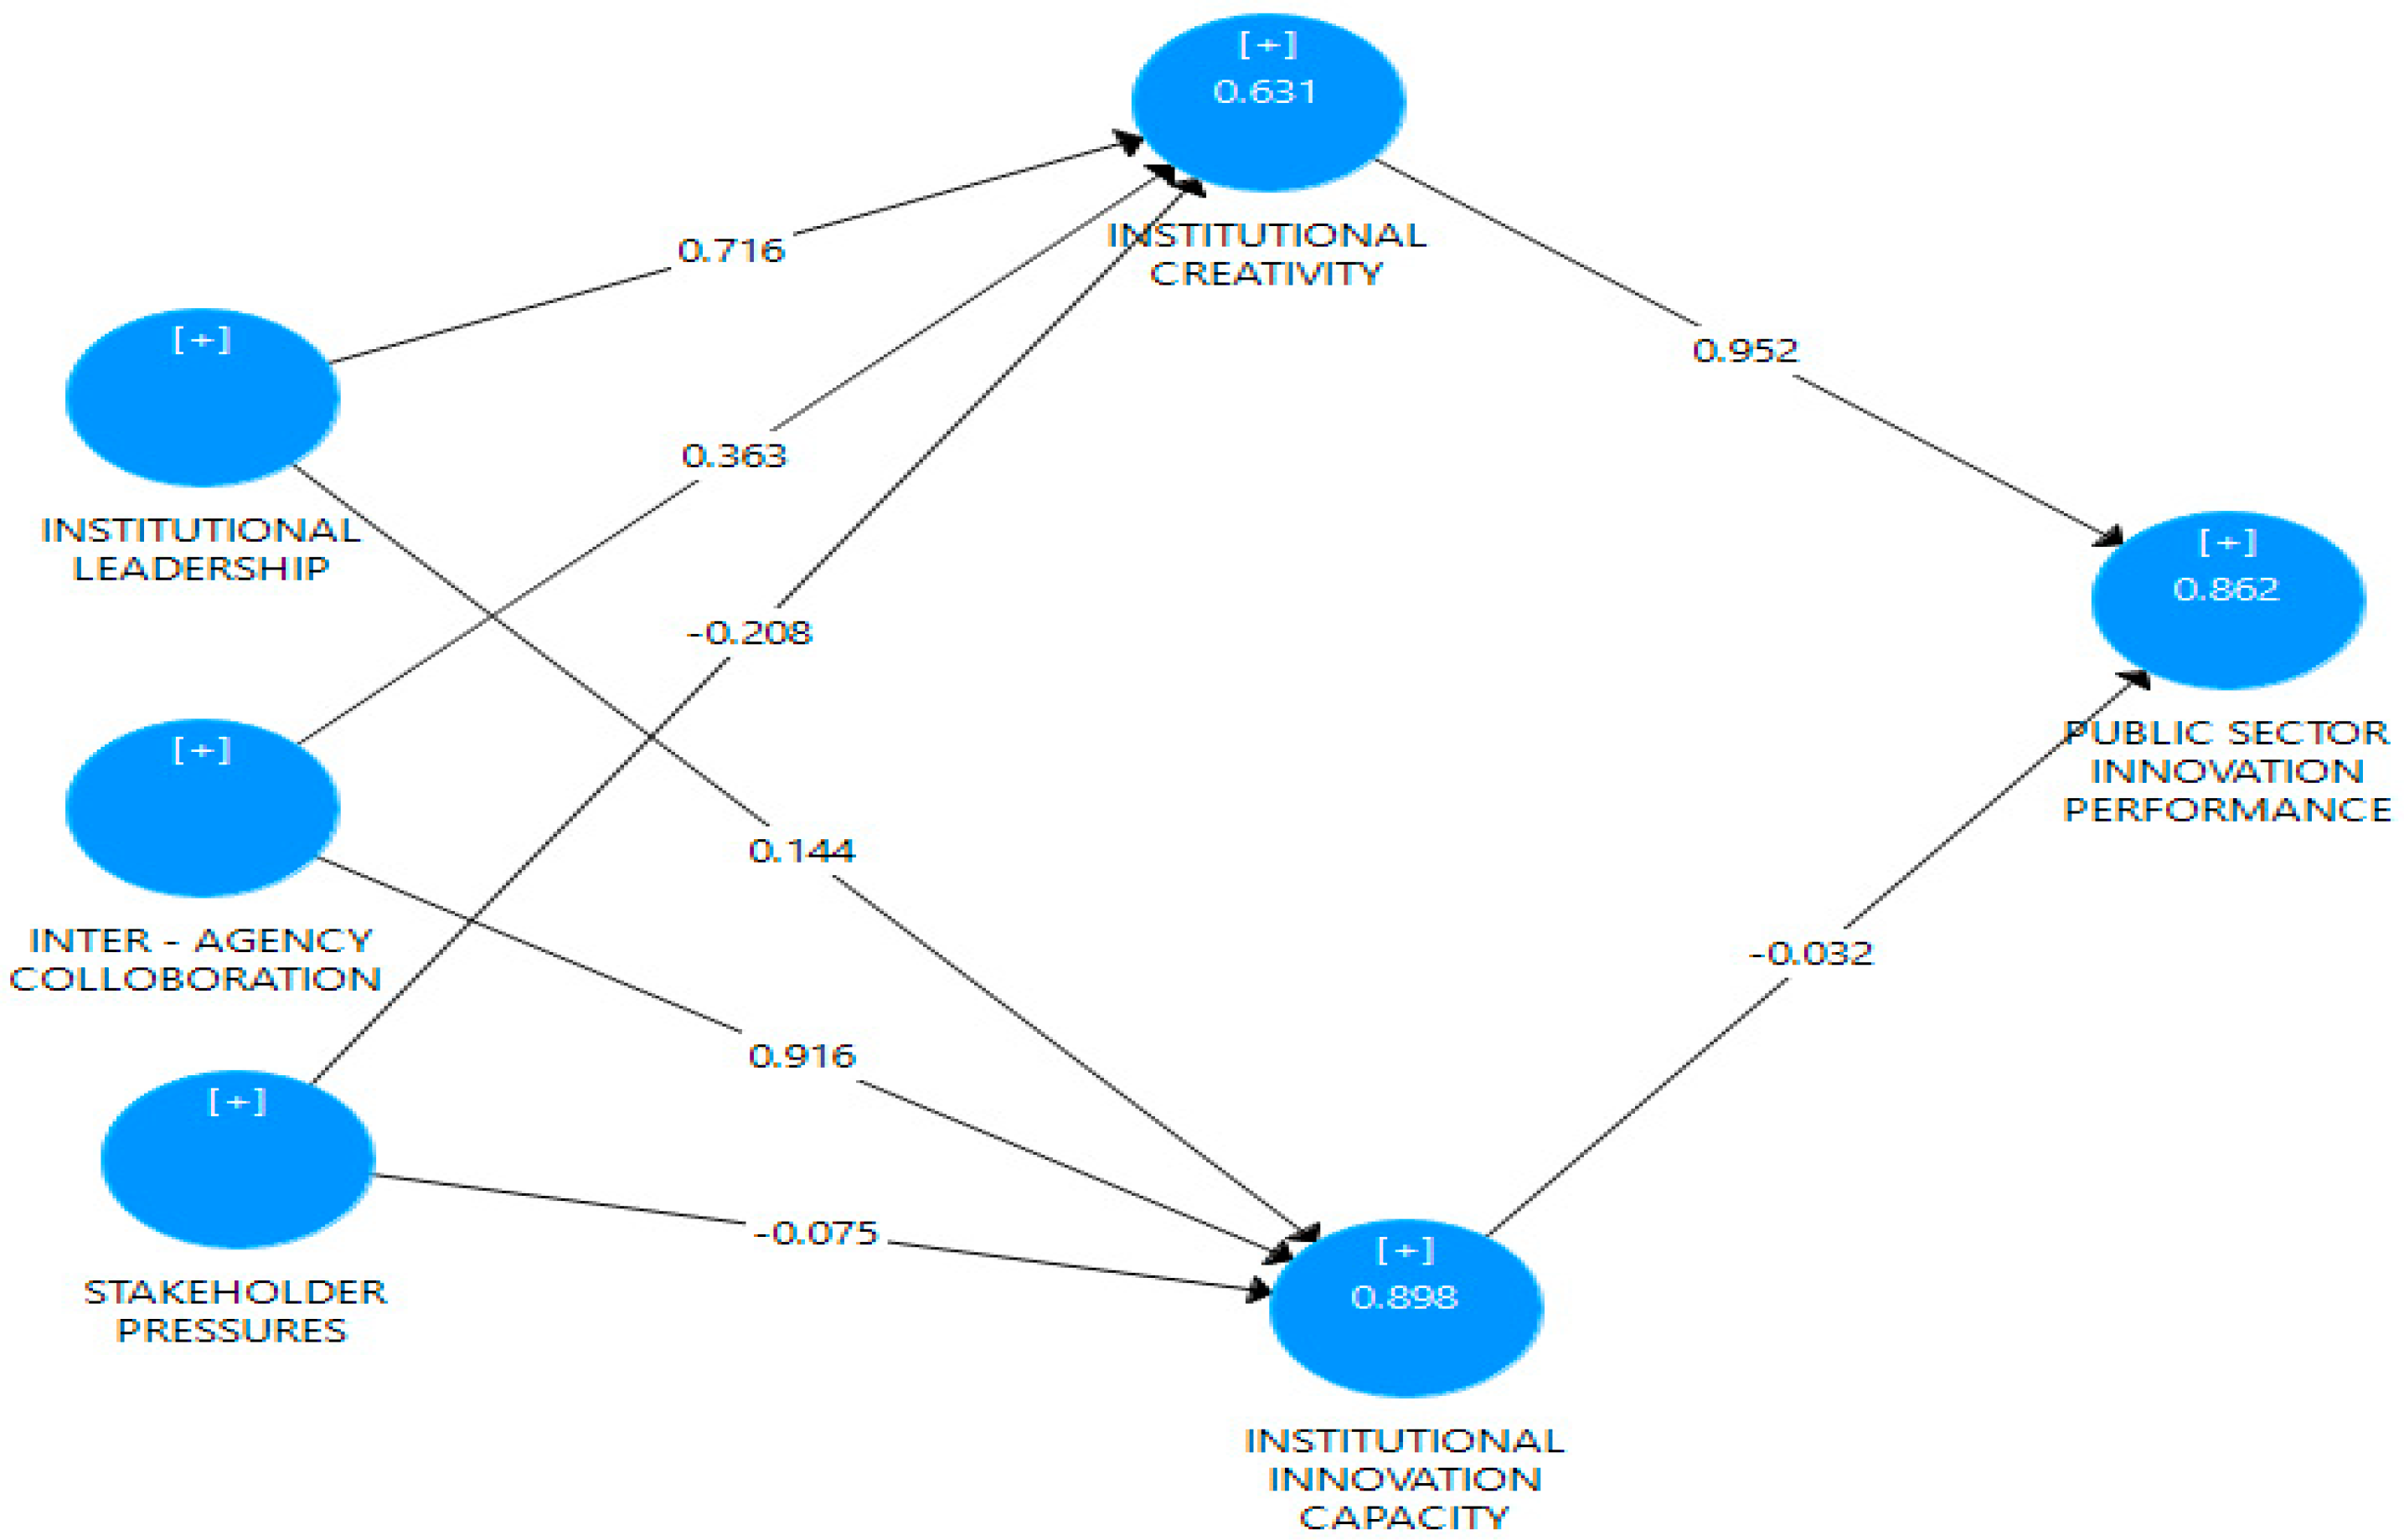
4.3. Structural Model Assessment

The structural model was examined using the path coefficients, t-statistics, and p-values for significance, as recommended by [92,100] with evidence from [103]. From Figure 2, inter-agency collaboration has a positive impact on institutional creativity (0.363) and institutional innovation capacity (0.916). Institutional leadership has a positive impact on institutional creativity (0.716) and institutional innovation capacity (0.144). However, stakeholder pressure is seen to negatively impact both institutional creativity (−0.208) and innovation capacity (−0.075). In addition, institutional creativity has a positive impact on public innovation performance (0.952), while innovation capacity impacts public innovation performance negatively (−0.032).
Since PLS-SEM aims to maximize the explained variance of the endogenous variables by the exogenous variables [100,104], we assessed the explained variance of the three endogenous variables using their R2 values. Institutional creativity and institutional innovation capacity have 0.6310 and 0.898 R2 values, respectively. This means, together, inter-agency collaboration, institutional leadership, and stakeholder pressure contributed and predicted about 63% and 90% of institutional creativity and innovation capacity, respectively. Furthermore, public innovation performance obtained an R2 of 0.862, indicating 86.2%. This means, together, institutional creativity and innovation capacity contributed and predicted about 86.2%. Our model seems to have high R2 values because innovation processes are highly predictable [105,106], and when measuring highly predictable concepts, R2 values can go up to 0.90, which is acceptable [104].
The study outlined eight (8) hypotheses for investigation. The hypotheses were to examine the effects of inter-agency collaboration, institutional leadership, and stakeholder pressure on institutional creativity and innovation capabilities, and the effect of institutional creativity and innovation capacity on the innovation performance of public sector enterprises. Assuming a significant level of p < 0.05 and a t-statistic value above 1.96 [92,107], hypotheses H1a, H1b, H2a, H2b, and H4 are accepted. H3a, H3b, and H5 are rejected, as shown in Table 5.

5. Discussion

Key Findings

The study revealed that both institutional creativity and innovation capacity contribute to public innovation performance, though institutional innovation capacity contributes negatively to public innovation performance. The positive impact of institutional creativity on public innovation performance is consistent with the findings in [67]. Institutional ability to acquire, interpret, and use knowledge is vital for its innovation performance. Improving the innovation performance of a firm contributes directly to improving other aspects of organizational performance [103,108,109]. Based on this, [103] concluded that improving innovation performance should be considered as a strategy for improving operation performance, such as production performance, market performance, and financial performance. The authors of [108] concluded that financial performance is a product of innovation performance. In addition, this study contributes to studies that investigate the effect of organizational creativity on firm performance by offering an insight into how these factors shape the innovation paradigm of public innovation. This outcome is critical due to its distinction, compared to private enterprises. However, the negative impact of institutional innovation capacity is found to be inconsistent with the findings of the study by [26]. Mitigating this negative effect requires the continuous reallocation of resources towards new thinking [39,40].
Furthermore, the study conceptualized that inter-agency collaboration, institutional leadership, and stakeholder pressure have a positive impact on institutional creativity and innovation capacity. Hypotheses H1a, H1b, H2a, H2b, H3a, and H3b represent these relationships. Hypotheses H1a, H1b, H2a, and H2b are supported by the findings of the study. Hypotheses H3a and H3b are not supported by the findings of the study. H1a showed a positive and a significant relationship between inter-agency collaboration and institutional creativity. This result supports findings in a study, conducted by [18], on the relationship between inter-organizational learning and innovation adoption and adaptation. The result further confirms the findings obtained by [35], which reveal the significance of inter-firm alliances and the performance of public sector organizations. Highlights from the study’s findings re-echo the importance of alliance to knowledge acquisition and utilization in the innovation process, indicating that public institutions in a developing economy such as Ghana’s should be encouraged to form alliances with relevant external stakeholders in order to share knowledge and insights to boost institutional creativity and innovation capabilities [110,111]. However, [112] for the effective functioning of networks, they must be built on trust.
The positive relationship between inter-agency collaboration and innovation capacity, indicated by H1b, implies that although innovation capacity did not have a significant impact on public innovation performance in this study, as claimed in other studies, it is improved through engagement with collaborative partners such as universities [113]. The knowledge-oriented nature of innovation alliances or inter-firm alliances enables institutions with limited resources and human capital to build special skills using slack resources available in networks [18,114,115]. The findings of the study augment studies such as [116], which emphasize the positive influence of inter-firm alliances/cooperation on firm performance. The impact of innovative networks in institutions is facilitated by the availability of social capital, the network effect, and the learning that firms enjoy. Innovative networks are, therefore, crucial to the innovation performance of institutions.
H2a showed a positive and significant relationship between institutional leadership and institutional creativity, and H2b showed a positive and significant relationship between institutional leadership and innovation capacity. This confirms the vital role played by public sector leaders in enhancing the creative potentials of their organizations via the enhancement of individual creativity [13,117]. Leaders in public organizations are known to motivate employees to achieve organizational objectives and inspire employees to be more innovative [29]. This provides support for organizational innovativeness.
Finally, though it has been documented that stakeholder demand or pressure in both the public [26,31] and private sectors [58] contribute to change and innovation, our findings revealed otherwise. H3a showed a negative relationship between stakeholder pressure and institutional creativity, and H3b showed a negative relationship between stakeholder pressure and innovation capacity. We attribute this to the fact that public sector employees sometimes consider pressure from politicians as inappropriate based on their own experiences, and therefore, it does not result in creativity and innovation [47].

6. Implications for Practice and Theory

For practice, the study proposes that public sector institutions develop institutional environments that support creativity and improve innovation performance. The appointment of public sector managers should be based on the creativeness and resourcefulness of potential managers, and not on political considerations [118] or nepotism, as often happens in developing countries such as Ghana [119]. Public institutions should encourage leadership styles that facilitate the motivation of employees and risk-taking to improve innovation performance. Again, public institutions in Ghana need to focus on providing room for experimentation, capital, vision, strong organizational structures, and systems, culture, and climates that support innovation. Moreover, where public sector organizations lack requisite resources, they can engage in collaborative efforts with relevant stakeholders to gain information and technology for solving problems and developing new ideas.
On the negative relationship between stakeholder pressures, institutional creativity, and institutional innovation capabilities, we suggest that stakeholder pressures should not be disregarded by public managers, as they have been documented to significantly influence innovation performance in private-sector organizations.
Theoretically, the study contributes to empirical studies on public innovation called for by [1,12]. The findings also add to empirical studies on the relationship between the antecedents of public innovation performance from a developing country context. Our model could inspire new insights for research on innovation performance from both a developing country and a public sector perspective.

7. Limitations and Future Research

While this study produces some intriguing findings, some shortcomings limit the generalizability of the findings. Among these is the study’s inability to provide evidence for any real causal effects of antecedents on innovation performance, based on the fact that the data collected was self-reported and represents the normative opinions of the respondents regarding their personal experiences in the organizations they work for. The data are also cross-sectional in nature. A longitudinal approach is therefore required to examine how stakeholder pressure, for instance, could evolve to influence the internal innovation activities of public enterprises. Again, we cannot vouch for the generalizability of our findings since the study is limited to public sector organizations in Ghana. Future studies should endeavor to add more developing countries and compare results with studies from developed countries as a result of the increasing demand for cross-country research.

8. Conclusions

This study examined the effect of institutional creativity and institutional innovation capacity on public innovation performance in the Ghanaian public sector. However, it also conceptualized that institutional creativity and institutional innovation capacity are enabled by inter-agency collaborations, institutional leadership styles, and stakeholder pressure. Based on this, we conclude that public innovation performance is driven positively by institutional creativity, while institutional innovation capacity negatively impacts public innovation performance. Stakeholder pressure negatively impacts both institutional creativity and innovation capacity. However, an institutional leadership style that encourages innovation and creativity in public agencies positively impacts creativity and builds the innovation capacities of these agencies. Managers should invest more resources into activities that improve public innovation performance, since innovation performance acts as the fulcrum around which other organizational performance indicators, such as financial performance and service performance, revolve.

Author Contributions

Writing-original draft preparation, conceptualization, methodology, funding acquisition, J.C.A.; Conceptualization, supervision, funding acquisition, Z.T.; Writing-original draft preparation, conceptualization, data curation and analysis, A.O.; Writing-review and editing, S.B.E.; Writing-review and editing, E.B. All authors have read and agreed to the published version of the manuscript.

Funding

This research received no external funding.

Institutional Review Board Statement

Not applicable.

Informed Consent Statement

Not applicable.

Data Availability Statement

There are no linked research data sets for this submission. The following reason is given: It is a basic survey research and data will be made available on request.

Conflicts of Interest

The authors declare that they have no financial or personal relationships which may have inappropriately influenced them in writing this article.

References

  1. Awosika, F.O. Transforming public service performance in West Africa through innovations: Experiences from Ghana and Nigeria. Afr. Public Serv. Deliv. Perform. Rev. 2014, 2, 72. [Google Scholar] [CrossRef]
  2. Osborne, S.P.; Brown, L. Innovation, public policy and public services delivery in the UK. The word that would be king? Public Adm. 2011, 89, 1335–1350. [Google Scholar] [CrossRef]
  3. Darroch, J. Knowledge management, innovation and firm performance. J. Knowl. Manag. 2005, 9, 101–115. [Google Scholar] [CrossRef]
  4. Gronum, S.; Verreynne, M.L.; Kastelle, T. The role of networks in small and medium-sized enterprise innovation and firm performance. J. Small Bus. Manag. 2012, 50, 257–282. [Google Scholar] [CrossRef]
  5. Bryson, J.M.; Ackermann, F.; Eden, C. Putting the resource-based view of strategy and distinctive competencies to work in public organizations. Public Adm. Rev. 2007, 67, 702–717. [Google Scholar] [CrossRef]
  6. Serrano Cárdenas, L.F.; Vásquez González, Y.L.; Díaz-Piraquive, F.N.; Guillot Landecker, J.E. Public innovation: Concept and future research agenda. Commun. Comput. Inf. Sci. 2019, 165–177. [Google Scholar] [CrossRef]
  7. Walker, R.M. Internal and external antecedents of process innovation: A review and extension. Public Manag. Rev. 2014, 16, 21–44. [Google Scholar] [CrossRef]
  8. Uyarra, E.; Flanagan, K. Understanding the innovation impacts of public procurement. Eur. Plan. Stud. 2010, 18, 123–143. [Google Scholar] [CrossRef]
  9. Bozeman, B. Hard Lessons from hard times: Reconsidering and reorienting the “managing decline” literature. Public Adm. Rev. 2010, 70, 557–563. [Google Scholar] [CrossRef]
  10. Rainey, H.G. Understanding and Managing Public Organizations; Jossey-Bass: San Francisco, CA, USA, 2014; ISBN 9781118583715. [Google Scholar]
  11. Choi, T.; Chandler, S.M. Exploration, exploitation, and public sector innovation: An organizational learning perspective for the public Sector. Hum. Serv. Organ. Manag. Leadersh. Gov. 2015, 39, 139–151. [Google Scholar] [CrossRef]
  12. De Vries, H.; Bekkers, V.; Tummers, L. Innovation in the public sector: A systematic review and future research agenda. Public Adm. 2016, 94, 146–166. [Google Scholar] [CrossRef] [Green Version]
  13. Lewis, J.M.; Ricard, L.M.; Klijn, E.H. How innovation drivers, networking and leadership shape public sector innovation capacity. Int. Rev. Adm. Sci. 2018, 84, 288–307. [Google Scholar] [CrossRef] [Green Version]
  14. Piening, E.P. Dynamic capabilities in public organizations. Public Manag. Rev. 2013, 15, 209–245. [Google Scholar] [CrossRef]
  15. Teece, D.J. Explicating dynamic capabilities: The nature and microfoundations of (sustainable) enterprise performance. Strateg. Manag. J. 2007, 28, 1319–1350. [Google Scholar] [CrossRef] [Green Version]
  16. Albury, D. Creating the conditions for radical public service innovation. Aust. J. Public Adm. 2011, 70, 227–235. [Google Scholar] [CrossRef]
  17. Walker, R.M. Innovation type and diffusion: An empirical analysis of local government. Public Adm. 2006, 84, 311–335. [Google Scholar] [CrossRef]
  18. Hartley, J.; Rashman, L. Innovation and inter-organizational learning in the context of public service reform. Int. Rev. Adm. Sci. 2018, 84, 231–248. [Google Scholar] [CrossRef]
  19. Zhao, S.; Jiang, Y.; Peng, X.; Hong, J. Knowledge sharing direction and innovation performance in organizations. Eur. J. Innov. Manag. 2020, 24. [Google Scholar] [CrossRef]
  20. Dul, J.; Ceylan, C. The impact of a creativity-supporting work environment on a firm’s product innovation performance. J. Prod. Innov. Manag. 2014, 31, 1254–1267. [Google Scholar] [CrossRef]
  21. Sözbilir, F. Innovation capacity and innovation performance in terms of educational level of managers. J. Bus. Res. Turk. 2018, 10, 1–12. [Google Scholar] [CrossRef]
  22. Bartlett, D.; Dibben, P. Public sector innovation and entrepreneurship: Case studies from local government. Local Gov. Stud. 2002, 28, 107–121. [Google Scholar] [CrossRef]
  23. Bekkers, V.; Edenlenbos, J.; Steijn, B. Linking innovation to the public sector: Contexts, concepts and challenges. In Innovation in the Public Sector; Bekkers, V., Edelenbos, J., Steijn, B., Eds.; IIAS Series: Governance and Public Management; Palgrave Macmillan: London, UK, 2011. [Google Scholar]
  24. Boyne, G.A. Public and private management: What’s the difference? J. Manag. Stud. 2002, 39, 97–122. [Google Scholar] [CrossRef]
  25. Brown, L. Balancing risk and innovation to improve social work practice. Br. J. Soc. Work 2010, 40, 1211–1228. [Google Scholar] [CrossRef]
  26. Clausen, T.H.; Demircioglu, M.A.; Alsos, G.A. Intensity of innovation in public sector organizations: The role of push and pull factors. Public Adm. 2019, 98, 159–176. [Google Scholar] [CrossRef] [Green Version]
  27. Moore, M.H. Break-through innovations and continuous improvement: Two different models of innovative processes in the public sector. Public Money Manag. 2005, 25, 43–50. [Google Scholar] [CrossRef]
  28. Damanpour, F.; Schneider, M. Characteristics of innovation and innovation adoption in public organizations: Assessing the role of managers. J. Public Adm. Res. Theory 2009, 19, 495–522. [Google Scholar] [CrossRef]
  29. Demircioglu, M.A.; Audretsch, D.B. Conditions for innovation in public sector organizations. Res. Policy 2017, 46, 1681–1691. [Google Scholar] [CrossRef]
  30. Schoeman, M.; Baxter, D.; Goffin, K.; Micheli, P. Commercialization partnerships as an enabler of UK public sector innovation: The perfect match? Public Money Manag. 2012, 32, 425–432. [Google Scholar] [CrossRef]
  31. Verhoest, K.; Verschuere, B.; Bouckaert, G. Pressure, legitimacy, and innovative behavior by public organizations. Governance 2007, 20, 469–497. [Google Scholar] [CrossRef]
  32. Maranto, R.; Wolf, P.J. Cops, teachers, and the art of the impossible: Explaining the lack of diffusion of innovations that make impossible jobs possible. Public Adm. Rev. 2013, 73, 230–240. [Google Scholar] [CrossRef]
  33. Bhatti, Y.; Olsen, A.L.; Pedersen, L.H. Administrative professionals and the diffusion of innovations: The case of citizen service centres. Public Adm. 2011, 89, 577–594. [Google Scholar] [CrossRef]
  34. Andersen, S.C.; Jakobsen, M.L. Political pressure, conformity pressure, and performance information as drivers of public sector innovation adoption. Int. Public Manag. J. 2018, 21, 213–242. [Google Scholar] [CrossRef]
  35. Demircioglu, M.A.; Hameduddin, T.; Knox, C. Innovative work behaviors and networking across government. Int. Rev. Adm. Sci. 2021, 1–20. [Google Scholar] [CrossRef]
  36. Gieske, H. Conceptualizing Public Innovative Capacity: A Framework for Assessment. Innov. J. 2016, 21, 1. [Google Scholar]
  37. Lewis, J.M.; Considine, M.; Alexander, D. Innovation inside government: The importance of networks. In Innovation in the Public Sector; Palgrave Macmillan: London, UK, 2011; pp. 107–133. [Google Scholar]
  38. Zeng, S.X.; Xie, X.M.; Tam, C.M. Relationship between cooperation networks and innovation performance of SMEs. Technovation 2010, 30, 181–194. [Google Scholar] [CrossRef]
  39. Eisenhardt, K.M.; Martin, J.A. Dynamic capabilities: What are they? Strateg. Manag. J. 2000, 21, 1105–1121. [Google Scholar] [CrossRef]
  40. Pablo, A.L.; Reay, T.; Dewald, J.R.; Casebeer, A.L. Identifying, enabling and managing dynamic capabilities in the public sector. J. Manag. Stud. 2007, 44, 687–708. [Google Scholar] [CrossRef]
  41. Meijer, A. Public innovation capacity: Developing and testing a self-assessment survey instrument. Int. J. Public Adm. 2019, 42, 617–627. [Google Scholar] [CrossRef]
  42. Osborne, S.P.; Radnor, Z.; Strokosch, K. Co-production and the co-creation of value in public services: A suitable case for treatment? Public Manag. Rev. 2016, 18, 639–653. [Google Scholar] [CrossRef] [Green Version]
  43. Sözbilir, F. The interaction between social capital, creativity and efficiency in organizations. Think. Ski. Creat. 2018, 27, 92–100. [Google Scholar] [CrossRef]
  44. Koppenjan, J.; Veeneman, W.; van der Voort, H.; ten Heuvelhof, E.; Leijten, M. Competing management approaches in large engineering projects: The Dutch RandstadRail project. Int. J. Proj. Manag. 2011, 29, 740–750. [Google Scholar] [CrossRef]
  45. Woodman, R.W.; Sawyer, J.E.; Griffin, R.W. Toward a theory of organizational Creativity. Acad. Manag. Rev. 1993, 18, 293–321. [Google Scholar] [CrossRef]
  46. Ricard, L.M.; Klijn, E.H.; Lewis, J.M.; Ysa, T. Assessing public leadership styles for innovation: A comparison of Copenhagen, Rotterdam and Barcelona. Public Manag. Rev. 2016, 19, 134–156. [Google Scholar] [CrossRef] [Green Version]
  47. Torugsa, N.A.; Arundel, A. The nature and incidence of workgroup innovation in the Australian public sector: Evidence from the Australian 2011 State of the Service survey. Aust. J. Public Adm. 2016, 75, 202–221. [Google Scholar] [CrossRef] [Green Version]
  48. Bratton, J. Organizational Leadership; Sage Publications: Los Angeles, CA, USA, 2020; ISBN 9781526460127. [Google Scholar]
  49. Griffith, J.A.; Baur, J.E.; Buckley, M.R. Creating comprehensive leadership pipelines: Applying the real options approach to organizational leadership development. Hum. Resour. Manag. Rev. 2019, 29, 305–315. [Google Scholar] [CrossRef]
  50. Heinze, T.; Shapira, P.; Rogers, J.D.; Senker, J.M. Organizational and institutional influences on creativity in scientific research. Res. Policy 2009, 38, 610–623. [Google Scholar] [CrossRef]
  51. Al Harbi, J.A.; Alarifi, S.; Mosbah, A. Transformation leadership and creativity: Effects of employees pyschological empowerment and intrinsic motivation. Pers. Rev. 2019, 48, 1082–1099. [Google Scholar] [CrossRef]
  52. Gil, A.J.; Rodrigo-Moya, B.; Morcillo-Bellido, J. The effect of leadership in the development of innovation capacity. Leadersh. Organ. Dev. J. 2018, 39, 694–711. [Google Scholar] [CrossRef]
  53. Tummers, L.; Bekkers, V. Policy implementation, street-level bureaucracy, and the importance of discretion. Public Manag. Rev. 2014, 16, 527–547. [Google Scholar] [CrossRef]
  54. Scott, W.R. Approaching adulthood: The maturing of institutional theory. Theory Soc. 2008, 37, 427–442. [Google Scholar] [CrossRef]
  55. Grewal, R.; Dharwadkar, R. The role of the institutional environment in marketing channels. J. Mark. 2002, 66, 82–97. [Google Scholar] [CrossRef]
  56. Di Maggio, P.J.; Powell, W.W. The iron cage revisited: Institutional isomorphism and collective rationality in organizational fields. Am. Sociol. Rev. 1983, 48, 147–160. [Google Scholar] [CrossRef] [Green Version]
  57. Liao, Y.C.; Tsai, K.H. Bridging market demand, proactivity, and technology competence with eco-innovations: The moderating role of innovation openness. Corp. Soc. Responsib. Environ. Manag. 2018, 26, 653–663. [Google Scholar] [CrossRef]
  58. Mensah, I. Stakeholder pressure and hotel environmental performance in Accra, Ghana. Manag. Environ. Qual. An. Int. J. 2014, 25, 227–243. [Google Scholar] [CrossRef]
  59. Awan, U.; Nauman, S.; Sroufe, R. Exploring the effect of buyer engagement on green product innovation: Empirical evidence from manufacturers. Bus. Strateg. Environ. 2020, 30, 463–477. [Google Scholar] [CrossRef]
  60. Song, W.; Yu, H. Green innovation strategy and green innovation: The roles of green creativity and green organizational identity. Corp. Soc. Responsib. Environ. Manag. 2018, 25, 135–150. [Google Scholar] [CrossRef]
  61. Zameer, H.; Wang, Y.; Yasmeen, H. Reinforcing green competitive advantage through green production, creativity and green brand image: Implications for cleaner production in China. J. Clean. Prod. 2020, 247, 119119. [Google Scholar] [CrossRef]
  62. Wernerfelt, B. A resource-based view of the firm. Strateg. Manag. J. 1984, 5, 171–180. [Google Scholar] [CrossRef]
  63. Barney, J.B. Firm Resources and Sustained Competitive Advantage. J. Manag. 1991, 17, 99–120. [Google Scholar] [CrossRef]
  64. Peteraf, A.M. The cornerstones of competitive advantage: A resource-based view margaret. Strateg. Manag. J. 1993, 14, 179–191. [Google Scholar] [CrossRef]
  65. Runyan, R.C.; Huddleston, P.; Swinney, J. Entrepreneurial orientation and social capital as small firm strategies: A study of gender differences from a resource-based view. Int. Entrep. Manag. J. 2006, 2, 455–477. [Google Scholar] [CrossRef]
  66. De Vasconcellos, S.L.; Garrido, I.L.; Parente, R.C. Organizational creativity as a crucial resource for building international business competence. Int. Bus. Rev. 2019, 28, 438–449. [Google Scholar] [CrossRef]
  67. Somech, A.; Drach-Zahavy, A. Translating team creativity to innovation implementation. J. Manag. 2011, 39, 684–708. [Google Scholar] [CrossRef]
  68. Ahlin, B.; Drnovšek, M.; Hisrich, R.D. Entrepreneurs’ creativity and firm innovation: The moderating role of entrepreneurial self-efficacy. Small Bus. Econ. 2014, 43, 101–117. [Google Scholar] [CrossRef]
  69. Lawson, B.; Samson, D. Developing innovation capability in organisations: A dynamic capabilities approach. Int. J. Innov. Manag. 2001, 5, 377–400. [Google Scholar] [CrossRef]
  70. Antwi, K.B.; Analoui, F.; Nana-Agyekum, D. Public sector reform in Sub-Saharan Africa: What can be learnt from the civil service performance improvement programme in Ghana? Public Adm. Dev. 2008, 28, 253–264. [Google Scholar] [CrossRef]
  71. Awan, U.; Sroufe, R. Interorganisational collaboration for innovation improvement in manufacturing firms’s: The mediating role of social performance. Int. J. Innov. Manag. 2020, 24, 2050049. [Google Scholar] [CrossRef]
  72. Chundakkadan, R.; Sasidharan, S. Financial constraints, government support, and firm innovation: Empirical evidence from developing economies. Innov. Dev. 2020, 10, 279–301. [Google Scholar] [CrossRef]
  73. Shelley, A.; Horner, K. Questionnaire surveys—Sources of error and implications for design, reporting and appraisal. Br. Dent. J. 2021, 230, 251–258. [Google Scholar] [CrossRef] [PubMed]
  74. Parfitt, J. Questionnaire design and sampling. In Methods in Human Geography: A Guide for Students Doing a Research Project, 2nd ed.; Pearson: Harlow, UK, 2005. [Google Scholar]
  75. Harman, H.H. Modern Factor Analysis; University of Chicago Press: Chicago, IL, USA, 1967. [Google Scholar]
  76. Podsakoff, P.M.; MacKenzie, S.B.; Lee, J.Y.; Podsakoff, N.P. Common method biases in behavioral research: A critical review of the literature and recommended remedies. J. Appl. Psychol. 2003, 88, 879–903. [Google Scholar] [CrossRef]
  77. Krishnan, R.; Martin, X.; Noorderhaven, N.G. When does trust matter to alliance performance? Acad. Manag. J. 2006, 49, 894–917. [Google Scholar] [CrossRef]
  78. Uttley, J. Power analysis, sample size, and assessment of statistical assumptions—Improving the evidential value of lighting research. LEUKOS J. Illum. Eng. Soc. N. Am. 2019, 15, 143–162. [Google Scholar] [CrossRef] [Green Version]
  79. Erdfelder, E.; Faul, F.; Buchner, A.; Lang, A.G. Statistical power analyses using G*Power 3.1: Tests for correlation and regression analyses. Behav. Res. Methods 2009, 41, 1149–1160. [Google Scholar] [CrossRef] [Green Version]
  80. Chesbrough, H. The future of open innovation. Res. Manag. 2017, 60, 29–35. [Google Scholar] [CrossRef]
  81. Fortwengel, J.; Schüßler, E.; Sydow, J. Studying organizational creativity as process: Fluidity or duality? Creat. Innov. Manag. 2016, 26, 5–16. [Google Scholar] [CrossRef]
  82. Ingenbleek, P.; Dentoni, D. Learning from stakeholder pressure and embeddedness: The roles of absorptive capacity in the corporate social responsibility of Dutch agribusinesses. Sustainability 2016, 8, 1026. [Google Scholar] [CrossRef] [Green Version]
  83. Shahzad, M.; Qu, Y.; Zafar, A.U.; Rehman, S.U.; Islam, T. Exploring the influence of knowledge management process on corporate sustainable performance through green innovation. J. Knowl. Manag. 2020, 24. [Google Scholar] [CrossRef]
  84. Shafique, I.; Ahmad, B.; Kalyar, M.N. How ethical leadership influences creativity and organizational innovation. Eur. J. Innov. Manag. 2019, 23, 114–133. [Google Scholar] [CrossRef]
  85. Sankaran, V. Organizational leadership: Igniting creativity for sustained corporate success. In Proceedings of the 2020 11th International Conference on Computing, Communication and Networking Technologies, ICCCNT 2020, Kharagpur, India, 1–3 July 2020. [Google Scholar]
  86. An, W.; Zhang, J.; You, C.; Guo, Z. Entrepreneur’s creativity and firm-level innovation performance: Bricolage as a mediator. Technol. Anal. Strateg. Manag. 2018, 30, 838–851. [Google Scholar] [CrossRef]
  87. Jeong, I.; Shin, S.J. High-performance work practices and organizational creativity during organizational change: A collective learning perspective. J. Manag. 2019, 45, 909–925. [Google Scholar] [CrossRef]
  88. West, M.A. Sparkling fountains or stagnant ponds: An integrative model of creativity and innovation implementation in work groups. Appl. Psychol. 2002, 51, 355–387. [Google Scholar] [CrossRef]
  89. Dissanayake, R.; Amarasuriya, T. Role of brand identity in developing global brands: A literature based review on case comparison between Apple Iphone vs. Samsung smartphone brands. Pressacademia 2015, 2, 430. [Google Scholar] [CrossRef] [Green Version]
  90. Salge, T.O.; Vera, A. benefiting from public sector innovation: The moderating role of customer and learning orientation. Public Adm. Rev. 2012, 72, 550–559. [Google Scholar] [CrossRef]
  91. Arundel, A.; Bloch, C.; Ferguson, B. Advancing innovation in the public sector: Aligning innovation measurement with policy goals. Res. Policy 2019, 48, 789–798. [Google Scholar] [CrossRef]
  92. Hair, J.F., Jr.; Hult, G.T.M.; Ringle, C.M.; Sarstedt, M.; Danks, N.P.; Ray, S. Partial Least Squares Structural Equation Modeling (PLS-SEM) Using R: A Workbook; Springer Nature: Berlin/Heidelberg, Germany, 2021. [Google Scholar]
  93. Hair, J.F.; Ringle, C.M.; Sarstedt, M. PLS-SEM: Indeed a silver bullet. J. Mark. Theory Pract. 2011, 19, 139–152. [Google Scholar] [CrossRef]
  94. Jöreskog, K.G. Simultaneous factor analysis in several populations. Psychometrika 1971, 36, 409–426. [Google Scholar] [CrossRef]
  95. Cronbach, L.J. Coefficient alpha and the internal structure of tests. Psychometrika 1951, 16, 297–334. [Google Scholar] [CrossRef] [Green Version]
  96. Dijkstra, T.K. PLS’ Janus face—Response to professor Rigdon’s ‘rethinking partial least squares modeling: In praise of simple methods’. Long Range Plann. 2014, 47, 146–153. [Google Scholar] [CrossRef]
  97. Dijkstra, T.K.; Henseler, J. Consistent partial least squares path modeling. MIS Q. 2015, 39, 297–316. [Google Scholar] [CrossRef]
  98. Fornell, C.; Larcker, D.F. Evaluating structural equation models with unobservable variables and measurement error. J. Mark. Res. 1981, 18, 39. [Google Scholar] [CrossRef]
  99. Ringle, C.; Da Silva, D.; Bido, D. Structural equation modeling with the SmartPLS. Braz. J. Mark. 2015, 13. [Google Scholar]
  100. Hair, J.F.; Hult, G.T.M.; Ringle, C.M.; Sarstedt, M. A Primer on Partial Least Squares Structural Equation Modeling (PLS-SEM), 3rd ed.; Sage: Thousand Oaks, CA, USA, 2022. [Google Scholar]
  101. Henseler, J.; Ringle, C.M.; Sarstedt, M. A new criterion for assessing discriminant validity in variance-based structural equation modeling. J. Acad. Mark. Sci. 2015, 43, 115–135. [Google Scholar] [CrossRef] [Green Version]
  102. Kline, R.B. Principles and Practice of Structural Equation Modeling; The Guilford Press: New York, NY, USA, 2015; ISBN 9781462523009. [Google Scholar]
  103. YuSheng, K.; Ibrahim, M. Innovation capabilities, innovation types, and firm performance: Evidence from the banking sector of Ghana. SAGE Open 2020, 10. [Google Scholar] [CrossRef]
  104. Hair, J.F.; Risher, J.J.; Sarstedt, M.; Ringle, C.M. When to use and how to report the results of PLS-SEM. Eur. Bus. Rev. 2019, 31, 2–24. [Google Scholar] [CrossRef]
  105. Helfat, C.E. Know-how and asset complementarity and dynamic capability accumulation: The case of r&d. Strateg. Manag. J. 1997, 18, 339–360. [Google Scholar] [CrossRef]
  106. Nelson, R.R.; Winter, S.G. An Evolutionary Theory of Economic Change; The Belknap Press: Cambridge, MA, USA, 1982; ISBN 9780674272286. [Google Scholar]
  107. Chin, W.W. How to write up and report PLS analyses. In Handbook of Partial Least Squares; Springer: Berlin/Heidelberg, Germany, 2010. [Google Scholar]
  108. Gunday, G.; Ulusoy, G.; Kilic, K.; Alpkan, L. Effects of innovation types on firm performance. Int. J. Prod. Econ. 2011, 133, 662–676. [Google Scholar] [CrossRef] [Green Version]
  109. Ul Hassan, M.; Shaukat, S.; Nawaz, M.S.; Naz, S. Effects of innovation types on firm performance: An empirical study on Pakistan’s manufacturing sector. Pakistan J. Commer. Soc. Sci. 2013, 7, 243–262. [Google Scholar] [CrossRef]
  110. Van der Voort, H.; Koppenjan, J.; Ten Heuvelhof, E.; Leijten, M.; Veeneman, W. Competing values in the management of innovative projects: The case of the RandstadRail Project. In Innovation in the Public Sector; Springer: Berling/Heidelberg, Germany, 2011; pp. 134–154. [Google Scholar]
  111. Wang, S.; Noe, R.A. Knowledge sharing: A review and directions for future research. Hum. Resour. Manag. Rev. 2010, 20, 115–131. [Google Scholar] [CrossRef]
  112. Rampersad, G.; Quester, P.; Troshani, I. Examining network factors: Commitment, trust, coordination and harmony. J. Bus. Ind. Mark. 2010, 25, 487–500. [Google Scholar] [CrossRef]
  113. Demircioglu, M.A.; Audretsch, D.B. Public sector innovation: The effect of universities. J. Technol. Transf. 2019, 44, 596–614. [Google Scholar] [CrossRef]
  114. Klijn, E.-H.; Edelenbos, J.; Steijn, B. Trust in governance networks: Its impacts on outcomes. Adm. Soc. 2010, 42, 193–221. [Google Scholar] [CrossRef] [Green Version]
  115. Von Hippel, E.A. Open source projects as horizontal innovation networks—By and for users. SSRN Electron. J. 2002. [Google Scholar] [CrossRef] [Green Version]
  116. Phirouzabadi, A.M.; Mahmoudian, M.; Asghari, M. How networking empirically influences the types of innovation?: Pardis technology park as a case study. Comput. Eng. Appl. J. 2013, 2, 295–306. [Google Scholar] [CrossRef]
  117. Lewis, J.M.; Ricard, L.M.; Klijn, E.-H.; Ysa, T. Innovation in City Governments: Structures, Networks and Leadership; Routledge: Milton Park, UK; Taylor & Francis Group PP: New York, NY, USA, 2018; ISBN 9781138617216. [Google Scholar]
  118. Agolla, J.E.; Van Lill, J.B. Public sector innovation drivers: A process model. J. Soc. Sci. 2013, 34, 165–176. [Google Scholar] [CrossRef]
  119. Yeboah-Assiamah, E.; Asamoah, K.; Bawole, J.N.; Musah-Surugu, I.J. A socio-cultural approach to public sector corruption in Africa: Key pointers for reflection. J. Public Aff. 2016, 16, 279–293. [Google Scholar] [CrossRef]
Figure 1. A conceptual framework of the relationships between variables.
Sustainability 14 01378 g001
Figure 2. Structural model.
Sustainability 14 01378 g002
Table 1. Profile of Respondents.
FrequencyPercentage
Gender
Male9046
Female10554
Respondents Age (in yrs.)
18–25--
26–30--
31–357840
36–402211.2
41–453518
46–502814.35
>503216.4
Educational background
Doctorate degree3216.41
Master’s degree11860.6
Bachelor’s degree4523.07
High school diploma--
Job position
CEO/Managing director7840
Head of I.T4221.53
Digital manager3819.48
Corporate affairs officer3718.97
Work experience (in yrs.)
<52110.8
6–105829.8
11–154422.6
16–204221.5
>203015.38
Table 2. Descriptive Statistics of Variables.
IndicatorsMeanMinMaxSDKurtosisSkewness
IL15.67171.421−0.031−0.514
IL25.58171.4650.549−0.383
IL34.98171.306−0.156−0.240
IL45.09171.192−0.591−0.706
IL54.92171.1661.189−0.678
IAC14.60171.3120.970−0.788
IAC25.43171.2080.970−1.638
IAC34.98171.2490.368−0.443
IAC45.34171.421−0.031−1.251
IAC55.60171.0520.879−0.762
IC15,29171.312−1.104−0.999
IC25.58171.208−0.788−0.267
IC34.89171.3850.449−0.919
IC44.73171.2341.456−0.908
IC55.18171.3281.432−1.018
SP15.31270.735−0.043−0.912
SP25.87171.2311.0980.662
SP34.63170.9082.2311.390
SP45.32171.2341.8290.747
SP54.98171.2563.8710.147
INC15.56270.7673.2830.479
INC23.74271.0741.812−0.668
INC34.12360.9272.4130.139
INC44.89160.8951.577−0.427
INC55.67270.342−1.098−0.342
PIP14.32370.0970.0710.065
PIP25.86371.891−1.8720.782
PIP34.48261.657−0.4561.563
PIP45.98260.887−0.345−1.097
PIP55.09271.876−1.436−1.765
Note: SD = Standard deviation; Max = Maximum data point; Min = Minimum data point; IAC = Inter-agency collaboration; IC = Institutional creativity; IL = Institutional leadership; INC = Institutional innovation capacity; SP = Stakeholder pressure; PIP = Public innovation performance.
Table 3. Item Loading and Construct Reliability.
ItemsFLVIFCARho_ACRAVE
IAC10.6102.6710.8180.8450.8710.576
IAC20.6991.967
IAC30.8033.872
IAC40.8540.281
IAC50.8121.014
IC10.5061.5780.7380.7620.8280.598
IC20.7991.872
IC30.8061.347
IC40.6251.143
IC50.7423.382
IL10.8001.2760.8220.8490.8630.562
IL20.8542.167
IL30.8021.098
IL40.8211.218
IL50.5780.672
INC10.7551.6730.7970.8210.8630.563
INC20.8581.498
INC30.8582.984
INC40.6863.901
INC50.6591.347
SP10.8190.0120.7890.7290.8560.783
SP20.7371.472
SP30.6382.643
SP40.6582.901
SP50.7631.458
PIP10.7121.0900.7860.7890.8530.536
PIP20.6440.684
PIP30.7741.800
PIP40.7511.874
PIP50.7772.289
Note. FL = factor loadings; CA = Cronbach’s alpha; CR = Composite reliability; AVE = Average variance extracted; Rho_A = composite reliability rho; VIF = Variance Inflation Factor; IAC = Inter-agency collaboration; IC = Institutional creativity; IL = Institutional leadership; INC = Institutional innovation capacity; SP = Stakeholder pressure; PIP = Public innovation performance.
Table 4. Discriminant Validity.
ItemsICINCILIACPIPSP
IC
INC0.7090.750
IL0.7400.6020.770
IAC−0.7520.6420.5670.762
PIP0.6210.6740.8850.5930.733
SP0.8670.6990.7170.4560.7700.630
Note. IAC = Inter-agency collaboration; IC = Institutional creativity; IL = Institutional leadership; INC = Institutional innovation capacity; SP = Stakeholder pressure; PIP = Public innovation performance.
Table 5. Hypothesis Testing.
HypothesesRelationshipOSSMSDt-Statisticp-ValueDecision
H1aIAC->IC0.3630.3480.1792.6360.009accepted
H1bIAC->INC0.9160.9160.05117.9980.000accepted
H2aIL->IC0.7160.7040.1494.8020.000accepted
H2bIL->INC0.1440.1440.0712.0290.043accepted
H3aSP->IC−0.208−0.1800.1791.1570.248rejected
H3bSP->INC−0.075−0.0750.0850.8850.376rejected
H4IC->PIP0.9520.9580.05517.2340.000accepted
H5INC->PIP−0.032−0.0390.0800.4010.688rejected
Note. OS = Original sample; SM = Sample mean; SD = Standard deviation; IAC = Inter-agency collaboration; IC = Institutional creativity; IL = Institutional leadership; INC = Institutional innovation capacity; SP = Stakeholder pressure; PIP = Public innovation performance.
Publisher’s Note: MDPI stays neutral with regard to jurisdictional claims in published maps and institutional affiliations.

