Article

A Thorough Economic Evaluation by Implementing Solar/Wind Energies for Hydrogen Production: A Case Study

by
Mohammad Hossein Ahmadi
1,2,
Seyyed Shahabaddin Hosseini Dehshiri
3,
Seyyed Jalaladdin Hosseini Dehshiri
4,
Ali Mostafaeipour
1,2,5,
Khalid Almutairi
6,
Hoa Xuan Ao
7,
Mohammadhossein Rezaei
8 and
Kuaanan Techato
1,2,*
1
Faculty of Environmental Management, Prince of Songkla University, Songkhla 90110, Thailand
2
Environmental Assessment and Technology for Hazardous Waste Management Research Center, Faculty of Environmental Management, Prince of Songkla University, Songkhla 90110, Thailand
3
Department of Mechanical Engineering, Sharif University of Technology, Tehran 1458889694, Iran
4
Department of Industrial Management, Faculty of Management and Accounting, Allameh Tabataba’i University, Tehran 1434863111, Iran
5
Industrial Engineering Department, Yazd University, Yazd 8915818411, Iran
6
Applied College, Mechanical Engineering Technology, University of Hafr Al Batin, Hafr Al Batin 31991, Saudi Arabia
7
Faculty of Economics, Tay Nguyen University, Buon Ma Thuot City 630000, Vietnam
8
Mechanical Engineering Department, Yazd University, Yazd 8915818411, Iran
*
Author to whom correspondence should be addressed.
Sustainability 2022, 14(3), 1177; https://doi.org/10.3390/su14031177
Submission received: 17 December 2021 / Revised: 10 January 2022 / Accepted: 18 January 2022 / Published: 20 January 2022

Abstract

:
A technical–economic assessment was carried out in this study to determine the possibilities for wind and solar power generation in Afghanistan’s Helmand province. The results showed that most of the province has a solar irradiance of over 400 W/m2, and also showed that wind and solar power generated in the province can be up to twice as cheap as the official price of renewable power in Afghanistan. The most suitable site for solar and hydrogen production was found to be Laškar Gāh, where solar and hydrogen can be produced at a cost of 0.066 $/kWh and 2.1496 $/kg-H2, respectively. In terms of wind power production and hydrogen production from wind, the most suitable site was Sangīn, where wind power and hydrogen could be produced at costs of 0.057 $/kWh and 1.4527 $/kg-H2, respectively. Despite the high potential of wind and solar energy in the Helmand province, the most suitable place in this region to produce hydrogen from wind/solar energy was evaluated from technical, economic, and environmental perspectives with the Multi-Criteria Decision-Making (MCDM) method. The Stepwise Weight Assessment Ratio Analysis (SWARA) method was used for weighting criteria and the Weighted Aggregated Sum Product Assessment (WASPAS) method was used to prioritize locations. The results show that Sangīn is the most suitable place for the construction of a wind hydrogen power plant and Laškar Gāh is the most suitable place for the construction of a solar hydrogen power plant.

1. Introduction

Energy appears to be playing a crucial role in the economic development of nations. However, the overutilization of fossil fuel sources to satisfy ever-growing energy demand has created a range of environmental problems—most notably, global warming and climate change due to greenhouse gas emissions. In response, most countries have adopted some measures to prevent or at least minimize such environmental impacts. At present, the transition from fossil fuels to clean energies is at the top of the agenda in many countries.
Given the non-renewable nature of fossil fuel reserves and their extensive environmental impacts, many governments have adopted energy policies focused on the widespread use of renewable energies and the promotion of the renewable energy industry [1,2]. Kaygusuz [3] reported that without such energy policies, roughly 1.2 billion people worldwide will not be able to gain access to electricity by 2030. This is an especially important issue in Afghanistan, where energy is in high demand, but there are many infrastructural challenges in meeting this demand. Statistics published by the Afghan government show that only 10–15% of the Afghan population has permanent access to electricity, which is one of the lowest rates in the world [4,5]. This rate is much lower in rural areas. Afghanistan is a war-devastated country with grave political and social stability problems, with a population of mostly young people and children, a majority of which live in rural areas. Unfortunately, many rural communities of this country suffer from technological, social, and economic underdevelopment [6]. According to Afghanistan’s power sector master plan, the net energy demand in Afghanistan is expected to increase sixfold by 2032 [4]. Certainly, Afghanistan’s current electricity generation system will not be able to keep up with this demand. Given the vital importance of access to electricity for social and economic development, fossil fuel sources are likely to play a major role in meeting global power demand for the foreseeable future, but renewable energies are also turning into viable alternatives for power generation [7].
Afghanistan has extensive wind energy capacity, especially in its western regions, where some areas experience strong winds on about 120 days per year. According to an assessment conducted by the American National Renewable Energy Laboratory (NREL), a 31,611 km2 area in this region has wind speeds above Class 4 (wind speeds above 6.8 m/s and wind power densities above 400 W/m2). According to this assessment, if one 5 MW turbine is installed in each 1 km2 area of the region, it will have a wind capacity of 158.1 GW [8]. 
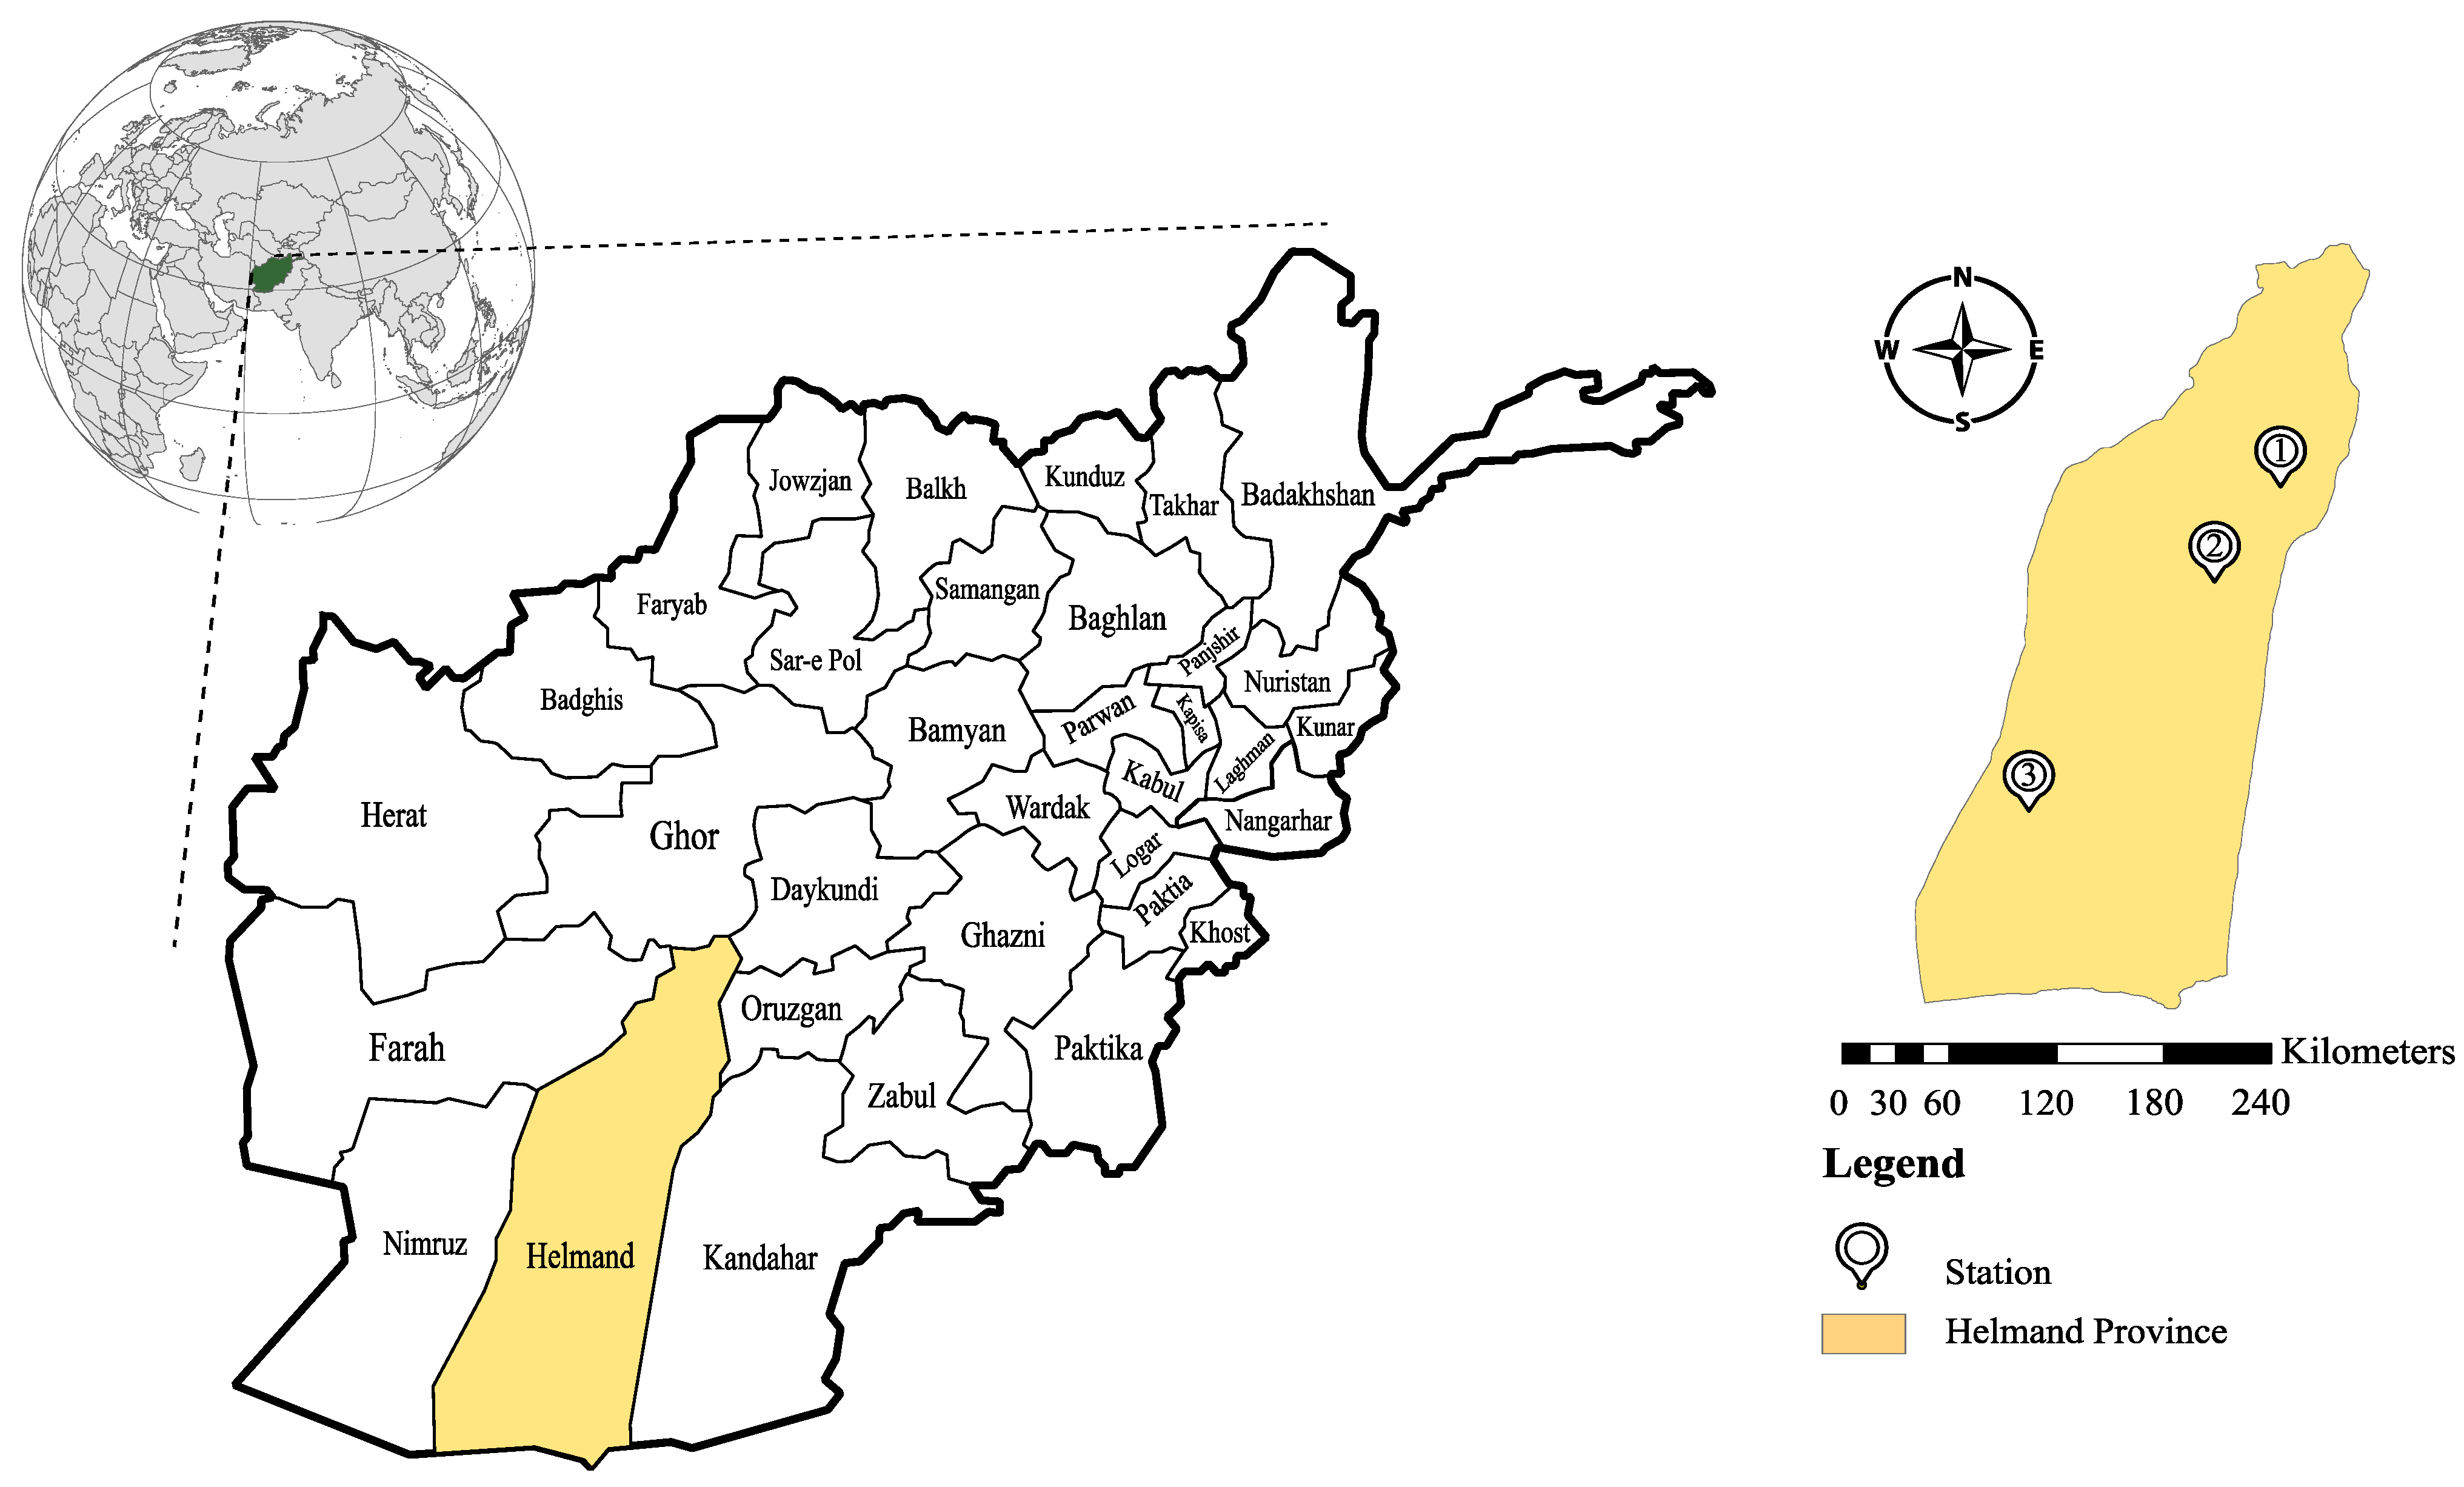
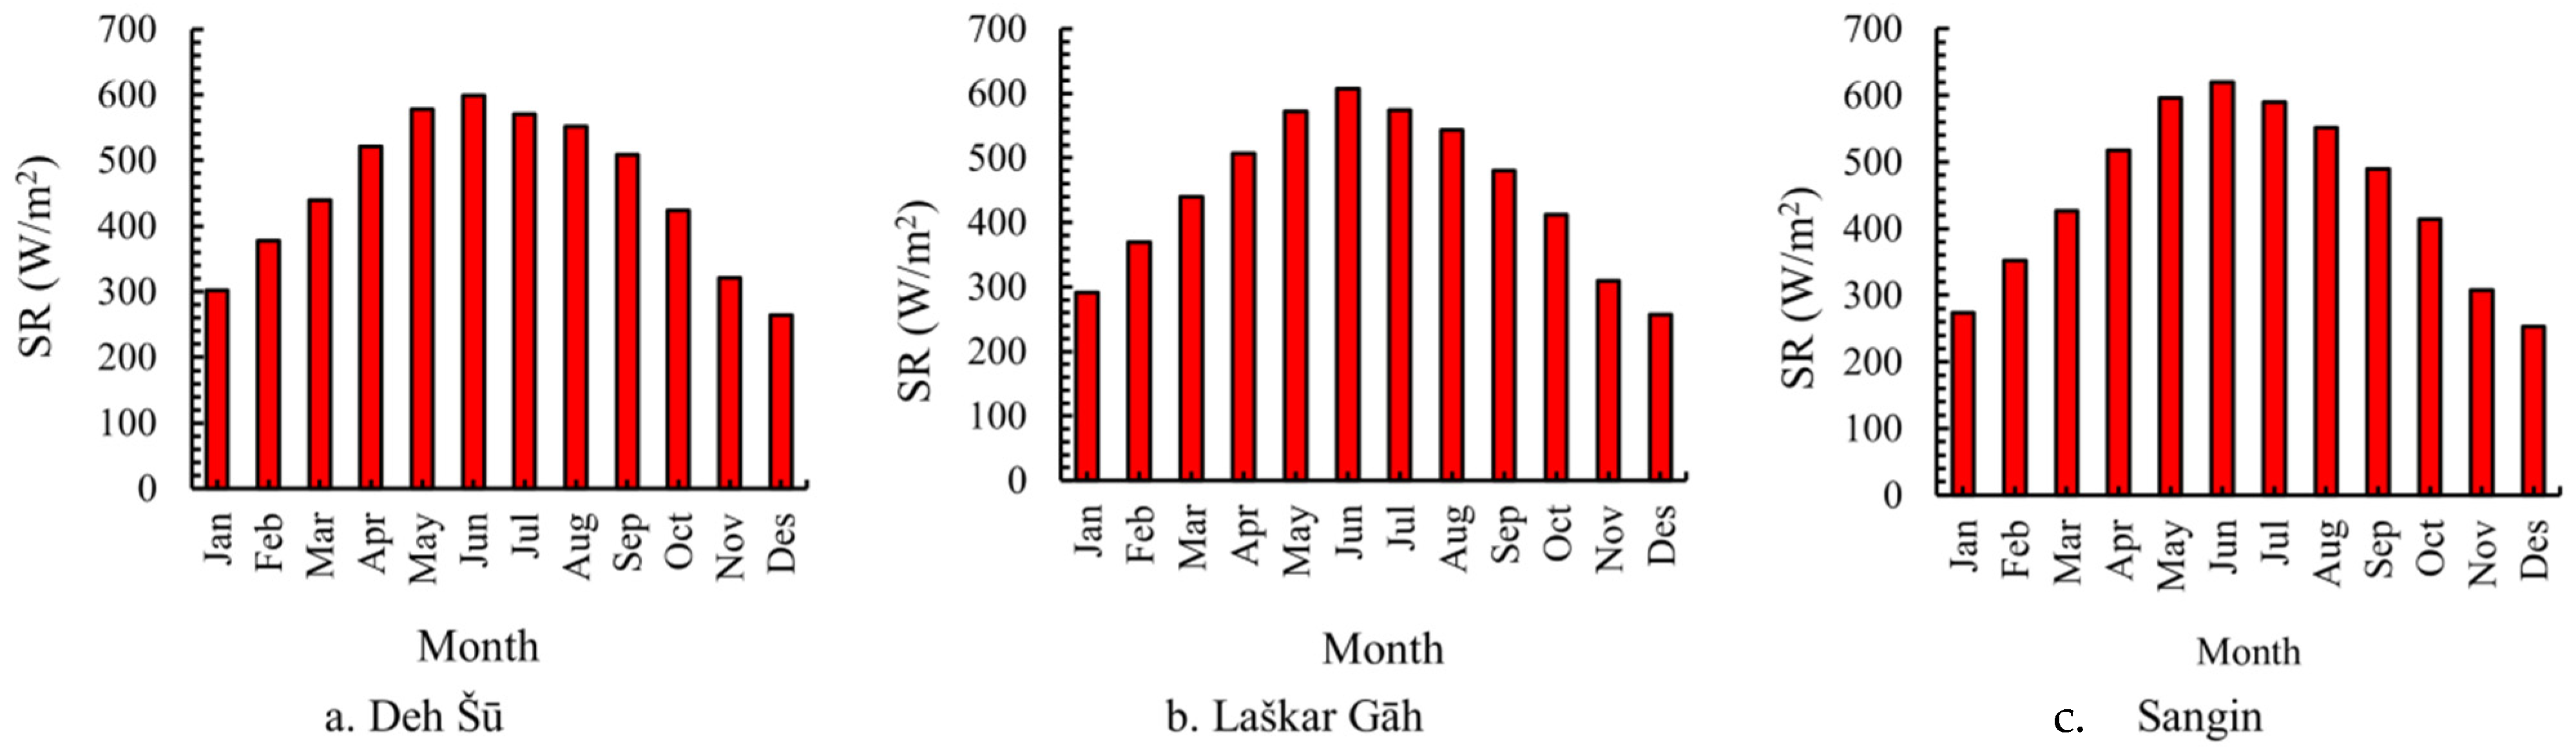
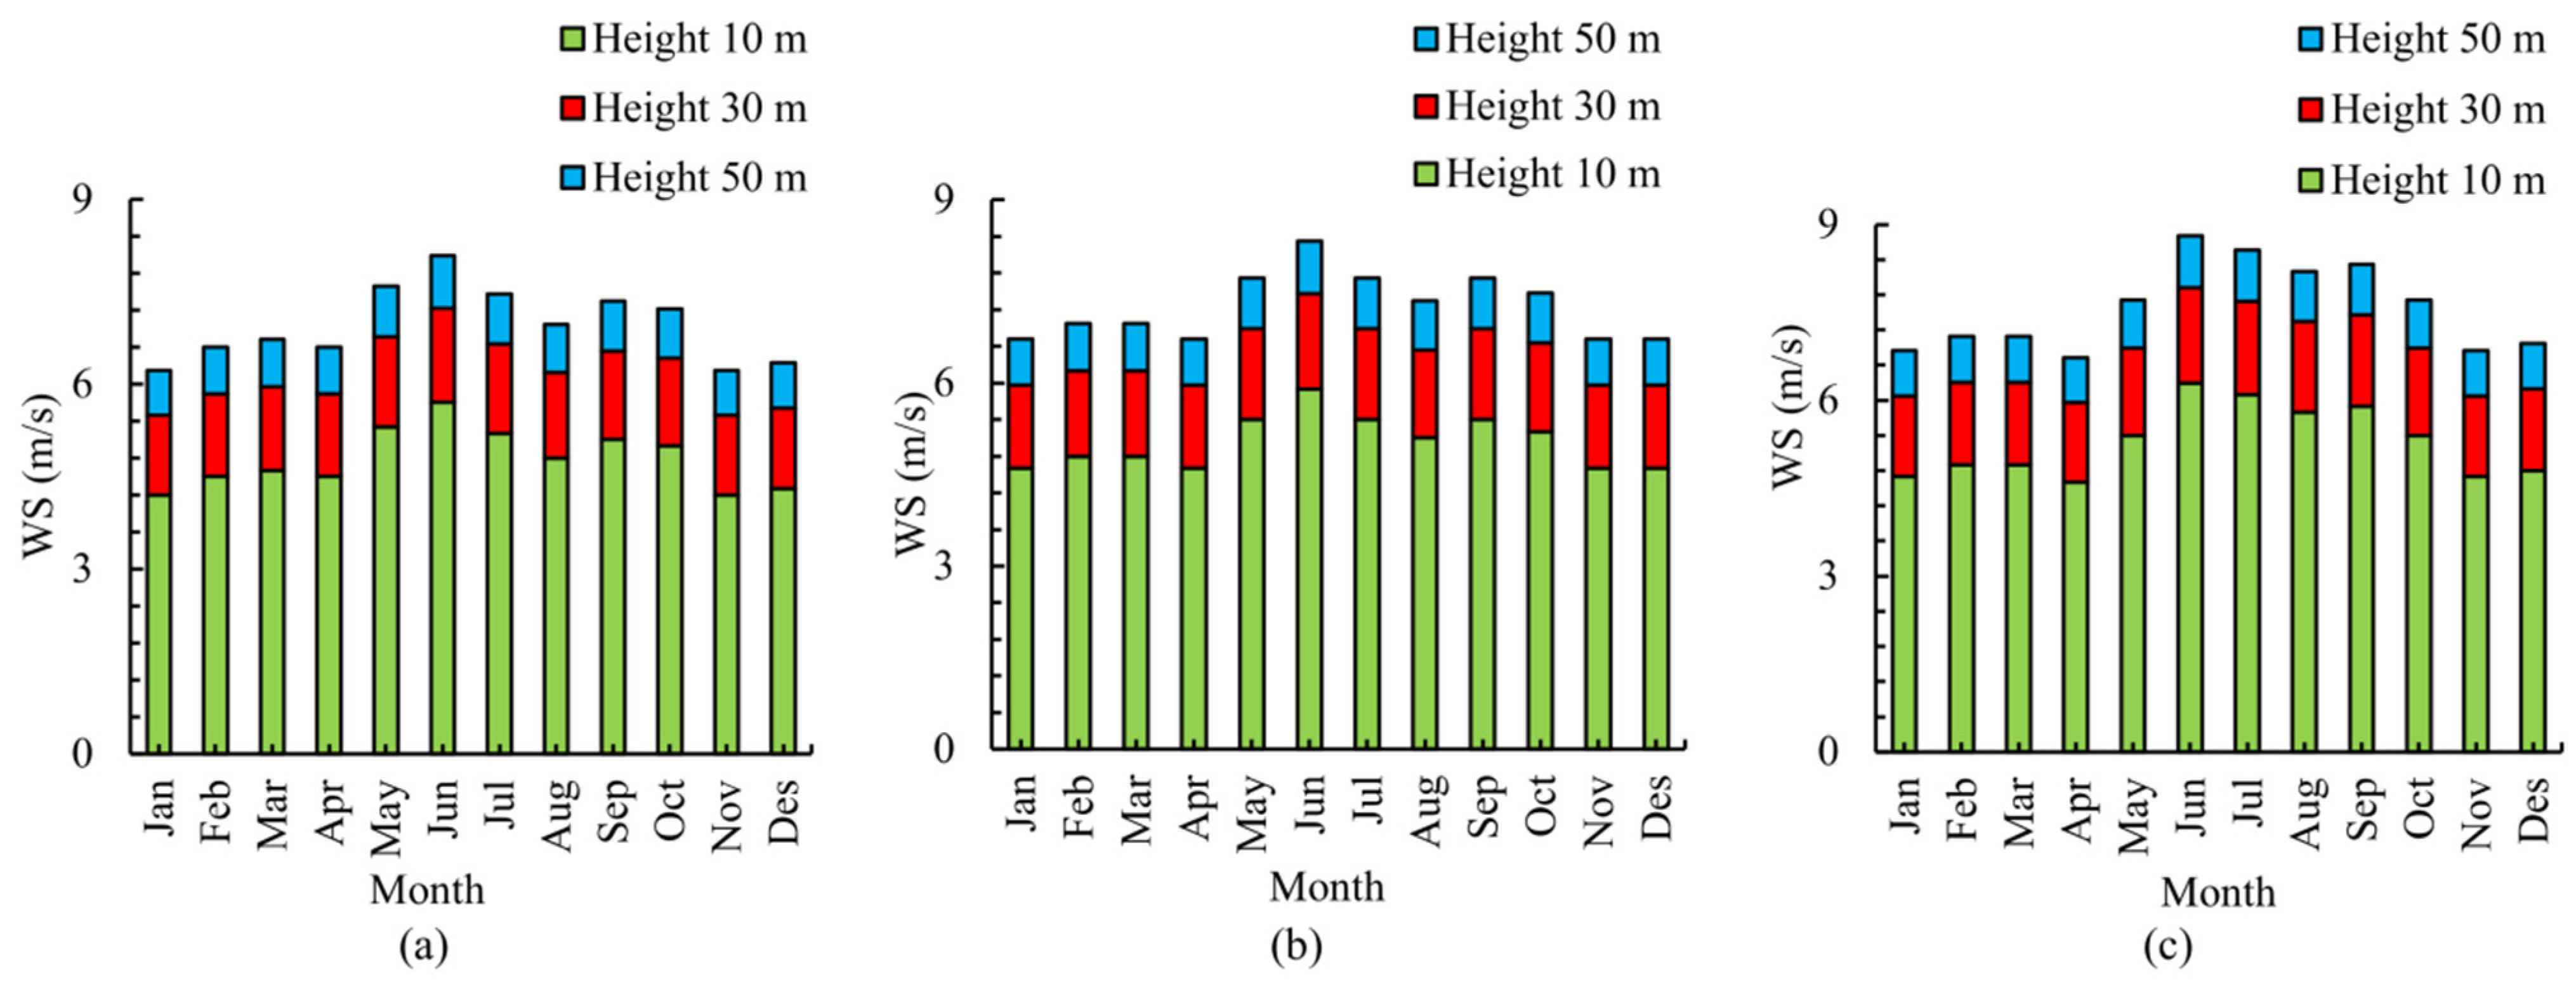
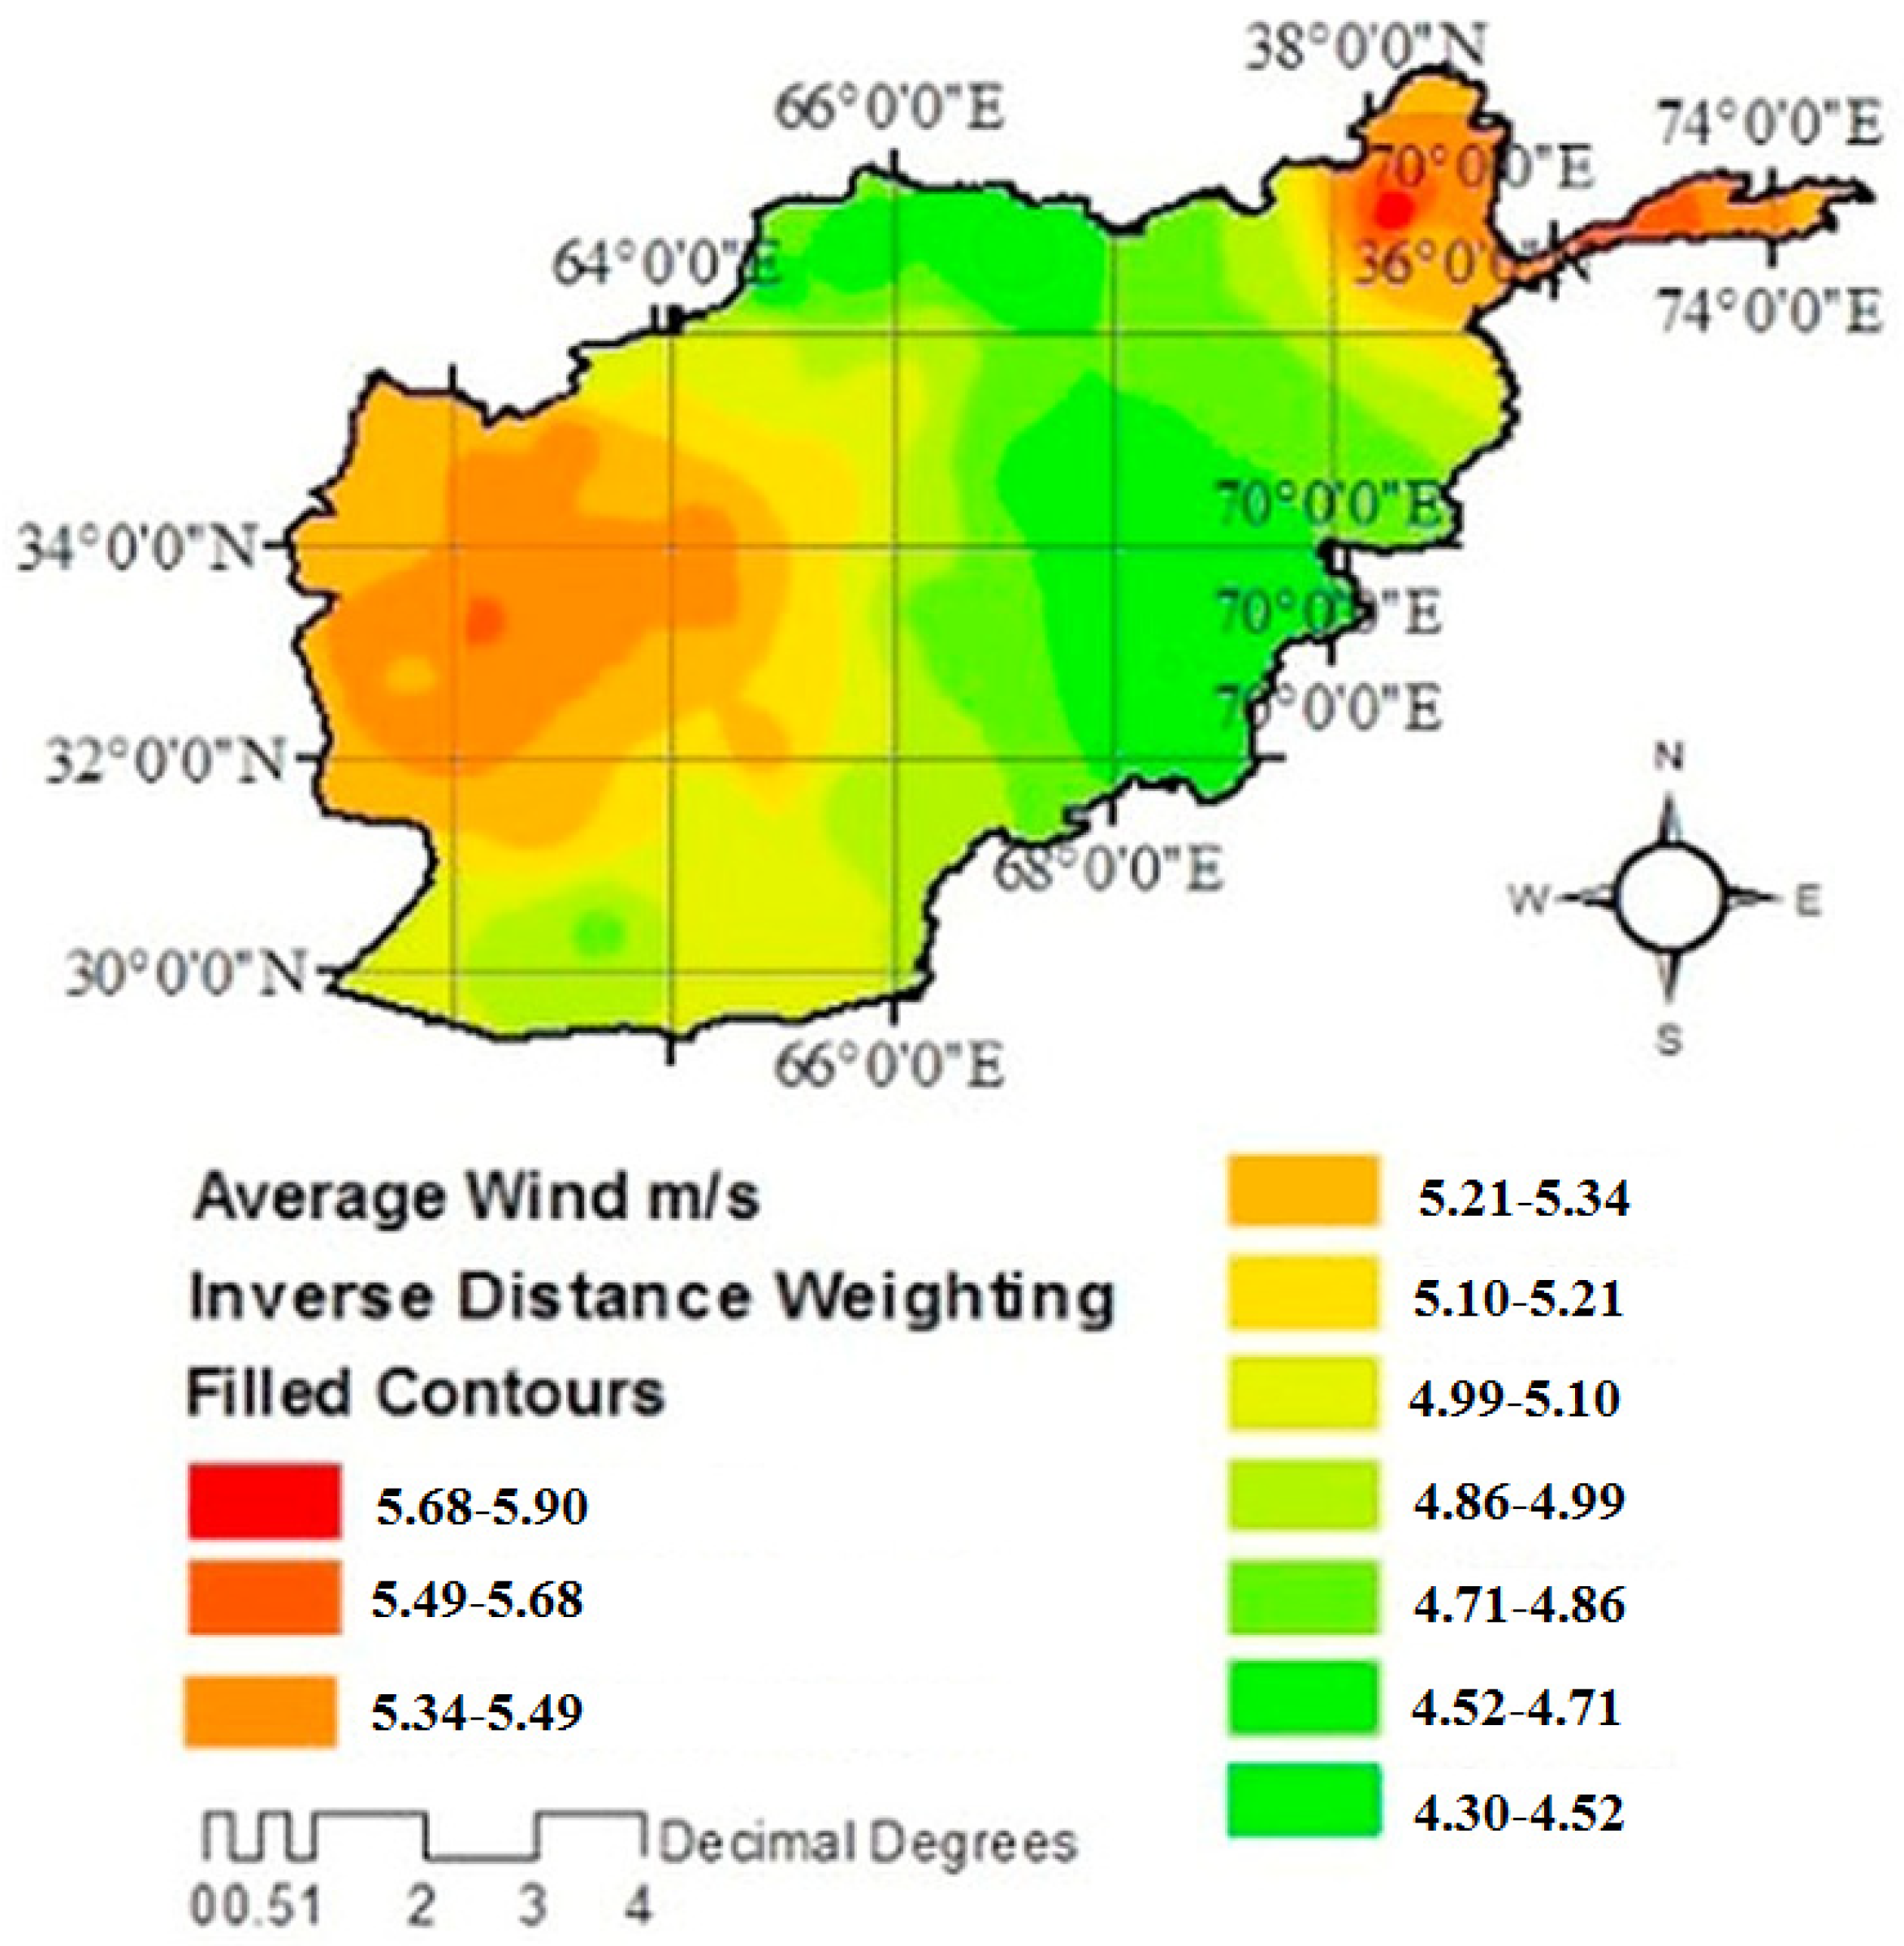
Figure 1 shows the wind energy distribution in Afghanistan. As is known, the highest wind speeds are in the northeastern and western parts of the country. However, wind speeds are also high in the southern parts of the country. In fact, in the southern part of the country and especially in the Helmand province, the average wind speed is more than 5 m/s, and there is high potential for wind energy in this region.
Afghanistan also has an average of 300 sunny days a year, many of which have intense sunshine and cloudless skies. The average annual normal irradiation in Afghanistan is over 1022 kWh/m2. In the southern and western parts of the country, this figure reaches 1825–2445 kWh/m2. Solar energy is abundantly available in all parts of Afghanistan. According to NREL’s map of Afghanistan’s solar resources, the average annual global horizontal irradiation of the country is in the range of 3.9–5.9 kWh/m2 per day, which is suitable for installing solar photovoltaic (PV) panels [8]. The installed PV capacity in various places in the world is shown in 
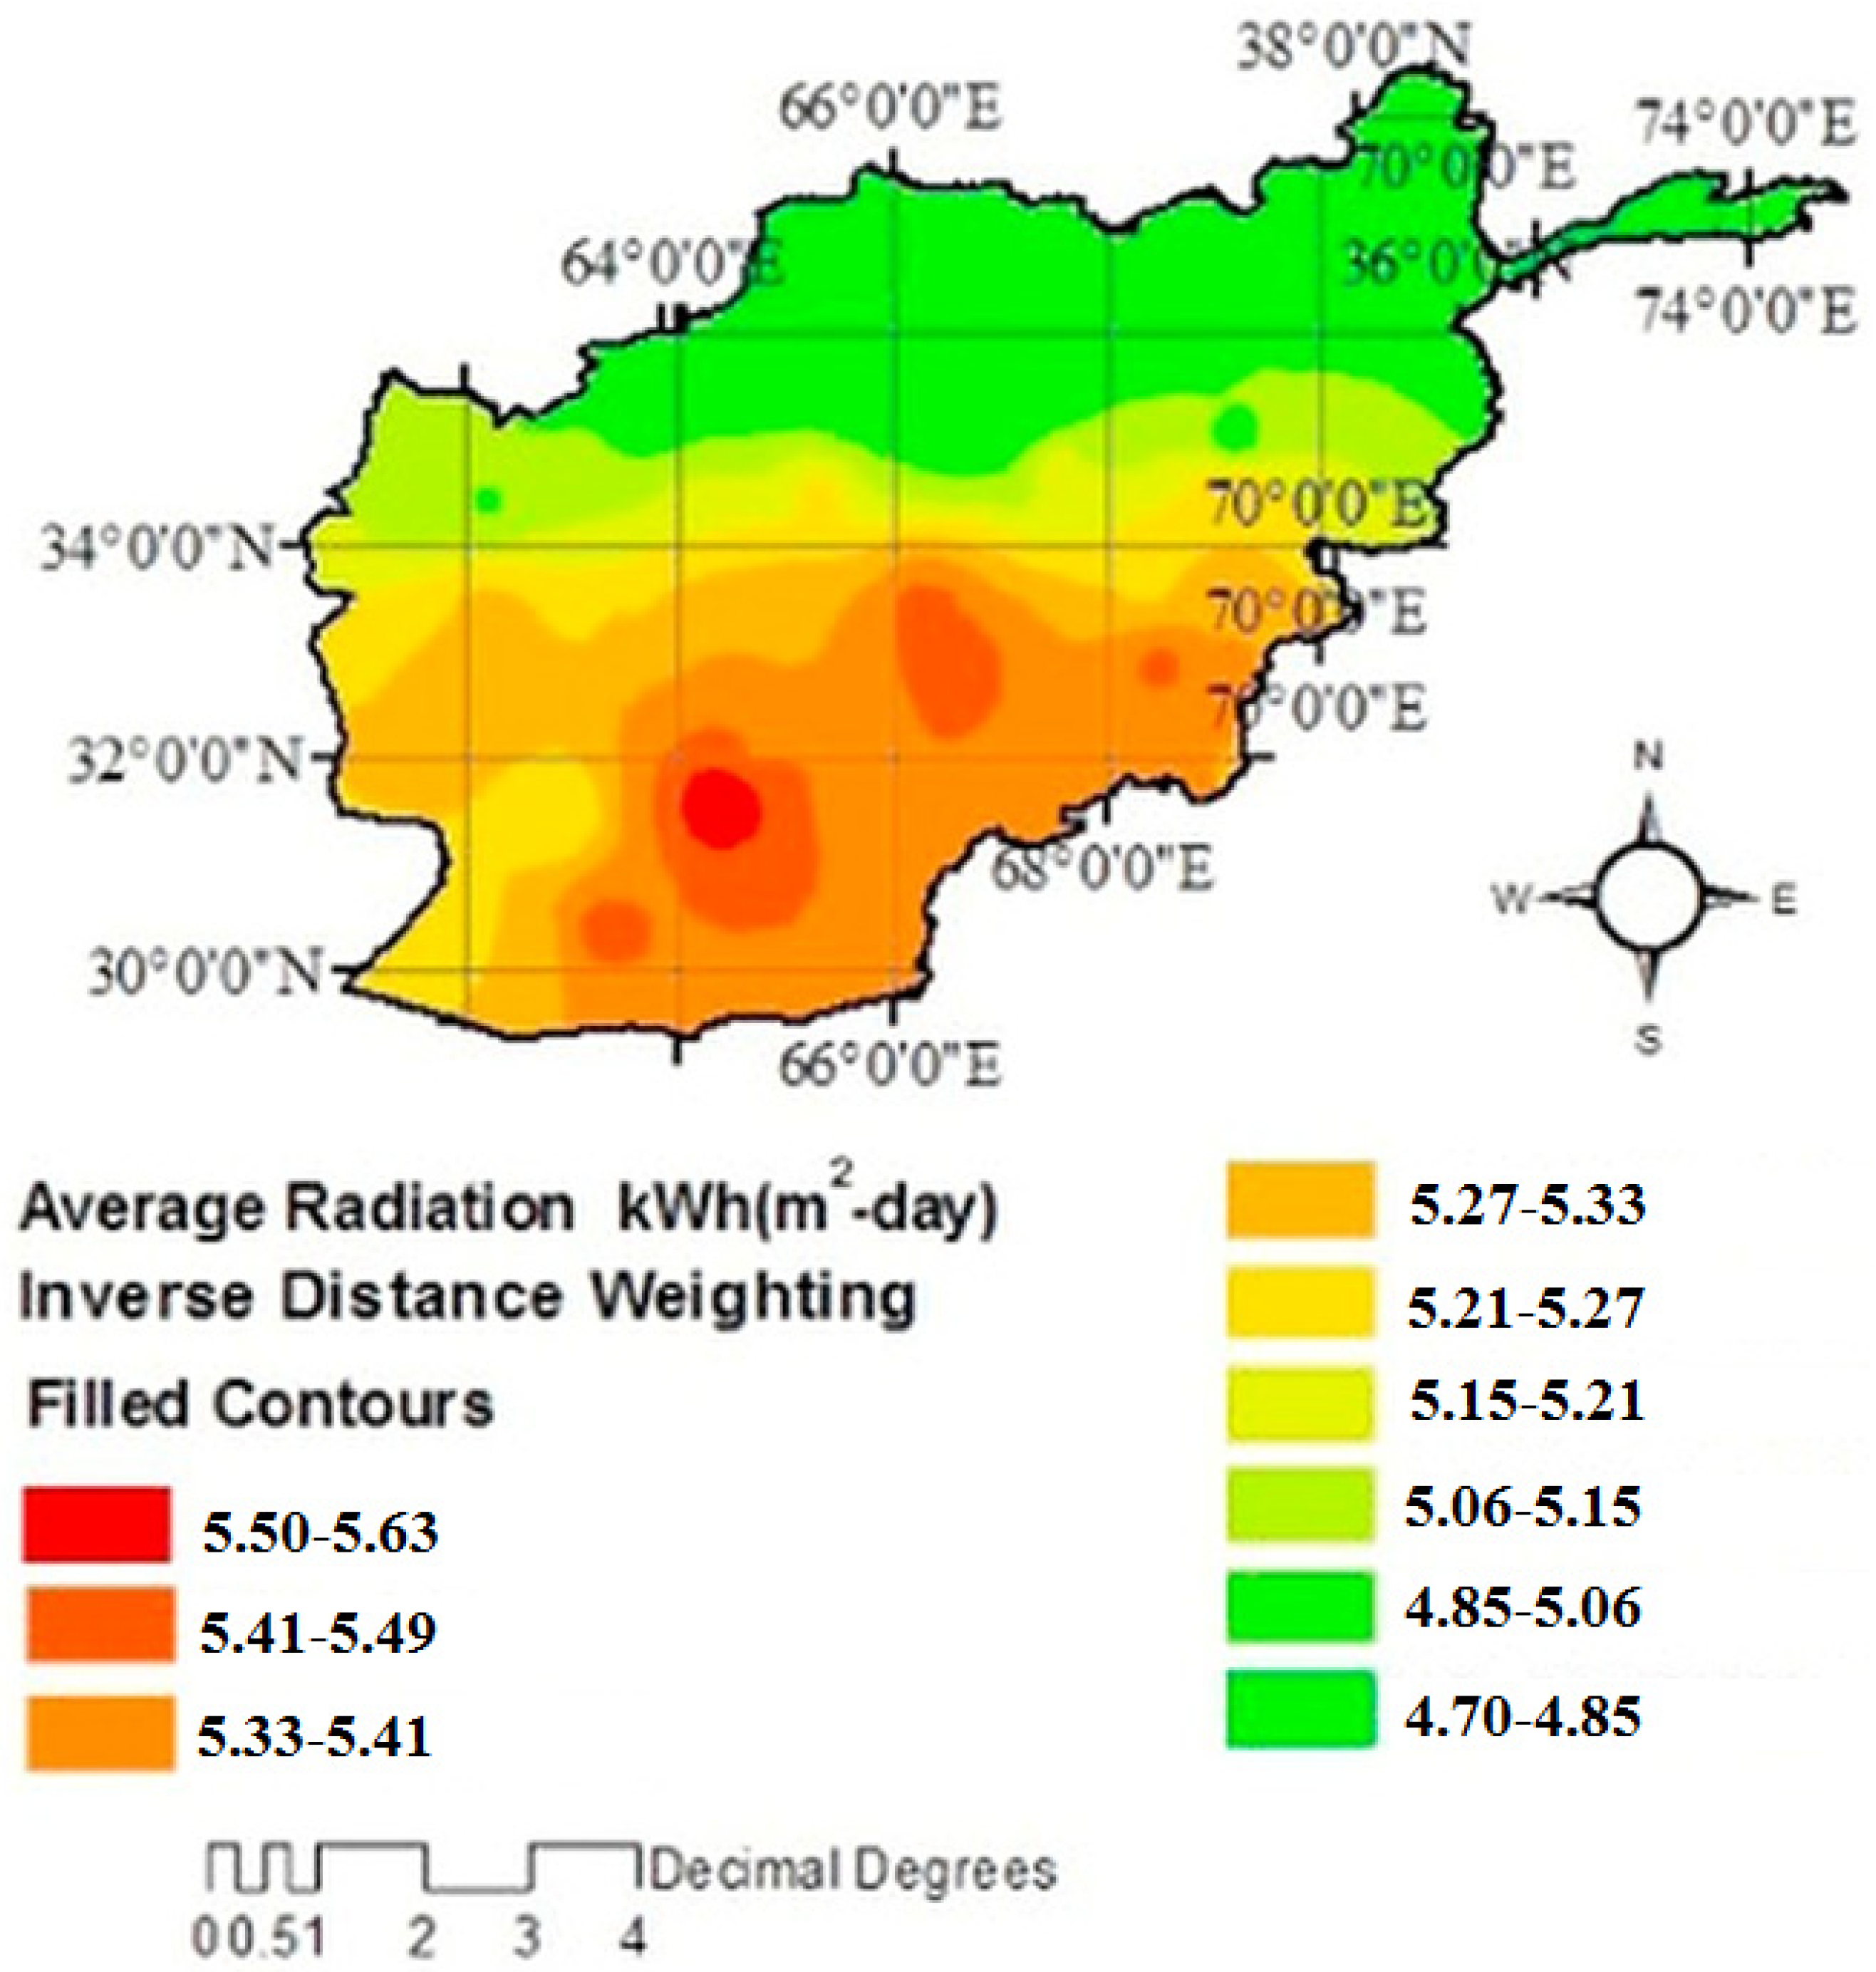
Figure 2. As the figure shows, despite having extensive solar capacity, the greater Middle East region has lower installed PV capacity than other parts of the world. Figure 2 also shows the potential for solar energy in Afghanistan. As is known, the highest solar radiation is in the southern regions of this country and, especially, in the Helmand province of Afghanistan. The solar radiation in this area is more than 5.5 kWh/m2/day.
Hydrogen is a highly potent energy source that can serve as a substitute for hydrocarbon fuels in road and sea transport, heating, and other applications [10]. While being highly flammable, which poses some problems in storage and transport, hydrogen offers an energy density of about 120–142 megajoules per kilogram, which is almost three times higher than that of oil [11]. In addition, burning hydrogen produces water rather than greenhouse gases, which is a massive environmental advantage [12]. Furthermore, because of its electrochemical properties, hydrogen can be used in fuel cells and carried in liquid and gaseous forms, as well as metal hydrides [13]. 
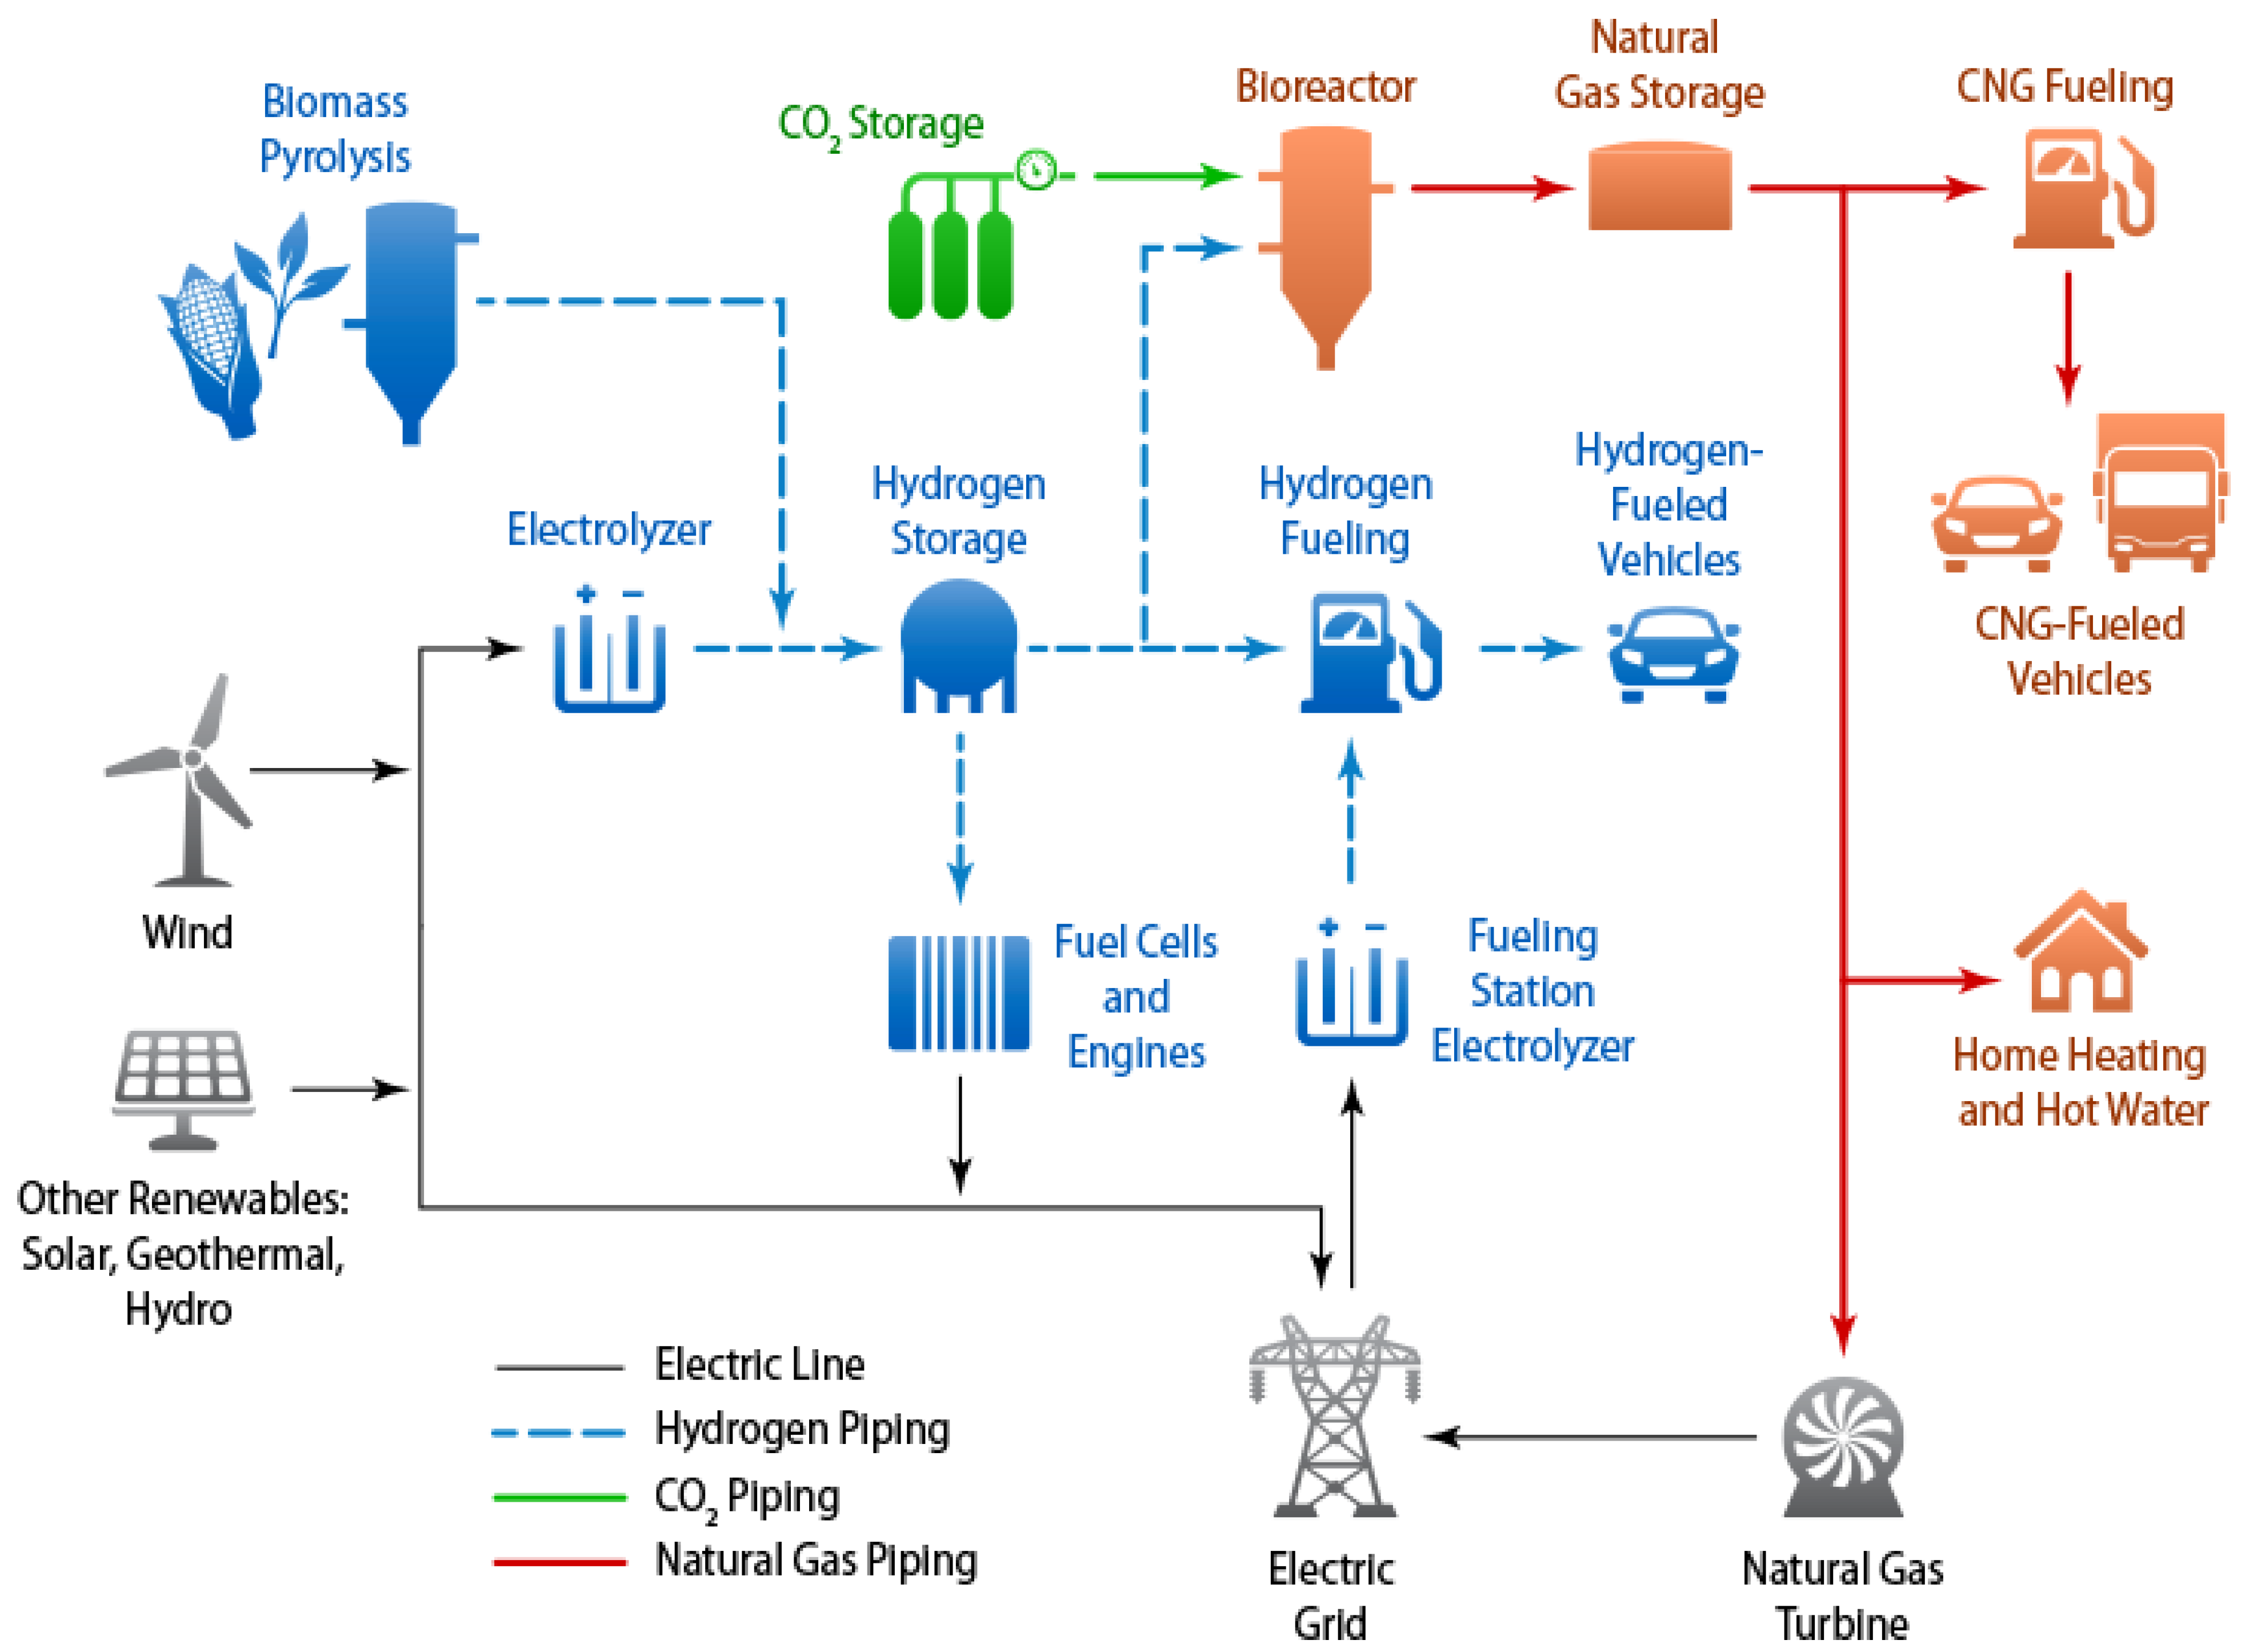
Figure 3 depicts many approaches for generating power and hydrogen from renewable sources.
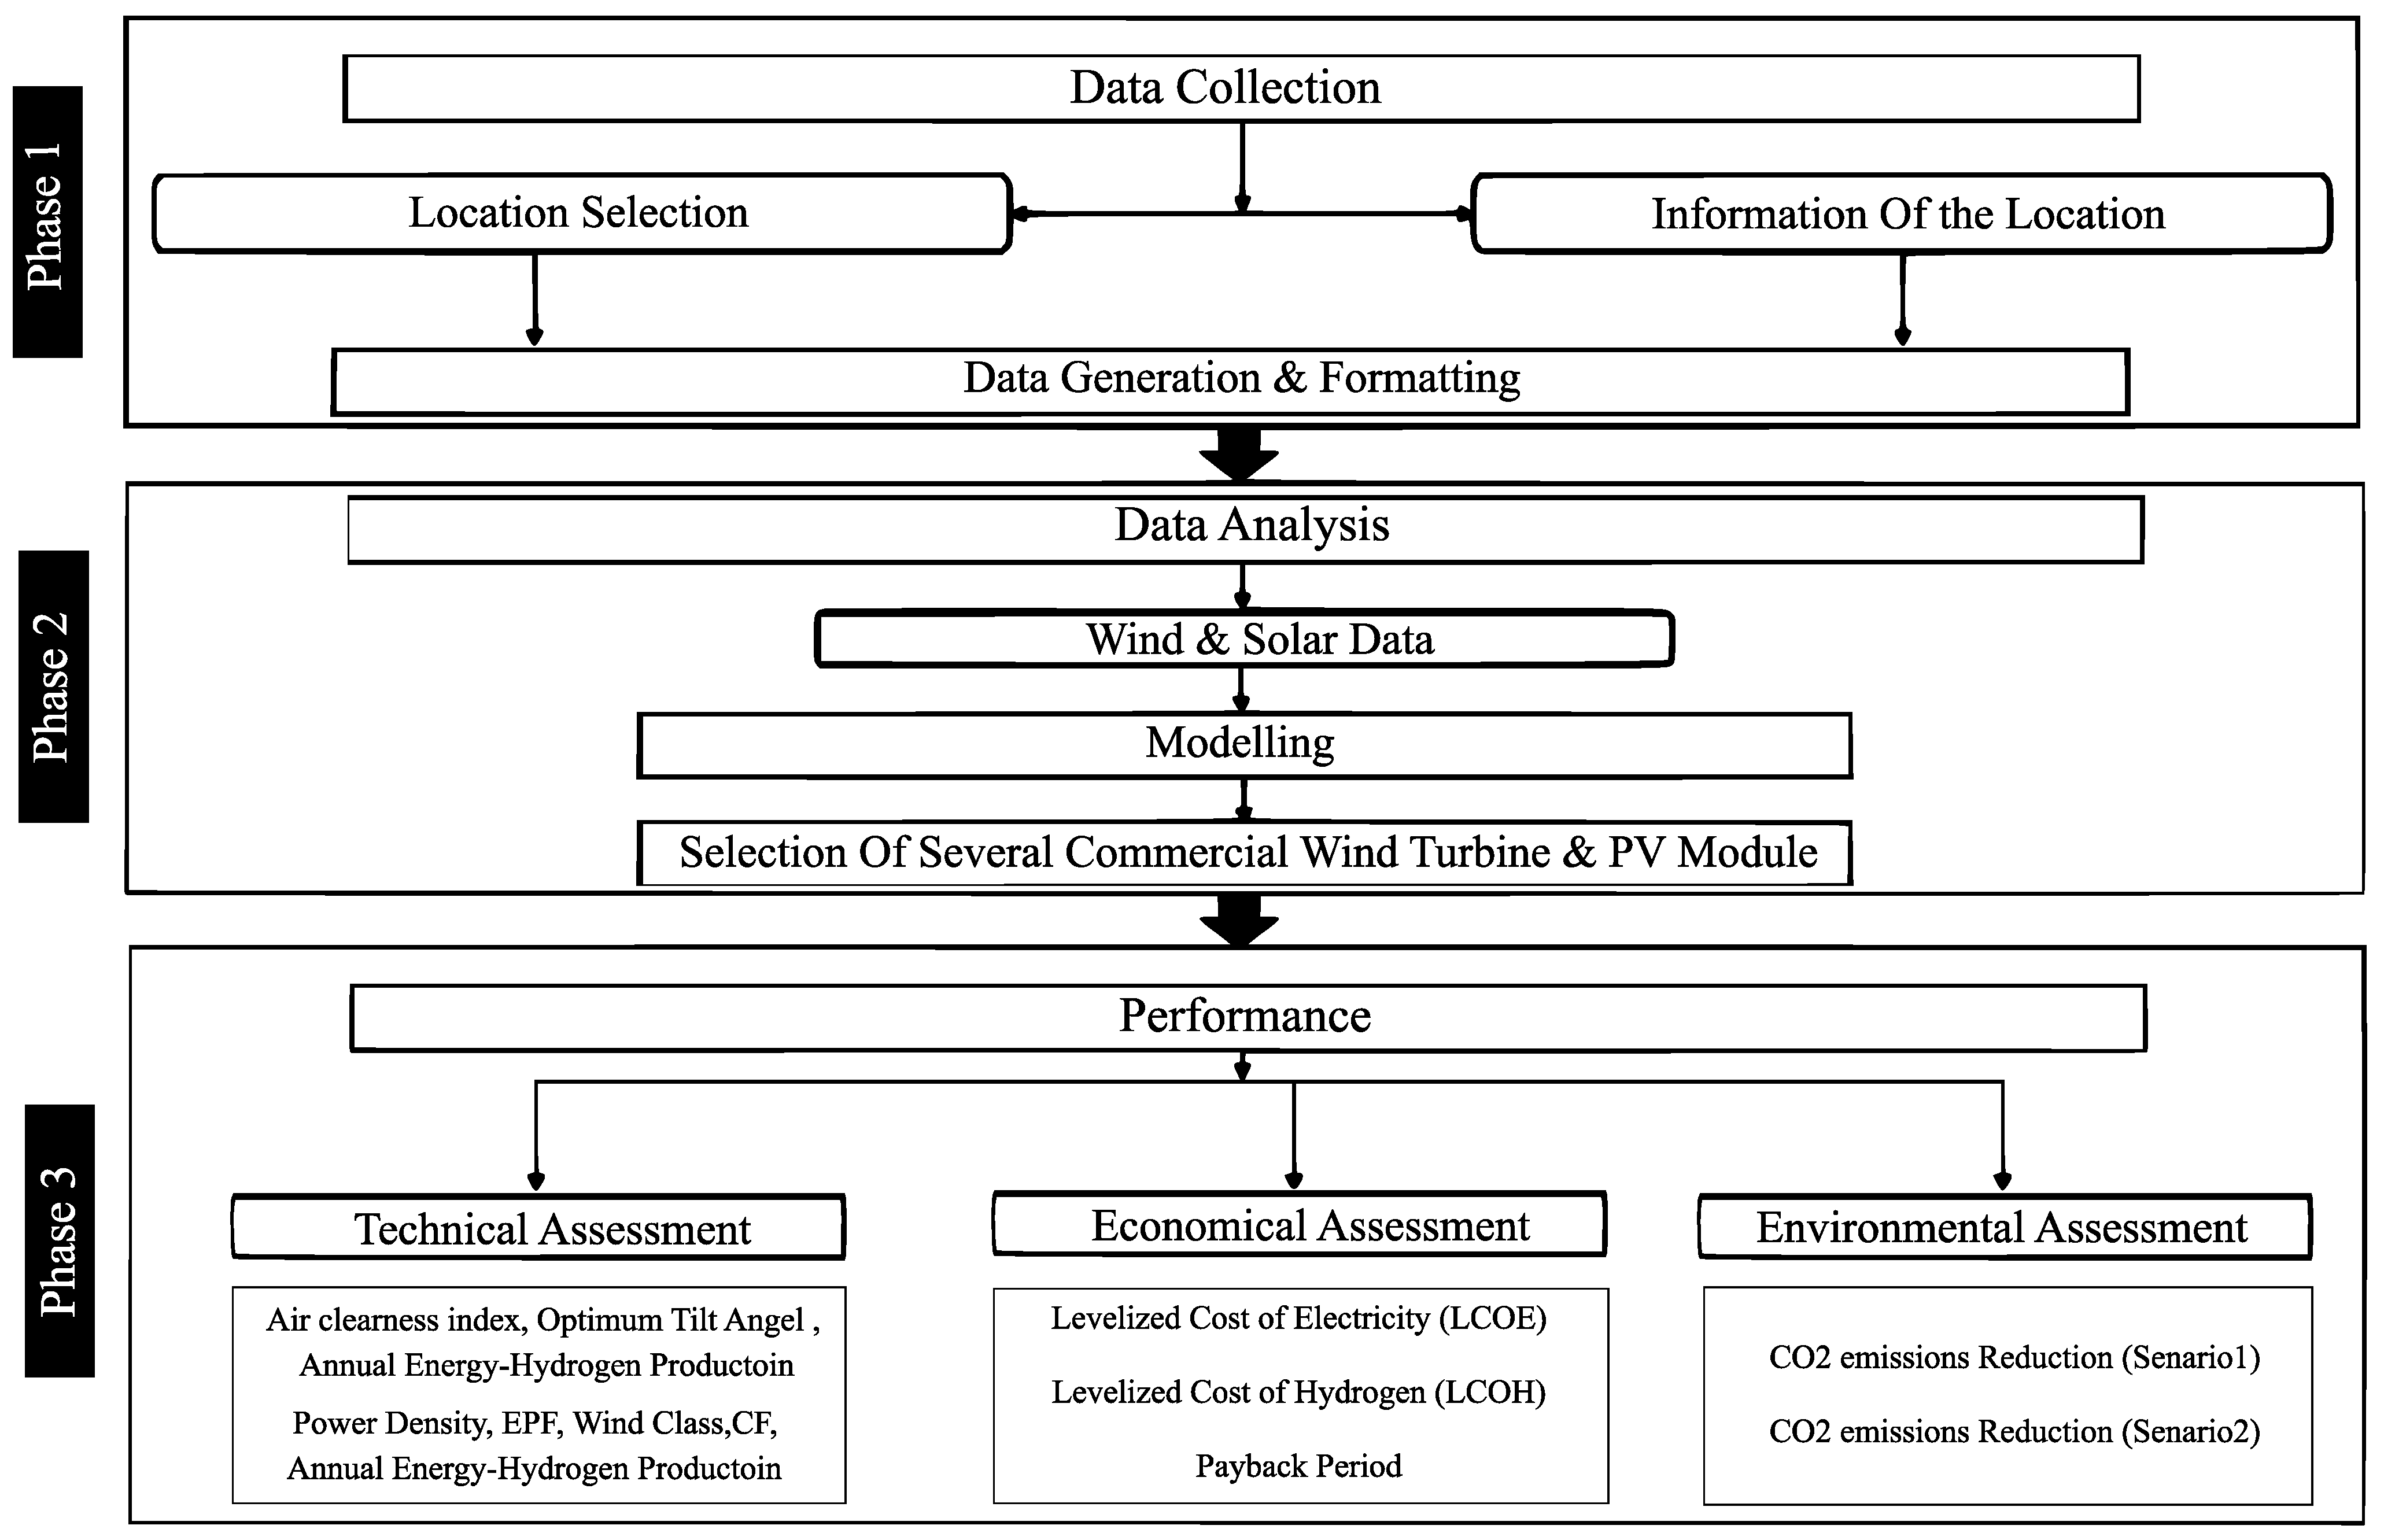
One of the important tasks to perform before starting any project or business is to conduct a feasibility study to see if investing resources in the concept is financially viable [15,16,17]. The main goal of this study is to assess the viability of generating power from renewable wind and solar energy and then to investigate the production of clean hydrogen fuel from various technical, economic, and environmental perspectives in the Helmand province of Afghanistan.
The present study contributes to the literature in several ways. Most importantly, this is the first economic and environmental feasibility study of renewable power and hydrogen production in any part of Afghanistan. In addition, this is the first time that the 20-year averages of wind speed and solar radiation records are used to examine the renewable energy potentials of the area of interest to help Afghan energy policymakers weigh their options with regard to investment in renewable energy sources. The paper also provides a series of GIS maps, which can facilitate the site location of renewable energy projects.

2. Review of Literature

Rising concerns about the environmental impacts of fossil fuels have created a strong impetus for transition to cleaner energy sources and, specifically, renewable energies, such as wind and solar, which are widely available all over the world and can serve as sustainable energy sources without the disadvantages of fossil fuels. Recent years have also seen a growing interest in the use of hydrogen as a clean substitution for fossil fuels. Traditionally, hydrogen is mostly used in the production of ammonia, methanol, and other chemical compounds, as well as in soil enrichment, but it has a promising future as a clean energy carrier.
In recent decades, many studies have investigated the viability of wind power generation projects in different parts of the world. For example, Mostafaeipour et al. [18] investigated the viability of generating wind power in Binalood, Iran. Wind speed data from a station at Binalood were used to assess wind power at three heights of 10, 30, and 40 m in this study. This study reported that the density of wind power in the studied area was 305,514 W/m2 at a height of 40 m, which provides an excellent possibility for producing power from wind energy. In another study, Using the Weibull function, the economic and technical feasibility of generating electricity from renewable wind energy in Shahr-e Babak in Iran was evaluated by Mostafaeipour et al. [19]. After analyzing the wind data of a station in the area, they reported that the wind power of the area is weak and could be better harvested with small wind projects. They identified a 10 kw wind turbine as the best choice for the area and conducted an economic assessment accordingly. The results showed that the cost of electricity produced by such a project would be 0.18 $/kWh. Hulio et al. [20] assessed the viability of wind power production in Hawke’s Bay, Pakistan. This assessment was carried out using data collected from a single station at three heights of 30, 60, and 80 m for five wind turbines ranging in size from 1650 to 2750 kW and with hub heights ranging from 80 to 103.6 m. This study’s techno-economic analyses revealed that the best wind power density is 307.5 W/m2 at a height of 80 m, based on which the minimum cost of electricity generation by the considered wind turbines would be 0.056 $/kWh. Alkhalidi et al. [21] presented a technical examination of offshore wind energy generation in Kuwait in their study. For this purpose, they used the wind data of 10 stations to estimate wind energy at four altitudes of 50, 80, 100, and 120 m. Baseer et al. [22] performed a technical assessment of wind power generation in the industrial city of Jubail in Saudi Arabia. The assessment was done using wind data from nine stations at three different heights of 10, 50, and 90 m and with five wind turbines with nominal powers ranging from 1800 to 3300 kW and hub heights ranging from 75 to 119 m. In this study, the highest wind power density was 168.46 W/m2 at a height of 90 m, and the highest wind turbine capacity factor was 25%. Arslan [23] analyzed the environmental, economic, and technical feasibility of generating power from wind energy in Kutahya, Turkey. This examination was done based on the wind data of one station in the area for six types of wind turbines with nominal powers of 200–1500 kW. Bahrami et al. [24] assessed the economic and technical viability of generating power from wind energy in Uzbekistan. After a technical evaluation of 17 different sites, they reported that only four of these sites were eligible for economic evaluations. Mostafaeipour et al. [25] studied the viability of electricity production from wind energy in South Africa. It was reported that wind power generation at Port Elizabeth will have the lowest LCOE, and the minimum cost of generated power will be 0.363 $/kWh if EOLO wind turbines are used.
Many studies have also investigated the feasibility of solar power generation in different parts of the world. In Iran, Firouzjah [26] assessed the economic and technical viability of solar power generation in 15 cities using solar panels with fixed tilt angles and capacities of 1, 5, and 10 kWh. This assessment showed that solar power generation is more economically feasible in the southern parts of Iran. In a technical assessment of solar energy in Pakistan, Tahir and Asim [27] estimated the average annual global horizontal irradiance of the whole country to be 5.30 kWh/m2 a day. In a feasibility study of solar energy in Saudi Arabia, Almasoud and Gandayh [28] reported that the power generated by solar energy in this country can cost less than the electricity generated by fossil fuels if one factors in the medical costs arising from air pollution. In a technical–economic–environmental assessment of PV systems in Kuwait, Ramadhan and Naseeb [29] used the data of one station to examine and compare the feasibility of four PV plants with capacities of 1 to 100 MW. Their results showed that in the case of using the 1 MW system, the cost of electricity will be 0.2 $/kWh. Altarawneh et al. [30] conducted a technical assessment to estimate the potential of generating power from solar energy in the Ma’an region of Jordan. This study’s findings revealed that the average global irradiance in this region is 6.5 kWh/m2, and that to reach proper efficiency, the angle of PV panels should be changed four times a year. In a study by Anwarzai and Nagasaka [4], the GIS method was used to undertake a technical analysis of solar and wind energy in Afghanistan. These researchers also used the SAM (System Advisor Model) to determine the preferred CSP technologies based on annual power output. Nematollahi and Kim [31] assessed the potential for solar power generation in South Korea and produced a series of GIS maps for annual horizontal irradiance and sunshine hours in this country.
Many believe that hydrogen can serve as an ideal carrier for the energy produced from various renewable sources, such as solar and wind, without CO2 emissions [32,33]. The conversion of renewable power into hydrogen turns the haphazardly available renewable energy into a stable environmentally friendly fuel that can be consumed anytime and anywhere. Many investigations have been done on the generation of hydrogen from renewable energy sources, particularly solar and wind. In one of these studies, in four places in Iran’s Fars province, Mostafaeipour et al. [34] discussed the feasibility of generating hydrogen from wind energy. This study revealed that among the four selected locations, the best one is Abadeh (with an average annual density of 220 W/m2), where a 900 kW wind turbine can generate the power needed to produce hydrogen fuel for 22 small vehicles. Nematollahi et al. [35] made an economic and technical assessment for producing hydrogen from solar energy in Iran’s Sistan and Baluchestan provinces. They reported that a 900 kW turbine built in this area can generate power for producing 39.2 tons of hydrogen a year. Al-Sharafi et al. [36] studied the possibilities for hydrogen generation in the Dhahran, Riyadh, Jeddah, Abha, and Yanbu regions of Saudi Arabia using wind and solar energy. They estimated the unit cost of hydrogen production in these areas to be $1.43 per kilogram. In a study by Iqbal et al. [37], they evaluated the potential for wind-powered hydrogen production in eight sites located in the Sindh province of Pakistan. The economic assessments of this study were performed with the assumption of using a 2500 kW turbine. This study reported that using wind power, Pakistan can produce 51,917 tons of hydrogen per day. Jahangiri et al. [38] evaluated the environmental, economic, and technical viability of electricity generation and hydrogen production from solar/wind sources in Qatar. In a study by Mostafaeipour et al. [6] on geothermal-powered hydrogen production in Afghanistan, they identified 17 locations in Afghanistan that are suitable for this purpose.
Despite the multitude of studies on the feasibility of wind and solar power generation around the world, including the neighbors of Afghanistan (Table 1), unfortunately, no study has been conducted on the feasibility of common renewable sources within this country. As the above literature review shows, so far, no study has been conducted on the environmental and economic feasibility of renewable energy for producing hydrogen and power in any part of Afghanistan. This paper aims to address this gap in the literature by presenting a technical, environmental, and economic feasibility evaluation of the production of power and hydrogen from solar and wind energy in the Helmand province of Afghanistan.

3. Study Area

This study is focused on the Helmand province of Afghanistan, which was chosen because of its geographical, social, and economic situation, as well as its renewable potential. The Helmand province stretches from the center to the south of the country at 31.36 N and 63.96 E. Helmand is Afghanistan’s biggest province, covering 58,584 km2. This province has a population of approximately 1,442,500 people, who live in 13 cities and over 1000 villages [39]. While the Helmand River flows from the north to the southwest of the province, the province is mostly covered by drylands.
The geographical location and features of the solar and wind data collection sites are shown in Table 2. The location of these stations is displayed in Figure 4.
The required data in terms of geographical coordinates, altitude, solar radiation, and wind speed were collected from the 20-year average data from NASA satellites [40]. Satellite measurements were used because, unfortunately, the meteorological stations of Afghanistan do not have the necessary tools or the trained personnel to measure the needed solar and wind data [41]. Another reason for using satellite data was the high probability of encountering missing data or incorrect measurements as a result of inadequate maintenance and calibration of solar sensors and other instruments [41].

4. Methodology

In the present study, wind/solar/hydrogen sources and their corresponding systems (wind turbines, photovoltaic panels, and electrolyzers) were analyzed in three stages, each consisting of a set of steps that were structured as shown in Figure 5. The methods and formulas used in the technical, economic, and environmental analyses are explained in Section 4.1, Section 4.2, Section 4.3, Section 4.4, Section 4.5 and Section 4.6, and the results of these analyses are presented in Section 5.

4.1. Solar Energy Modeling

PV panels are often installed with a tilt to increase their power generation efficiency and, therefore, their economic output. Solar radiation received on an inclined surface can be estimated by several models, ranging from simple isotropic to sophisticated anisotropic models. The efficiency of PV panels can be improved by equipping them with active solar trackers, but these trackers need their own power supply and require a notable amount of extra investment. Furthermore, tracker-equipped PV systems may not be suitable for remote areas where the technical expertise needed for repair and maintenance may not be easily accessible [42]. Therefore, this study assumed that all PV panels will have a fixed tilt.
The difference between solar irradiance above the atmosphere and below it is called the clearness index, which is expressed by Equation (1) [43]:
K T ¯ = H ¯ H 0   ¯
where H ¯   is the monthly average GHR and H 0   ¯   is the irradiance at the same place without the effect of the atmosphere, which is obtained as follows [43]:
G o n = G s c [   1 + 0.033   C o s ( 360 n 365 ) ] C o s   θ z
Here, G s c   is the solar constant, which is equal to 1364 W/m2, and n is the number representing the day of the year (for 1 January, n = 1). The angle between the sun’s ray and the vertical axis, which is called the zenith angle, is given by [43]:
C o s   θ z = S i n ( δ ) S i n ( ϕ ) + C o s ( δ ) C o s ( ϕ ) C o s ( ω )
where δ is the declination angle and ϕ is the latitude angle, which can be obtained from Equation (4) [43]:
δ = 23.45   S i n ( 360 284 + n 365 )
Here, ω is the hour angle, which is calculated by multiplying the hour difference from noon by 15 degrees. The angle of sunrise and sunset for θ z = 90 is given by Equation (5) [43]:
ω s = C o s 1 ( tan ϕ tan δ )
Therefore, the length of the day is determined by Equation (6) [43]:
t = 2 15 ω s
The integral of Equation (2) from sunrise to sunset gives daily irradiance as Equation (7) [43]:
H 0 = 24 π   G s c [ 1 + 0.033 C o s ( 360 n 365 ) ] [ C o s ϕ   C o s δ   S i n ω s + 2 π ω s 360   S i n ϕ S i n δ ]
Here, H 0   is in Wh/m2day. Therefore, the air clearness index can be obtained by merging this equation with Equation (1).
The hourly beam radiation on an inclined surface, BT, can be obtained as follows [43]:
B T = I B   cos ( θ )
where θ is the angle of incidence and IB is the hourly beam radiation on the horizontal surface, which can be obtained from the following equations [43]:
cos ( θ ) = cos θ z cos β + sin θ z sin β   cos ( γ s γ )
γ s = s i g n   ( ω ) | cos 1 ( cos ( θ z ) s i n ϕ sin δ sin ( θ z ) cos ϕ ) |
where ϕ is the latitude angle, θ is the angle of incidence, δ is the declination angle, θz is the zenith angle, γ s is the solar azimuth angle, β is the tilt angle, and the angle of hour is ω. The component of the reflection of the radiation on the inclined surface, RT, is given by [43]:
R T = α I 0 1 cos ( β ) 2
where α is the surface albedo, which is assumed to be 0.2, and I0 is the total radiation incident on the horizontal surface. The diffusion component of the radiation on the inclined surface, DT, is obtained using the isotropic model of Liu and Jordan as follows [44]:
D T = I D ( 1 + cos ( β ) 2 )
where ID is the hourly diffuse radiation on the horizontal surface. The total radiation incident on the inclined surface is given by [43]:
I T = B T + R T + D T
In solar radiation calculations, the goal is to find the tilt angle (β) that optimizes the power output. The optimal β is crucial to the functioning of a solar PV system.
The amount of PV energy that can be drawn from solar radiation received on an inclined surface can be obtained from the following equation [43]:
E P V = A P V   η P V   η i n v   L o t h e r   I T
where EPV is the power production from the PV module, APV is the PV module area, and ηPV is the PV module’s efficiency. In this study, the impact of ambient temperature on the power production is ignored.

4.2. Wind Energy Modeling

The most widely used probability distribution function for statistical analysis of wind data is the Weibull function [40]. This function can be used to easily estimate the average annual power production from a turbine based on the measurement of wind data. The Weibull probability distribution function is calculated as follows [45]:
f ( v ) = k c   ( v c ) k 1 exp ( ( v c ) k )
where v, k, and c are the wind speed, scale factor, and shape factor, respectively. The equations of scale factor and shape factor are as follows [12]:
c = v ¯ Γ ( 1 + 1 k )
k = 0.83 v ¯ 0.5  
where v ¯ is the average speed of wind at the altitude of the hub of the turbine and the gamma function, denoted by the letter Γ, is defined as [12]:
Γ ( x ) = 0 e u u x 1 d u
The cumulative distribution function is formulated as follows [12]:
F ( v ) = 1 exp ( ( v c ) k )
With the wind speed at one altitude, the wind speed at the altitude of the hub of the turbine can be calculated by the following formula [12]:
v 2 = v 1 ( h 2 h 1 ) c o f
c o f = 0.37 0.088   ln ( v 1 ) 1 0.088 ln ( h 1 10 )  
where v2 is the speed of wind at the altitude of the turbine hub (h2) and v1 is the measured speed of wind at the altitude h1.
One of the most important parameters in the aerodynamic design of turbine blades is the energy pattern factor, which can be obtained from the following formula [12]:
k e = U 3 ¯ U ¯ 3 = Γ ( 1 + 3 k ) Γ ( 1 + 1 k )
The most probable wind speeds and the wind speed that carries the maximum power, V F , m a x (m/s) and V E , m a x (m/s), can be defined as follows [46]:
V F , m a x = c   ( k 1 k ) 1 k
V E , m a x = c   ( k + 2 k ) 1 k
The speed of wind must be greater than the cut-in speed for the wind turbine to activate. The probability of wind speed exceeding the cut-in speed of 5 m/s is [46]:
p ( 5 m s < V ) = 5 p ( V ) d V
The amount of energy that can be harvested at a location can be estimated based on wind power density per unit area, as formulated below [46]:
P ¯ A = 1 2   ρ c U 3 p ( U ) d U = 1 2   ρ   v 3 ¯ = 1 2   ρ   c 3 Γ ( 1 + 3 k )
where ρ is the density of air and, under standard conditions, is determined to be 1.225 kg/m3. The following equation gives the amount of wind energy for a certain duration of time [46]:
E ¯ = P ¯ ( N .   Δ t )  
where ∆t is the time step and N is the number of measurements.
The capacity factor (CF) of a wind turbine is the ratio of the power produced by that turbine to its rated power. This factor can serve as an index of the efficiency of a wind turbine that is installed in an area (the higher the CF, the better the efficiency). The CF of a turbine is calculated as the proportion of its power output to its rated power ( P r ), as formulated below [46]:
C F = P o u t P r = e ( v i c ) k e ( v r c ) k ( v r c ) k ( v i c ) k e ( v 0 c ) k

4.3. Hydrogen Output Estimation

Hydrogen has attracted a lot of attention as a promising alternative energy carrier for clean transportation. Hydrogen production from renewable energies is an interesting discussion in the field of renewable energy development [6,33]. The reason for why many researchers and investors are attracted to this discussion is the immense potential for clean hydrogen production with the power coming from on-grid or off-grid renewable power generation systems. The following equation [33] can be used to estimate the quantity of hydrogen that a renewable-powered electrolyzer can produce:
H W T , P V = E W T , P V E c e l   η c o n v
where η c o n v is the rectifier efficiency, which is usually between 80 and 95 percent, and the electrolyzer’s electricity consumption is E c e l , which is approximately 5–6 kWh/m2 [46].

4.4. Economic Assessment

In the present study, economic analyses were performed in terms of LCOE, which is widely used and accepted in the literature [45,47,48]. In other methods of calculating the LCOE, inflation and interest rates are not taken into account, and the relationship between inflation and interest rates is taken into account in the calculations [49]. The following formula was used to calculate the LCOE [12,45]:
L C O E ( i n $ k W h ) = C I + i = 1 n O M + R E P ( 1 + f 1 + r ) i i = 1 n E W T , P V
where i is the year, n is the life cycle of the wind turbine, OM is the maintenance cost, CI is the initial cost of the wind farm, REP is the replacement cost, E W T , P V is the power output of the wind turbine or solar panel, r represents the interest rate, and f is the inflation rate. The values assumed for the economic parameters are shown in Table 3.
For the economic evaluation of hydrogen output, the index LCOH (in $/kg) was calculated with the following equation [52]:
L C O H ( i n $ k g ) = C e l e c t r o l y z e r + C e l e c t r i c i t y i = 1 t M h y d r o g e n
The total quantity of hydrogen generated in the years of electrolyzer operation is the denominator of the aforementioned fraction. C e l e c t r o l y z e r and C e l e c t r i c i t y are given by [52]:
C e l e c t r o l y z e r = L C O E   i = 1 n E W T 20  
C e l e c t r i c i t y = C u .     e l e c t r o l y z e r   × M h y d r o g e n × E e l e c t r o l y z e r t × 8760 × C F × η e l e c t r o l y z e r  
where cue and eta are the unit price and efficiency of the electrolyzer. Since electrolysis is of the alkaline type, the efficiency of the electrolyzer was assumed to be 75% [52].

4.5. CO2 Emission Reduction

Greenhouse gas emissions are among the primary causes of ozone layer depletion, as well as climate change. Among these emissions, carbon dioxide is mostly produced by the combustion of fossil fuels and has the greatest impact on environment. Power plants typically burn oil or natural gas as fuel with CO2 production of 77 t/TJ and 55.8 t/TJ, respectively [56]. As a result, CO2 emission reduction due to the use of renewable energies can be estimated in two scenarios: one where the renewable power replaces the electricity output of oil-burning plants, and another where it replaces the electricity output of natural gas-burning plants.

4.6. GIS Maps

Over the years, GIS maps have been used in a wide variety of studies for different purposes. With the development of computer technologies, it is now possible to combine multiple GIS maps for even better analyses. Because measuring all variables of interest at all sites is challenging, it is common to make measurements on regular grids and produce estimates for off-grid points by interpolation or extrapolation. Among the most effective interpolation methods is Inverse Distance Weighting (IDW) [57], which is widely used in renewable energy assessments. IDW involves using linearly weighted interpolation of measurements to produce estimates for points where no direct measurement is available.

4.7. The Hybrid MCDM Methods

Prioritization of sites for producing hydrogen from wind/solar energy was performed using the SWARA–WASPAS method. The SWARA method was used for evaluating criteria and the WASPAS method was used for prioritizing sites. Therefore, the equations used in these methods are as follows.

4.7.1. SWARA Method

The SWARA method was introduced by Keršuliene et al. [58] as one of the MCDM methods for weighing criteria. The advantages of this method over other weighting methods such as AHP and ANP are its low incompatibility rate due to the lack of pairwise comparisons, the lack of a limit in the number of criteria, the evaluation of the accuracy of decision makers’ opinions, and the simplicity of the method [59]. The steps of the SWARA method include determining the order of importance of the criteria, determining the relative preference of each criterion ( S j ), calculating the relative preference of each criterion, measuring the initial preference of each criterion ( q j ), normalizing the weights, and measuring the final weight of the criteria ( w j ) [58].

4.7.2. WASPAS Method

The steps of this method are as follows [60]:
  • First, the decision matrix is formed:
    X = [ x 01 x 0 j x 0 n x i 1 x i j x i n x m 1 x m j x m n ] i = 0 , m ¯ ;     j = 1 , n ¯
    where m is the number of options, n is the number of criteria, and xij indicates the score of the ith option on the jth criterion. x0j represents the optimal value for the jth criterion and is defined as follows:
    x ¯ i j = x i j m a x i   x i j   f o r   P o s i t i v e   C r i t e r i a   ,     x i j = m i n i   x i j x i j *     f o r   C o s t   T y p e   C r i t e r i a  
  • The normalized decision matrix is as follows:
    X ^ q = [ x ^ 11 x ^ 1 j x ^ 1 n x ^ i 1 x ^ i j x ^ i n x ^ m 1 x ^ m j x ^ m n ]     ; x ^ i j = x ¯ i j w j     ,   i = 1 , m ¯ ;     j = 1 , n ¯  
Normalization of each matrix element is done as follows:
x ¯ i j = x i j m a x i   x i j   f o r   P o s i t i v e   C r i t e r i a     ,   x i j = m i n i   x i j x i j *     f o r   C o s t   T y p e   C r i t e r i a  
3.
Calculate the decision matrix from the WSM decision method:
X ^ q = [ x ^ 11 x ^ 1 j x ^ 1 n x ^ i 1 x ^ i j x ^ i n x ^ m 1 x ^ m j x ^ m n ]     ; x ^ i j = x ¯ i j w j ,         i = 1 , m ¯ ;     j = 1 , n ¯  
where w is the weight of each criterion; in the present study, it was assumed that all criteria have the same weight. Calculate the decision matrix from the WPM decision method:
X = p = [ x = 11 x = 1 j x = 1 n x = i 1 x = i j x = i n x = m 1 x = m j x = m n ]     ; x = i j = x ¯ i j w j ,       i = 1 , m ¯ ;     j = 1 , n ¯  
4.
Calculate the value of the optimal function:
Q i = j = 1 n x ^ i j , i = 1 ,   m ¯   ,     P i = j = 1 n x = i j , i = 1 ,   m ¯  
5.
Option scores:
W P S i = 0.5 j = 1 m Q i + 0.5 j = 1 m P i    
6.
Prioritization of options: In the WASPAS method, the options are ranked based on the WPSi values.

5. Analysis

In this study, the potential for generating power and hydrogen from solar and wind resources in the Helmand province of Afghanistan was investigated from technical, economic, and environmental perspectives. In this section, the results of this investigation are presented in three subsections. Section 5.1 examines the feasibility of generating power and hydrogen from renewable solar energy from technical, economic, and environmental perspectives, and Section 5.2 does the same for wind energy. In the end, Section 5.3 presents the GIS maps of wind energy, solar energy, and potential for producing hydrogen in the research area.

5.1. Solar Energy

Table 4 shows the average, minimum, and maximum annual horizontal global irradiance in the studied stations. As can be seen, all three stations have an average solar irradiance of over 400 W/m2, which indicates the more or less suitable conditions of this region for harvesting solar energy. As shown in Table 4, the best and worst stations in terms of average annual solar irradiance are Sangīn and Laškar Gāh, with an average annual irradiance of 455 W/m2 and 431.7 W/m2, respectively. However, the highest irradiance belongs to Deh Šū, where the irradiance reaches as high as 620 W/m2 in June. The lowest irradiance, 248.3 W/m2, also belongs to Laškar Gāh. However, it is not possible to confidently say which station is the most suitable in the area without further evaluation.
The one-year diagrams of solar irradiance in each of the studied stations are plotted in Figure 6. As expected, the peak solar radiation (SR) occurs in June. These peak values are given in Table 4.
Table 5 shows the monthly averages of the clearness index at each location. As the table shows, the highest clearness index, 0.668, belongs to Sangīn in September, and the lowest, 0.463, belongs to the same station in March. As can be seen, there is a very large difference between the highest and lowest clearness index values of Sangīn station in different months.
The results of the assessment of solar energy for tilt angles of 0–90 degrees are shown in Figure 7. As these results show, the optimal tilt angles for the Deh Šū, Laškar Gāh, and Sangīn stations are 29.2, 30.6, and 30.3 degrees, respectively. Installing PV panels with these tilt angles rather than horizontally will improve the annual solar power output by 10.95% in Deh Šū, 12.08% in Laškar Gāh, and 11.85% in Sangīn.
The amount of electricity that can be generated at each station was estimated for four types of PV panels with specifications given in Table 6.
In this study, it was assumed that 2000 panels will be used in each station. Since PV panels generate DC power, the solar power generation system must also be equipped with a DC-to-AC inverter. The specifications of the considered inverters are given in Table 7.
Since sunlight is only available during the day hours, to estimate the total energy radiated to the panels over a one-year period, the total radiation reaching the inclined panel at different times of the day in different months must be estimated. Table 8 shows the power output of each considered panel at each station, the resulting environmental impact, and the amount of hydrogen that can be produced from the generated power. As can be seen, the 600 kW module (Panel No. 4) has a higher solar power output, hydrogen output, and CO2 emission reduction than the other modules, which can be attributed to its higher nominal power. Among the stations, Laškar Gāh has the highest solar power output and hydrogen output, which reflects its high solar energy potential. Using the 600 kW PV module in this station will result in a CO2 emission reduction of over 350 tons.
The findings of the economic investigation of using PV modules in each station are shown in Table 9. In terms of the price of solar power generated at each station, the lowest price, 0.0648 $/kWh, belongs to Laškar Gāh, and the highest price, 0.0684 $/kWh, belongs to Deh Šū. As mentioned earlier, the official price of renewable energy in Afghanistan is $0.15 per kilowatt-hour. Therefore, the solar power produced in these stations will be at least twice as cheap as the official price. Similar conclusions can also be made for hydrogen production in these stations. The longest payback period of these plants will be 6 years, which again shows how economical it is to invest in these projects.

5.2. Wind Energy

Figure 8 depicted the monthly variation of wind speed at three heights in the three stations. As can be expected, the wind speed rises with increasing altitude (because of the diminishing effect of the boundary layer). The highest wind speed at all three stations occurred in June.
The characteristics of wind at the three altitudes of 10, 30, and 50 m are reported in Table 10 and Table 11. Table 10 shows the nominal velocity and the parameters of the Weibull distribution function for the three altitudes. As can be seen, the average wind speeds indicate that this region certainly has good possibilities for generating hydrogen and power from wind energy resources. Among the three stations, Sangīn has the highest average wind speed.
Other wind characteristics are given in Table 11. The probability of wind speed exceeding 5 m/s is one of the most crucial parameters in feasibility assessments of wind energy projects. In all three stations, this probability is over 68% for a height of 50 m and over 60% for a height of 30 m, which shows the high potential for wind power generation in this area.
Table 12 shows the wind power and density values estimated with the Weibull probability distribution function. The estimates for the height of 40 m are larger than those for the height of 30 m, which is expectable because wind speed increases with height. As shown in Table 12, among the three stations, Sangīn has the highest wind density as well as the highest wind power (450.1 W/m2 at a height of 50 m).
For a more accurate assessment of wind power based on heights, we used the classification table of Elliott and Schwartz [61], which is provided in Table 13. The classes of wind power in the studied stations according to this classification are shown in Figure 9.
As shown in Figure 9, the wind powers of Sangīn and Laškar Gāh stations at a height of 50 m fall into Class 4, and the worst station in this respect is Deh Šū, which falls into Class 3. These results demonstrate the suitability of the area for wind power generation.
The quantity of wind power that can be produced at each station was estimated for eight wind turbines with the specifications given in Table 14. These turbines were chosen from among the 150–2500 kW products of well-known companies.
Table 15 shows the power output of each considered turbine at each station, the environmental impact of this power production, and the quantity of hydrogen that can be generated from the produced power. As expected, Sangīn has a higher wind power output than the other two stations. The greatest amount of power and hydrogen production due to higher nominal capacity was related to Turbine 8. However, the energy conversion efficiency of this turbine is not the most suitable compared to other turbines. The best wind turbine for all stations is the 900 kW model because it has a higher CF. The highest annual power production from wind, 3.2 GWh, can be accomplished by installing the 900 kW turbine in Sangīn. In contrast, the lowest annual wind power output, 233.3 MWh, happens if the 150 kW turbine is installed at the Deh Šū station. Similar results were obtained for hydrogen production and CO2 emission reduction. In this case, the highest annual hydrogen output and CO2 emission reduction were estimated to be 52.2 tons and 892.6 tons, respectively.
Table 16 shows the LCOE and LCOH values calculated for the three stations. The average LCOE obtained for the 900 kW turbines (code 6) is 0.0573 $/kWh. The highest LCOE, 0.1320 $/kWh, was obtained for the case where the 150 kW turbine is installed in the Deh Šū station. Similar results were obtained for the LCOH. Next, a revenue–cost chart was plotted to estimate the payback period of wind power generation in each station. As the results show, it was estimated that the longest payback period will be 12 years and the shortest will be only 3.1 years.
While, according to [62], the price of hydrogen varies in the range of 4.78–5.84 $/kg-H2, the LCOH of the considered wind-powered and solar-powered hydrogen production plants will be much lower than this price, which clearly shows the economic feasibility of hydrogen production in the study area.

5.3. GIS Maps

Figure 10 shows the GIS maps obtained for solar irradiance, solar power generation, and solar-powered hydrogen production using the IDW-based interpolation method. As can be seen, the central parts of the province have greater possibilities for producing hydrogen and power from solar energy.
Figure 11 shows the wind-related GIS maps. Because of the similarity of wind distribution patterns for different heights, only wind speed and density maps for a height of 50 m are presented. Please note that all power output and hydrogen output maps are all based on the most suitable turbine for the area, i.e., the 900 kW model. These results show that the northern parts of the province have a better possibility for generating hydrogen and power from wind resources.
In general, from an exclusively technical perspective, the most suitable place for building a wind power plant is the northern part, the most suitable place for building a solar power plant is the central part, and the most suitable place for building a hybrid solar–wind power plant is the central-northeastern part of the province. Providing location recommendations based on other criteria requires an MCDM analysis, which is discussed in Section 5.4.

5.4. MCDM Analysis

The SWARA–WASPAS hybrid MCDM method was used to evaluate the choice of a suitable location for the construction of wind/solar power plants from different perspectives. Table 17 shows the criteria for evaluating suitable locations. As it turns out, six criteria were considered from different technical, economic, and environmental perspectives. The results of the SWARA evaluation showed that the economic criterion was the most important criterion, and the environmental criterion was the least important criterion.
The results of the evaluation of a suitable location for the construction of a wind/solar power plant in Helmand province for hydrogen production are shown in Table 18. The presented results are based on three aspects: technical, economic, and environmental. As is known, Sangīn is the most suitable place for the construction of a wind hydrogen power plant and Laškar Gāh is the most suitable place for the construction of a solar hydrogen power plant.
In general, an in-depth assessment for the development of renewable energy in the Helmand province in Afghanistan was performed. Limited studies have examined solar and wind energy in Afghanistan. In general, according to the study of Jahangiri et al. [9], there is a lot of potential for wind and solar energy in this region. However, in the present study, a more accurate atlas of wind and solar energy is presented for this region. The most important part of the present assessment is the economic assessment for electricity, especially hydrogen generation. For this purpose, the price of hydrogen produced from renewable energy sources in different parts of the world is shown in Table 19. The comparison shows that the price of hydrogen produced in this region is less than the previous studies and that this region is suitable for the development of renewable energy.

6. Conclusions

This research is a comprehensive study that includes comprehensive analyses, such as an environmental analysis and economic and technical analyses of renewable energy sources for generating power and hydrogen in the Helmand province of Afghanistan. First, the feasibility of solar and wind energy sources in three stations located in this province was investigated; then, GIS maps of each energy source were prepared and the suitable areas for building wind or solar power plants were determined. For all stations, an economic assessment was also performed for a range of wind turbines and PV panels. The results show that the production of power and hydrogen from wind and solar energy in the province is economically viable. In addition to being economically justified, implementing such projects in the region will have significant environmental benefits. This study can serve as a roadmap for building hydrogen production plants powered by wind power stations (wind hydrogen), solar power stations (solar hydrogen), or a combination of both (solar–wind hydrogen) in the Helmand area. The hybrid SWARA–WASPAS MCDM method was used to evaluate the choice of a suitable location for the construction of wind/solar power plants from different perspectives. A summary of the most important results of this study is provided below:
  • The optimal tilt angle of PV panels (to maximize power and hydrogen output) in the study area was 30 degrees (Figure 7).
  • With a power output of 1302 MWh and a hydrogen output of 21.08 tons a year, solar energy generation with 600 kW modules in the study area will be technically and economically justified (Table 8).
  • The price of renewable power generated in this area will be 0.0648 $/kWh, which is twice as cheap as the official tariff of renewable power in Afghanistan. The payback period of these projects will be about 6 years, which reflects its economic feasibility (Table 9).
  • The region has significant wind energy potential, which can be exploited to produce 3222.2 MWh of wind power and 52.158 tons of hydrogen per year (Table 15).
  • Wind power generation in the region is also economically justifiable, as the price of generated electricity will be 0.0573 $/kWh and the payback period of the projects will be between 3 and 13 years (Table 16).
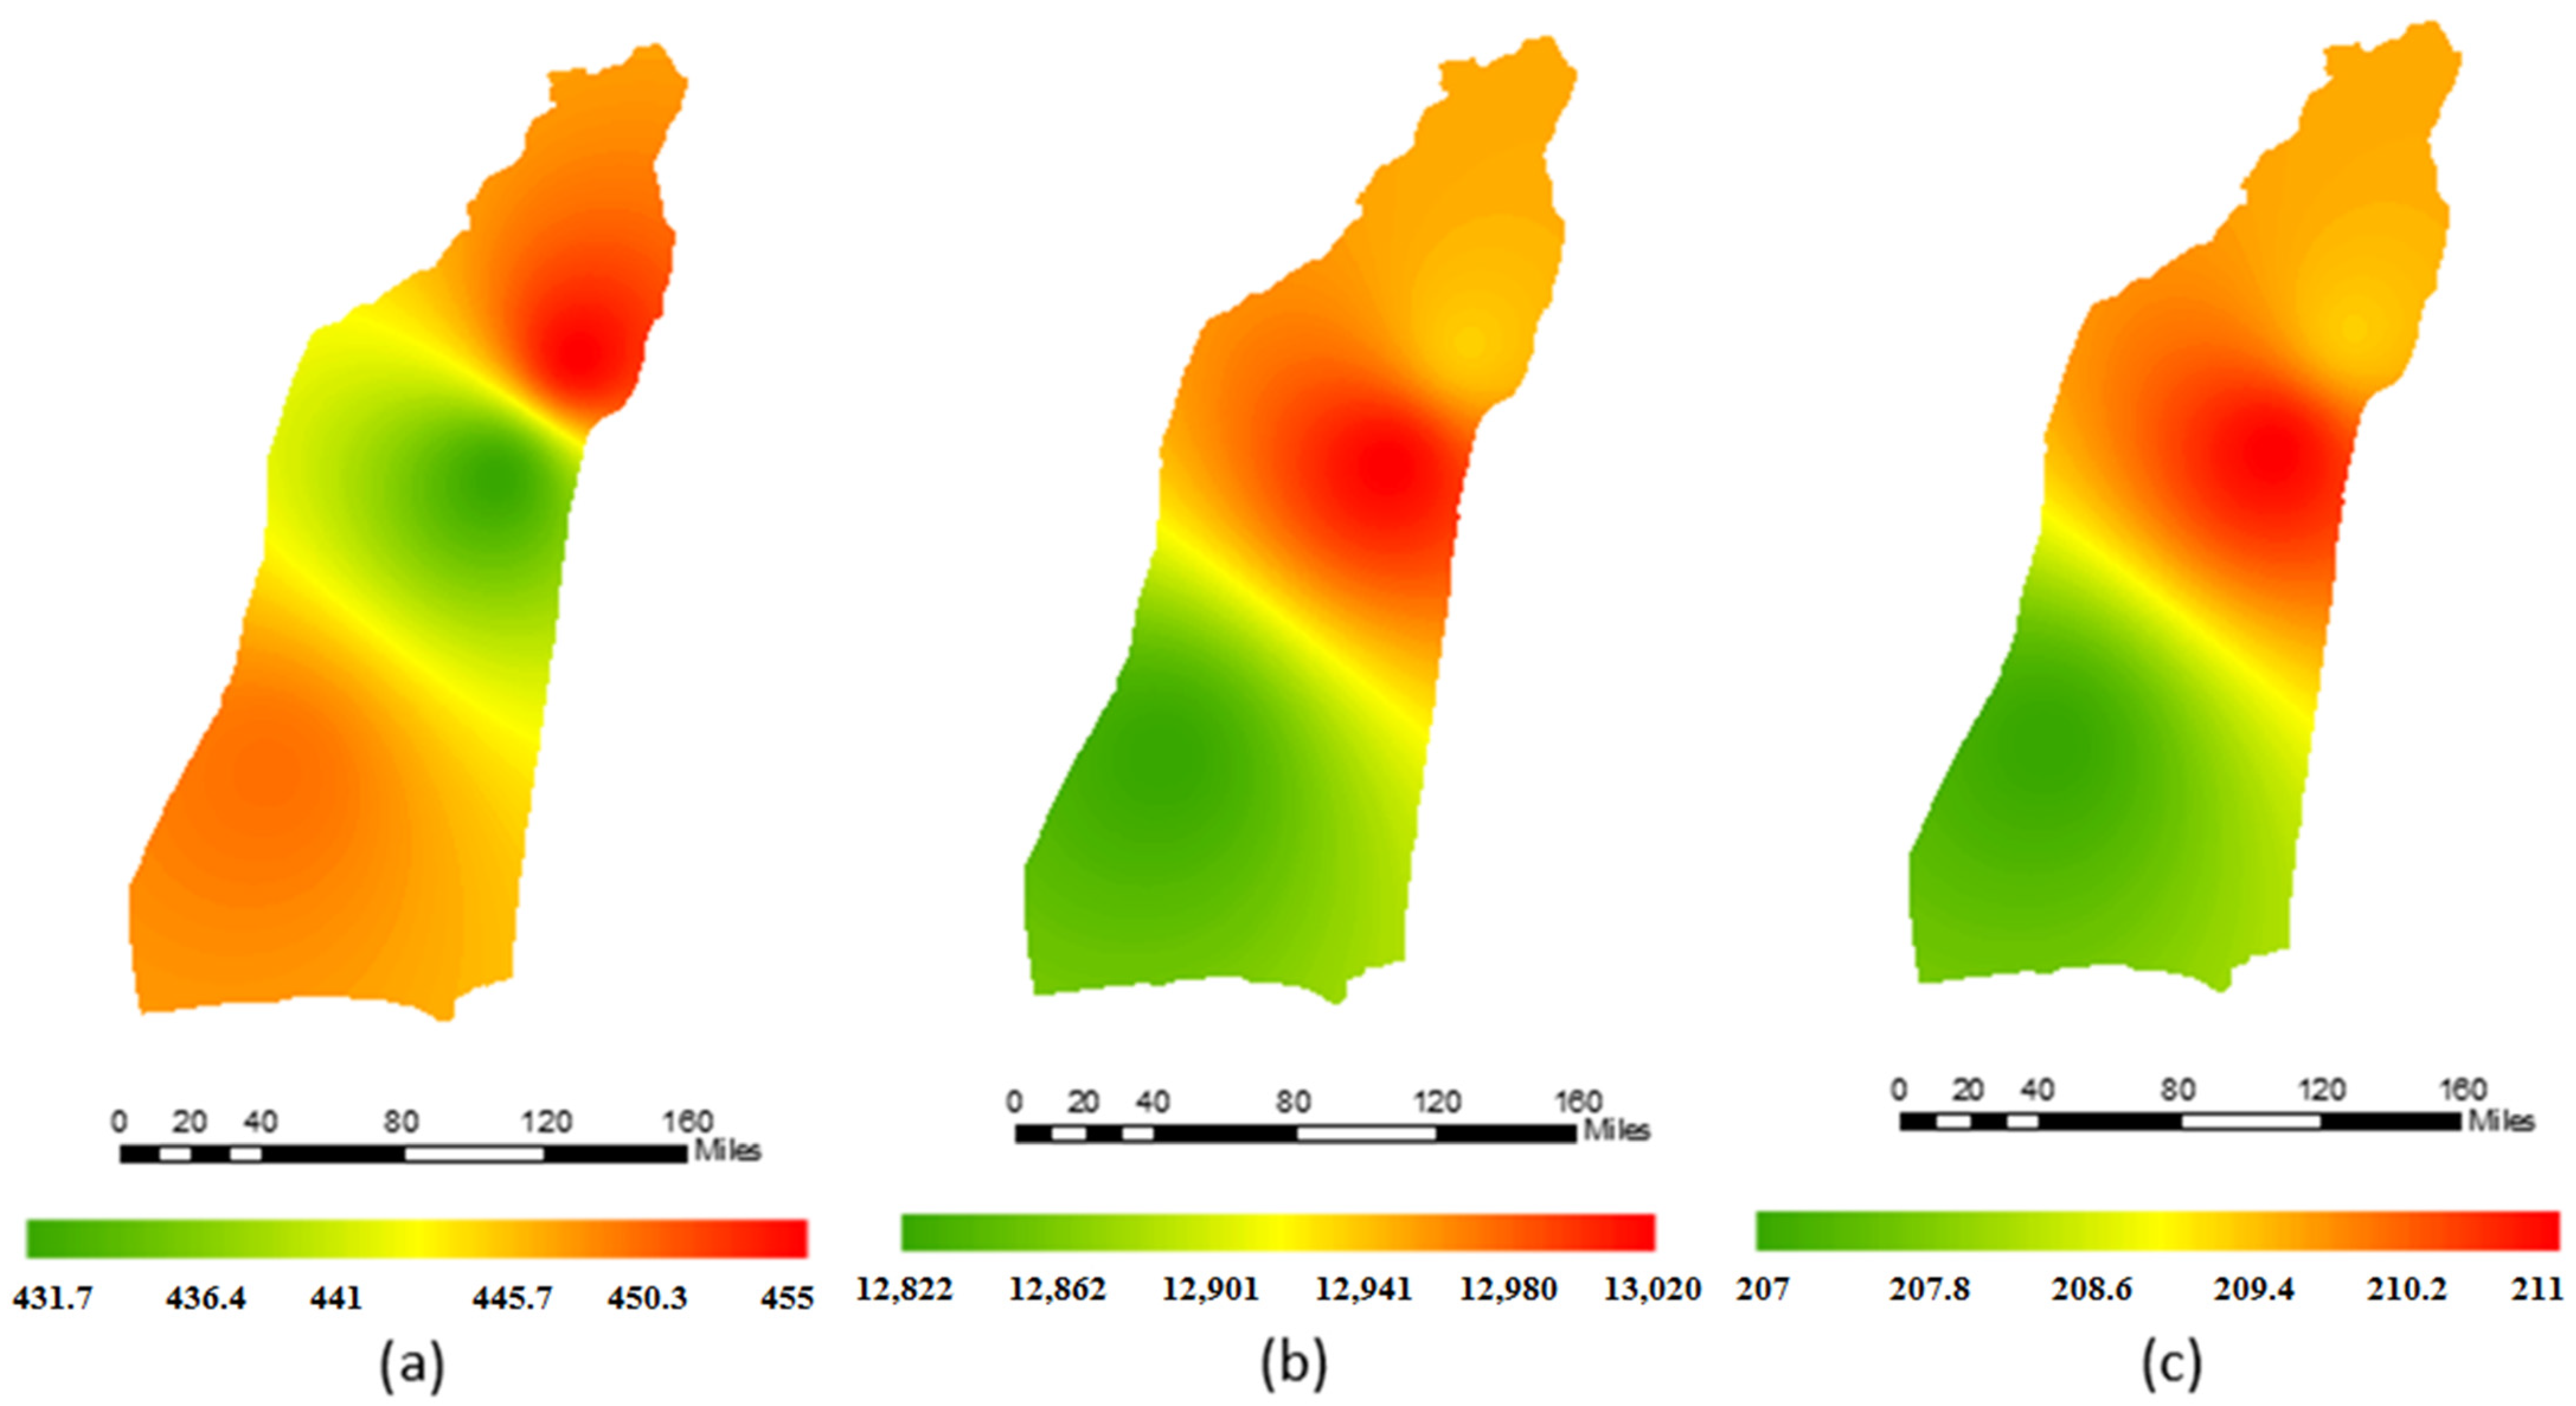
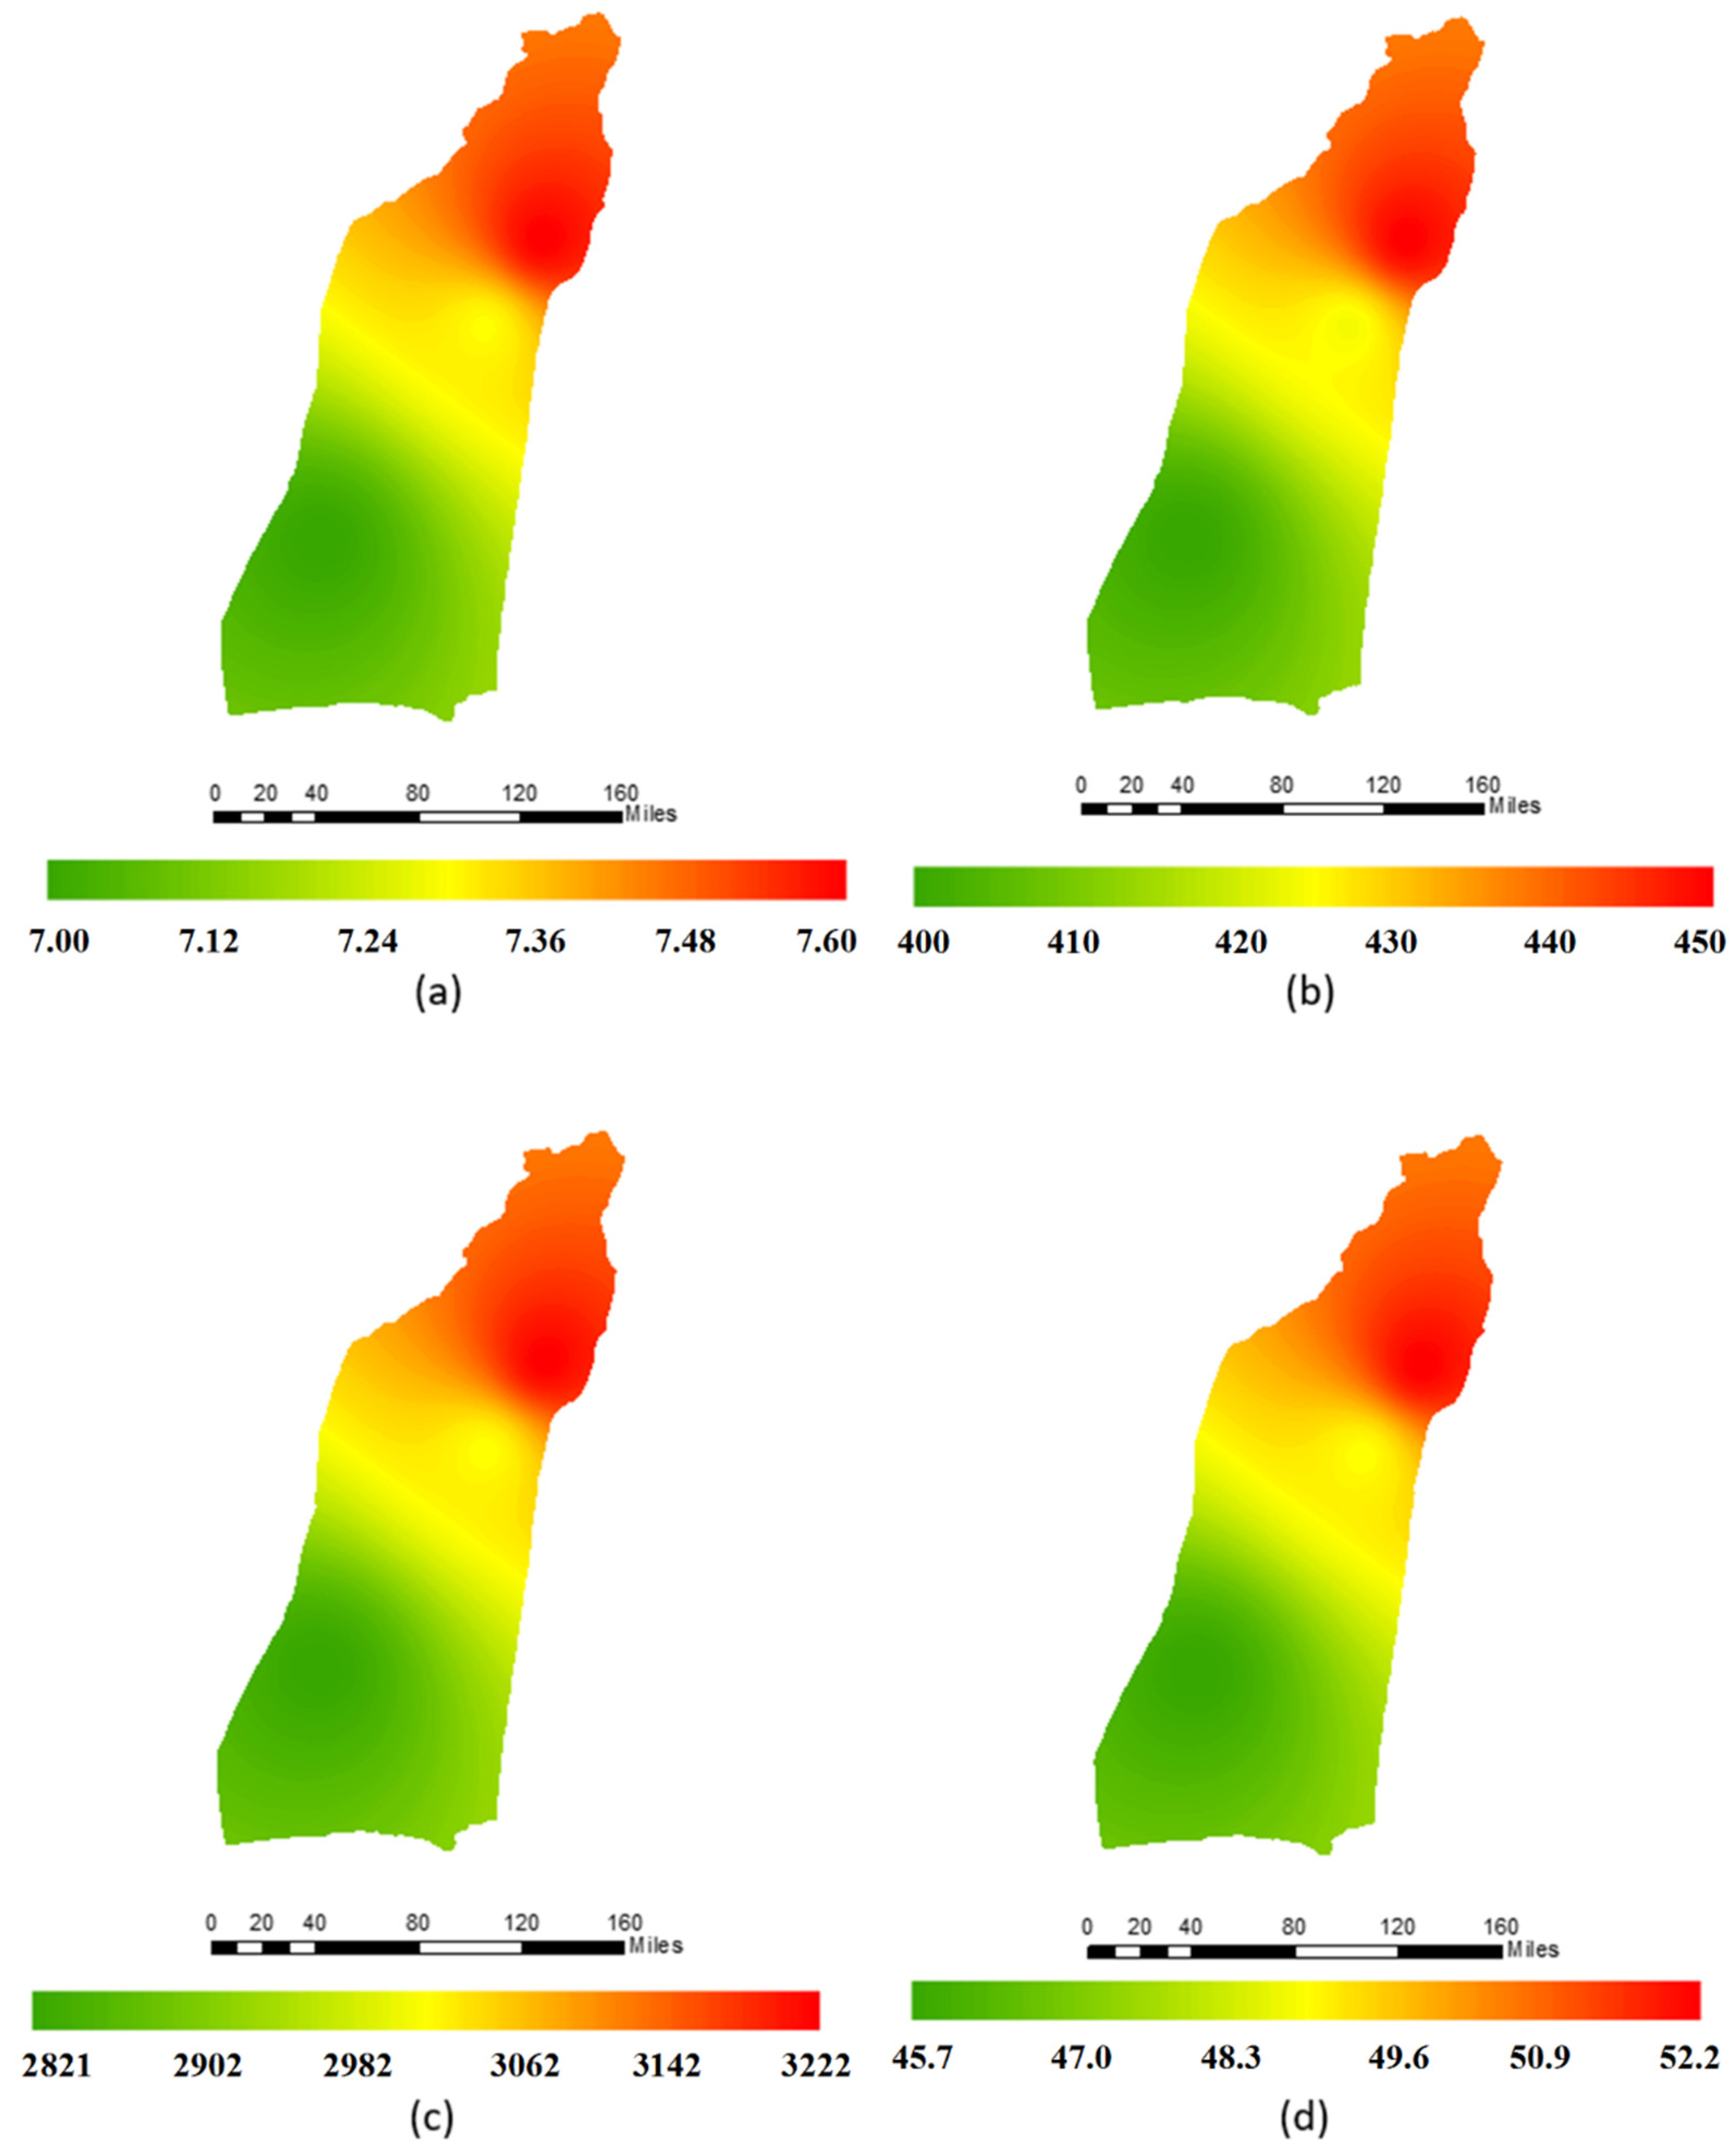
  • The prepared GIS maps showed that the most appropriate place for building a power plant driven by wind energy is the northern part of the province, but the most suitable place for building a solar power plant is the central part of the province (Figure 10 and Figure 11).
  • The results of SWARA evaluation showed that the economic criterion was the most important criterion, and the environmental criterion was the least important criterion (Table 17).
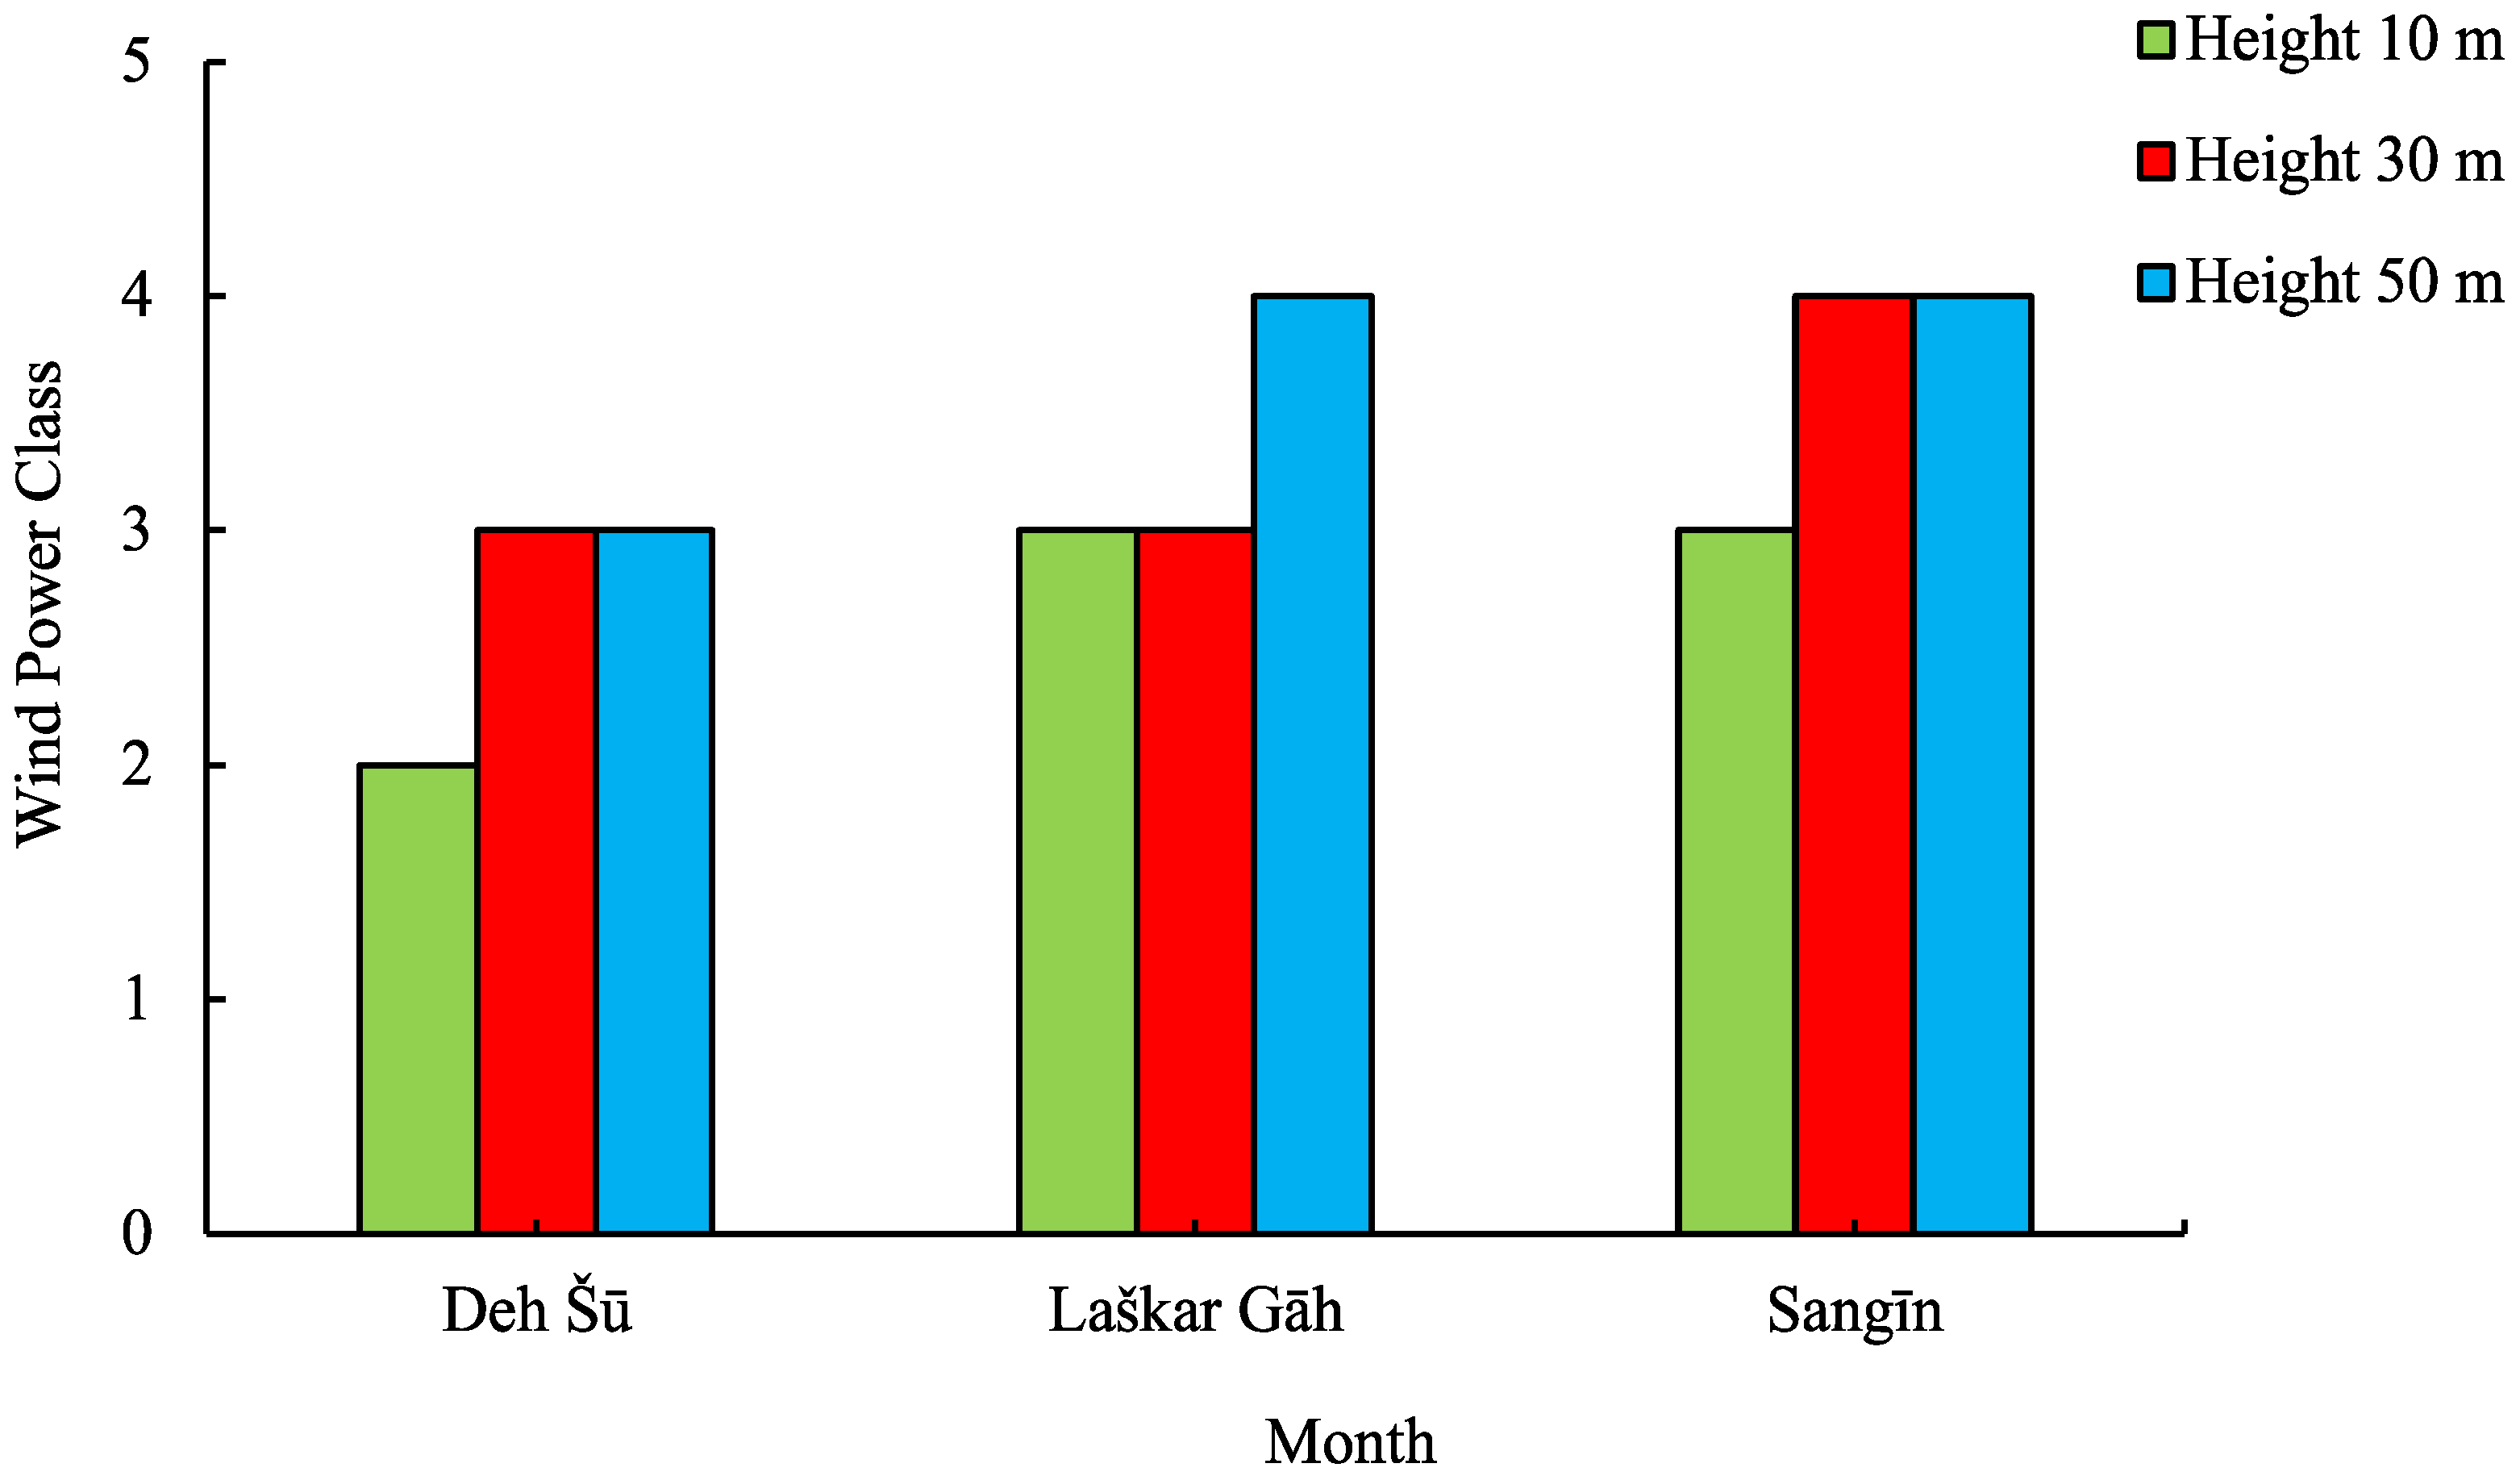
  • The WASPAS results showed that Sangīn is the most suitable place for the construction of a wind hydrogen power plant and Laškar Gāh is the most suitable place for the construction of a solar hydrogen power plant (Table 18).
Despite the potential and benefits of renewable energy development in West Asia, and especially in Afghanistan, there are obstacles both nationally and regionally. The most important obstacles to the development of renewable energy in Afghanistan are fossil fuel subsidies, lack of a feed-in tariff structure, lack of incentive for private-sector participation, weak environmental laws, low priority of renewable energy in national planning, and a weak executive framework. One of the solutions is energy planning based on technical–economic evaluations, which was analyzed in the present study. Another practical policy for attracting investors is the mandatory connection and purchase policy. Eliminating fossil fuel subsidies and creating a national development fund for renewable energy is another practical policy.

Author Contributions

M.H.A.: Supervision, writing-reviewing editing, validation. S.S.H.D.: conceptualization, Software. S.J.H.D.: Data curation, methodology. A.M.: Original draft preparation, visualization. K.A.: Reviewing, editing English, literature survey and review. H.X.A.: Reviewing, editing English. M.R.: reviewing. K.T.: Supervision, investigation. All authors have read and agreed to the published version of the manuscript.

Funding

This research was funded by Prince of Songkla University of Thailand and Ministry of Higher Education Science Research and Innovation Under the Reinventing University Project Grant Number REV64010.

Institutional Review Board Statement

Not applicable.

Informed Consent Statement

Not applicable.

Data Availability Statement

Data will be available upon request.

Acknowledgments

This research was supported from Prince of Songkla University of Thailand and Ministry of Higher Education Science Research and Innovation Under the Reinventing University Project Grant Number REV64010.

Conflicts of Interest

There is no conflict of interest.

Nomenclature

C F Capacity factor
C e l e c t r i c i t y Cost of electricity consumption
C e l e c t r o l y z e r Cost of electrolyzer
D T Diffuse radiation on the tilted surface
E   Produced energy
G o n Normal incident solar radiation
G s c Solar constant
H W T , P V Hydrogen production
I 0 Total incident radiation on the horizontal surface
I B Hourly beam on the horizontal surface
I T Total effective incident radiation on a tilted surface
M h y d r o g e n Hydrogen production
V E , m a x Wind speed carrying the maximum energy
V F , m a x Most probable wind speed
k e Energy pattern factor
v 0 Cut-in speed
v i Cut-out speed
v r Rated speed
η c o n v Rectifier efficiency
η e l e c t r o l y z e r Electrolyzer efficiency
θ z Zenith angle
ω s Hour angle
B T Hourly beam radiation on the tilted surface
GHRGlobal horizontal radiation
GISGeographic Information System
H ¯ Monthly mean of global horizontal radiation
H 0   ¯ Monthly mean of global horizontal radiation in out of atmosphere
IDWInverse Distance Weighted
K T ¯ Clearness index
LCOELeveled cost of the energy ($/kWh)
LCOHLeveled cost of the energy ($/kg-H2)
nNumber of the day
NRELNational Renewable Energy Laboratory
PVPhotovoltaic
teLifetime of electrolyzer
v ¯ Mean wind speed
Γ Gamma function
θAngle of incidence
ϕLatitude
C u e l e c t r o l y z e r Unit cost of electrolyzer
C I First investment of wind turbine
E c e l Energy consumption by electrolyzer
O M Investment of process and repairs
R E P Replacement costs
c Scale factor
c o f The power law coefficient
f Inflation rate
i Year from the start of the project
k Shape factor
n Wind farm’s lifetime in years
r Discount rate
t Day length
α Albedo of the ground
β Tilt angle of the surface
δ Tilt angle

References

  1. Adedoyin, F.F.; Ozturk, I.; Agboola, M.O.; Agboola, P.O.; Bekun, F.V. The implications of renewable and non-renewable energy generating in Sub-Saharan Africa: The role of economic policy uncertainties. Energy Policy 2021, 150, 112115. [Google Scholar] [CrossRef]
  2. Rashidi, M.; Sedaghat, A.; Misbah, B.; Sabati, M.; Vaidyan, K.; Mostafaeipour, A.; Hosseini Dehshiri, S.S.; Almutairi, K.; Issakhov, A.; Oloomi, S.A.A.; et al. Simulation of Wellbore Drilling Energy Saving of Nanofluids Using an Experimental Taylor–Couette Flow System. J. Pet. Explor. Prod. Technol. 2021, 11, 2963–2979. [Google Scholar] [CrossRef]
  3. Kaygusuz, K. Energy for sustainable development: A case of developing countries. Renew. Sustain. Energy Rev. 2012, 16, 1116–1126. [Google Scholar] [CrossRef]
  4. Anwarzai, M.A.; Nagasaka, K. Utility-scale implementable potential of wind and solar energies for Afghanistan using GIS multi-criteria decision analysis. Renew. Sustain. Energy Rev. 2017, 71, 150–160. [Google Scholar] [CrossRef]
  5. Mostafaeipour, A.; Hosseini Dehshiri, S.J.; Hosseini Dehshiri, S.S.; Jahangiri, M.; Techato, K. A Thorough Analysis of Potential Geothermal Project Locations in Afghanistan. Sustainability 2020, 12, 8397. [Google Scholar] [CrossRef]
  6. Mostafaeipour, A.; Dehshiri, S.J.H.; Dehshiri, S.S.H. Ranking locations for producing hydrogen using geothermal energy in Afghanistan. Int. J. Hydrogen Energy 2020, 45, 15924–15940. [Google Scholar] [CrossRef]
  7. Kalbasi, R.; Jahangiri, M.; Mosavi, A.; Dehshiri, S.J.H.; Dehshiri, S.S.H.; Ebrahimi, S.; Etezadi, Z.A.-S.; Karimipour, A. Finding the best station in Belgium to use residential-scale solar heating, One-year dynamic simulation with considering all system losses: Economic analysis of using ETSW. Sustain. Energy Technol. Assess. 2021, 45, 101097. [Google Scholar] [CrossRef]
  8. Ludin, G.A.; Amin, M.A.; Aminzay, A.; Senjyu, T. Theoretical potential and utilization of renewable energy in Afghanistan. AIMS Energy 2016, 5, 1–19. [Google Scholar] [CrossRef]
  9. ahangiri, M.; Haghani, A.; Mostafaeipour, A.; Khosravi, A.; Raeisi, H.A. Assessment of solar-wind power plants in Afghanistan: A review. Renew. Sustain. Energy Rev. 2018, 99, 169–190. [Google Scholar] [CrossRef]
  10. Almutairi, K.; Dehshiri, S.S.H.; Mostafaeipour, A.; Issakhov, A.; Techato, K.; Dhanraj, J.A. Performance optimization of a new flash-binary geothermal cycle for power/hydrogen production with zeotropic fluid. J. Therm. Anal. Calorim. 2021, 145, 1633–1650. [Google Scholar] [CrossRef]
  11. Almutairi, K.; Hosseini Dehshiri, S.S.; Hosseini Dehshiri, S.J.; Mostafaeipour, A.; Jahangiri, M.; Techato, K. Technical, economic, carbon footprint assessment, and prioritizing stations for hydrogen production using wind energy: A case study. Energy Strat. Rev. 2021, 36, 100684. [Google Scholar] [CrossRef]
  12. Almutairi, K.; Dehshiri, S.S.H.; Dehshiri, S.J.H.; Mostafaeipour, A.; Issakhov, A.; Techato, K. A thorough investigation for development of hydrogen projects from wind energy: A case study. Int. J. Hydrogen Energy 2021, 46, 18795–18815. [Google Scholar] [CrossRef]
  13. Hosseini Dehshiri, S.S. A new application of multi criteria decision making in energy technology in traditional buildings: A case study of Isfahan. Energy 2022, 240, 122814. [Google Scholar] [CrossRef]
  14. Ahmadi, A.; Jamali, D.; Ehyaei, M.; Assad, M.E.H. Energy, exergy, economic and exergoenvironmental analyses of gas and air bottoming cycles for production of electricity and hydrogen with gas reformer. J. Clean. Prod. 2020, 259, 120915. [Google Scholar] [CrossRef]
  15. Mostafaeipour, A.; Hosseini Dehshiri, S.S.; Hosseini Dehshiri, S.J.; Almutairi, K.; Taher, R.; Issakhov, A.; Techato, K. A thorough analysis of renewable hydrogen projects development in Uzbekistan using MCDM methods. Int. J. Hydrogen Energy 2021, 46, 31174–31190. [Google Scholar] [CrossRef]
  16. Almutairi, K.; Mostafaeipour, A.; Jahanshahi, E.; Jooyandeh, E.; Himri, Y.; Jahangiri, M.; Issakhov, A.; Chowdhury, S.; Hosseini Dehshiri, S.J.; Hosseini Dehshiri, S.S. Ranking locations for hydrogen production using hybrid wind-solar: A Case Study. Sustainability 2021, 13, 4524. [Google Scholar] [CrossRef]
  17. Rashidi, M.; Sedaghat, A.; Misbah, B.; Sabati, M.; Vaidyan, K.; Mostafaeipour, A.; Dehshiri, S.S.H.; Almutairi, K.; Issakhov, A. Introducing a Rheology Model for Non-Newtonian Drilling Fluids. Geofluids 2021, 1344776. [Google Scholar] [CrossRef]
  18. Mostafaeipour, A.; Sedaghat, A.; Ghalishooyan, M.; Dinpashoh, Y.; Mirhosseini, M.; Sefid, M.; Pour-Rezaei, M. Evaluation of wind energy potential as a power generation source for electricity production in Binalood, Iran. Renew. Energy 2013, 52, 222–229. [Google Scholar] [CrossRef]
  19. Mostafaeipour, A.; Sedaghat, A.; Dehghan-Niri, A.; Kalantar, V. Wind energy feasibility study for city of Shahrbabak in Iran. Renew. Sustain. Energy Rev. 2011, 15, 2545–2556. [Google Scholar] [CrossRef]
  20. Hulio, Z.H.; Jiang, W.; Rehman, S. Techno-Economic assessment of wind power potential of Hawke’s Bay using Weibull parameter: A review. Energy Strategy Rev. 2019, 26, 100375. [Google Scholar] [CrossRef]
  21. Alkhalidi, M.A.; Al-Dabbous, S.K.; Neelamani, S.; Aldashti, H.A. Wind energy potential at coastal and offshore locations in the state of Kuwait. Renew. Energy 2019, 135, 529–539. [Google Scholar] [CrossRef]
  22. Baseer, M.A.; Meyer, J.P.; Alam, M.M.; Rehman, S. Wind speed and power characteristics for Jubail industrial city, Saudi Arabia. Renew. Sustain. Energy Rev. 2015, 52, 1193–1204. [Google Scholar] [CrossRef] [Green Version]
  23. Arslan, O. Technoeconomic analysis of electricity generation from wind energy in Kutahya, Turkey. Energy 2010, 35, 120–131. [Google Scholar] [CrossRef]
  24. Bahrami, A.; Teimourian, A.; Okoye, C.O.; Shiri, H. Technical and economic analysis of wind energy potential in Uzbekistan. J. Clean. Prod. 2019, 223, 801–814. [Google Scholar] [CrossRef]
  25. Mostafaeipour, A.; Jahangiri, M.; Haghani, A.; Dehshiri, S.J.H.; Dehshiri, S.S.H.; Sedaghat, A.; Saghaei, H.; Akinlabi, E.T.; Sichilalu, S.M.; Chowdhury, M. Statistical evaluation of using the new generation of wind turbines in South Africa. Energy Rep. 2020, 6, 2816–2827. [Google Scholar] [CrossRef]
  26. Firouzjah, K.G. Assessment of small-scale solar PV systems in Iran: Regions priority, potentials and financial feasibility. Renew. Sustain. Energy Rev. 2018, 94, 267–274. [Google Scholar] [CrossRef]
  27. Tahir, Z.; Asim, M. Surface measured solar radiation data and solar energy resource assessment of Pakistan: A review. Renew. Sustain. Energy Rev. 2018, 81, 2839–2861. [Google Scholar] [CrossRef]
  28. Almasoud, A.; Gandayh, H.M. Future of solar energy in Saudi Arabia. J. King Saud Univ.-Eng. Sci. 2015, 27, 153–157. [Google Scholar] [CrossRef] [Green Version]
  29. Ramadhan, M.; Naseeb, A. The cost benefit analysis of implementing photovoltaic solar system in the state of Kuwait. Renew. Energy 2011, 36, 1272–1276. [Google Scholar] [CrossRef]
  30. Altarawneh, I.S.; Rawadieh, S.I.; Tarawneh, M.S.; Alrowwad, S.M.; Rimawi, F. Optimal tilt angle trajectory for maximizing solar energy potential in Ma’an area in Jordan. J. Renew. Sustain. Energy 2016, 8, 033701. [Google Scholar] [CrossRef]
  31. Nematollahi, O.; Kim, K.C. A feasibility study of solar energy in South Korea. Renew. Sustain. Energy Rev. 2017, 77, 566–579. [Google Scholar] [CrossRef]
  32. Bicer, Y.; Dincer, I. Clean fuel options with hydrogen for sea transportation: A life cycle approach. Int. J. Hydrogen Energy 2018, 43, 1179–1193. [Google Scholar]
  33. Mostafaeipour, A.; Dehshiri, S.J.H.; Dehshiri, S.S.H.; Jahangiri, M. Prioritization of potential locations for harnessing wind energy to produce hydrogen in Afghanistan. Int. J. Hydrogen Energy 2020, 45, 33169–33184. [Google Scholar] [CrossRef]
  34. Mostafaeipour, A.; Khayyami, M.; Sedaghat, A.; Mohammadi, K.; Shamshirband, S.; Sehati, M.-A.; Gorakifard, E. Evaluating the wind energy potential for hydrogen production: A case study. Int. J. Hydrogen Energy 2016, 41, 6200–6210. [Google Scholar] [CrossRef]
  35. Nematollahi, O.; Alamdari, P.; Jahangiri, M.; Sedaghat, A.; Alemrajabi, A.A. A techno-economical assessment of solar/wind resources and hydrogen production: A case study with GIS maps. Energy 2019, 175, 914–930. [Google Scholar] [CrossRef]
  36. Al-Sharafi, A.; Sahin, A.Z.; Ayar, T.; Yilbas, B.S. Techno-economic analysis and optimization of solar and wind energy systems for power generation and hydrogen production in Saudi Arabia. Renew. Sustain. Energy Rev. 2017, 69, 33–49. [Google Scholar] [CrossRef]
  37. Iqbal, W.; Yumei, H.; Abbas, Q.; Hafeez, M.; Mohsin, M.; Fatima, A.; Jamali, M.A.; Jamali, M.; Siyal, A.; Sohail, N. Assessment of Wind Energy Potential for the Production of Renewable Hydrogen in Sindh Province of Pakistan. Processes 2019, 7, 196. [Google Scholar] [CrossRef] [Green Version]
  38. Jahangiri, M.; Shamsabadi, A.A.; Mostafaeipour, A.; Rezaei, M.; Yousefi, Y.; Pomares, L.M. Using fuzzy MCDM technique to find the best location in Qatar for exploiting wind and solar energy to generate hydrogen and electricity. Int. J. Hydrogen Energy 2020, 45, 13862–13875. [Google Scholar] [CrossRef]
  39. Calise, F.; Cappiello, F.L.; D’Accadia, M.D.; Vicidomini, M. Energy and economic analysis of a small hybrid solar-geothermal trigeneration system: A dynamic approach. Energy 2020, 208, 118295. [Google Scholar] [CrossRef]
  40. Ganoe, R.E.; Stackhouse, P.; DeYoung, R.J. RETScreen® Plus Software Tutorial: National Aeronautics and Space Administration, Langley Research Center. 2014. Available online: https://ntrs.nasa.gov/api/citations/20150000447/downloads/20150000447.pdf (accessed on 10 December 2021).
  41. Jahangiri, M.; Soulouknga, M.H.; Bardei, F.K.; Shamsabadi, A.A.; Akinlabi, E.T.; Sichilalu, S.M.; Mostafaeipour, A. Techno-econo-environmental optimal operation of grid-wind-solar electricity generation with hydrogen storage system for domestic scale, case study in Chad. Int. J. Hydrogen Energy 2019, 44, 28613–28628. [Google Scholar] [CrossRef]
  42. Mostafaeipour, A.; Zarezade, M.; Khalifeh Soltani, S.R.; Hosseini Dehshiri, S.J.; Hosseini Dehshiri, S.S.; Ao Xuan, H.; Arockia Dhanraj, J.; Techato, K.; Chowdhury, S.; Issakhov, A. A conceptual new model for use of solar water heaters in hot and dry regions. Sustain. Energy Technol. Assess. 2022, 49, 101710. [Google Scholar] [CrossRef]
  43. Duffie, J.A.; Beckman, W.A. Solar Engineering of Thermal Processes; John Wiley & Sons: Hoboken, NJ, USA, 2013. [Google Scholar]
  44. Liu, B.; Jordan, R. Daily insolation on surfaces tilted towards equator. ASHRAE J. 1961, 10. [Google Scholar]
  45. Rezaei, M.; Naghdi-Khozani, N.; Jafari, N. Wind energy utilization for hydrogen production in an underdeveloped country: An economic investigation. Renew. Energy 2020, 147, 1044–1057. [Google Scholar] [CrossRef]
  46. Alavi, O.; Mostafaeipour, A.; Qolipour, M. Analysis of hydrogen production from wind energy in the southeast of Iran. Int. J. Hydrogen Energy 2016, 41, 15158–15171. [Google Scholar] [CrossRef]
  47. Adaramola, M.; Paul, S.; Oyedepo, S. Assessment of electricity generation and energy cost of wind energy conversion systems in north-central Nigeria. Energy Convers. Manag. 2011, 52, 3363–3368. [Google Scholar] [CrossRef]
  48. Bruck, M.; Sandborn, P.; Goudarzi, N. A Levelized Cost of Energy (LCOE) model for wind farms that include Power Purchase Agreements (PPAs). Renew. Energy 2018, 122, 131–139. [Google Scholar] [CrossRef]
  49. Eltamaly, A.M.; Mohamed, M.A. Optimal Sizing and Designing of Hybrid Renewable Energy Systems in Smart Grid Applications. Adv. Renew. Energ. Power Technol. 2018, 2, 231–313. [Google Scholar]
  50. Fazelpour, F.; Markarian, E.; Soltani, N. Wind energy potential and economic assessment of four locations in Sistan and Balouchestan province in Iran. Renew. Energy 2017, 109, 646–667. [Google Scholar] [CrossRef]
  51. Okoye, C.O.; Taylan, O.; Baker, D.K. Solar energy potentials in strategically located cities in Nigeria: Review, resource assessment and PV system design. Renew. Sustain. Energy Rev. 2016, 55, 550–566. [Google Scholar] [CrossRef]
  52. Douak, M.; Settou, N. Estimation of Hydrogen Production Using Wind Energy in Algeria. Energy Procedia 2015, 74, 981–990. [Google Scholar] [CrossRef] [Green Version]
  53. Mostafaeipour, A.; Jadidi, M.; Mohammadi, K.; Sedaghat, A. An analysis of wind energy potential and economic evaluation in Zahedan, Iran. Renew. Sustain. Energy Rev. 2014, 30, 641–650. [Google Scholar] [CrossRef]
  54. Fazelpour, F.; Soltani, N.; Soltani, S.; Rosen, M.A. Assessment of wind energy potential and economics in the north-western Iranian cities of Tabriz and Ardabil. Renew. Sustain. Energy Rev. 2015, 45, 87–99. [Google Scholar] [CrossRef]
  55. Saleh, B.; Koglbauer, G.; Wendland, M.; Fischer, J. Working fluids for low-temperature organic Rankine cycles. Energy 2007, 32, 1210–1221. [Google Scholar] [CrossRef]
  56. Ortega-Izquierdo, M.; del Río, P. Benefits and costs of renewable electricity in Europe. Renew. Sustain. Energy Rev. 2016, 61, 372–383. [Google Scholar]
  57. Zhai, H.; Shi, L.; An, Q. Influence of working fluid properties on system performance and screen evaluation indicators for geothermal ORC (organic Rankine cycle) system. Energy 2014, 74, 2–11. [Google Scholar] [CrossRef]
  58. Keršulienė, V.; Zavadskas, E.K.; Turskis, Z. Selection of rational dispute resolution method by applying new step-wise weight assessment ratio analysis (SWARA). J. Bus. Econ. Manag. 2010, 11, 243–258. [Google Scholar] [CrossRef]
  59. Almutairi, K.; Hosseini Dehshiri, S.S.; Hosseini Dehshiri, S.J.; Mostafaeipour, A.; Issakhov, A.; Techato, K. Use of a Hybrid Wind—Solar—Diesel—Battery Energy System to Power Buildings in Remote Areas: A Case Study. Sustainability 2021, 13, 8764. [Google Scholar] [CrossRef]
  60. Hosseini Dehshiri, S.S.; Firoozabadi, B.; Afshin, H. A new application of multi-criteria decision making in identifying critical dust sources and comparing three common receptor-based models. Sci. Total Environ. 2022, 808, 152109. [Google Scholar] [CrossRef] [PubMed]
  61. Elliott, D.; Schwartz, M. Wind Energy Potential in the United States; Pacific Northwest Lab.: Richland, WA, USA, 1993. [Google Scholar]
  62. Milani, D.; Kiani, A.; McNaughton, R. Renewable-powered hydrogen economy from Australia’s perspective. Int. J. Hydrog. Energy 2020, 45, 24125–24145. [Google Scholar] [CrossRef]
  63. Andrea, M.F.; Sara, R.H.; Giovanni, S.S.; Enrico, B. Techno-economic analysis of in-situ production by electrolysis, biomass gasification and delivery systems for Hydrogen Refuelling Stations: Rome case study. Energy Procedia 2018, 148, 82–89. [Google Scholar] [CrossRef]
  64. Gökçek, M.; Kale, C. Optimal design of a Hydrogen Refuelling Station (HRFS) powered by Hybrid Power System. Energy Convers. Manag. 2018, 161, 215–224. [Google Scholar] [CrossRef]
  65. Gökçek, M.; Kale, C. Techno-economical evaluation of a hydrogen refuelling station powered by Wind-PV hybrid power system: A case study for İzmir-Çeşme. Int. J. Hydrogen Energy 2018, 43, 10615–10625. [Google Scholar] [CrossRef]
Figure 1. Spatial distribution of wind speed in Afghanistan [9].
Sustainability 14 01177 g001
Figure 2. Spatial distribution of solar radiation in Afghanistan [9].
Sustainability 14 01177 g002
Figure 3. Ways of generating electricity and hydrogen from renewable sources [14].
Sustainability 14 01177 g003
Figure 4. Map of the study area and the studied stations.
Sustainability 14 01177 g004
Figure 5. Stages of research in the present work.
Sustainability 14 01177 g005
Figure 6. Monthly changes in average solar irradiance.
Sustainability 14 01177 g006
Figure 7. Optimal tilt angles of PV panels.
Sustainability 14 01177 g007
Figure 8. Monthly changes in wind speed in the studied stations: (a) Deh Šū, (b) Laškar Gāh, (c) Sangīn.
Sustainability 14 01177 g008
Figure 9. Classification of wind power in the studied stations.
Sustainability 14 01177 g009
Figure 10. GIS maps of annual solar power generation, solar-powered hydrogen production, and solar irradiance: (a) average annual solar irradiance (W/m2); (b) annual solar power output (*100 kWh); (c) annual hydrogen output from solar power (*100 kg-H2).
Sustainability 14 01177 g010
Figure 11. GIS maps of annual power and hydrogen generation from wind resources: (a) average annual speed of wind at an altitude of 50 m (m/s); (b) average density of wind power at an altitude of 50 m (W/m2); (c) annual wind power output using the Turbine Model 6 (MWh) wind turbine; (d) annual hydrogen output from wind power generated by Turbine Model 6 (ton).
Sustainability 14 01177 g011
Table 1. Spatial distribution of technical/economic/environmental feasibility studies for renewable power generation in Asia.
LocationRenewable EnergyTypeReference
Binalood, IranWindTechnical[18]
Shahrbabak, IranWindTechnical, Economic[19]
Hawke’s Bay, PakistanWindTechnical, Economic[20]
KuwaitWindTechnical[21]
Jubail, Saudi ArabiaWindTechnical[22]
Kutahya, TurkeyWindTechnical, Economic, Environmental[23]
UzbekistanWindTechnical, Economic[24]
IranSolarTechnical, Economic[26]
PakistanSolarTechnical[27]
Saudi ArabiaSolarTechnical[28]
KuwaitSolarTechnical, Economic, Environmental[29]
Ma’an, JordanSolarTechnical[30]
AfghanistanWind, SolarTechnical[4]
South KoreaSolarTechnical[31]
Fars, IranWind, HydrogenTechnical[34]
Sistan and Baluchistan, IranWind, Solar, HydrogenTechnical, Economic[35]
Saudi ArabiaWind, Solar, HydrogenTechnical, Economic[36]
Sindh, PakistanWind, HydrogenTechnical[37]
QatarWind, Solar, HydrogenTechnical, Economic, Environmental[38]
Table 2. Geographical coordinates and characteristics of the stations in the Helmand province [40].
Number SiteElevationN (°)E (°)
1Deh Šū74830.463.3
2Laškar Gāh89631.664.4
3Sangīn151032.164.8
Table 3. Values of economic parameters in the present study.
ParameterValueUnitRef.
Wind turbine investment cost1/$W[50]
Inverter cost0.31$/W[51]
PV module cost1.2$/W[51]
Electrolyzer cost0.384$/W[45,52]
Wind turbine installation cost40%[53]
PV module installation cost20%[35]
OM Cost of WT6%[54]
OM Cost of PV1%[35]
Life cycle of project 20year[35]
Life cycle of inverter10year[35]
Life cycle of electrolyzer7year[52]
Interest rate20%[55]
Inflation rate15%[55]
Table 4. Solar irradiance in the Helmand province (W/m2).
SiteHighestLowestAverage
Deh Šū620252.5450
Laškar Gāh583.3248.3431.7
Sangīn599.2264.2455
Table 5. Clearness index in the Helmand province.
SiteDeh ŠūLaškar GāhSangīn
January0.610.5760.47
February0.6340.5970.488
March0.6150.5840.463
April0.6340.5920.508
May0.6520.620.581
June0.6430.6540.646
July0.630.6470.649
August0.6330.6530.654
September0.6330.560.668
October0.6680.6440.66
November0.6430.5960.576
December0.6020.5450.475
Yearly0.6350.620.584
Table 6. Specifications of PV panels considered in the study.
CodePV PanelCapacity (W)Length (mm)Width (mm)Efficiency (%)
1HBL_Power_Systems_HB_12505058565513.45
2Peimar_OS100P100103067414.54
3Jinko_JKM_200PP_48200132499215.32
4Suntech_STP300-24/Ve300195699215.48
Table 7. Specifications of the inverters considered in the study.
Inverter NameCapacity (kW)The Number of PanelsInverter Efficiency (%)
Hoymiles MI 1000100200096.34
Fronius Galvo 2 0 1200200095.9
GESolar GES2 4K2TL400200095
SMA—Sunny Boy 7000TL-US-22 -208V600200096.5
Table 8. Annual power output, hydrogen output, and CO2 emission reduction resulting from building PV systems in the studied stations.
PV Module CodeStationAnnual Energy Production (MWh)Hydrogen Production (ton-H2)CO2 Emission Reduction
(ton-CO2)
Scenario 1Scenario 2
1Deh Šū219.643.55560.8443.93
Laškar Gāh223.033.6161.7844.6
Sangīn221.663.58861.444.33
2Deh Šū428.216.932118.6185.64
Laškar Gāh434.827.038120.4486.96
Sangīn432.156.995119.7186.43
3Deh Šū845.5913.69234.23169.12
Laškar Gāh858.6413.9237.84171.73
Sangīn853.3713.81236.38170.67
4Deh Šū1282.220.76355.17256.44
Laškar Gāh130221.08360.65260.4
Sangīn129420.95358.44258.8
Table 9. Economic evaluation of generating power and hydrogen from solar energy resource in the study area.
PV Module CodeStationLCOE ($/kWh)LCOH ($/kg)Payback Period
1Deh Šū0.06582.12385.9
Laškar Gāh0.06482.09155.8
Sangīn0.06522.10445.8
2Deh Šū0.06752.17876
Laškar Gāh0.06652.14555.9
Sangīn0.06692.15886
3Deh Šū0.06842.20666.1
Laškar Gāh0.06732.1736
Sangīn0.06782.18646.1
4Deh Šū0.06762.18286.1
Laškar Gāh0.06662.14966
Sangīn0.0672.16296
Table 10. Average wind speeds and Weibull parameters.
Site10 m30 m50 m
v ¯ kc v ¯ kc v ¯ kc
Deh Šū4.7761.8145.3736.1652.0616.9606.9422.1877.839
Laškar Gāh5.0311.8625.6666.4622.1107.2967.2602.2368.196
Sangīn5.2851.9085.9576.7562.1577.6287.5732.2848.549
Table 11. Important parameters from the technical evaluation of wind energy.
Site10 m30 m50 m
EPFPvVFmaxVEmaxEPFPvVFmaxVEmaxEPFPvVFmaxVEmax
Deh Šū1.67580.41573.45378.09301.45530.60305.04259.67211.37730.68795.927810.5500
Laškar Gāh1.62390.45283.74598.38421.42290.63735.381110.00801.35110.71816.288210.9070
Sangīn1.57840.48874.03648.67311.39410.66905.715610.33901.32780.74556.643311.2590
Table 12. Annual average of power density of wind energy in the studied locations.
StationWind Power Density (W/m2)
103050
Deh Šū141.49266.19359.88
Laškar Gāh160.63299.8403.61
Sangīn181.28335.68450.07
Table 13. Wind power classification according to Elliott and Schwartz [61].
Power Class10 m30 m50 m
1 0 < P 10 100 0 < P 30 160 0 < P 50 200
2 100 < P 10 150 160 < P 30 240 200 < P 50 300
3 150 < P 10 200 240 < P 30 320 300 < P 50 400
4 200 < P 10 250 320 < P 30 400 400 < P 50 500
5 250 < P 10 300 400 < P 30 480 500 < P 50 600
6 300 < P 10 400 480 < P 30 640 600 < P 50 800
7 400 < P 10 1000 640 < P 30 1600 700 < P 50 2000
Table 14. Specifications of wind turbines considered in the study.
Wind Turbine ModelRated Power (kW)Cut-In (m/s)Rated Wind Speed (m/s)Cut-Off (m/s)Hub Height (m)Swept Area (m2)
Vestas V20150.04.5132524314
Nordtank NTK 300300.04.513.52535755
Nordtank NTK 450450.0 41325501075
Vestas V44600.0 41620531521
Goldwind S43/750750.0 31225401452
EWT DW 61-900900.0 2.511.525462292.5
Nordtank NTK 1500 601500.04.01525602827
Nordex N80 Alpha2500.04.01525605028
Table 15. Capacity factor of wind turbines and annual power output, hydrogen output, and CO2 emissions resulting from building wind systems in the studied stations.
Turbine ModelStationCFAnnual Energy Production (MWh)Hydrogen Production (Ton-H2)CO2 Emission Reduction
(Ton-CO2)
Scenario 1Scenario 2
1Deh Šū17.75233.33.77664.61646.654
Laškar Gāh19.7258.84.1971.69351.764
Sangīn21.7285.14.61578.97257.019
2Deh Šū19.86521.88.447144.55104.37
Laškar Gāh21.9575.49.314159.39115.08
Sangīn23.98630.210.201174.57126.04
3Deh Šū26.71105317.045291.69210.61
Laškar Gāh29.081146.518.558317.57229.29
Sangīn31.471240.620.082343.66248.13
4Deh Šū17.82936.315.156259.36187.27
Laškar Gāh19.411020.216.515282.61204.05
Sangīn21.051106.417.909306.47221.28
5Deh Šū30.612010.832.549557402.17
Laškar Gāh33.032169.835.122601.02433.95
Sangīn35.452329.137.701645.16465.82
6Deh Šū35.792821.545.672781.55564.3
Laškar Gāh38.343022.548.925837.22604.49
Sangīn40.873222.252.158892.55644.44
7Deh Šū21.662846.546.076788.48569.3
Laškar Gāh23.583098.350.153858.24619.67
Sangīn25.543355.754.319929.53671.14
8Deh Šū21.664744.176.7941314.13948.83
Laškar Gāh23.585163.983.5881430.41032.78
Sangīn25.545592.890.5321549.221118.57
Table 16. Findings of the economic analysis of producing hydrogen and power from wind energy resources in the study area.
Turbine ModelStationLCOE ($/kWh)LCOH ($/kg)Payback Period
1Deh Šū0.1323.344411.4
Laškar Gāh0.1193.01429.1
Sangīn0.1082.73647.6
2Deh Šū0.1182.998.9
Laškar Gāh0.1072.71167.5
Sangīn0.09772.47586.5
3Deh Šū0.08772.22265.5
Laškar Gāh0.08062.04144.9
Sangīn0.07451.88654.4
4Deh Šū0.13163.332811.3
Laškar Gāh0.12083.05879.4
Sangīn0.11132.82058
5Deh Šū0.07661.93994.6
Laškar Gāh0.0711.79784.1
Sangīn0.06611.67483.8
6Deh Šū0.06551.6593.7
Laškar Gāh0.06111.54873.4
Sangīn0.05731.45273.1
7Deh Šū0.10822.74077.6
Laškar Gāh0.09942.51796.6
Sangīn0.09182.32485.9
8Deh Šū0.10822.74077.6
Laškar Gāh0.09942.51796.6
Sangīn0.09182.32485.9
Table 17. Results of weighting the criteria with the SWARA method.
CriteriaAverage Relative Importance K j q j w j
LCOE ($/kWh)11.0001.0000.206
Payback period (year)0.0811.0810.9250.191
LCOH ($/kWh)0.0531.0530.8790.181
Annual energy production (MWh)0.1521.1520.7630.157
Annual hydrogen production (ton)0.0821.0820.7050.145
CO2 (ton)0.2151.2150.5800.120
Table 18. Results of the WASPAS method.
StationSolar Hydrogen MCDM ResultWind Hydrogen MCDM Result
QiPiWPSiRankQiPiWPSiRank
Deh Šū0.9850.9850.98530.8680.8680.8683
Laškar Gāh1.0001.0001.00010.9330.9330.9332
Sangīn0.9950.9950.99521.0001.0001.0001
Table 19. Prices of hydrogen produced from renewable energy sources in different parts of the world.
ResearcherAreaSourceLCOH ($/kg)
Andrea et al. [63]Rome, ItalyBiomass11.85
Gökçek and Kale [64]Gökçeada, TurkeyWind–Solar PV8.92
Gökçek and Kale [65]İzmir-Çeşme, TurkeyWind–Solar PV7.526
Almutairi et al. [11]Badakhshan, AfghanistanWind3.887
Almutairi et al. [12]Yazd, IranWind2.1
Present studyHelmand, AfghanistanWind–Solar PV1.45–2.09
Publisher’s Note: MDPI stays neutral with regard to jurisdictional claims in published maps and institutional affiliations.

