
Analysis of China’s Urban Innovation Connection Network Evolution: A Case Study of Henan Province


Abstract
:1. Introduction
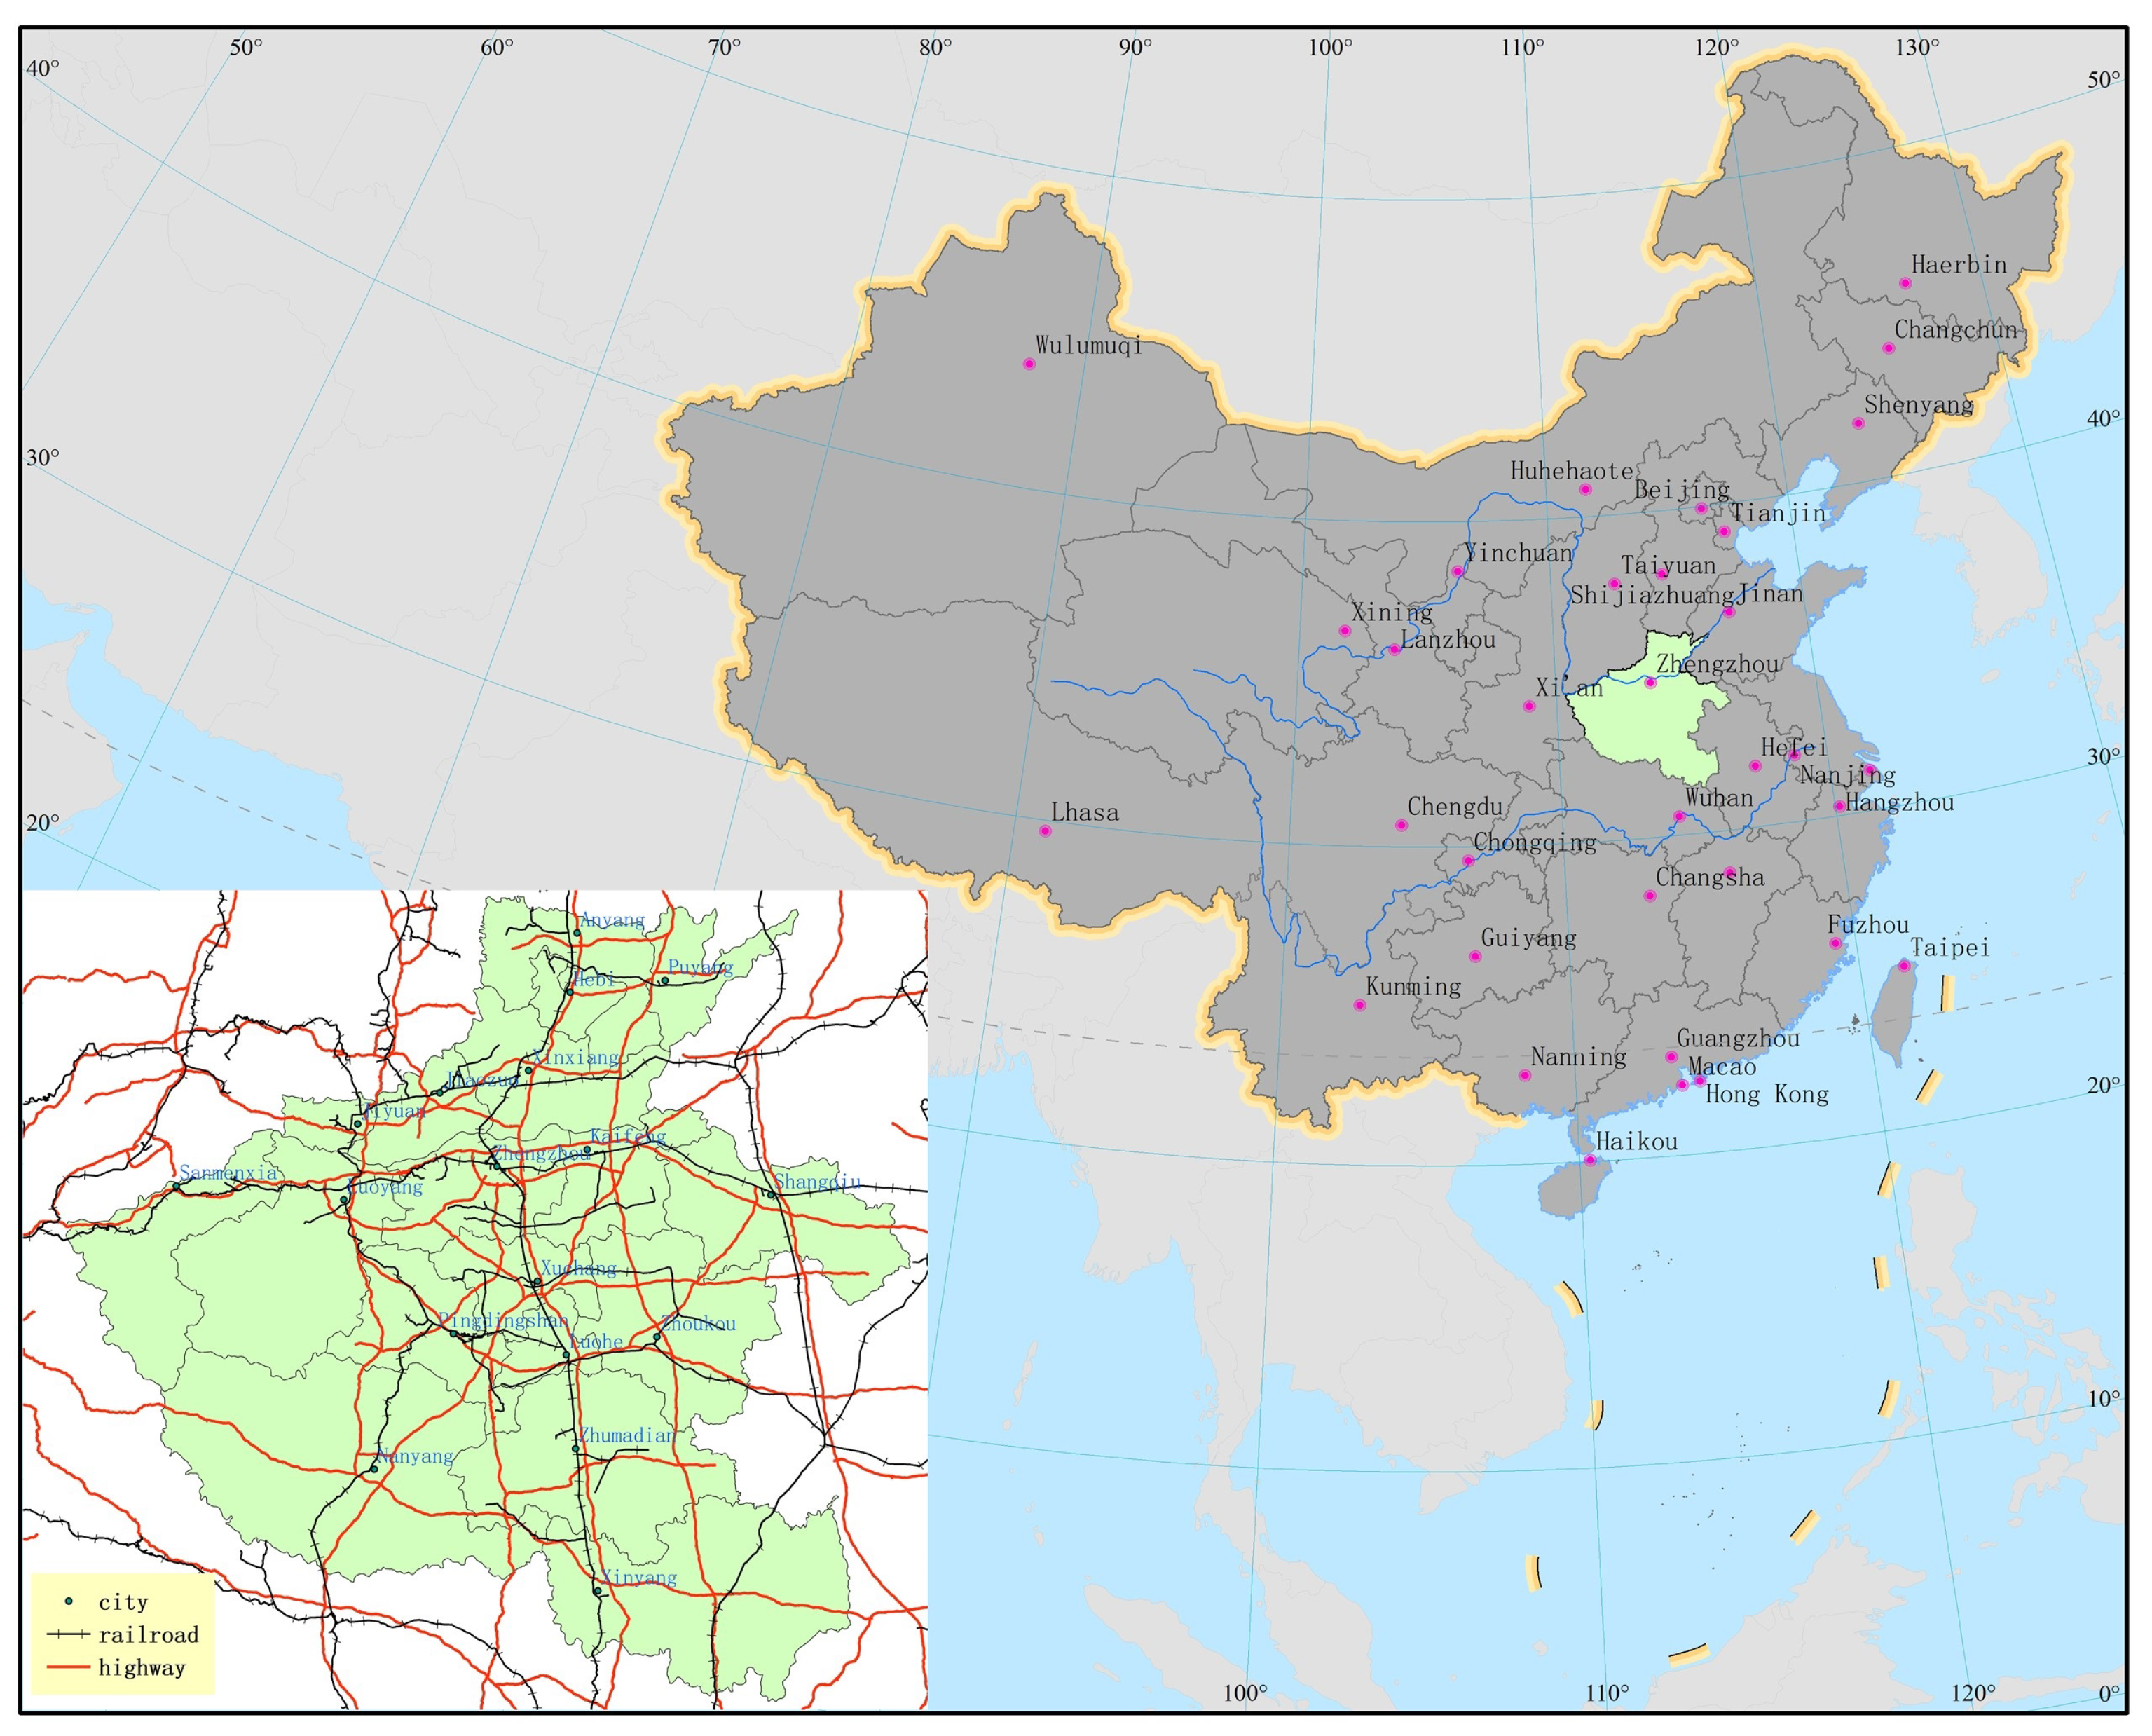
2. Description of the Study Area
3. Data Sources
4. Methods
4.1. Entropy Weight Method
4.2. Gravity-Model Method
5. Results
5.1. Construction of an Index System of Urban Innovation Network
- For the foundation of innovation, the number of students in adult higher education, the number of Internet users (10,000 households) and the general public budget revenue (100 million yuan) account for a higher proportion compared with other secondary indicators.
- Second, for innovation input, the number of legal entities in the scientific research and technology service industry, the external expenditure of research and experimental development (10,000 yuan) and the national financial expenditure on science (100 million yuan) have a higher weight compared with the others.
- Finally, for the innovation output, the number of authorized patents, the output value of new products and the total business volume of the postal industry in the innovation link account for a higher proportion.
5.2. Analysis of the Evolution of the Spatial Structure of Regional Innovation Linkages
5.2.1. Characteristics of the Spatial Pattern of Regional Innovation Linkages
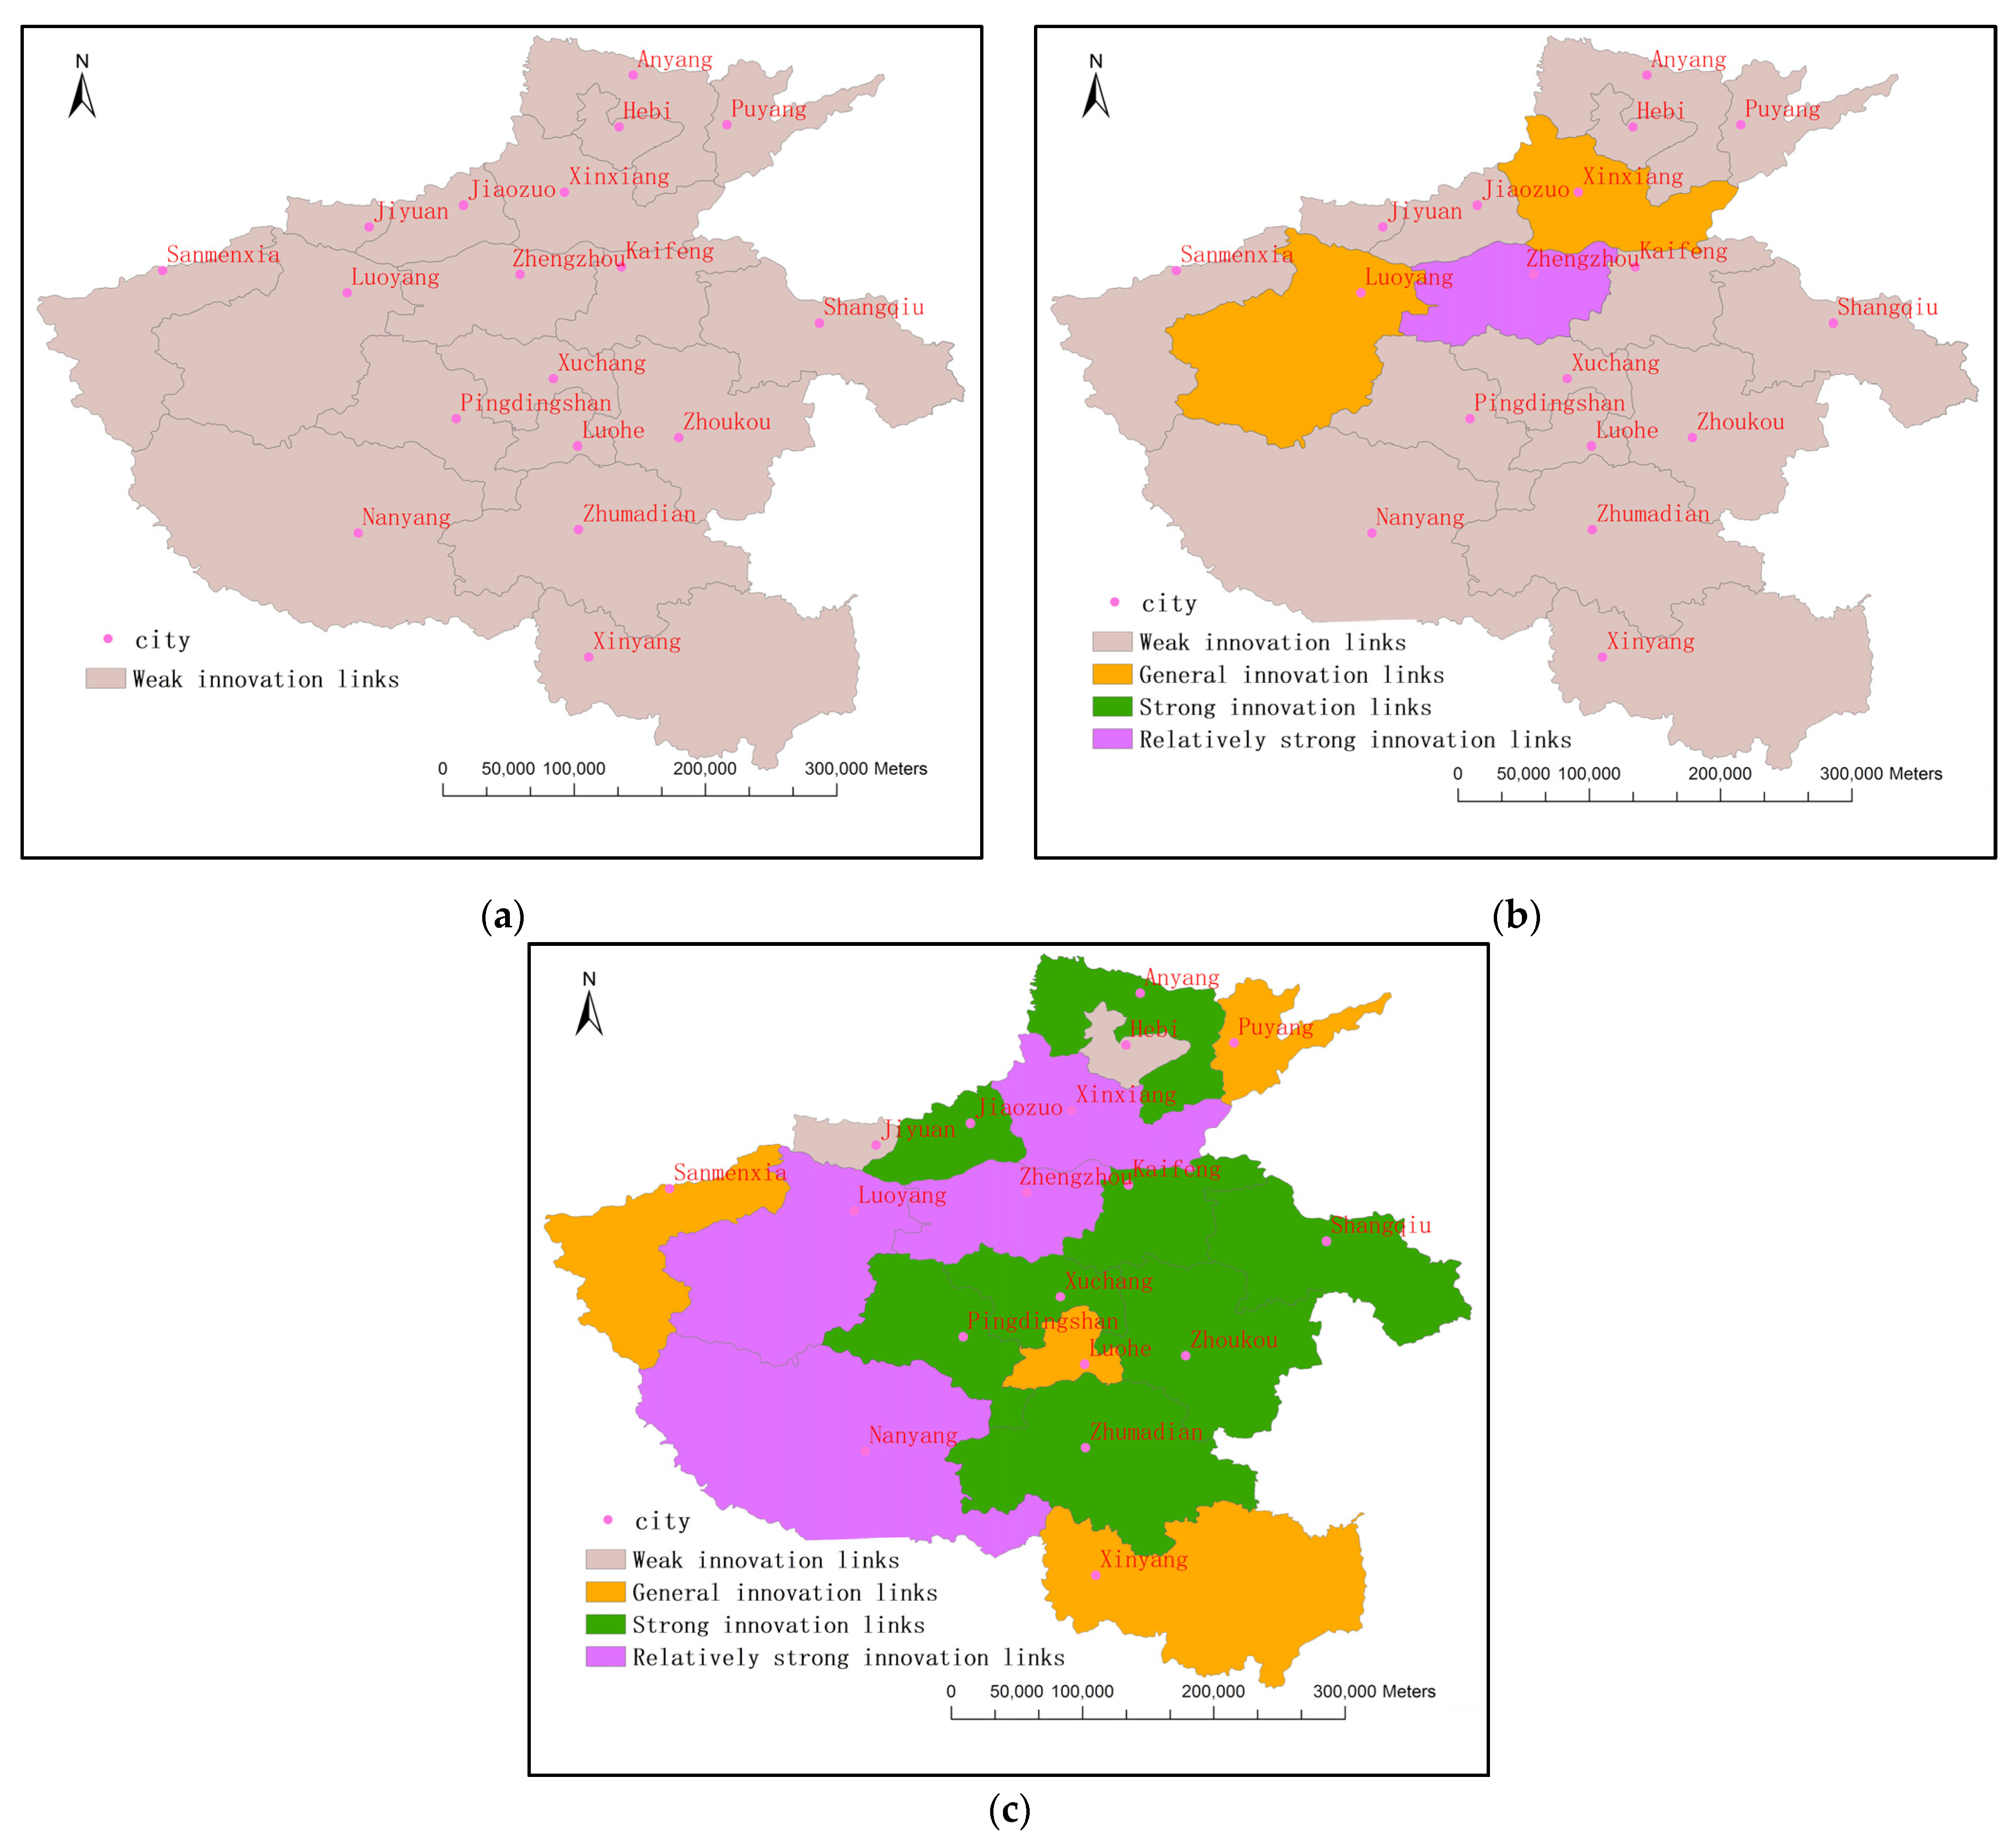
- The overall pattern of regional innovation network in Henan Province is radial with Zhengzhou as the center, which is similar to the pattern of the high-speed rail transportation network in Henan Province (see Figure 2).
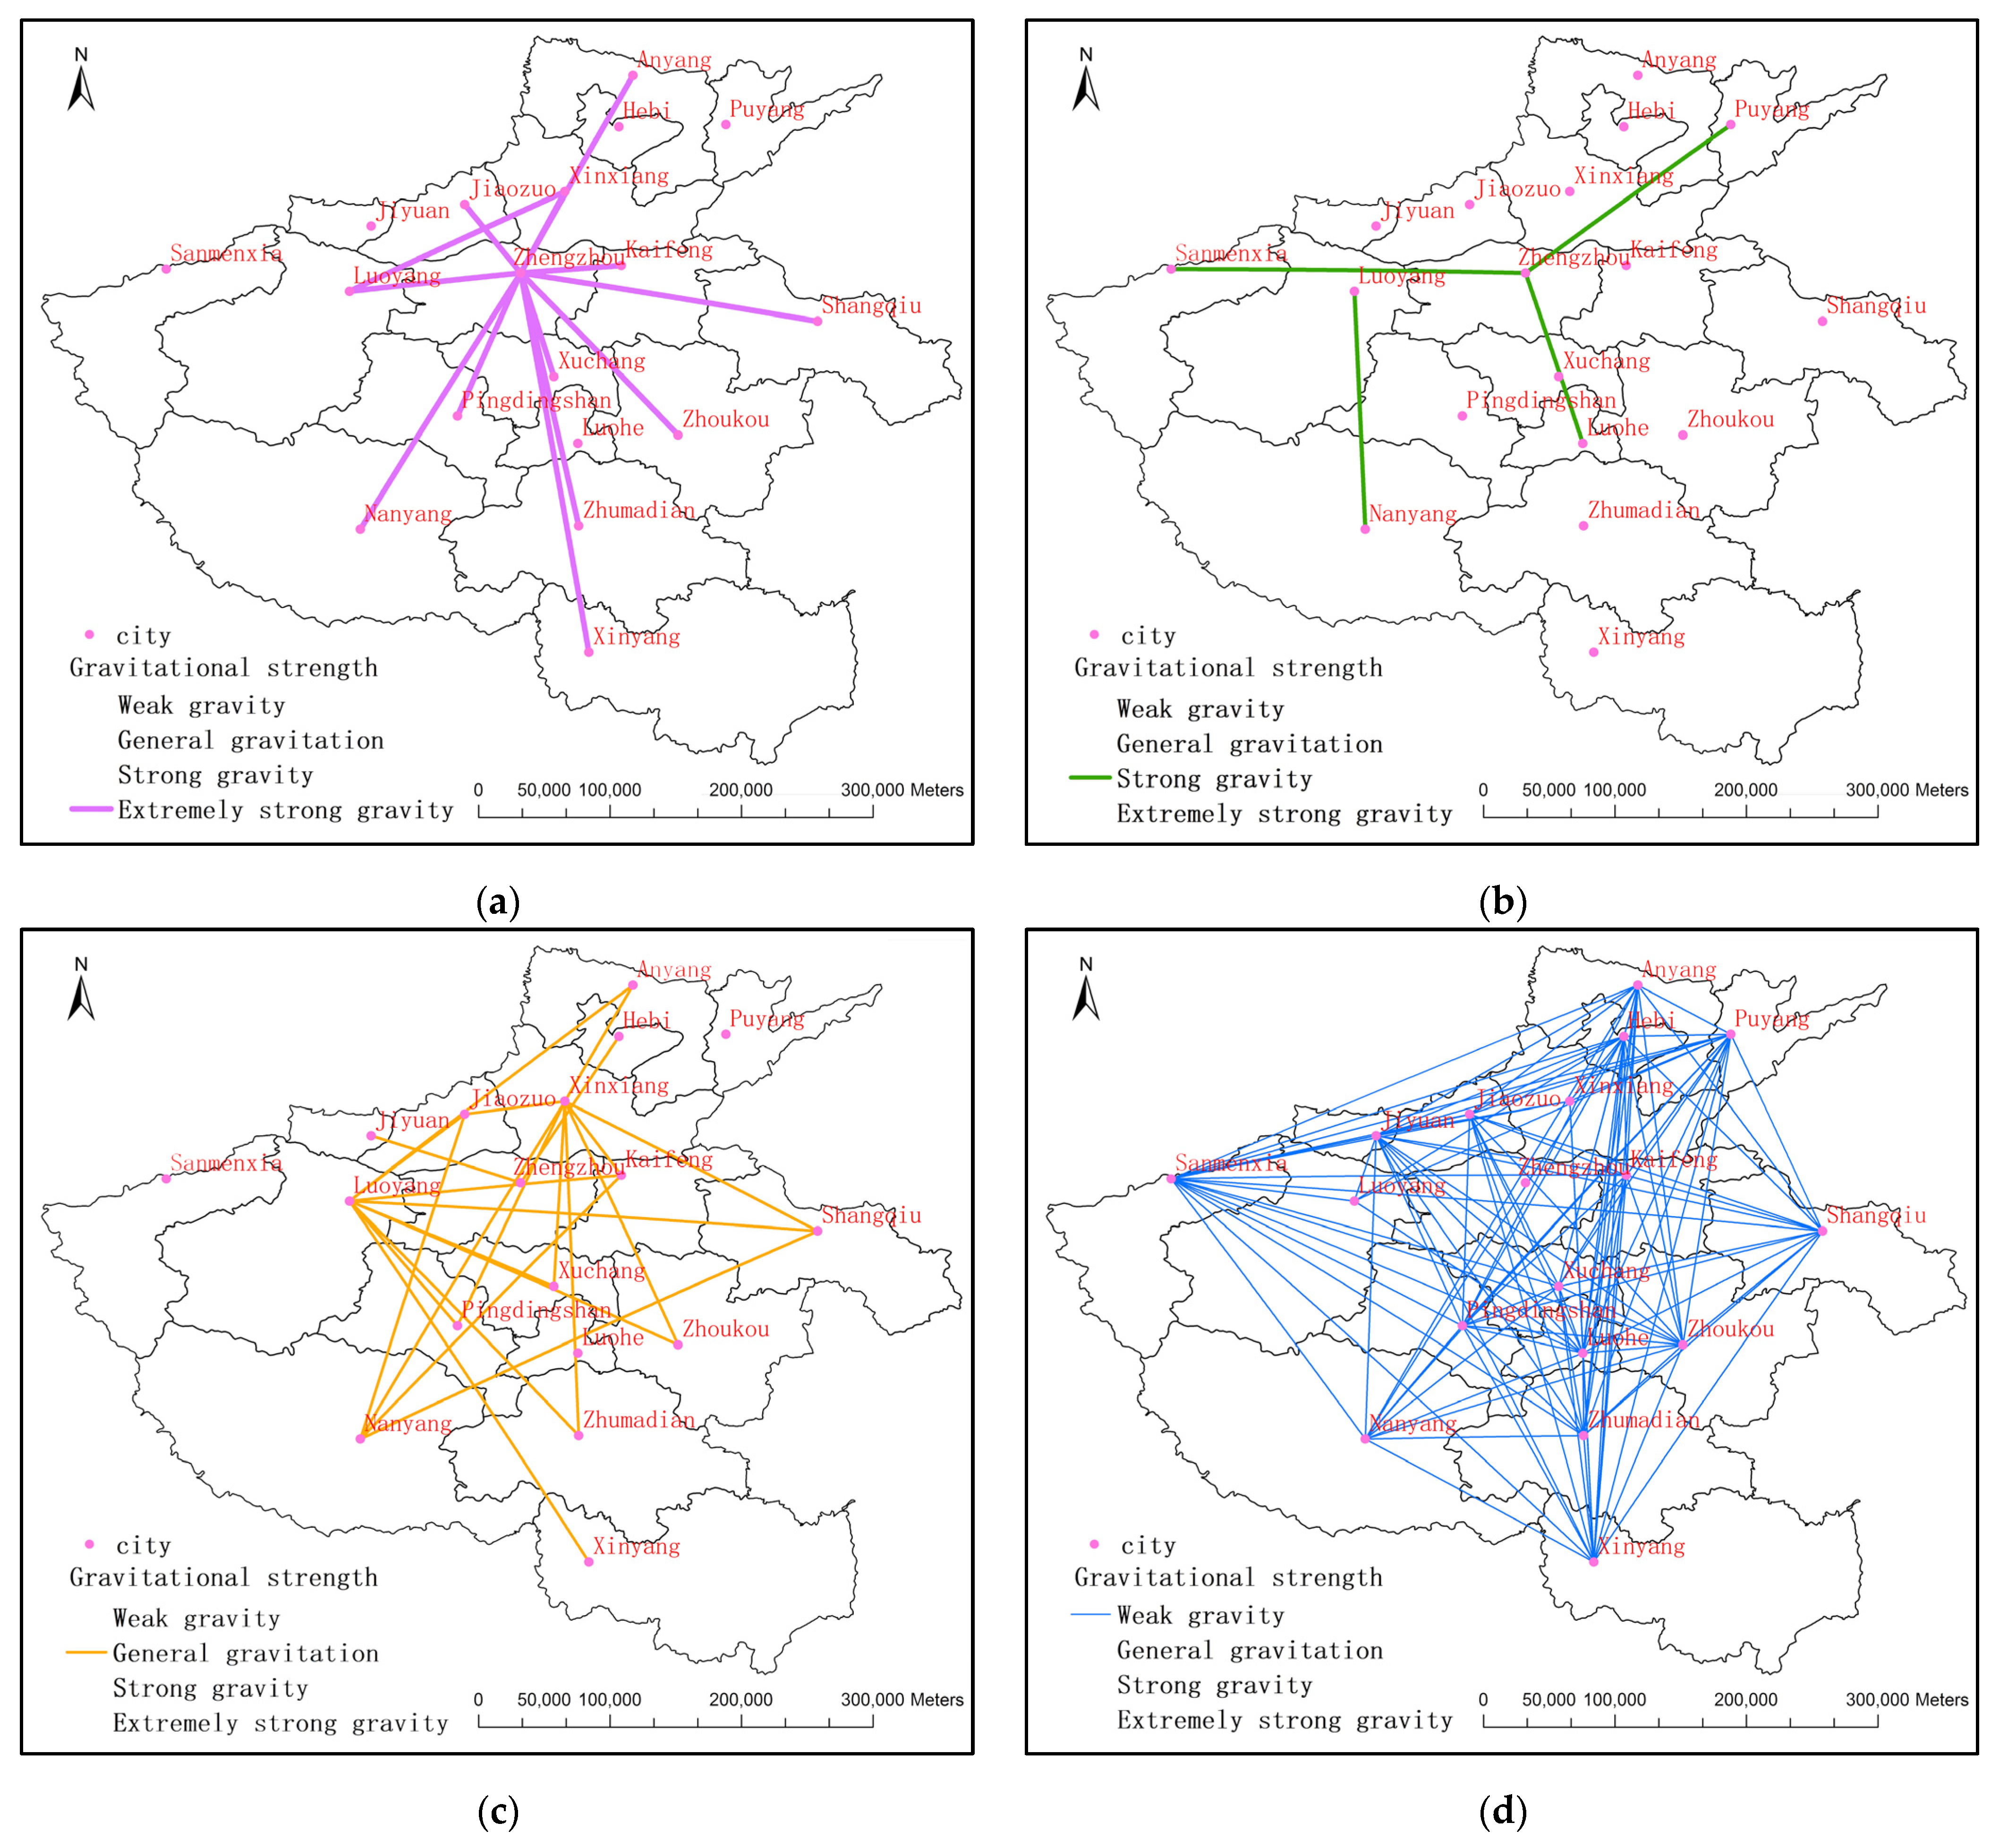
- The spatial structure of the innovation connection in Henan Province presents the characteristics of the “core-periphery” innovation network structure. We can take Zhengzhou as the first-level node city, Luoyang as the second-level node city and Nanyang, Xuchang, Xinxiang, Jiaozuo and Kaifeng as the third-level node cities (see Figure 3, Table 2).
- The innovation link of the city was found to be strong in the core development area of the Central Plains city group. The core is Zhengzhou with Xinxiang in the north, Xuchang in the south, Luoyang in the west, Jiaozuo in the northwest and Kaifeng in the east. There are six cities in the core development zone. Further, the innovation connection of marginal cities is weak, and they are on the radiation edge of central cities (see Figure 3).
- In this region of Henan Province, the innovation link conformed to the law of scale grade, where the larger the city scale and the higher the city level, the stronger the innovation link between the cities.
- The innovation links also followed the law of the quantity of scale, where the larger the size of the city and the smaller the number of cities, the more a “pyramid” shape was revealed.
- There are strong innovative connections between neighboring cities and cities in the main corridor of regional development, and weaker connections between marginal cities.
5.2.2. Evolution of the Spatial Pattern of Regional Innovation Linkages
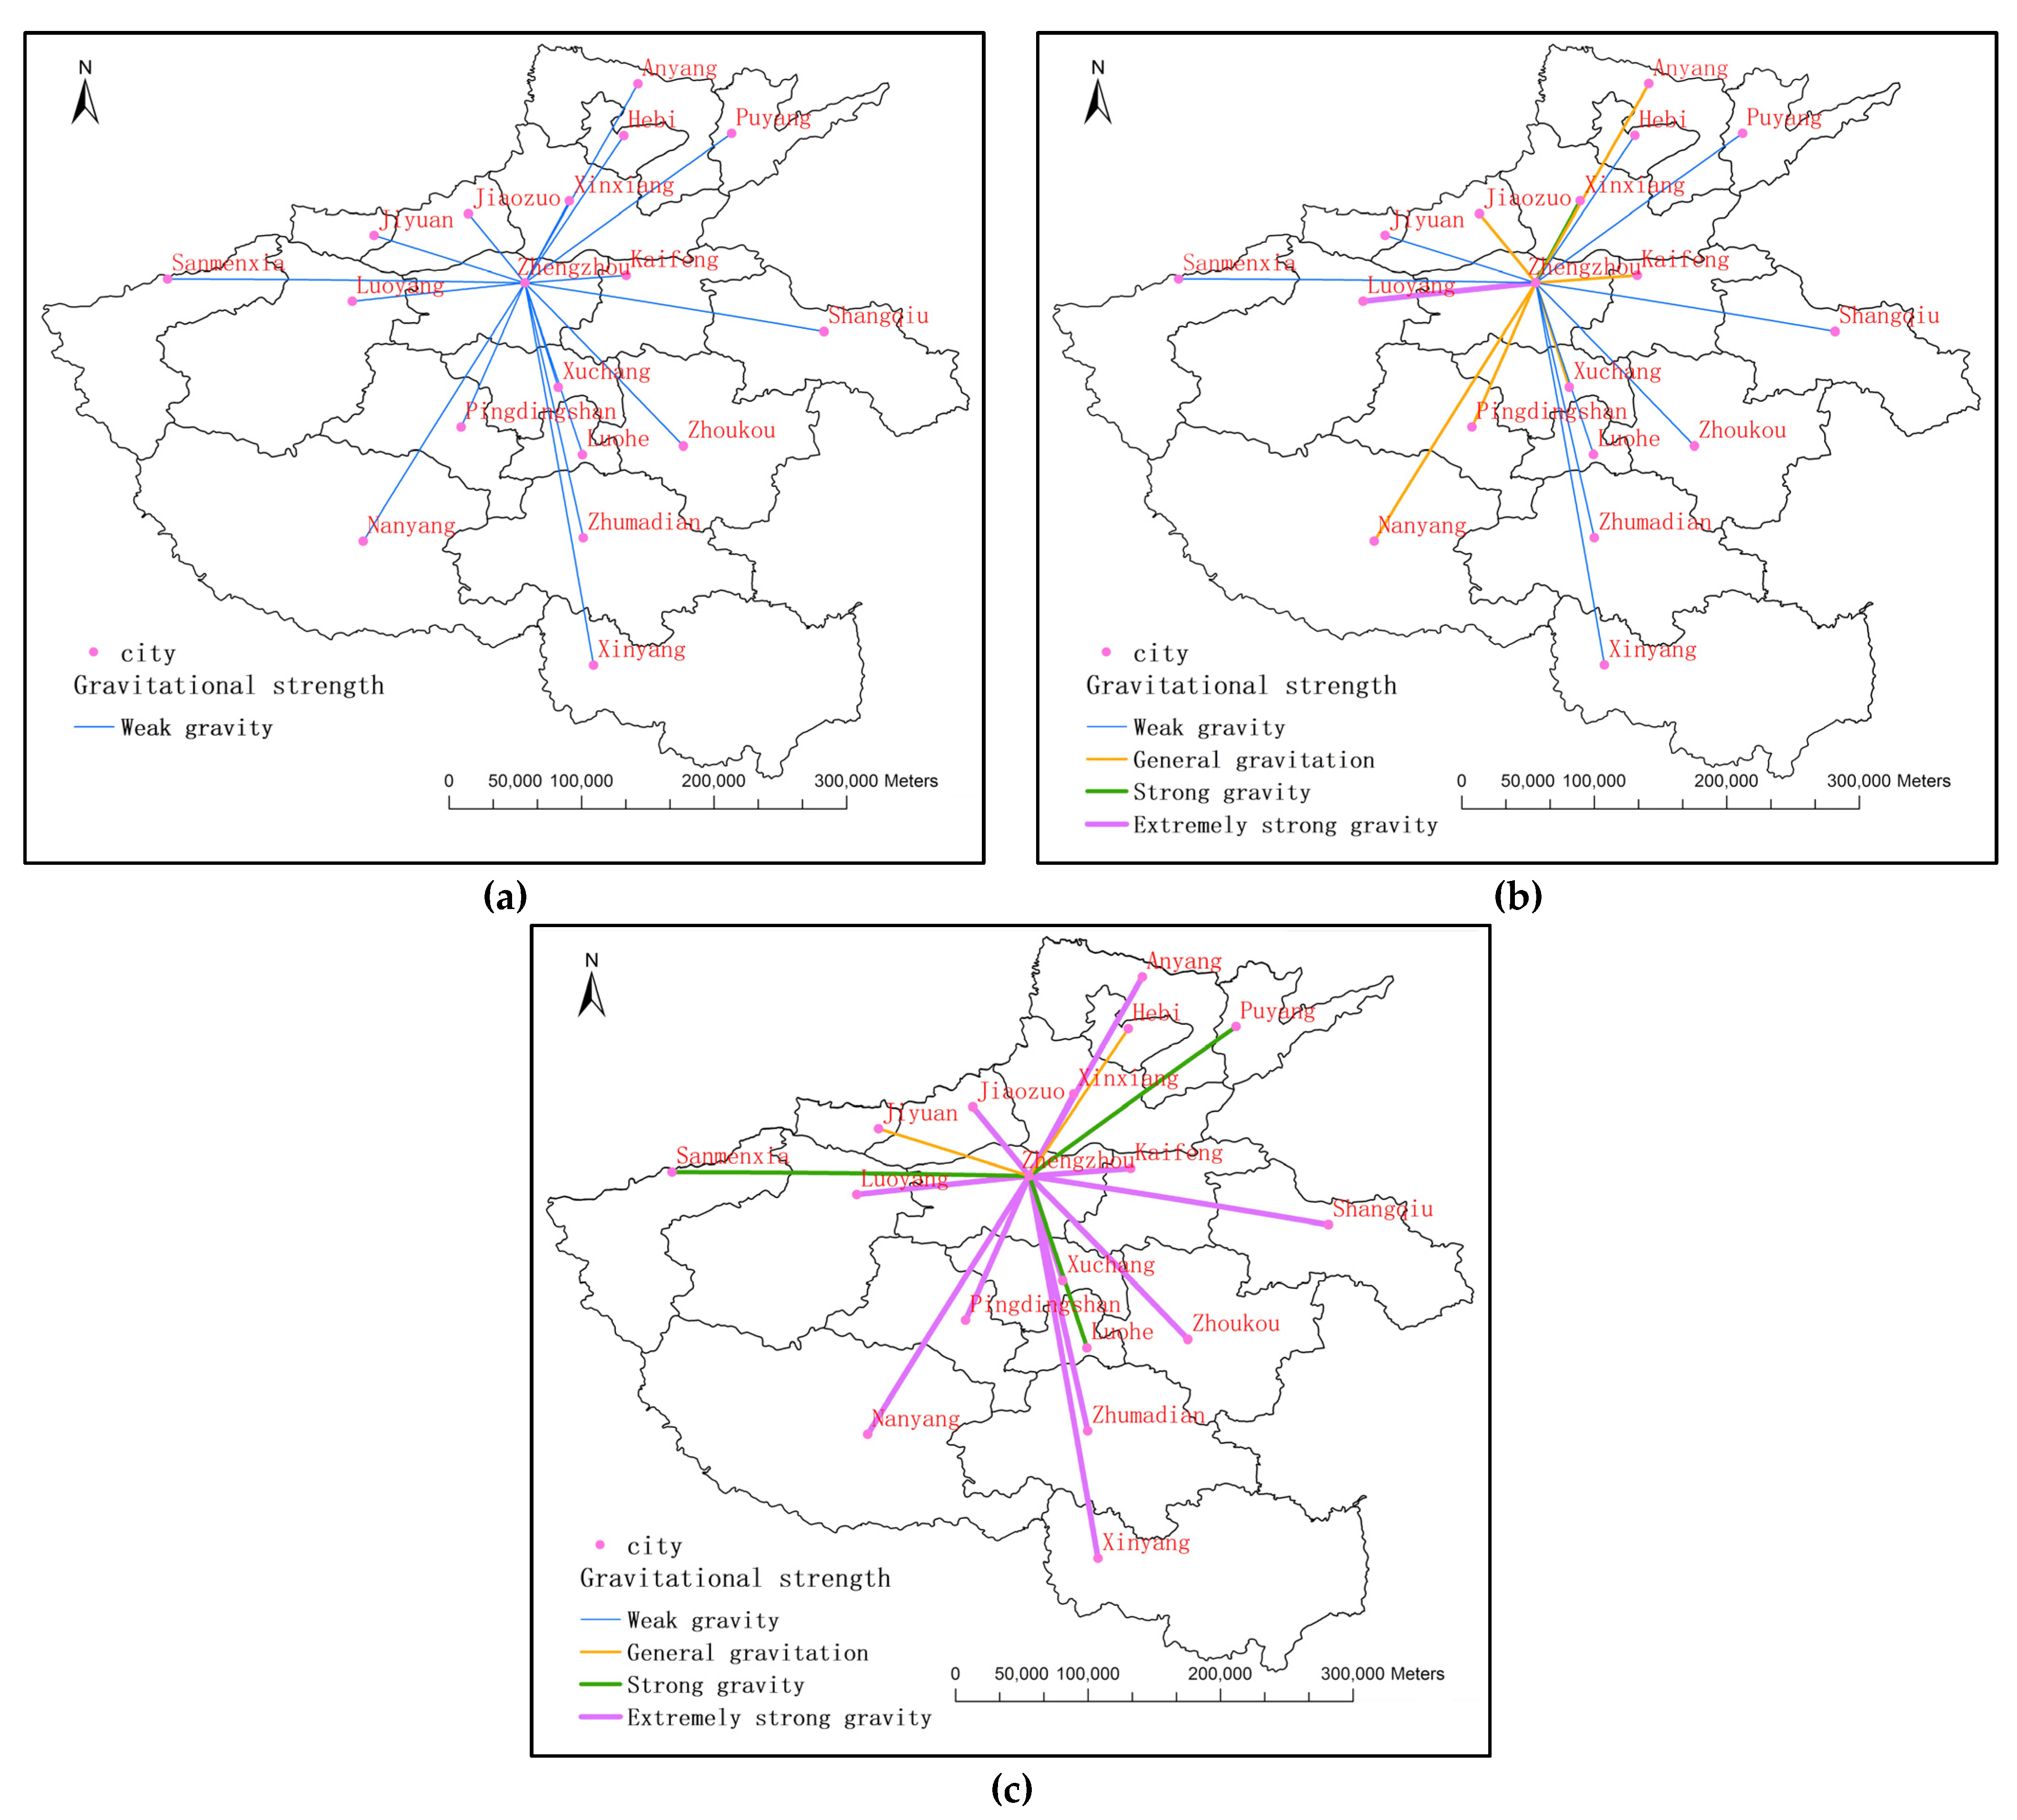
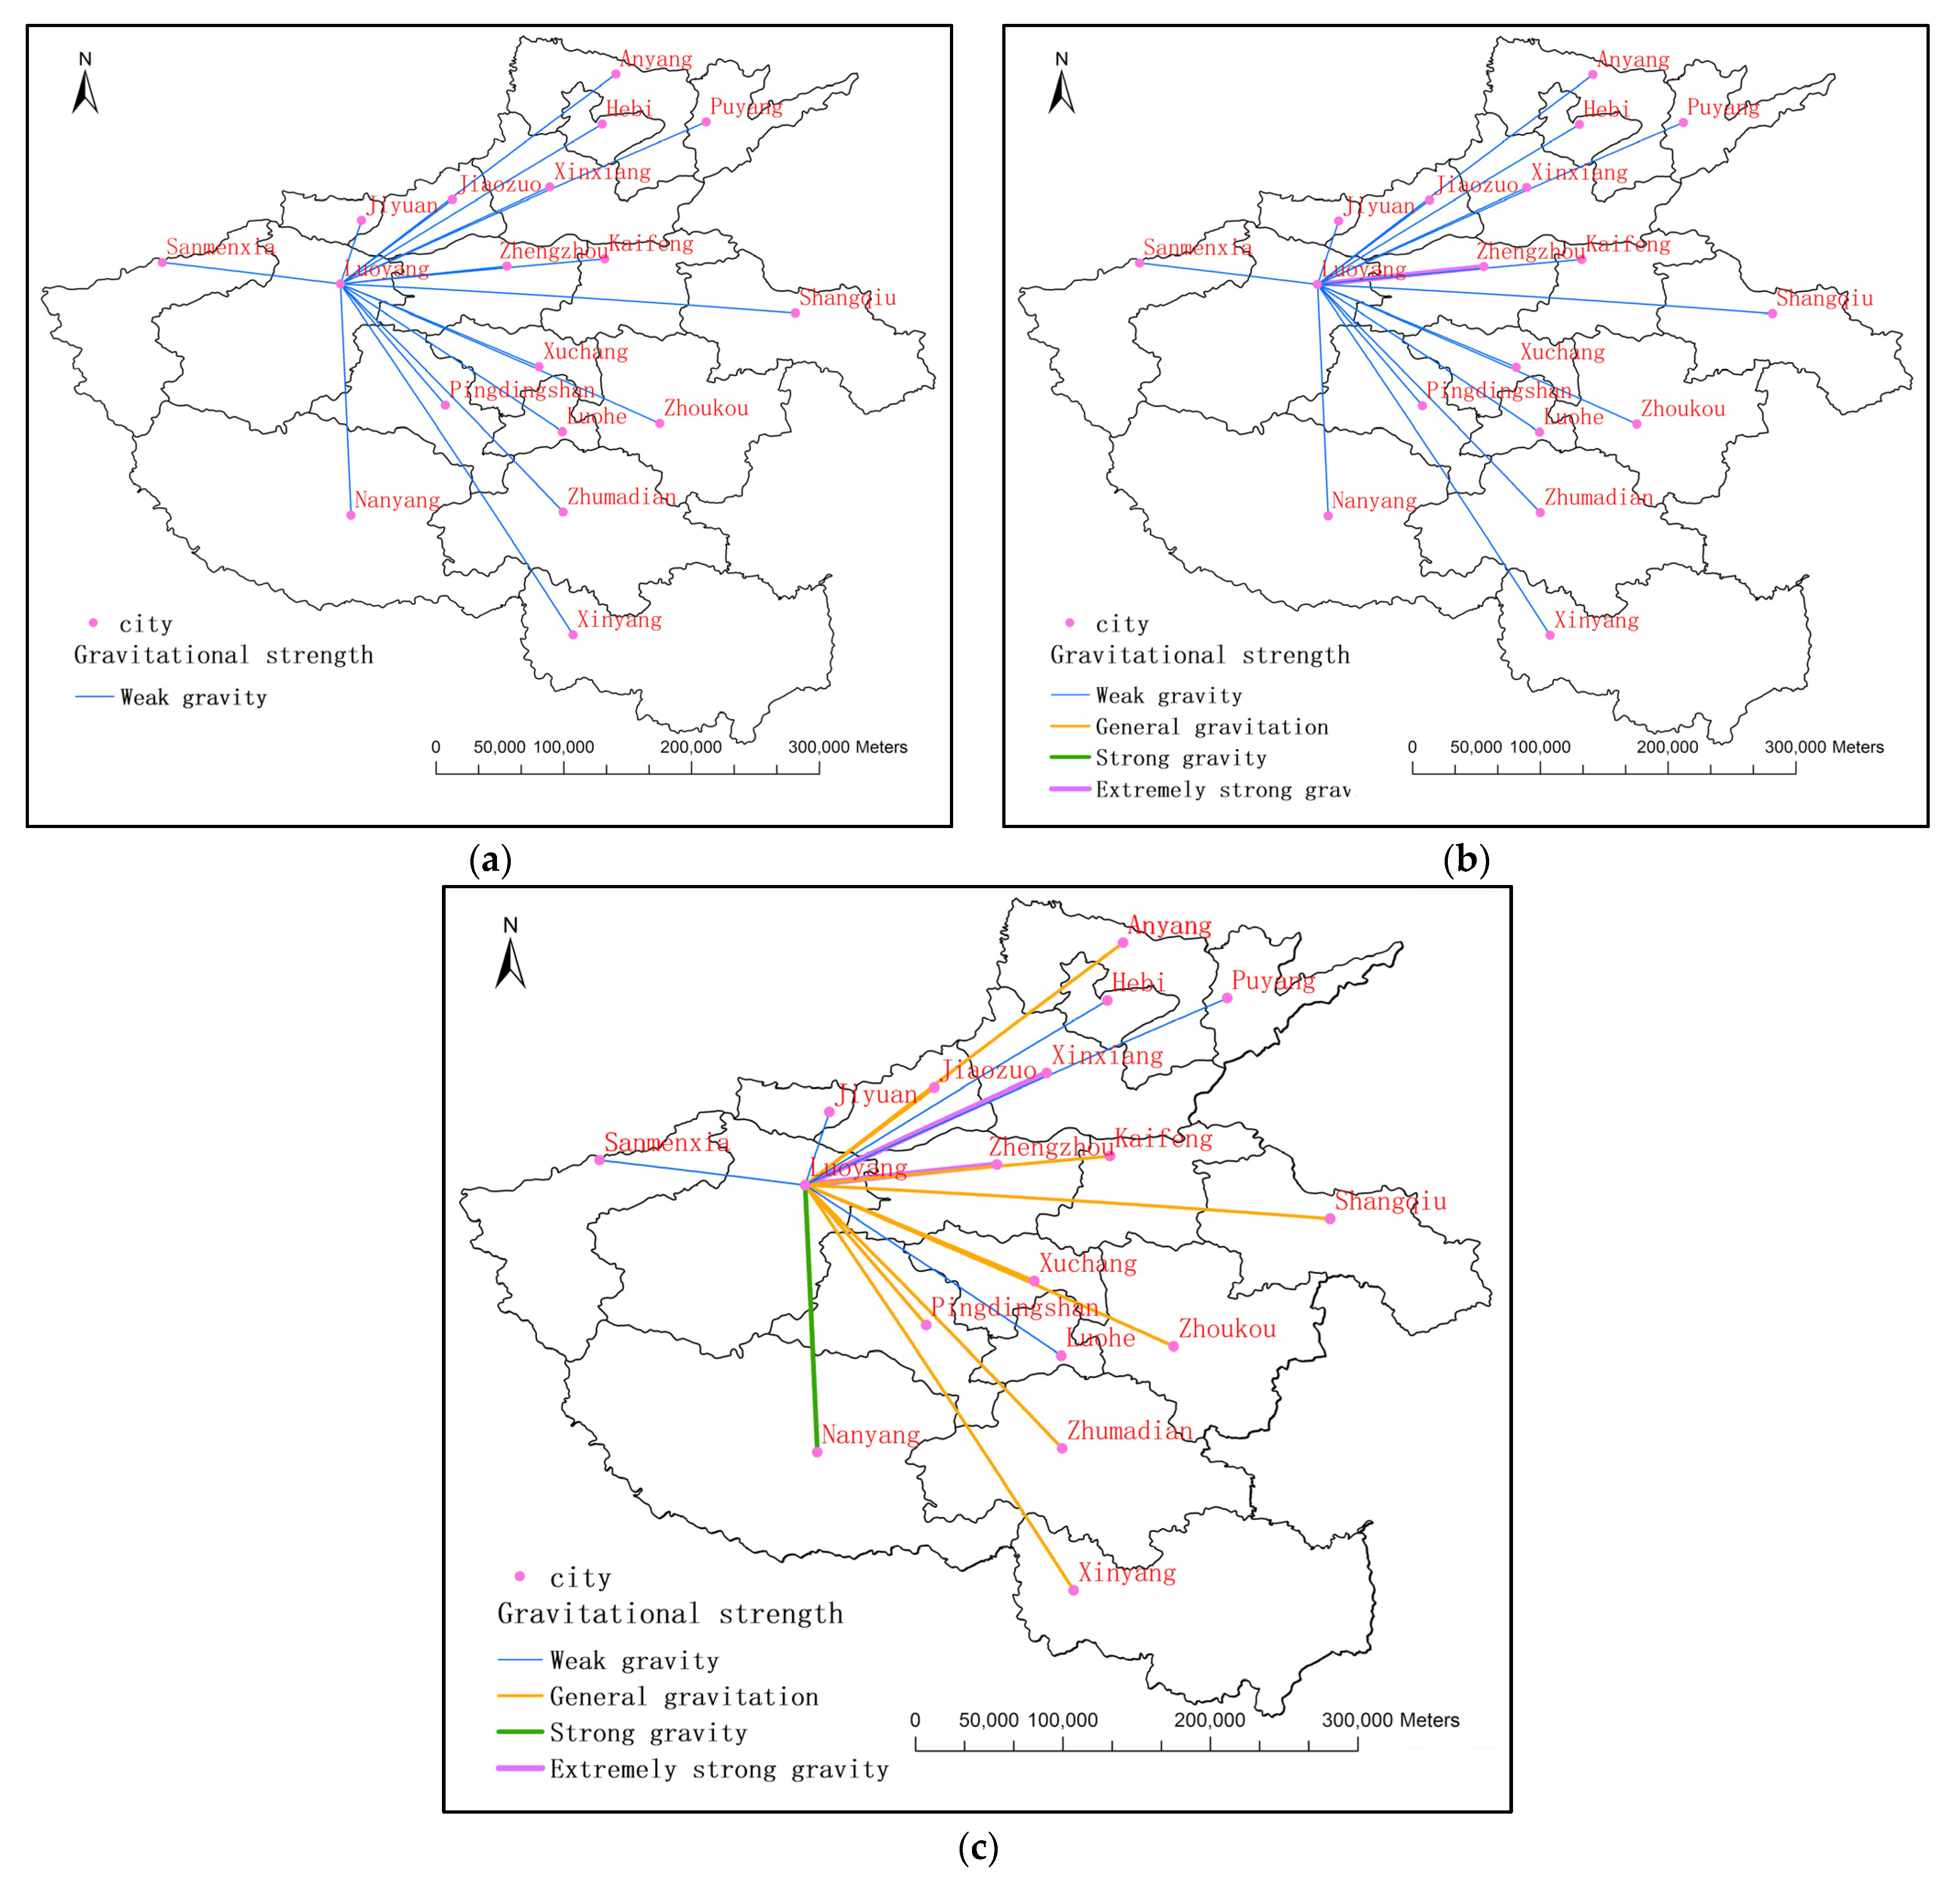
- First, from 2008 to 2018, the urban innovation link in Henan Province presented the structural characteristics of the “Zhengzhou-Loyang” dual core, where the trend of networking was obviously enhanced. The innovation connection development of Nanyang, Xinxiang, Xuchang and Jiaozuo caused the collection of innovation links to appear on the basis of a certain degree of difference. Simultaneously, the trend for the network characteristics of the urban innovation links was more significant, and the links between the cities were more complex.
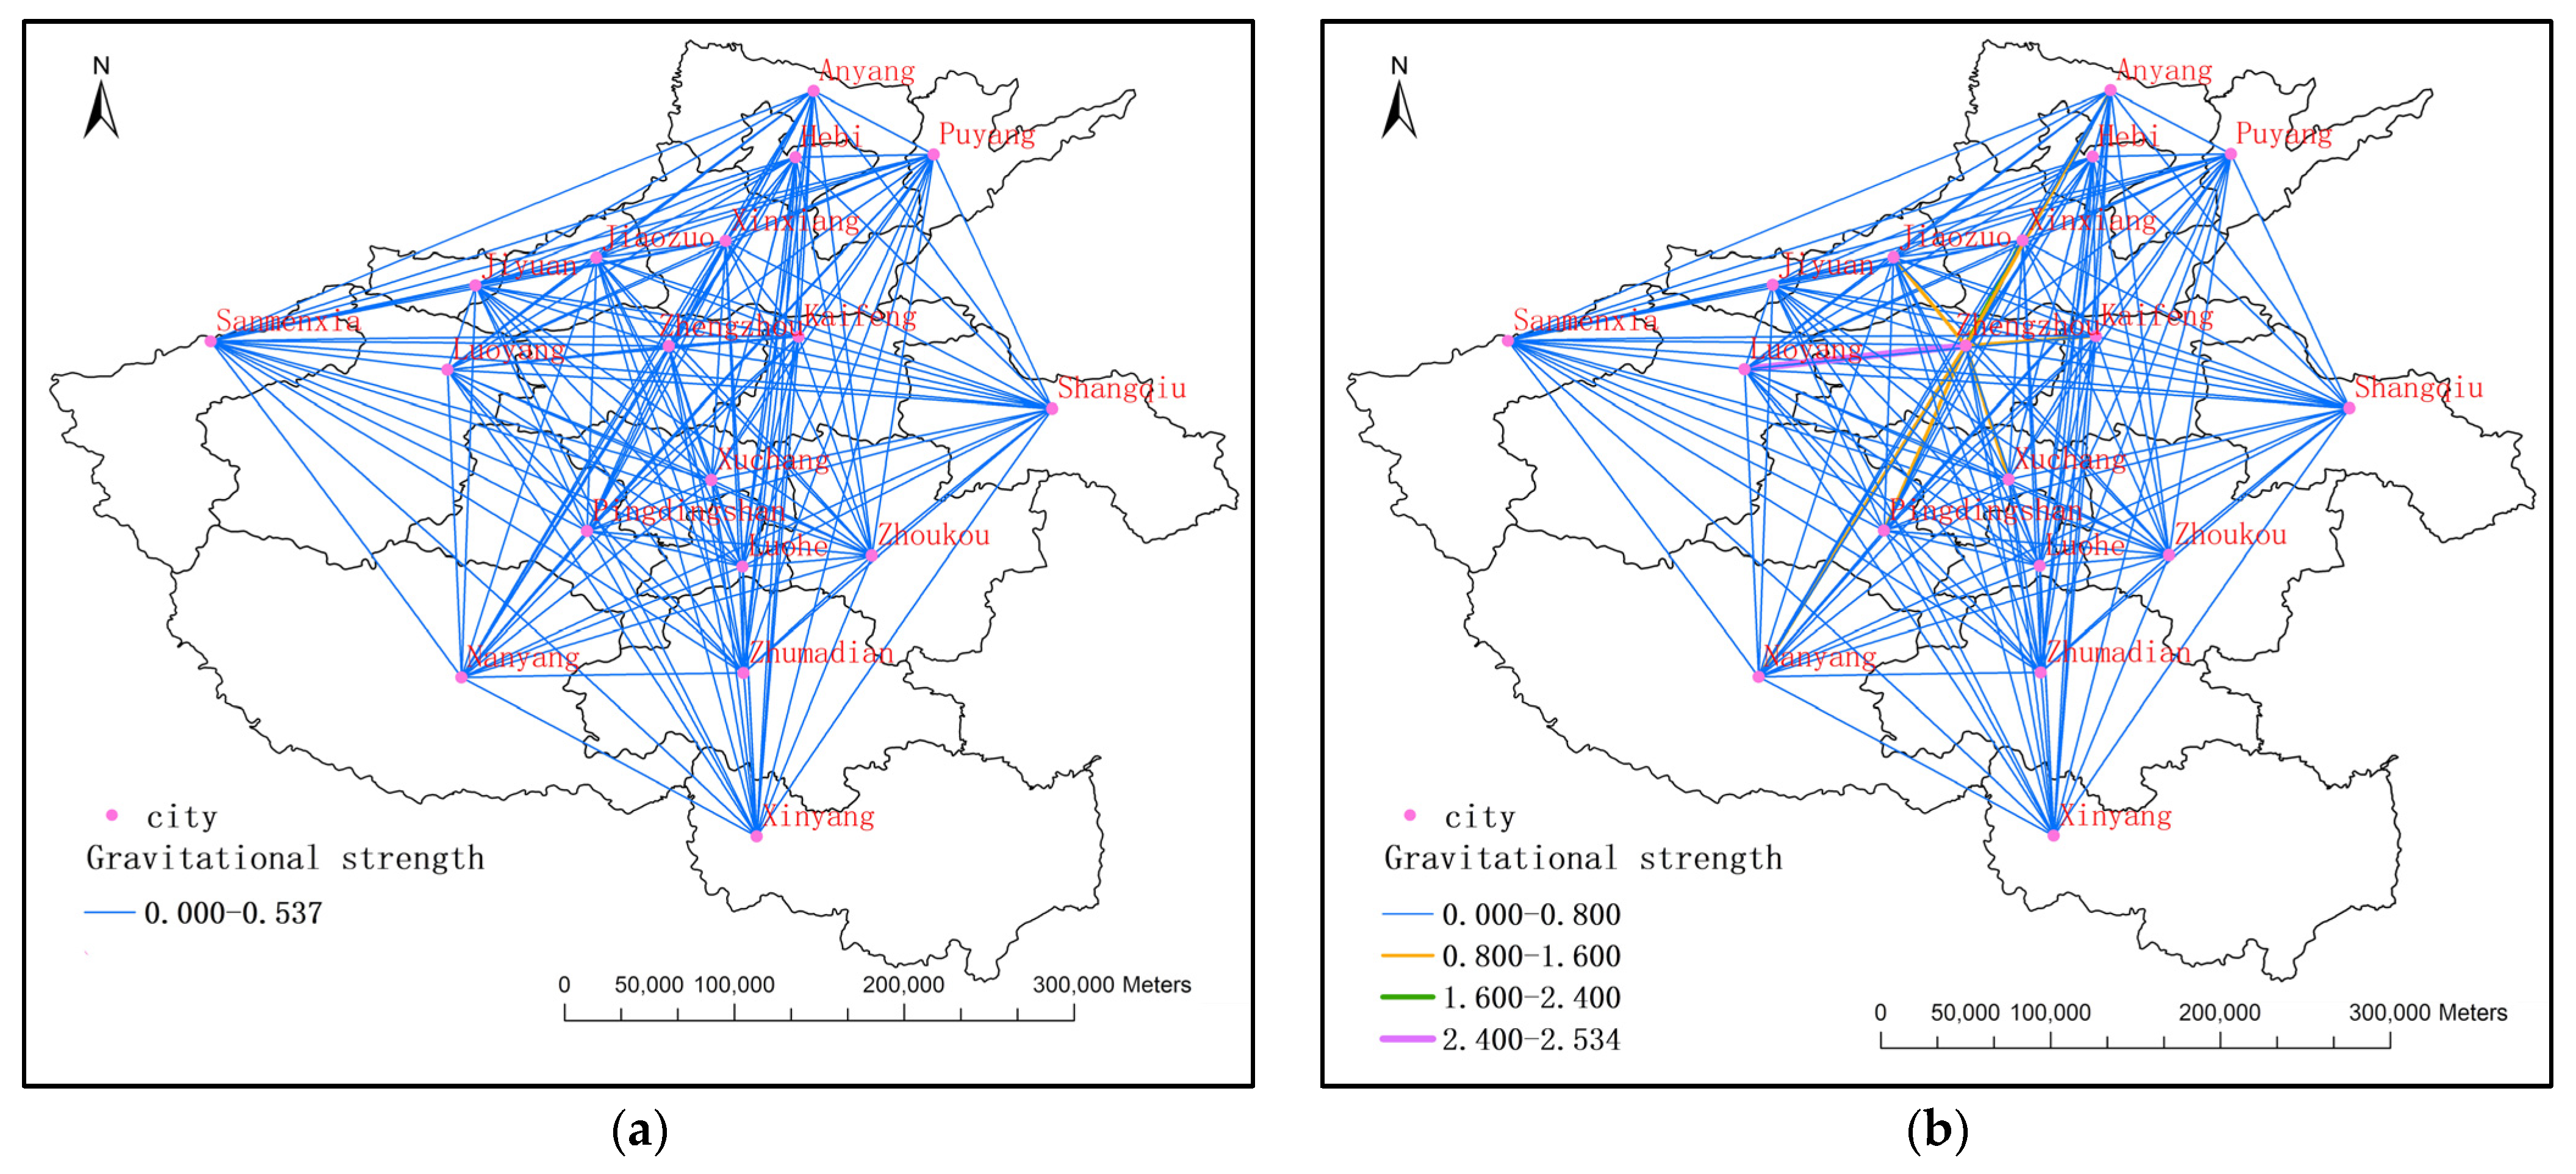
- Second, the lowest value of the innovation gravity in Henan Province in 2008 was 0.0064, and this was between the Three Gate Gorges and the crane wall; the maximum was 0.537, and this was between Zhengzhou and Luoyang.
- Third, the maximum value of the innovation gravity in Henan Province in 2012 was 2.534, and this was between Zhengzhou and Luoyang; the minimum value was 0.015, and this was between Luohe and Hebi.
- Next, the maximum innovation gravity in Henan Province in 2018 was 10.93, and this was between Zhengzhou and Luoyang—this was up from 0.537 in 2008 and 2.534 in 2013.
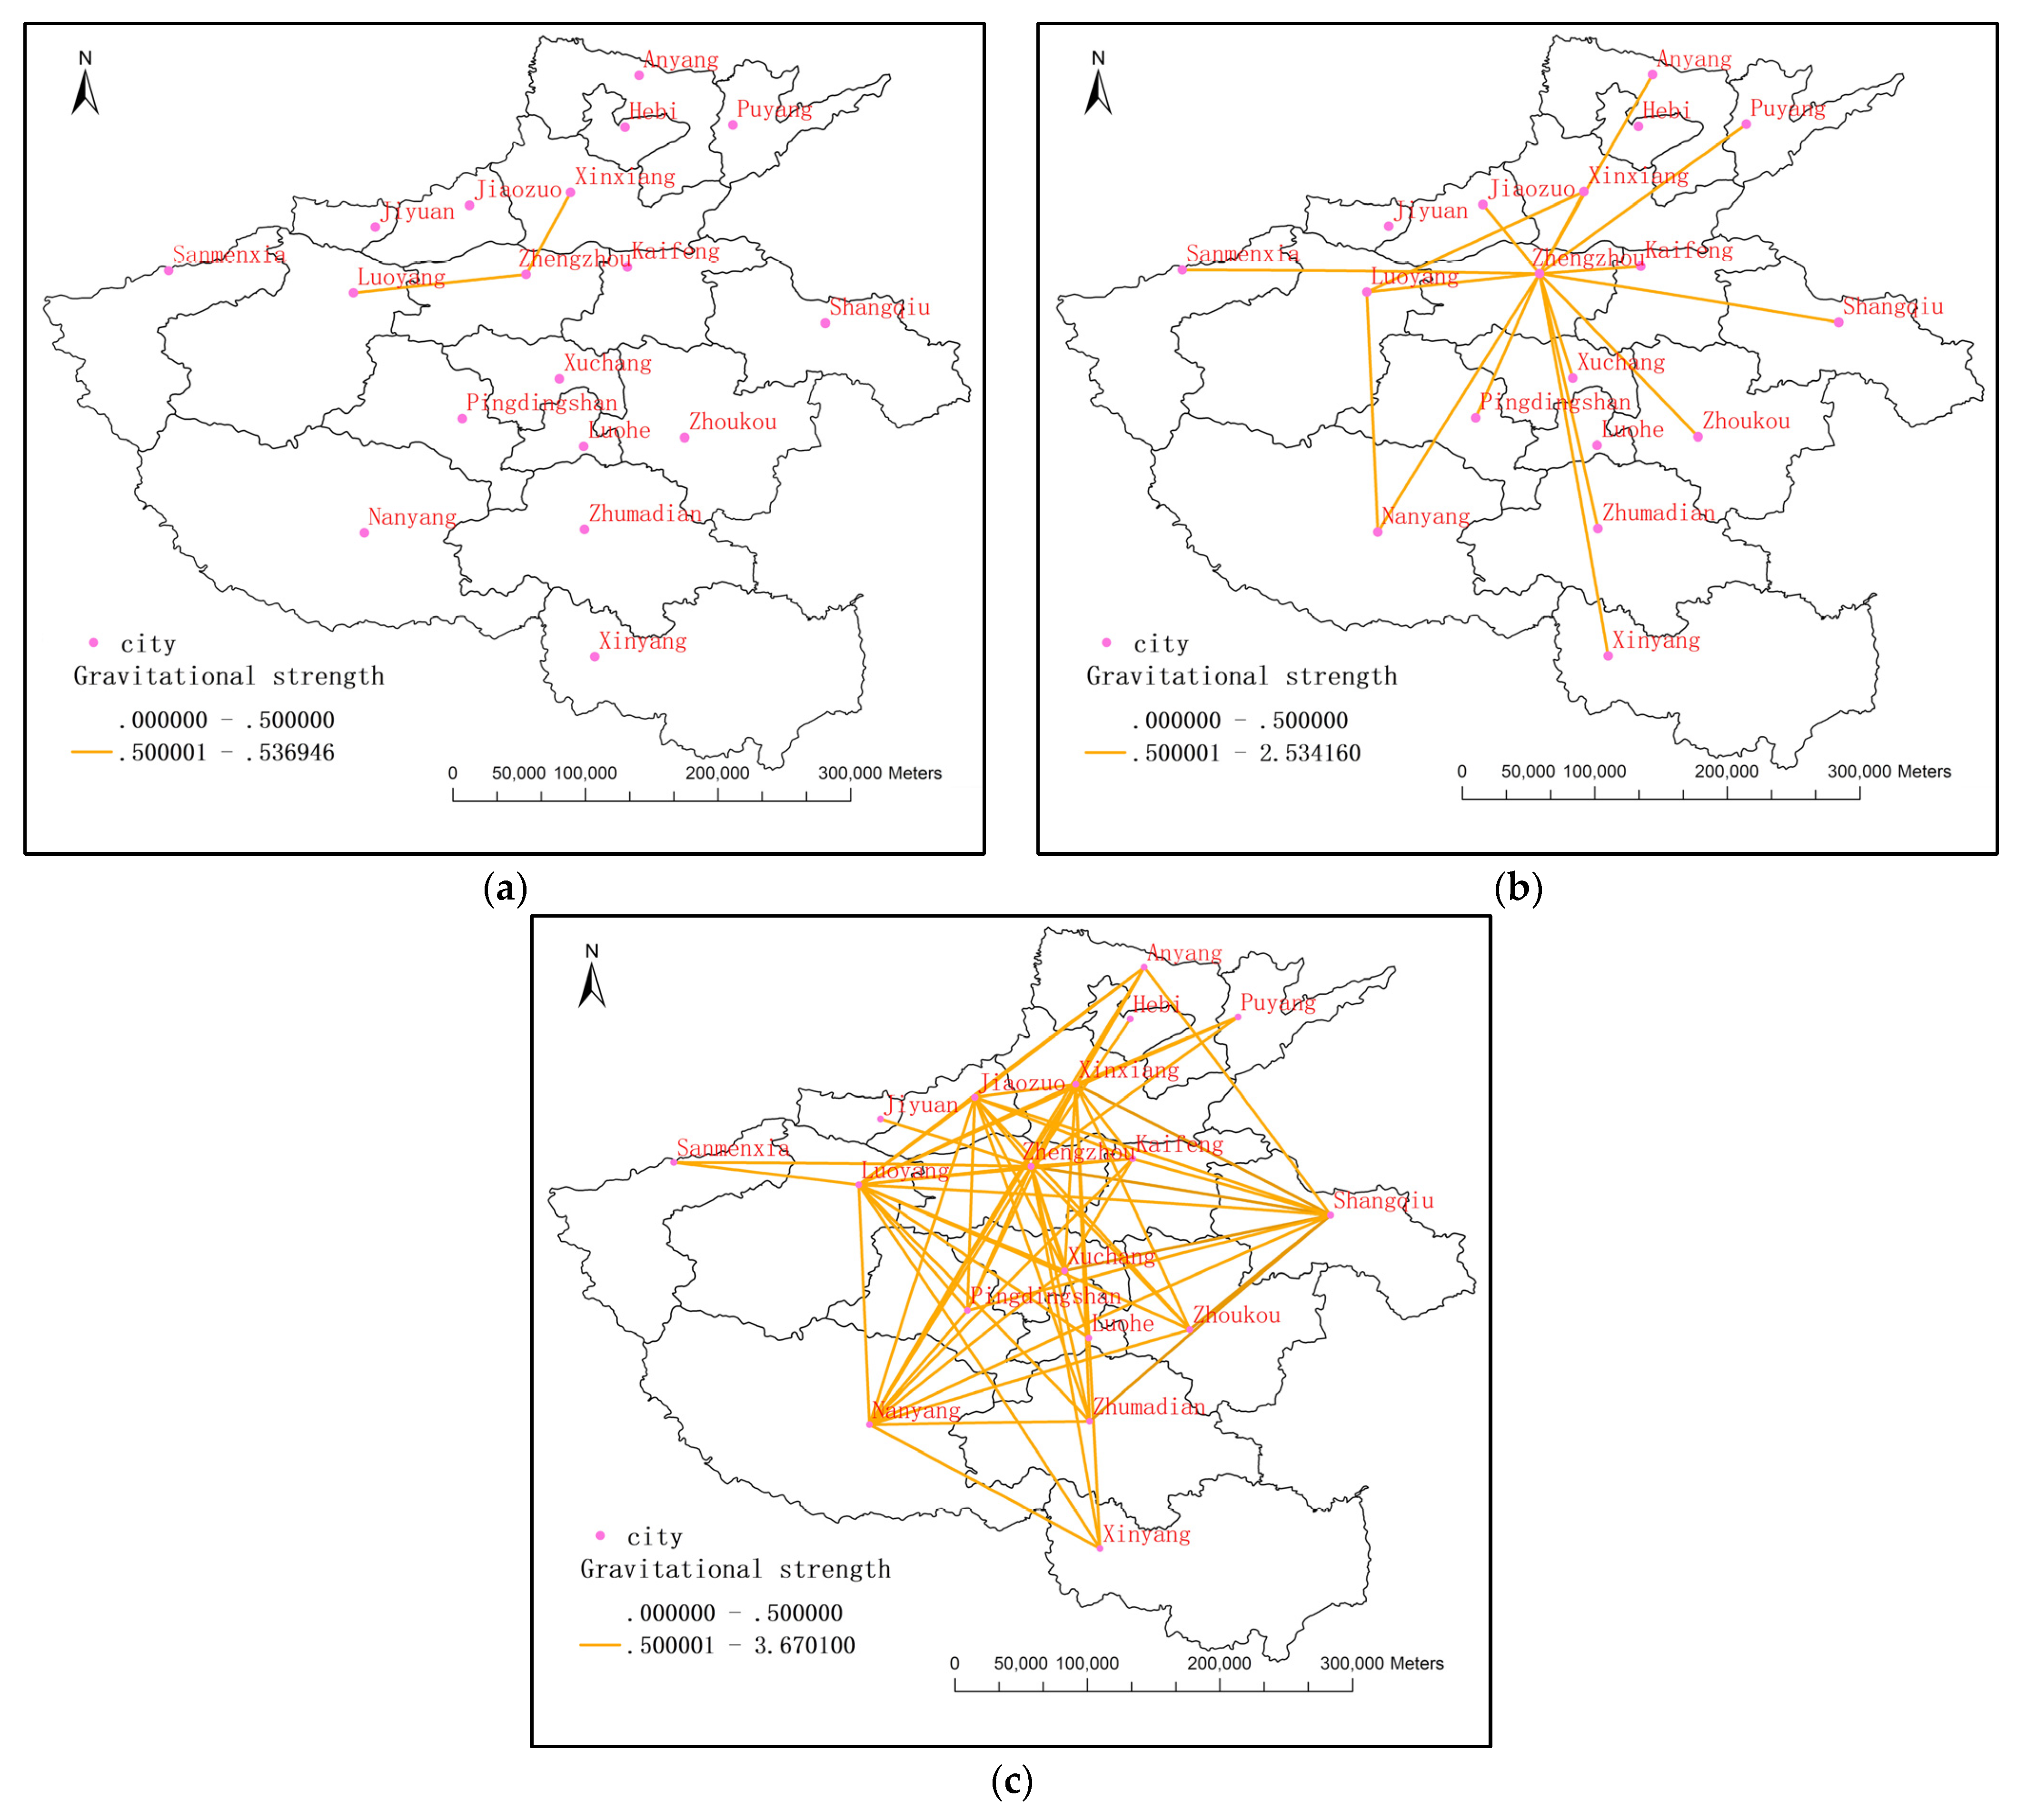
- In 2008, the innovation link gravity reached more than 0.5 cities, and only Zhengzhou and Luoyang, and Zhengzhou and Xinxiang were the cities between the innovation links.
- In 2013, Zhengzhou and Kaifeng, Pingdingshan, Anyang, Jiaozuo, Puyang, Xuchang, Sanmenxia, Nanyang City, Shangqiu City, Xinyang City, Zhoukou City, Zhumadian City, Luoyang and Xinxiang were added.
- In 2018, the growth rate of new cities rose to meet the standards. This can be observed in Figure 5, where the weak link was Jiyuan, Hebi, Luohe and Sanmenxia, and other cities experienced more significant development.
- Overall, the 5-year development rate from 2013 to 2018 was found to be quicker than that in the period of 2008–2013. Further, it can be observed that Zhengzhou’s gravity became increasingly stronger, and the central clustering effect was more obvious. However, Luoyang City, Nanyang City, Xinxiang and Jiaozuo have witnessed a larger increase in innovation-linked gravity in recent years.
- In 2008, Zhengzhou’s attraction to all cities was relatively weak. In 2013, the gravity between Luoyang and Zhengzhou reached a very strong level, and the gravity between Zhengzhou and Xinxiang reached a relatively strong level. By 2018, Zhengzhou’s gravity to all surrounding cities will reach an average level or above.
- Overall, Zhengzhou’s radiation capacity and attraction capacity were strengthened, and the aggregation effect was obvious.
5.3. Evolution Pattern of the Regional-Innovation Time Linkage
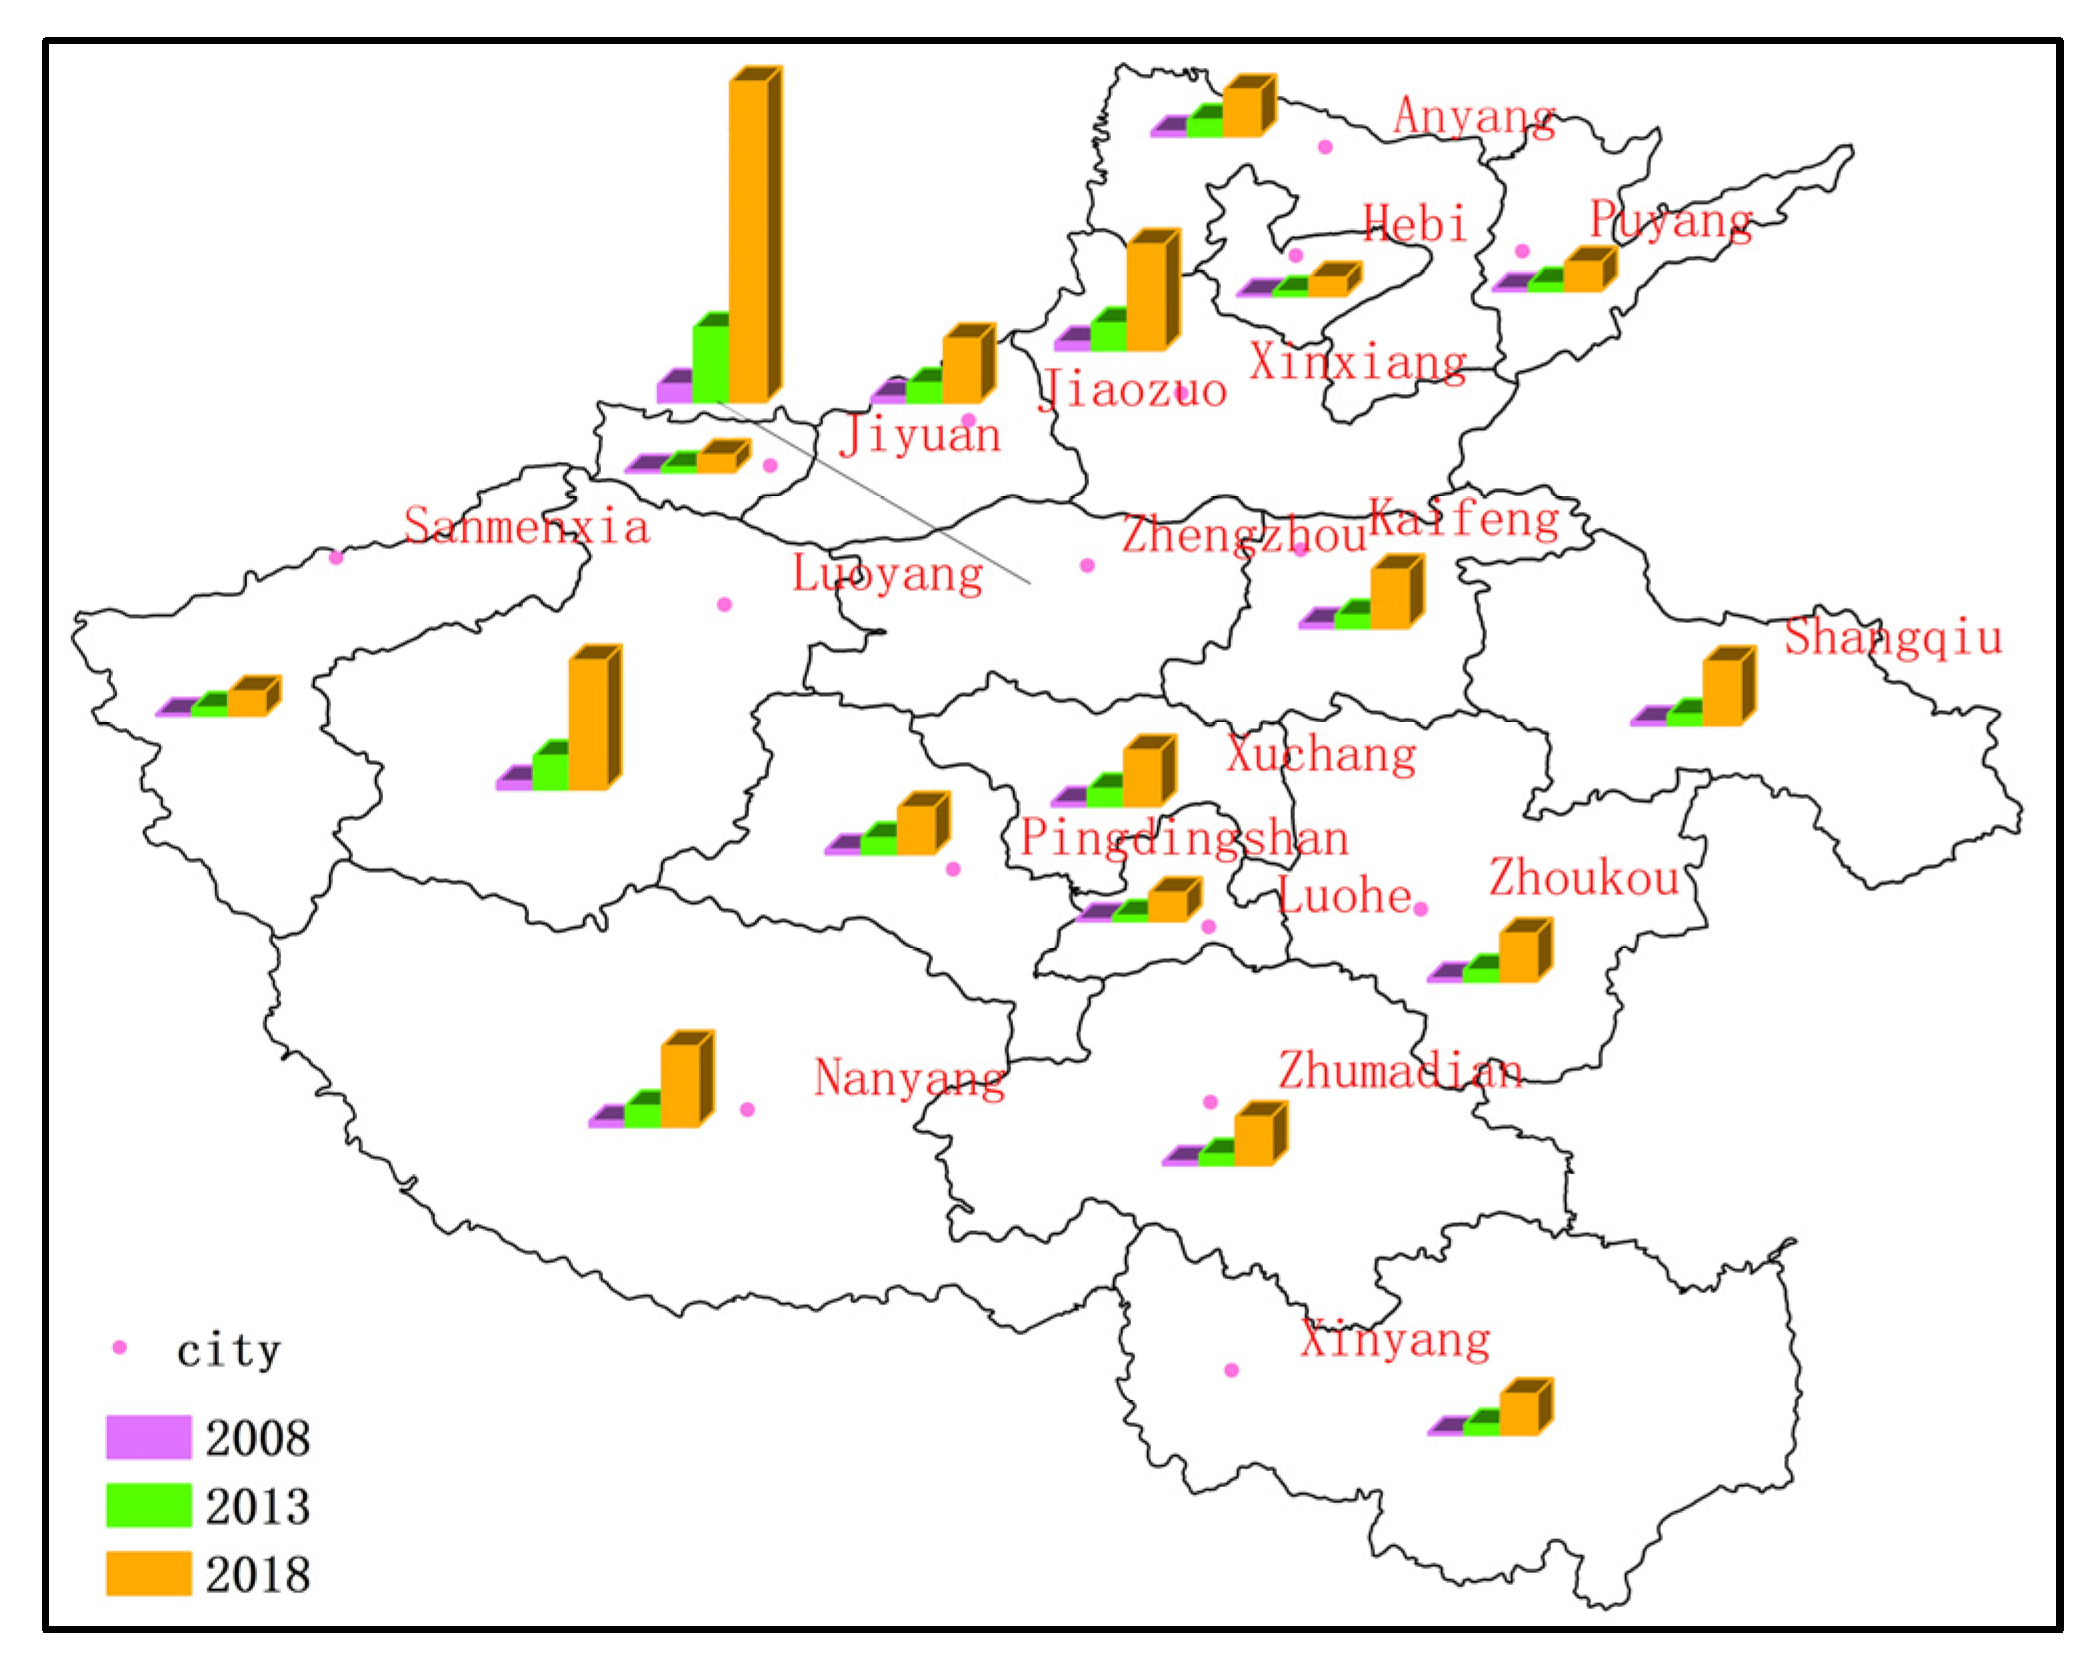
- On the whole, the scale of outward innovation and the total number of innovation links were positively related. The scale of outward innovation and the total number of innovation links increased with the growth of the central cities and sub-central cities over time.
- Second, the scale of outward innovation and the total number of innovation links in the various cities increased significantly. The maximum amount of outward innovation links in the cities increased from 4.117 in 2008 to 16.934 in 2013, and then to 72.2 in 2018. The minimum number of innovation links in the city, 699, increased from 0.412 in 2008 to 1.088 in 2013, and then to 3.861 in 2018. Further, the total number of innovation links increased significantly. The average scale of outward innovation increased from 0.008 in 2008 to 0.016 in 2013, and then to 0.032 in 2018.
- Third, in terms of the growth rate of the total number of innovation contacts, the total number of innovation contacts in Zhengzhou and Luoyang in 2018 increased by 55.76 and 21.61, respectively, compared with 2013. The total number of innovation connections between Zhengzhou and Luoyang in 2013 increased by 12.82 and 5.74, respectively, compared with 2008. The growth rates of the two belonged to the top two, which shows that Zhengzhou and Luoyang have obvious agglomeration and radiation capabilities. Simultaneously, Zhengzhou and Luoyang increased much more in the period 2013–2018 than in the previous period of 2008–2013. The total number of external innovation links between Jiyuan, Hebi and Luohe did not change significantly. Here, the smallest growth rate was observed, and this lagged behind the other cities substantially.
5.4. Evolution of the Total Innovation Linkages in Henan Province
- The total number of innovation links in Henan Province was high in the middle, second highest in the south, higher in the east and low in the north and west. Overall, the development of Henan Province was quicker in the south when compared with the north, and quicker in the east when compared with the west.
- In 2007, the maximum number of innovation links in Henan Province was 4.117 (in Zhengzhou) and most of the innovation links in various cities in Henan Province were at weak levels.
- In 2012, the maximum number of innovation links in Henan Province was 16.934 in Zhengzhou, followed by Luoyang City. Further, the innovation links in various cities in Henan Province were ranked weak, weak and strong.
- The maximum number of innovation links in Henan Province in 2017 was 72.699 in Zhengzhou, followed by Luoyang City, Xinxiang City, Nanyang City, Jiaozuo City and Shangqiu City, while the lowest innovation links in various cities in Henan Province were located in Jiyuan City and Hebi City.
- The total evolution of urban innovation links in Henan Province showed an increasing trend.
- The evolution and development trend of the total number of innovation contacts in Henan Province shows a certain law. The law is manifested in the rapid development of the central region, the rapid development of the south and the slow development of the north and east in the west.
- Zhengzhou’s growth rate ranked first among all of the cities and Luoyang’s total innovation link growth rate was the second highest in Henan Province.
- When compared with the development limitations of the ancient capitals, the total number of innovation links and the growth rate of Luoyang, Kaifeng City and Anyang City lagged.
- In 18 cities, the growth rate of the total innovation links in Hebi, Jiyuan, Luohe, Sanmenxia, Puyang and other cities was found to be slow.
6. Discussion
7. Conclusions
- We used the innovation output, innovation input, innovation foundation and innovation connection to measure the scale of innovation. Taking into account the spatial connection of innovation and the spatial diffusion of innovation and the extroversion of spatial agglomeration, a multi-criteria-level indicator system was finally constructed.
- The regional innovation network of Henan Province presents an overall radial pattern with Zhengzhou as the center, which is similar to the pattern of the high-speed rail transportation network in Henan Province. The spatial structure of the innovation connection in Henan Province presents the characteristics of the “core-periphery” innovation network structure. Zhengzhou is the first-level node city, Luoyang is the second-level node city, and Nanyang, Xuchang, Xinxiang, Jiaozuo and Kaifeng are the third-level node cities.
- The total amount of innovation contact in Henan Province showed a pattern of high in the middle, high in the south, higher in the east and low in the north and west. From the perspective of time, the radiation range and intensity of the innovation center city were found to have evolved to varying degrees, but the overall pattern did not show a significant change.
- Except for the central cities in Henan Province, the fastest-growing area belongs to the southern Henan region, while the northern Henan region, which has been developing strongly before, has shown a downward trend. With the exception of Luoyang City, the western Henan area has relatively slow development. In addition, the total amount of innovation connections in western Henan and the innovation attraction between cities are relatively weak, and the differences in innovation capabilities between cities are very obvious.
- In 2008, the internal structure of the urban innovation network in Henan Province showed obvious unbalanced development. The first and second levels are the main contributors to the development of the urban innovation network in Henan Province, driving the growth of the whole network innovation performance. The innovative connection between cities in marginal areas and other urban nodes in the network has made slow progress. This imbalance of growth has become an obstacle to the innovation and development of Henan Province.
- From 2008 to 2018, the scale of outward innovation, the total amount of innovation links and the gravitational strength of innovation link networks increased significantly. Zhengzhou, a city in the core region, plays a bridging role in innovation cooperation in the innovation contact network and promotes the collaborative innovation ability of the non-core regions by sharing innovation cooperation opportunities. On the whole, the leader of the evolution of the innovation network in the past decade is still the city in the core region. The leader has actively played the role of an intermediary, driving the improvement of the urban collaborative innovation ability and level among cities in Henan Province.
Author Contributions
Funding
Institutional Review Board Statement
Informed Consent Statement
Data Availability Statement
Acknowledgments
Conflicts of Interest
References
- Wang, C.; Wang, Y.; Shen, Z. Research on the evolution of innovation and cooperation network space of urban agglomerations in the Yangtze River Delta. J. Shanghai Norm. Univ. (Philos. Soc. Sci.) 2021, 50, 117–126. [Google Scholar]
- Xu, C.; Wang, J.; Wang, H. Demand-oriented innovation of firms in China: An empirical study. Front. Econ. China 2008, 3, 548–559. [Google Scholar] [CrossRef]
- Federica, C.; Gianni, G.; Stefano, P. Institutional fragmentation and urbanization in European Union cities. Reg. Stud. 2021, 55, 269–281. [Google Scholar] [CrossRef]
- Tang, J.; Li, N.; Pan, P. Research on innovation network structure and driving factors of the Yangtze River Delta Urban Agglomeration. Shanghai Econ. Res. 2018, 11, 63–76. [Google Scholar]
- Chen, X.; Lv, P.; Xue, S.; Li, M. What does the character of urban technology reveal about convergence versus divergence of innovation in China? Growth Chang. 2020, 51, 1631–1656. [Google Scholar] [CrossRef]
- Xian, G.; Zeng, G.; Cao, X. Structural feature and proximity mechanism of Chinese intercity innovation network. World Reg. Stud. 2018, 27, 136–146. [Google Scholar]
- Yuan, Y. Exploring inter-country connection in mass media: A case study of China. Environ. Urban Syst. 2017, 62, 86–96. [Google Scholar] [CrossRef]
- Gehrke, S.R.; Clifton, K.J. An Activity-related Land Use Mix Construct and Its Connection to Pedestrian. Travel Environ. Plan. B Urban Anal. City Sci. 2019, 46, 9–26. [Google Scholar] [CrossRef] [Green Version]
- Wang, X.; Feng, M.; Gu, H. Analysis on the scale difference characteristics of inter-city innovation links: A case study of the Yangtze River Delta Core Area. J. Southeast Univ. 2015, 17, 108–116. [Google Scholar]
- Zhou, C.; Zeng, G.; Cao, X. Chinese inter-city innovation networks structure and city innovation capability. Geogr. Res. 2017, 36, 1297–1308. [Google Scholar]
- Fang, C.; Yu, D. Urban agglomeration: An evolving concept of an emerging phenomenon. Landsc. Urban Plan. 2017, 162, 126–136. [Google Scholar] [CrossRef]
- Hu, H.; Lv, L.; Huang, R. Urban innovation system and Function in Guangdong Province in the perspective of flow of urban innovation. Res. Urban Dev. 2015, 22, 71–76. [Google Scholar]
- Lv, L.; Li, L. A research on Chinese renovation urban system based on urban renovation function. Acta Geogr. Sin. 2010, 65, 177–190. [Google Scholar]
- Zhao, J.; Zeng, G. Spatial measurement of innovation: Data and indicator. Econ. Geogr. 2009, 29, 1250–1255. [Google Scholar]
- Burger, M.J.; Ronald, S. Polycentricity and the Multiplexity of Urban Networks. Eur. Plan. Stud. 2014, 22, 816–840. [Google Scholar] [CrossRef]
- Ma, S.; Zeng, Z. Analysis on the innovation and spatial structure of the Yangtze River Economic Belt. World Reg. Stud. 2018, 27, 57–65. [Google Scholar]
- Yin, Y.; Zhang, X. Analysis on spatiotemporal evolution of Innovation linkage among the cities in Shandong province. J. Nat. Sci. Hunan Norm. Univ. 2018, 41, 1–10. [Google Scholar]
- Zhang, H.; Liu, Q.; Li, G. Spatial structure change and optimization strategies of innovation linkage among the cities in Guangdong Province. Prog. Geogr. 2016, 35, 952–962. [Google Scholar]
- Li, P. Metropolitan economic growth and spatial dependence. Evid. A Panel China 2008, 3, 277–295. [Google Scholar] [CrossRef] [Green Version]
- Yan, Z. Research on the Evolution and Influencing Factors of China’s Urban Innovation Link-Ages Network. Master’s Thesis, East China Normal University, Shanghai, China, 2018. [Google Scholar]
- Batisse, C. Dynamic externalities and local growth a panel data analysis applied to Chinese provinces. China Econ. Rev. 2002, 13, 231–251. [Google Scholar] [CrossRef]
- Xie, Y. The Comparison of Innovation Ability of Three Megalopolises in China. Master Thesis, Guangzhou University, Guangzhou, China, 2011. [Google Scholar]
- Lu, T.; Wu, Z.; Huang, L. International comparison of creative cities cluster—An analysis of social network and spatial organization on innovative collaboration: International comparison of creative cities cluster between the Bosnywash Megalopolis and the Yangtze River Delta Region. Urban Plan. Forum 2016, 2, 35–44. [Google Scholar]
- Aghion, P.; Bloom, N.; Blundell, R.; Griffth, R.; Howitt, P. Competition and innovation: An inverted U relationship. Q. J. Econ. 2005, 120, 701–728. [Google Scholar]
- Herstad, S.J.; Ebersberger, B. Urban agglomerations, knowledge-intensive services and innovation: Establishing the core connections. Entrep. Reg. Dev. 2014, 26, 211–233. [Google Scholar] [CrossRef]
- Tong, H.; Shi, P.; Luo, J.; Liu, X. The Structure and pattern of urban network in the Lanzhou-Xining. Urban Agglom. 2020, 30, 59–74. [Google Scholar] [CrossRef] [Green Version]
- Wang, W.; Sun, F. Spatial agglomeration and spillover effects of urban innovation in Yangtze River Delta. Geogr. Res. 2017, 36, 1042–1052. [Google Scholar]
- Babones, S.J.; Alvarez, R.M.J. Standardized income inequality data for use in cross-national research. Sociol. Inq. 2007, 77, 3–22. [Google Scholar] [CrossRef]
- Jiang, T.; Xie, M.; Liu, G. Spatial of regional innovation output based on gravity model: A case study in Zhejiang Province. Sci. Geogr. Sin. 2014, 34, 1320–1326. [Google Scholar]
- Qian, C.; Ye, J.; Lu, C. Gravity zoning in Wuhan Metropolitan Area based on an improved urban gravity model. Prog. Geogr. 2015, 34, 237–245. [Google Scholar]
- Hu, Y.; Shi, H. Analysis of the urban innovation spatial correlation in Yangtze River Delta urban agglomeration: Based on the method of social network analysis. Shanghai Econ. Res. 2017, 4, 87–97. [Google Scholar]
- Ye, X.; Liu, X. Integrating social networks and spatial analyses of the built environment. Environ. Plan. Anal. City Sci. 2018, 45, 395–399. [Google Scholar] [CrossRef] [Green Version]
- Bi, L.; Shi, L. Evaluation of city innovation capability and the construction of “regional Innovation circle” in Yangtze River Delta—Based on the factor and cluster analysis method. Econ. Geogr. 2008, 28, 946–951. [Google Scholar]
- Qian, H.; Du, X.; Liang, Y. Urbanization response to the industrial structure evolvement in Henan Province. Areal Res. Dev. 2017, 36, 23–28. [Google Scholar]
- Zheng, Y.; Zhao, H.; Lu, L. Evolution of spatial pattern of urban innovation links in Anhui Province. Yunnan Geogr. Environ. Res. 2017, 29, 28–35. [Google Scholar]
- Sun, Y.; Peng, S. Development Mechanism of Cohesive Subgroups’ Urban Innovation Networks in the Yangtze River Delta: Based on the Valued ERGM. Sci. Geogr. Sin. 2020, 40, 874–881. [Google Scholar] [CrossRef]
- Reilly, W.J. Methods for the Study of Retail Relationships; University of Texas: Austin, TX, USA, 1929. [Google Scholar]
- Haggett, P. Locational Analysis in Human Geography; Edward Arnold Ltd.: London, UK, 1965. [Google Scholar]


| Index | 2018 | 2013 | 2008 |
|---|---|---|---|
| Per capita regional GDP (yuan) | 946,101 | 669,451 | 398,704 |
| General public budget revenue (100 million yuan) | 3557.75 | 2281.591 | 929.3512 |
| Total investment in fixed assets of the whole society (100 million yuan) | 47,556.15 | 26,087.77 | 10,468.84 |
| Actual utilization of funds outside the province (US $10,000) | 96,471,000 | 61,975,000 | 18,492,000 |
| Total volume of public library (10,000 volumes) | 2762.85 | 1881 | 1618.3 |
| Number of Internet users (10,000) | 11,199.63 | 5656.29 | 493.8573 |
| Number of students in adult higher education | 338,626 | 336,395 | 268,811 |
| Number of education practitioners (10,000) | 124.59 | 119.72 | 108.56 |
| National financial expenditure on education (100 million yuan) | 1655.05 | 1030.08 | 400.69 |
| National financial expenditure on science (100 million yuan) | 133.31 | 67.83 | 25.38 |
| Number of legal entities in the scientific research and technology service industry | 45,096 | 6616 | 1727 |
| Research and experimental development (R&D) personnel | 101,471 | 216,269 | 68,750 |
| Research and experimental development (R&D) external expenditure (10,000 yuan) | 171,763 | 109,470 | 55,065.7 |
| Proportion of science and technology expenditure in financial expenditure | 0.29 | 0.24 | 0.24 |
| Number of patent applications | 44,586 | 18,095 | 6480 |
| Number of patents granted | 9743 | 2104 | 1815 |
| Output value of new products (10,000 yuan) | 74,973,868 | 49,481,046 | 13,632,739 |
| Published scientific papers | 63,350 | 57,312 | 48,616 |
| Proportion of tertiary industry in GDP | 7.43 | 5.08 | 4.80 |
| Number of R&D projects | 53,480 | 33,015 | 27,349 |
| Private vehicle ownership by city | 13,273,579 | 6,282,190 | 2,487,712 |
| Total freight volume (10,000 tons) | 235,183 | 282,970 | 118,198 |
| Total business volume of postal industry (100 million yuan) | 436.72 | 51.00 | 46.11 |
| First-Level Indicators | Weight | Secondary Indicators | Title 4 |
|---|---|---|---|
| Innovation Foundation (A) | 0.222 | Per capita regional GDP (yuan) | 0.010 |
| General public budget revenue (100 million yuan) | 0.042 | ||
| Total investment in fixed assets of the whole society (100 million yuan) | 0.026 | ||
| Actual utilization of funds outside the province (US $10,000) | 0.021 | ||
| Total volume of public library (10,000 volumes) | 0.014 | ||
| Number of Internet users (10,000) | 0.042 | ||
| Number of students in adult higher education | 0.052 | ||
| Number of education practitioners (10,000) | 0.014 | ||
| Innovation investment (B) | 0.250 | National financial expenditure on education (100 million yuan) | 0.023 |
| National financial expenditure on science (100 million yuan) | 0.043 | ||
| Number of legal entities in the scientific research and technology service industry | 0.075 | ||
| Research and experimental development (R&D) personnel | 0.044 | ||
| Research and experimental development (R&D) external expenditure (10,000 yuan) | 0.059 | ||
| Proportion of science and technology expenditure in financial expenditure | 0.006 | ||
| Innovation output (C) | 0.398 | Number of patent applications | 0.075 |
| Number of patents granted | 0.100 | ||
| Output value of new products (10,000 yuan) | 0.089 | ||
| Published scientific papers | 0.071 | ||
| Proportion of tertiary industry in GDP | 0.003 | ||
| Number of R&D projects | 0.060 | ||
| Innovation links (D) | 0.130 | Private vehicle ownership by city | 0.035 |
| Total freight volume (10,000 tons) | 0.016 | ||
| Total business volume of postal industry (100 million yuan) | 0.078 |
| Classification | Connection Strength | Reference | Indicator Meaning |
|---|---|---|---|
| First level | >2.4 | Zhengzhou, Luoyang | Extremely strong gravity |
| Second level | 1.6~2.4 | Nanyang | Strong gravity |
| Third level | 0.8~1.6 | Xuchang, Xinxiang, Jiaozuo, Kaifeng, Anyang, Shangqiu, Zhoukou | General gravity |
| Fourth level | 0~0.8 | Pingdinshan, Hebi, Puyang, Luohe, Sanmenxia, Xinyang, Zhumadian, Jiyuan | Weak gravity |
| City | Extroverted Innovation Scale | Total Innovation Linkages | ||||
|---|---|---|---|---|---|---|
| 2008 | 2013 | 2018 | 2008 | 2013 | 2018 | |
| Zhengzhou | 0.038 | 0.085 | 0.192 | 4.117 | 16.934 | 72.699 |
| Kaifeng | 0.007 | 0.011 | 0.024 | 0.950 | 2.889 | 13.129 |
| Luoyang | 0.014 | 0.030 | 0.057 | 1.834 | 7.578 | 29.191 |
| Pingdingshan | 0.007 | 0.013 | 0.019 | 0.972 | 3.629 | 10.555 |
| Anyang | 0.008 | 0.014 | 0.019 | 1.053 | 3.728 | 10.526 |
| Hebi | 0.002 | 0.003 | 0.007 | 0.325 | 0.953 | 4.177 |
| Xinxiang | 0.013 | 0.023 | 0.046 | 1.767 | 6.059 | 23.956 |
| Jiaozuo | 0.009 | 0.016 | 0.026 | 1.271 | 4.330 | 14.412 |
| Puyang | 0.004 | 0.006 | 0.012 | 0.498 | 1.769 | 6.545 |
| Xuchang | 0.006 | 0.015 | 0.023 | 0.846 | 3.977 | 12.748 |
| Luohe | 0.003 | 0.004 | 0.011 | 0.432 | 1.235 | 6.345 |
| Sanmenxia | 0.003 | 0.006 | 0.010 | 0.404 | 1.760 | 5.468 |
| Nanyang | 0.010 | 0.018 | 0.034 | 1.315 | 4.714 | 18.241 |
| Shangqiu | 0.005 | 0.009 | 0.026 | 0.674 | 2.417 | 14.391 |
| Xinyang | 0.004 | 0.009 | 0.017 | 0.518 | 2.372 | 9.251 |
| Zhoukou | 0.005 | 0.009 | 0.020 | 0.663 | 2.530 | 10.796 |
| Zhumadian | 0.005 | 0.009 | 0.020 | 0.743 | 2.404 | 10.890 |
| Jiyuan | 0.003 | 0.004 | 0.007 | 0.412 | 1.088 | 3.861 |
Publisher’s Note: MDPI stays neutral with regard to jurisdictional claims in published maps and institutional affiliations. |
© 2022 by the authors. Licensee MDPI, Basel, Switzerland. This article is an open access article distributed under the terms and conditions of the Creative Commons Attribution (CC BY) license (https://creativecommons.org/licenses/by/4.0/).
Share and Cite
Zhu, W.; Yue, Z.; He, N.; Luan, K.; Ye, L.; Qian, C. Analysis of China’s Urban Innovation Connection Network Evolution: A Case Study of Henan Province. Sustainability 2022, 14, 1089. https://doi.org/10.3390/su14031089
Zhu W, Yue Z, He N, Luan K, Ye L, Qian C. Analysis of China’s Urban Innovation Connection Network Evolution: A Case Study of Henan Province. Sustainability. 2022; 14(3):1089. https://doi.org/10.3390/su14031089
Chicago/Turabian StyleZhu, Weidong, Zilin Yue, Naiying He, Kuifeng Luan, Li Ye, and Chuyi Qian. 2022. "Analysis of China’s Urban Innovation Connection Network Evolution: A Case Study of Henan Province" Sustainability 14, no. 3: 1089. https://doi.org/10.3390/su14031089
APA StyleZhu, W., Yue, Z., He, N., Luan, K., Ye, L., & Qian, C. (2022). Analysis of China’s Urban Innovation Connection Network Evolution: A Case Study of Henan Province. Sustainability, 14(3), 1089. https://doi.org/10.3390/su14031089