1. Introduction
Living in an era of rapid technological development and international interconnection means that the general public face both opportunities and challenges. While people enjoy the material abundance brought about by the deepening of the industrial chain and productivity improvements, they face increasingly severe global warming issues. According to the prediction of the Intergovernmental Panel on Climate Change (IPCC), by 2100 the global average temperature will be 1.5 degrees to 4.8 degrees higher than the level before the industrial revolution. As is pointed out by the latest IPCC report, global greenhouse gas is increasing year by year. The data show it reached annual averages of 410 ppm for carbon dioxide (CO2), 1866 ppb for methane (CH4), and 332 ppb for nitrous oxide (N2O) in 2019. If the increase in carbon emissions cannot be effectively curbed, mankind will face various risks such as rising sea levels, extinction of species, and increased extreme weather.
Unlike regional issues, when facing issues such as global warming people worldwide have to work together and take action hand in hand. In response to climate change, the international community has successively signed international agreements such as the United Nations Framework Convention on Climate Change (UNFCCC), the Kyoto Protocol, and the Paris Agreement, which demonstrated the global determination to cope with climate change. In September 2020, as one of the first parties to sign the UNFCCC, China proposed the goal of carbon peak and neutrality, meaning that carbon dioxide emissions from China would reach a peak by 2030 and be carbon neutral by 2060. In order to implement this commitment and achieve the comprehensive green transition of economic and social development during the process of pursuing high-quality development, China must accelerate the improvement of energy efficiency, reduce the use of fossil fuels with high carbon emission coefficients, and vigorously promote the use of clean energy.
Among various instruments for reducing carbon emissions, taxation is an indispensable option. As an effective instrument of the government, energy tax is able to affect the energy consumption of economic entities, thereby playing a role in controlling the emission of carbon dioxide and other greenhouse gases. Economist Pigou was the first to analyze the mechanism of taxation for reducing environmental emissions, and many scholars have since expanded and extended the concept. In the early 20th century, some western developed countries began to levy energy taxes. Owing to the growing concern over global warming, carbon taxes have been introduced in more and more countries. Recently, the Chinese government has increasingly emphasized the importance of the construction of an ecological civilization, and has accelerated the establishment of a series of environmental taxation policies. In the “National Thirteenth Five-Year Plan for Energy Development”, it is clearly pointed out that China should improve energy taxation policies. China should advance the reform of energy taxation in an all-round way, rationally adjust the benefits from resource development, and accelerate the reform of environmental protection from fees to taxes. The “National Fourteenth Five-Year Plan” further proposes that China must implement taxation policies that are conducive to energy conservation, environmental protection, and comprehensive utilization of resources. The implementation of environmental protection-related taxes will assist China in achieving its international commitments to reduce emissions in great amounts and with high speed. In addition, the promotion of environmental protection-related taxes such as energy taxes can be helpful in improving existing taxation mechanisms and enhancing the overall efficiency of the economy. Above all, exploring the impact of taxation instruments such as energy taxes, especially their carbon emissions reduction effects, can be of great help in understanding action to reduce carbon emissions as well as in providing policy recommendations for the Chinese government.
In addition to the overall effect of levying energy taxes, it is vital to deeply explore how energy tax policies affect carbon emissions mitigation. Considering that the imposition of energy taxes will inevitably impact other variables in the economic system, it is necessary to develop a generalized system for a more comprehensive analysis. Furthermore, there are a variety of policies which exist at the same time in the actual world. Exploring the combined effects of different policies is conducive to a thorough and accurate understanding of the impact of energy taxes.
The rest of this paper is constructed as follows:
Section 2 summarizes recent research on environmental taxation including energy taxes, the comparison of different environmental taxes, and the influences of various scenarios. Then, this paper briefly analyzes the impact mechanism of energy taxes from a theoretical view.
Section 4 outlines the structure of the integrated analysis of CGE and SDA in detail, and explains the scenario settings.
Section 5 presents interpretation analysis and discussion of the simulation results under different scenarios. The comparison of China’s environmental protection tax and the EU’s energy tax, regional equity concerning energy taxation, and managerial implications are discussed later in
Section 6. In the final part, the conclusion and recommended policies are put forward.
2. Literature Review
Since the 1970s, there has been a wave of green taxation reforms in western countries. Some European countries, taking the Netherlands as an example, introduced a variety of environmental taxes in the late 1980s. Until now, scholars worldwide have carried out comprehensive explorations in this field and analyzed the carbon emission reduction effects of environmental taxes such as energy taxes and carbon taxes in detail; however, such taxes differ today in many countries.
Researchers have recently studied several aspects of the consequences of the introduction of energy taxes, especially their impact on carbon emissions. Through an econometric analysis, the effect of increasing a domestic refined oil consumption tax has been tested by Zhao et al. [
1]. They point out that although gasoline demand in China is inelastic, a rise in energy taxes can still control gasoline consumption and CO
2 emissions by directing consumers to conserve energy. Some researchers in China focus on the positive impact of energy tax on emission reduction by region, such as the research on Tianjin and Guangdong Province [
2,
3]. Research by Shmelev et al. [
4] shows that energy taxes for coal and liquefied petroleum gas (LPG) have caused a significant decrease in CO
2 emissions in Sweden. Further research by Nong et al. [
5] includes non-CO
2 emissions in the analysis. They find that taxing coal and petroleum products reduced emissions levels in Vietnam, with the former having a greater emissions mitigation effect than the latter. However, by applying the Granger causality test and panel data analysis to almost all EU countries, Liobikiene et al. [
6] point out that energy taxes do not have a Granger-causality relationship with greenhouse gas emissions. From the perspective of research methods, various models have been used to study the impact of energy taxes, with CGE the most mainstream one. This paper aims to investigate the effectiveness and efficiency of energy taxation by adopting an integrated model of CGE and SDA, which helps to determine whether an energy tax is effective and how it can impact carbon emission and carbon intensity. Based on the most recent database, this paper simulates the changes in carbon emission reduction and other economic variables under different scenarios, thus providing implications for energy and environmental taxation policies.
Another group of research focuses on the comparison of various types of environmental taxation. Based on the ORANI Model of the Australian economy, McDougall [
7] finds that a broad-based energy tax performs better than a carbon tax in reducing greenhouse gas emissions. Jorgenson et al. [
8] compare the economic impact of three tax instruments on fossil fuels for controlling CO
2 emissions, namely a carbon tax, an energy tax, and an ad valorem tax on energy. Their evaluation suggests that a carbon tax has the smallest negative effect on the economy as a whole and the most severe effect on coal mining; in contrast, either an energy tax or an ad valorem tax would cost more to the economy. Scrimgeour et al. [
9] simulates the relative effects of energy taxes or carbon taxes on New Zealand’s economy with equivalent tax revenue collected. Under their set-up, although an energy tax performs less well in terms of CO
2 emissions reduction than a carbon tax, it has a less adverse impact on GDP, household consumption, exports and investment. Proposing a China Energy and Environmental Policy Analysis (CEEPA) model, Liang et al. [
10] draw a comparison between an energy tax and a carbon tax concerning their energy, environmental, and socio-economic influences. They indicate that, given the same extent of direct disturbance, the carbon tax performs better in restricting energy consumption and CO
2 emissions. Othman [
11] compares the carbon and energy taxes in Malaysia in terms of their economy-wide and welfare impacts. The results show that a carbon tax can reduce more emissions relative to an energy tax. Further research by Zou et al. [
12] considers a carbon–energy tax scenario and shows a larger carbon emission reduction effect with relatively smaller economic costs. A dynamic recursive CGE model is conducted by Lin et al. [
13], through which researchers study the impact of the energy tax in terms of a specific tax and an ad valorem tax. The results indicate the increase of energy efficiency driven by the fact that an increasing tax on the energy demand is more significant than one on sectoral output. In a Cournot oligopoly framework, Aoyama et al. [
14] make a comparison between energy and emission taxes. The results indicate that the performance of energy and emission taxes are different in terms of economies of scope. In addition, the energy tax performs better in terms of innovation incentives. Therefore, the choice of policy instruments is essential for the achievement of government goals. Instead of zeroing in on the comparison of the environmental and economic impacts of a variety of environmental taxation methods, this paper offers a comprehensive analysis of the impact of an ad valorem energy tax under various types of scenarios.
Under specific scenarios, the extant literature has investigated the influence of various scenarios concerning energy taxation such as the recycling of energy tax revenue, taking technology advances into consideration, and the imposition of non-uniform tax rates on different energy sources.
The double dividend obtained by a tax and subsidy reform is widely discussed, forming another important category concerning the influence of energy taxes. Several studies have found that a proper reorientation of tax revenue may, in addition to helping to achieve environmental goals, play a role in raising output and improving social welfare. Recent scholarship in this area includes Oueslati et al. [
15], who concentrate on the relationship between taxes on energy products and income inequality. Using a multiple panel regression analysis of OECD countries, it is indicated that implementing a tax revenue recycling scheme could alleviate inequality as measured by the Gini coefficient. He et al. [
16] describe the existence of green dividends and blue dividends. Karimu et al. [
17] adopt a panel vector autoregressive estimation approach to analyze electricity taxes in EU countries and find a double dividend of both reducing carbon emissions and unemployment. Furthermore, research by Maxim et al. [
18] reveals a triple dividend of lower emissions, higher economic levels, and higher employment.
Although many scholars have discussed the influence of energy taxes from the environmental and economic perspectives extensively, few of them consider the energy tax along with other related shocks. Li et al. [
19] investigate the synergy degrees of coal capacity cuts and carbon taxes using a dynamic CGE model. Their findings show that a mixed policy can have better performance than a single policy in terms of carbon emission reductions and energy savings.
In addition, the impact of energy taxation differs when different tax rates are considered [
20]. For example, Casler et al. [
21] find that the direct and indirect distributional effects depend on which energy is taxed and how taxes are imposed. The overall equity concerns and the potential public reaction to a tax on gasoline are far less than those on other specific products such as coal, electricity and natural gas. Specialized tax rates provide the incentive for industries to adjust their demand, thus propelling fuel switching from fossil fuels to cleaner energy. Wissema et al. [
22] adopt a CGE model with specific details in taxation and energy use, and their study shows that fuel switching is the key to achieving emission reduction goals. They find that a specific energy tax, in which the tax rate depends on its carbon content, has an advantage over an equivalent uniform energy tax on all energy sources. Arimura et al. [
23] provide evidence for fuel switching from coal to natural gas in Asia. Ganda et al. [
24] highlight the significance of a disaggregated environmental tax policy. Based on previous literature related to the energy taxation policy, their paper considers three other scenarios, excluding the basic scenario. Under these specifications, it is able to evaluate whether a double dividend and synergy effect of energy tax and technological progress exist, and whether in this context it is better to adopt a more focused energy tax.
Many scholars have studied the driving factors of carbon emissions and carbon intensity using structural decomposition analysis (SDA), and this analytical approach has become one of the most mainstream. The early literature before 2012 mostly uses additive SDA to analyze the driving factors of carbon emissions, and there are few studies which use multiplicative SDA [
25]. For instance, based on the input–output model and SDA, Peters et al. [
26] investigate the driving factors of China’s carbon dioxide emissions from 1992 to 2002. Their findings show that efficiency improvements and technological advancements only partially offset the increase in carbon emissions caused by the increase in final demand. Zhang [
27] use the Ghosh input–output model and SDA to analyze the changes in China’s carbon emissions from 1992 to 2005, finding that the supply-side structure measured by value-added sectoral shares led to the increase in China’s carbon emissions from 1992 to 2002 as well as the decrease in carbon emissions from 2002 to 2005. Baiocchi et al. [
28] analyze the driving factors of British carbon dioxide emissions from 1992 to 2004 by adopting the multiregional input–output model (MRIO) and SDA. The results show that domestic carbon emission efficiency and changes in production structure reduced carbon dioxide emissions by 148Mt. After 2012, the study of the driving factors of carbon emission intensity using multiplicative SDA analysis gradually appears in the literature. For example, Su et al. [
29] use multiplicative SDA to analyze the driving factors of China’s carbon emission intensity from 2007 to 2010 and find that carbon intensity change has contributed the most to reducing China’s carbon emission intensity. A large body of literature finds that the improvement of industry carbon emission efficiency and production structure has significantly reduced China’s carbon emission intensity, while changes in the demand structure partially offset this impact [
30,
31,
32]. Despite this, almost no literature uses SDA for policy research, especially in combination with the energy tax CGE model.
Above all, the existing literature mainly has the following shortcomings. First, although the impact of energy taxes on carbon emissions and intensity has been studied, few have quantitatively analyzed the reasons and mechanisms for changes in carbon emissions and intensity across countries and in various industries. Second, some researchers set different scenarios to study the impact of energy taxation policies, such as changing the way energy tax revenue is used or differentiating energy tax rates. However, they do not analyze how energy taxes affect carbon emissions and intensity in different scenarios. Third, little research considers the above-mentioned scenarios based on a unified framework. If these factors in the scenarios are considered separately, it can easily to lead to inconsistent conclusions, policy recommendations, or even conflicts.
In sum, there are generally three driving factors for changes in carbon emissions and intensity: carbon emission intensity effects, production structure effects, and final demand effects [
33]. Correspondingly, levying energy taxes will change the carbon emission intensity and production structure of various industries as well as affect the final demand of various industries through variables such as relative commodity prices and residential income and, for example, consumer demand, investment demand, and net export demand. Therefore, compared with the existing literature, the contributions of this paper are mainly reflected in two aspects. On the one hand, we groundbreakingly combine SDA with the CGE model, and use additive SDA and multiplicative SDA methods to decompose the changes in carbon emissions and carbon intensity across both the country and various industries into three effects: carbon emission intensity effects, production structure effects, and final demand effects. Based on the decomposition, we quantitatively analyze the specific mechanisms through which energy tax can influence national and specific industrial carbon emissions and carbon intensities, thus exploring the impact of energy tax policies on reducing emissions and increasing efficiency. On the other hand, we adopt a unified framework to study how energy taxation, changes in energy tax revenues, energy utilization technological progress, and differentiated energy tax rates affect carbon emissions and other related variables. Horizontal comparison of emission reduction and efficiency enhancement effects under different scenarios is helpful in reaching more targeted, more coordinated, and more unified conclusions and policy recommendations.
5. Simulation
Inputting any of the above scenarios as the initial setting in the CGE model can simulate the impact of an energy tax on many variables. Due to space limitations, this paper only selects certain key variables for presentation. The key variables can be summarized into five categories: energy consumption (coal consumption, oil consumption, natural gas consumption, electricity consumption, total energy consumption, energy consumption intensity); carbon emissions (total CO2 emissions, CO2 emission intensity); macroeconomic variables (real GDP, GDP price index, capital prices, total investment, social welfare); macroeconomic subject-related variables (resident income, resident consumption, resident savings, corporate income, corporate savings, government income, government consumption, government savings, exports, imports); and energy taxes (energy tax revenue).
By exporting other results of the CGE model such as intermediate inputs, the input–output model and structural decomposition analysis can be used to explore the impact mechanisms of energy taxes.
5.1. The Effects of an Energy Tax
Table 4 shows the impact of the uniform energy tax on carbon emissions and other macroeconomic variables. It can be seen that the tax on traditional fossil energy is able to reduce carbon dioxide emissions by reducing fossil energy consumption. With an energy tax rate of 5%, 10%, 15%, 20% and 25%, total energy consumption decreases by 4.93%, 9.15%, 12.82%, 16.03% and 18.88%, respectively, and carbon dioxide emissions decrease by 6.32%, 11.88%, 16.82%, 21.24% and 25.23%, respectively. Meanwhile, energy consumption intensity and carbon dioxide emission intensity also decrease to varying degrees The energy consumption and carbon emissions studied in this paper are both related to industrial sectors, excluding consumption by residents and governments and investment by enterprises, mainly because the latter consume less.
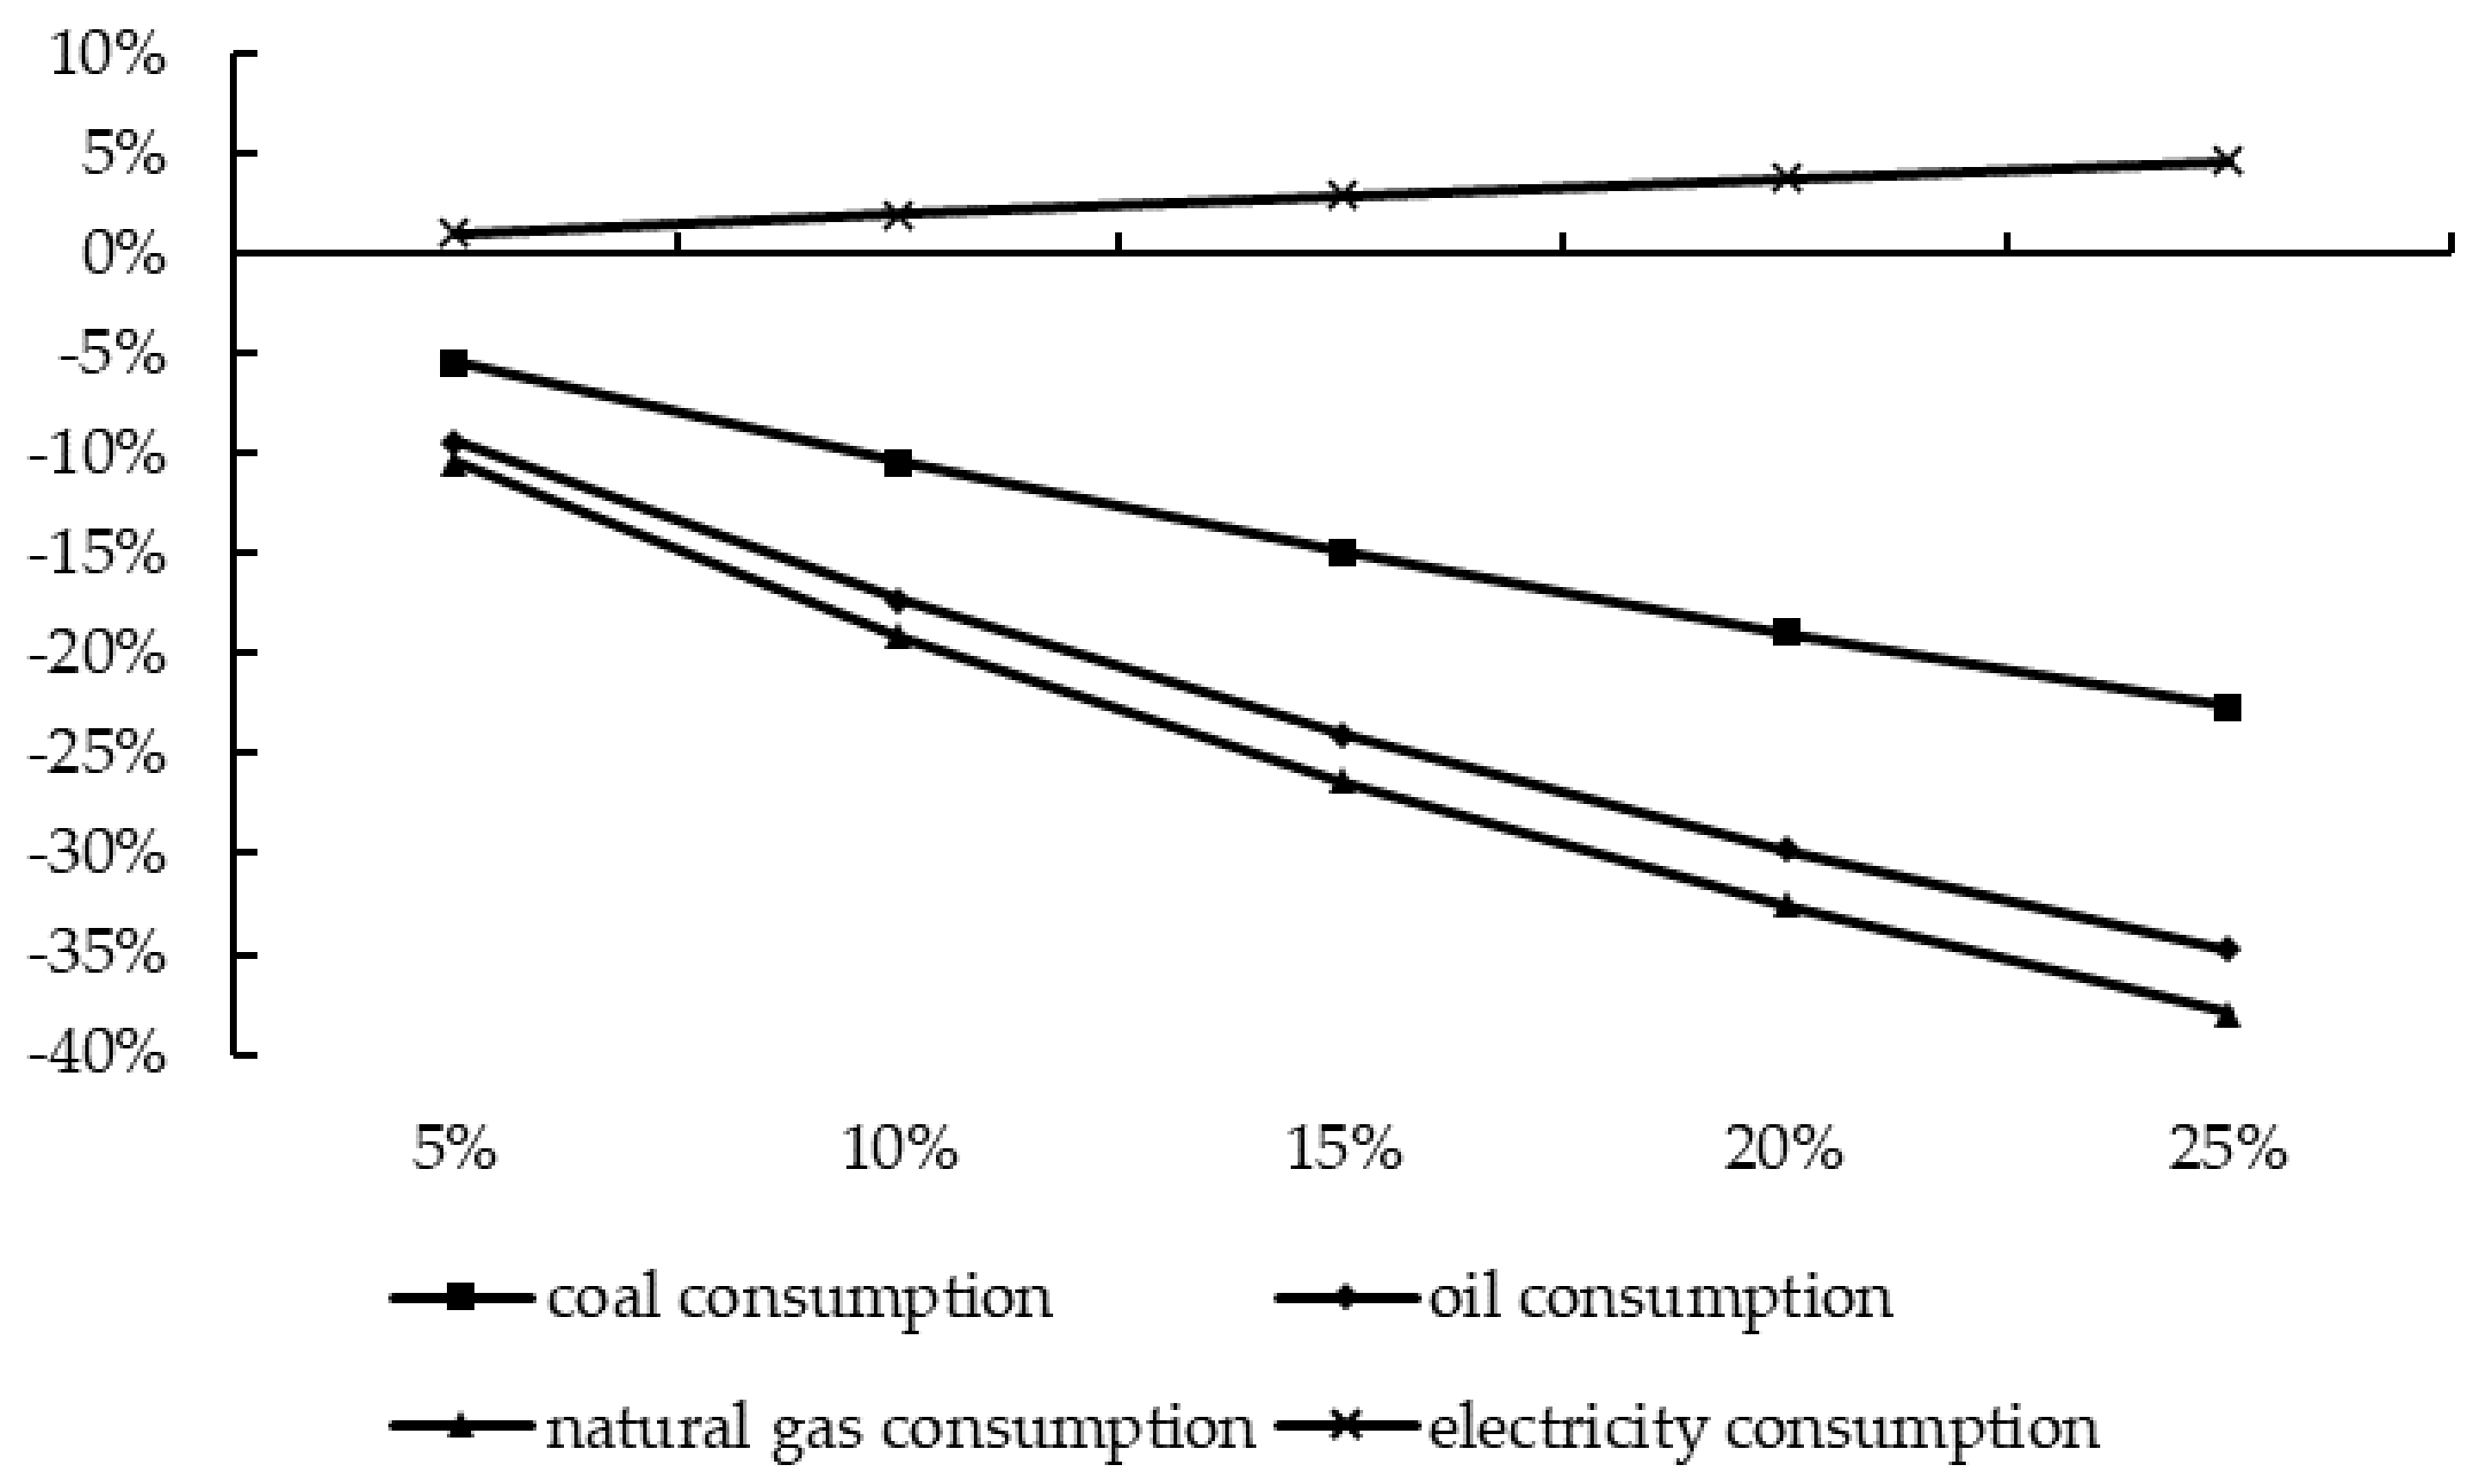
From the perspective of energy consumption structure, the imposition of an energy tax reduces the consumption of fossil energy. The degree of impact, in descending order, is on natural gas, oil, and coal. The main reason for this is that the imposition of an energy tax increases the price of fossil energy faced by enterprises and reduces their demand for fossil energy, as shown in
Figure 3. At the same time, energy taxes increase power consumption. According to the 2019 China Energy Statistical Yearbook, more than 70% of China’s electricity generation comes from thermal power generation, which is fueled by fossil energy such as coal. Therefore, energy taxes push up the price of electricity by increasing the cost of power generation. However, the increase in the electricity price is less than the fossil energy price, and thus a substitution effect of electricity on fossil energy is generated. Furthermore, it exceeds the income effect of electricity demand reduction caused by the increase of electricity price, and finally leads to an increase in electricity consumption.
As for other macroeconomic variables, when the government begins to impose energy taxes on the fossil energy sector the price of fossil fuels such as coal, oil and gas increases, which raises the cost of production for firms and in turn leads to lower output and higher output prices. Lower output reduces the demand for capital, and as a result capital prices, firm income, and firm savings all fall, while higher output prices lead to lower net exports. In addition, capital prices, business income, and business savings decline, while higher output prices lead to a decline in net exports. Energy taxes are a part of government revenue, and the collection of energy taxes increases government income, consumption and savings. Government transfer payments increase resident earnings and savings. However, the consumption of residents decreases due to the increase in the consumer price index, which results in a negative social welfare effect as measured by the change in Hicks equivalence.
From the above analysis, energy taxes mainly affect the choice of energy consumption by influencing the production and operating decisions of enterprises, thus achieving the effect of carbon emissions reduction.
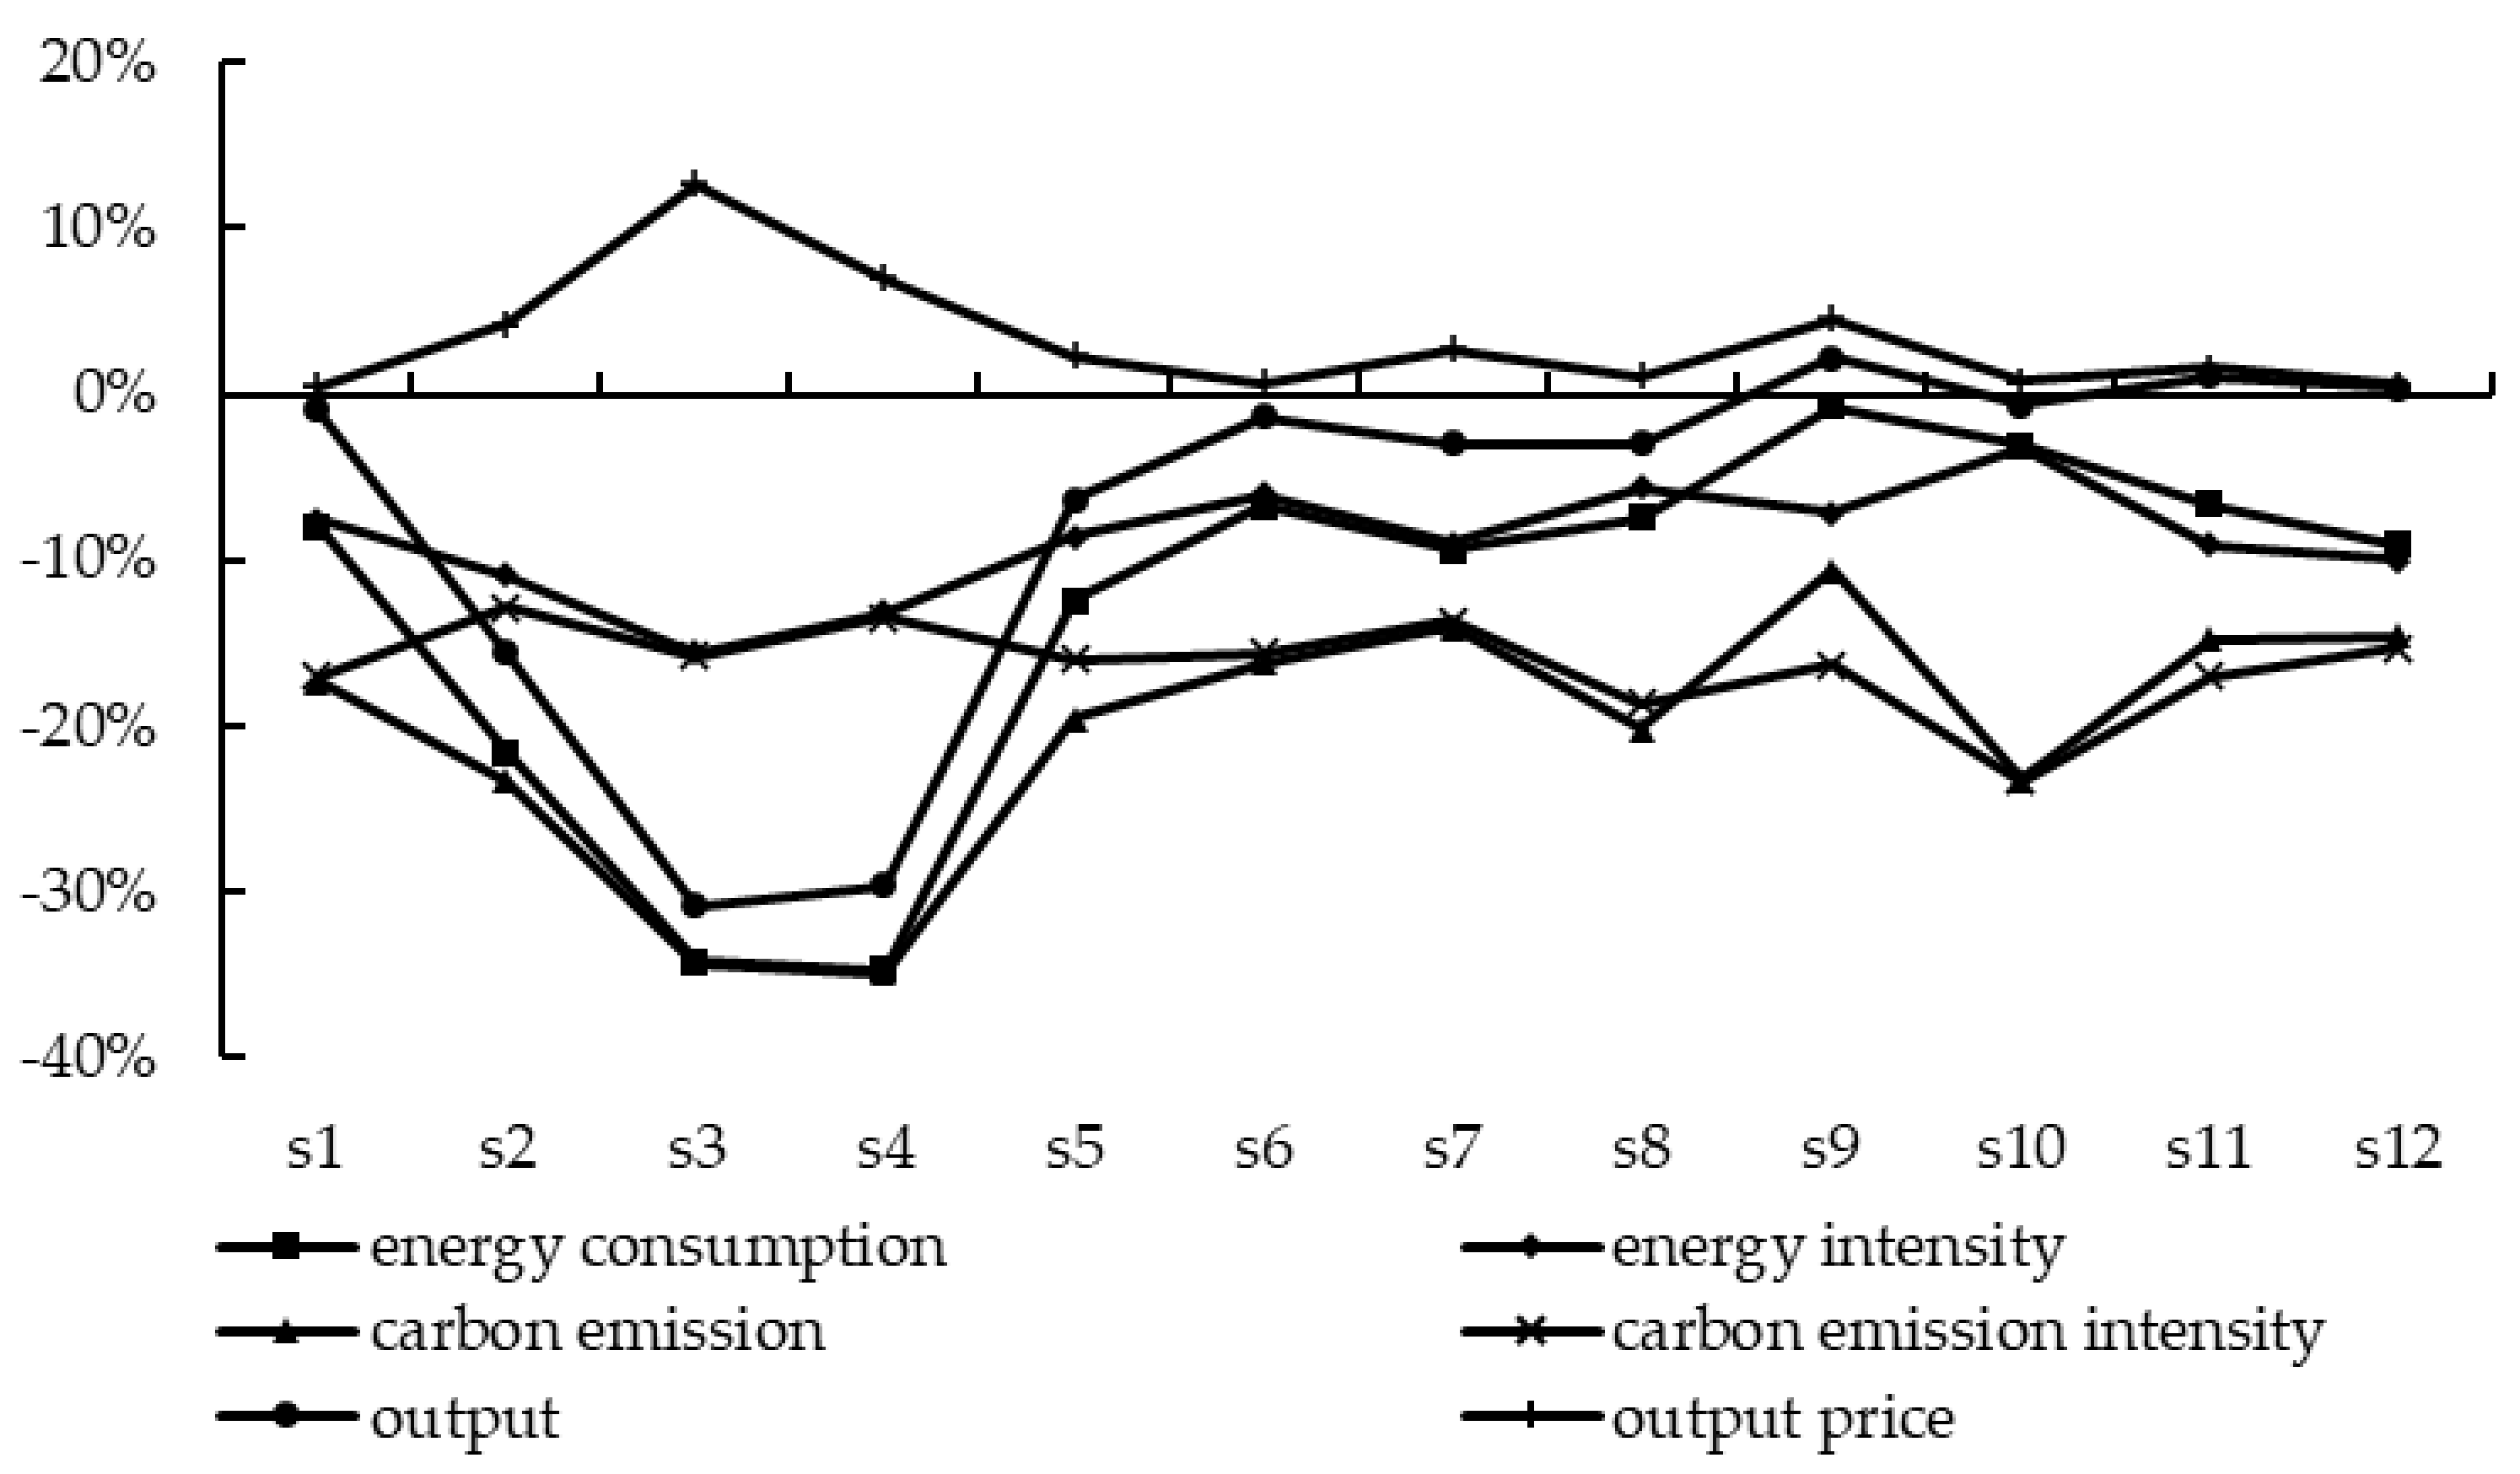
In order to investigate the impact of energy tax on various industries, this paper takes a 15% energy tax as an example for illustration.
Figure 4 shows the impact of a 15% tax on energy consumption on carbon emissions, their intensity and output and the price of energy in various industries. For energy consumption, carbon emissions and output, it can be seen that three industries have larger decreases, namely the coal mining and processing industry (S2), oil mining and processing industry (S3), and natural gas mining and processing industry (S4). This paper infers that the significant decrease in these industries results from their proportion of fossil energy intermediate inputs to total inputs. The larger the proportion, the more obvious the effect of the levying of an energy tax is on their production costs. In terms of energy and carbon intensity, the energy intensity of the above-mentioned industries declines more than in other industries, while the intensity of carbon emissions decreases less than in other industries. To investigate the reason for this, energy taxes have a more negative impact on these industries, which results in a sharp decrease in electricity consumption as well. The decrease in electricity consumption in other industries is smaller, and some industries even rise instead of declining due to the substitution effect. This results in a small difference between the decline in energy consumption and the decline in carbon emissions for coal extraction, oil extraction and natural gas extraction, along with their respective processing industries. Meanwhile, the decline in energy consumption of other industries is smaller than the decline in carbon emissions. Compared with the non-fossil energy industry, the energy intensity of the fossil energy industry declines more significantly. However, the carbon intensity of the fossil energy sector declines even more.
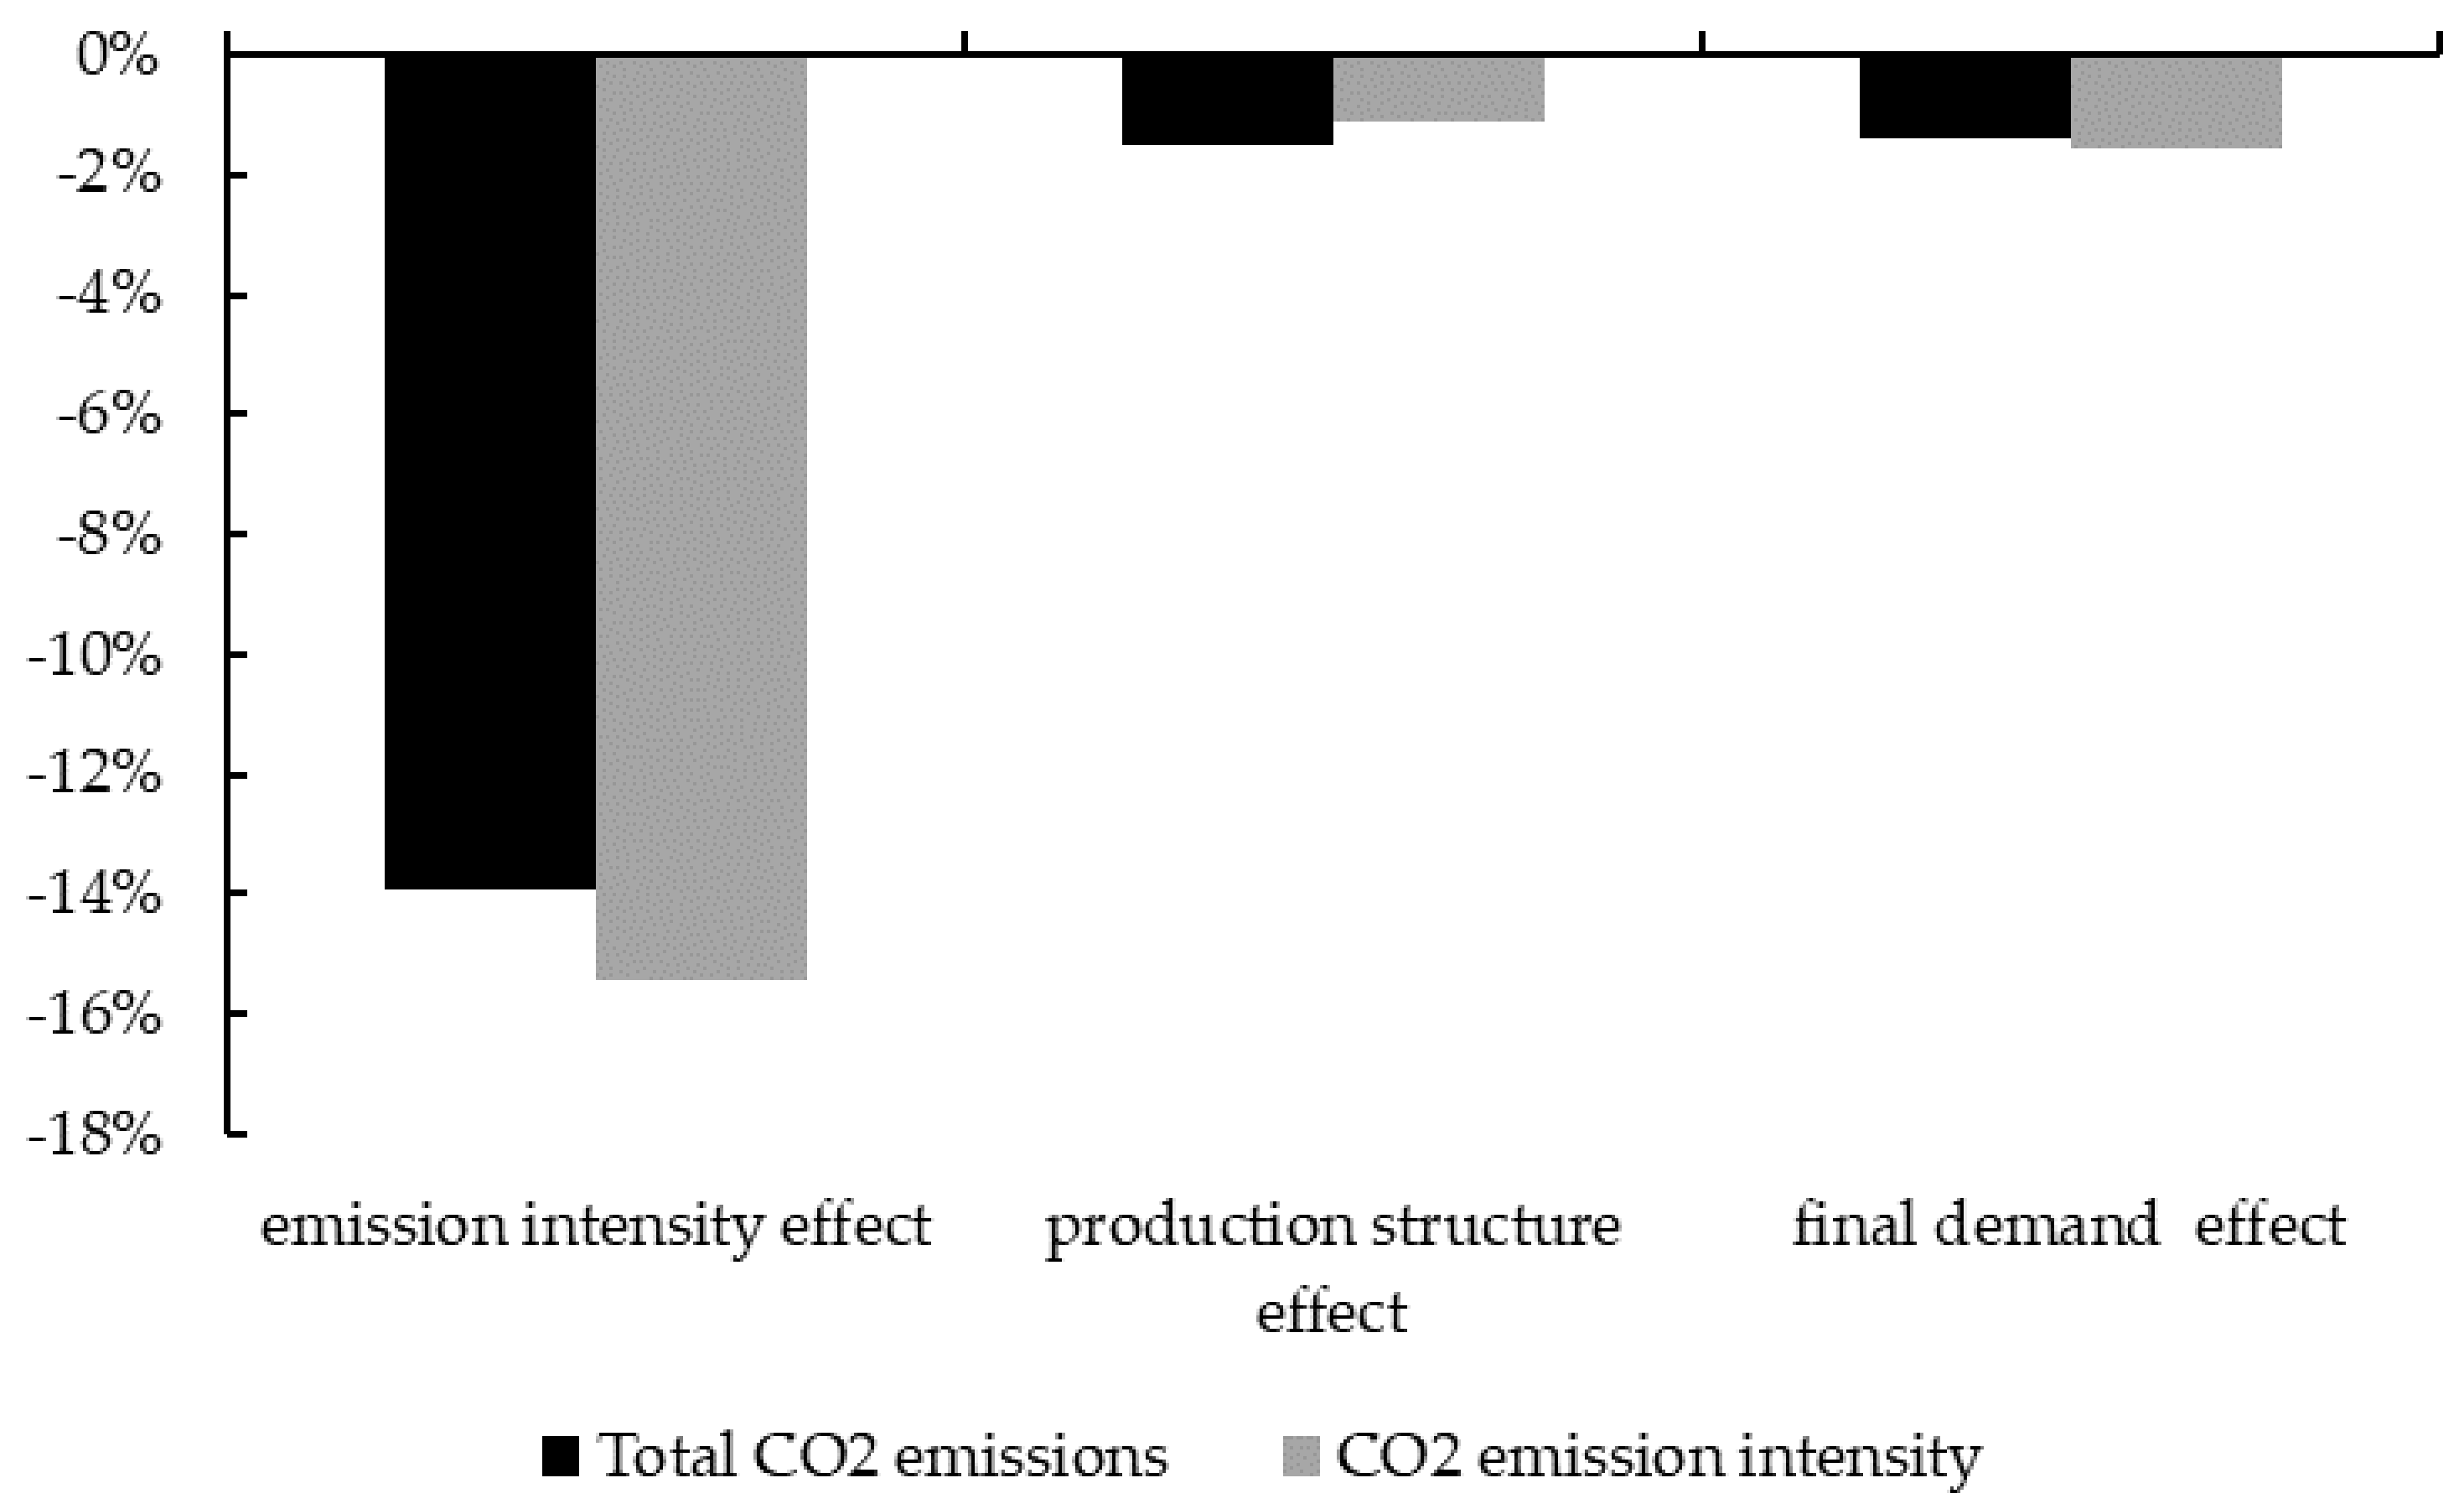
Taking a 15% energy tax as an example, we obtain changes in national carbon dioxide emissions and intensity before and after the energy tax is imposed based on the SDA analysis, as shown in
Figure 5. It can be seen that after the levying of an energy tax, the main factor driving the decline in national carbon emissions and carbon emission intensity is the carbon emission intensity effect. Although the production structure effect and the final demand effect play a role, their effects are relatively weak. After imposing the 15% energy tax, the changes in the carbon emission intensity of each industry alone drive the decline of China’s total carbon emission reduction by about 14%, and drive the decline of China’s carbon emission intensity by more than 15%, whereas changes in production structure and final demand drive the country’s carbon dioxide emissions and intensity to decline only 1% to 2%.
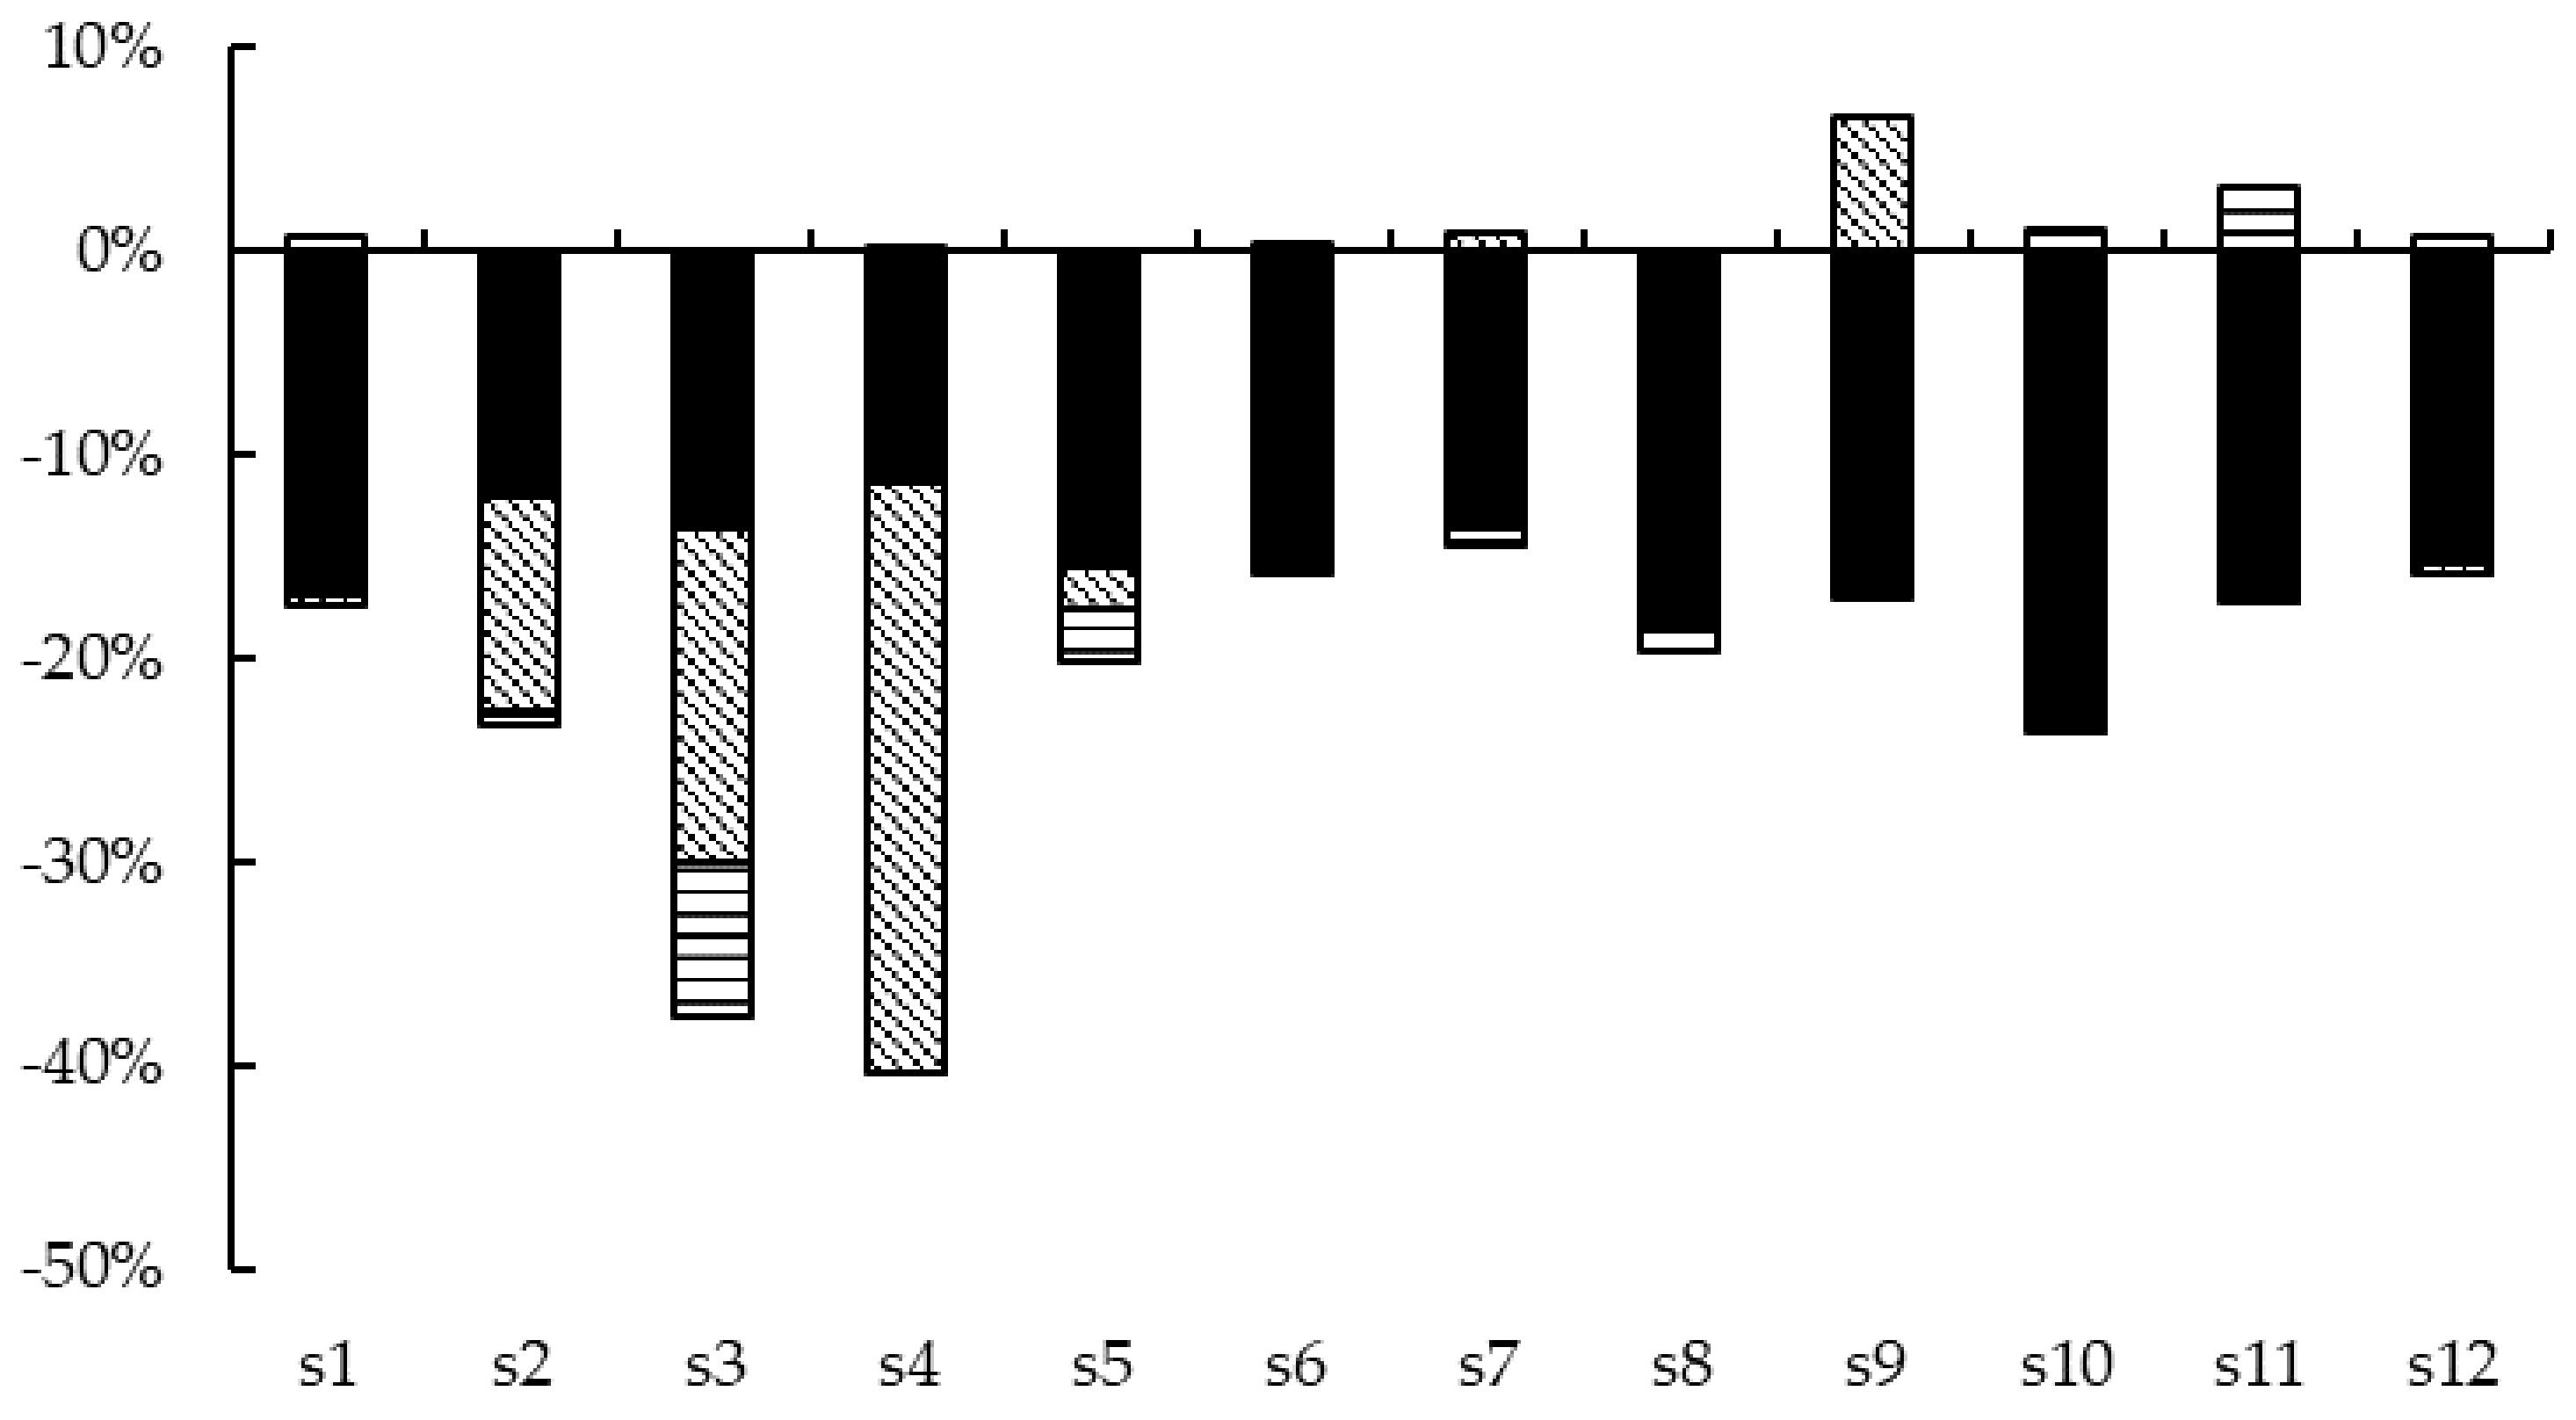
See
Figure 6 for the SDA results of changes in carbon dioxide emissions in various industries. It can be seen that after the imposition of an energy tax, the leading factor in the decline of carbon emissions in most industries is the carbon emission intensity effect, although there are diversities in some industries. For example, in the three fossil energy industries, namely, the coal mining and processing industry (S2), the oil mining and processing industry (S3), and the natural gas mining and processing industry (S4), production structure effects have a more outstanding contribution to the reduction of carbon emissions. These rates even exceed the carbon intensity effect. The reason for this is that when an energy tax is imposed, the demand for coal, oil, and natural gas in various industries declines, which is directly reflected in a decline in the total demand coefficients of the products in the S2~S4 industries of −0.13, −0.28, and −0.16, respectively. On the contrary, due to the substitution effect between energy sources, the total demand coefficient of power production and supply (S9) products in various industries increases by 0.08. Therefore, changes in the production structure of various industries have a significant impact on the carbon emissions of the energy industry. As for the final demand effect, ceteris paribus the levying of an energy tax can reduce the final demand for the oil extraction and processing industry (S3), other mining industries (S5), capital-intensive manufacturing (S7) and technology-intensive manufacturing (S8) while raising the demand for the final products of the construction industry (S11) and the service industry (S12), leading to corresponding changes in the carbon emissions of these industries.
In addition, it should be noted that changes in carbon intensity in various industries are solely related to the carbon emission intensity effect, and have nothing to do with the production structure effect and final demand effect. Thus, this paper does not show the relevant results involving these effects.
5.2. The Effects of an Energy Tax with Other Tax Deductions
According to the analysis in the existing literature [
43,
44,
45], tax subsidies to economic individuals along with environmental taxes can produce a positive redistribution effect, which is the policy choice with the lowest economic cost for environmental protection. In addition, it may realize double dividends in energy conservation, emission reduction and social welfare improvement. Therefore, while considering different energy taxes this paper assumes a policy scenario combining private income tax, a corporate income tax, and an indirect tax on production subsidies of equal.
Table 5 shows the influence of a 15% energy tax with use tax revenue used for tax reduction on carbon emissions and other macroeconomic variables. It can be seen that when compared to the uniEtax15 scenario with a 15% energy tax, this scenario (uniEtax_th) using the energy tax to reduce personal income taxes achieves the double dividend by significantly increasing residential consumption and residential savings, ultimately leading to a rise in social welfare equivalent to CNY 288.302billion. The scenario uniEtax_tent uses an energy tax to reduce corporate income tax, greatly increasing enterprise savings along with total investment and reducing the negative impact of the energy tax on enterprise production and operation as well as on real GDP. However, resident income, consumption and savings decline to varying degrees due to the inability of government to obtain energy tax revenue. Social welfare decreases by CNY 327.716 billion, which fails to realize the double dividend. The scenario uniEtax_tva applies the energy tax to reduce indirect taxes on production, relieving the pressure caused by the energy tax on the cost of production and operation of enterprises as well as on the price level. Although the GDP price index increases by only 0.08%, the income of the residents declines as well on account of the reduction of income. This decline in price levels increases consumption and social welfare, successfully realizing the double dividend.
When energy tax revenue is used to reduce personal income tax the best double dividend effect is achieved, as shown by a detailed analysis carried out in the uniEtax_th scenario. The SDA results for national carbon dioxide emissions and intensity changes in this scenario are very similar to those in uniEtax15, and are therefore not be displayed due to limited space. The difference between these two scenarios lies in the final demand effect, which is smaller in the uniEtax_th scenario. The reason for this is that the two scenarios have different final demand structures. The energy tax revenue under the uniEtax15 scenario is given to the government, and the primary industry for government consumption is the service industry (S12), one of the industries with the lowest carbon emission intensity. However, in the uniEtax_th scenario, the energy tax revenue is given to residents. In addition to the service industry (S12), residential consumption involves other industries with higher carbon emission intensity such as the oil extraction and processing industry (S3), capital-intensive manufacturing (S7), and electricity production and supply industry (S9).
Additional implications of the SDA results on changes in carbon dioxide emissions in various industries can be seen in
Figure 7. Under the scenario uniEtax_th, the impact of carbon emission intensity and production structure effects on carbon emissions are not significantly different from scenario uniEtax15. At the same time, the final demand effect of most industries is higher than that in the scenario uniEtax15. For instance, agriculture, forestry, animal husbandry and fishery (S1), labor-intensive manufacturing (S6), and technology-intensive manufacturing (S8) are the primary industries for household consumption (as opposed to the service industry (S12) for government consumption), and their final demand effects are higher than in the scenario uniEtax 15, which saw increases of 0.64%, 0.64%, and 0.54%, respectively.
5.3. The Effects of an Energy Tax with Technological Progress
Table 6 shows the impact of a 15% energy tax and technological progress in energy utilization on carbon emissions and other macroeconomic variables. It can be seen that when compared with uniEtax15, technological progress in energy utilization further reduces the consumption of coal and natural gas. Therefore, both the total carbon emission and the carbon emission intensity see a greater decline. More importantly, technological progress in energy utilization can increase output per unit of energy consumption and alleviate the negative impact of energy tax collection on real GDP. In the scenario involving 3% technological progress in energy utilization, real GDP rises. Therefore, the progress of energy utilization technology is a critical means of promoting emissions reduction and efficiency and of achieving high-quality economic development.
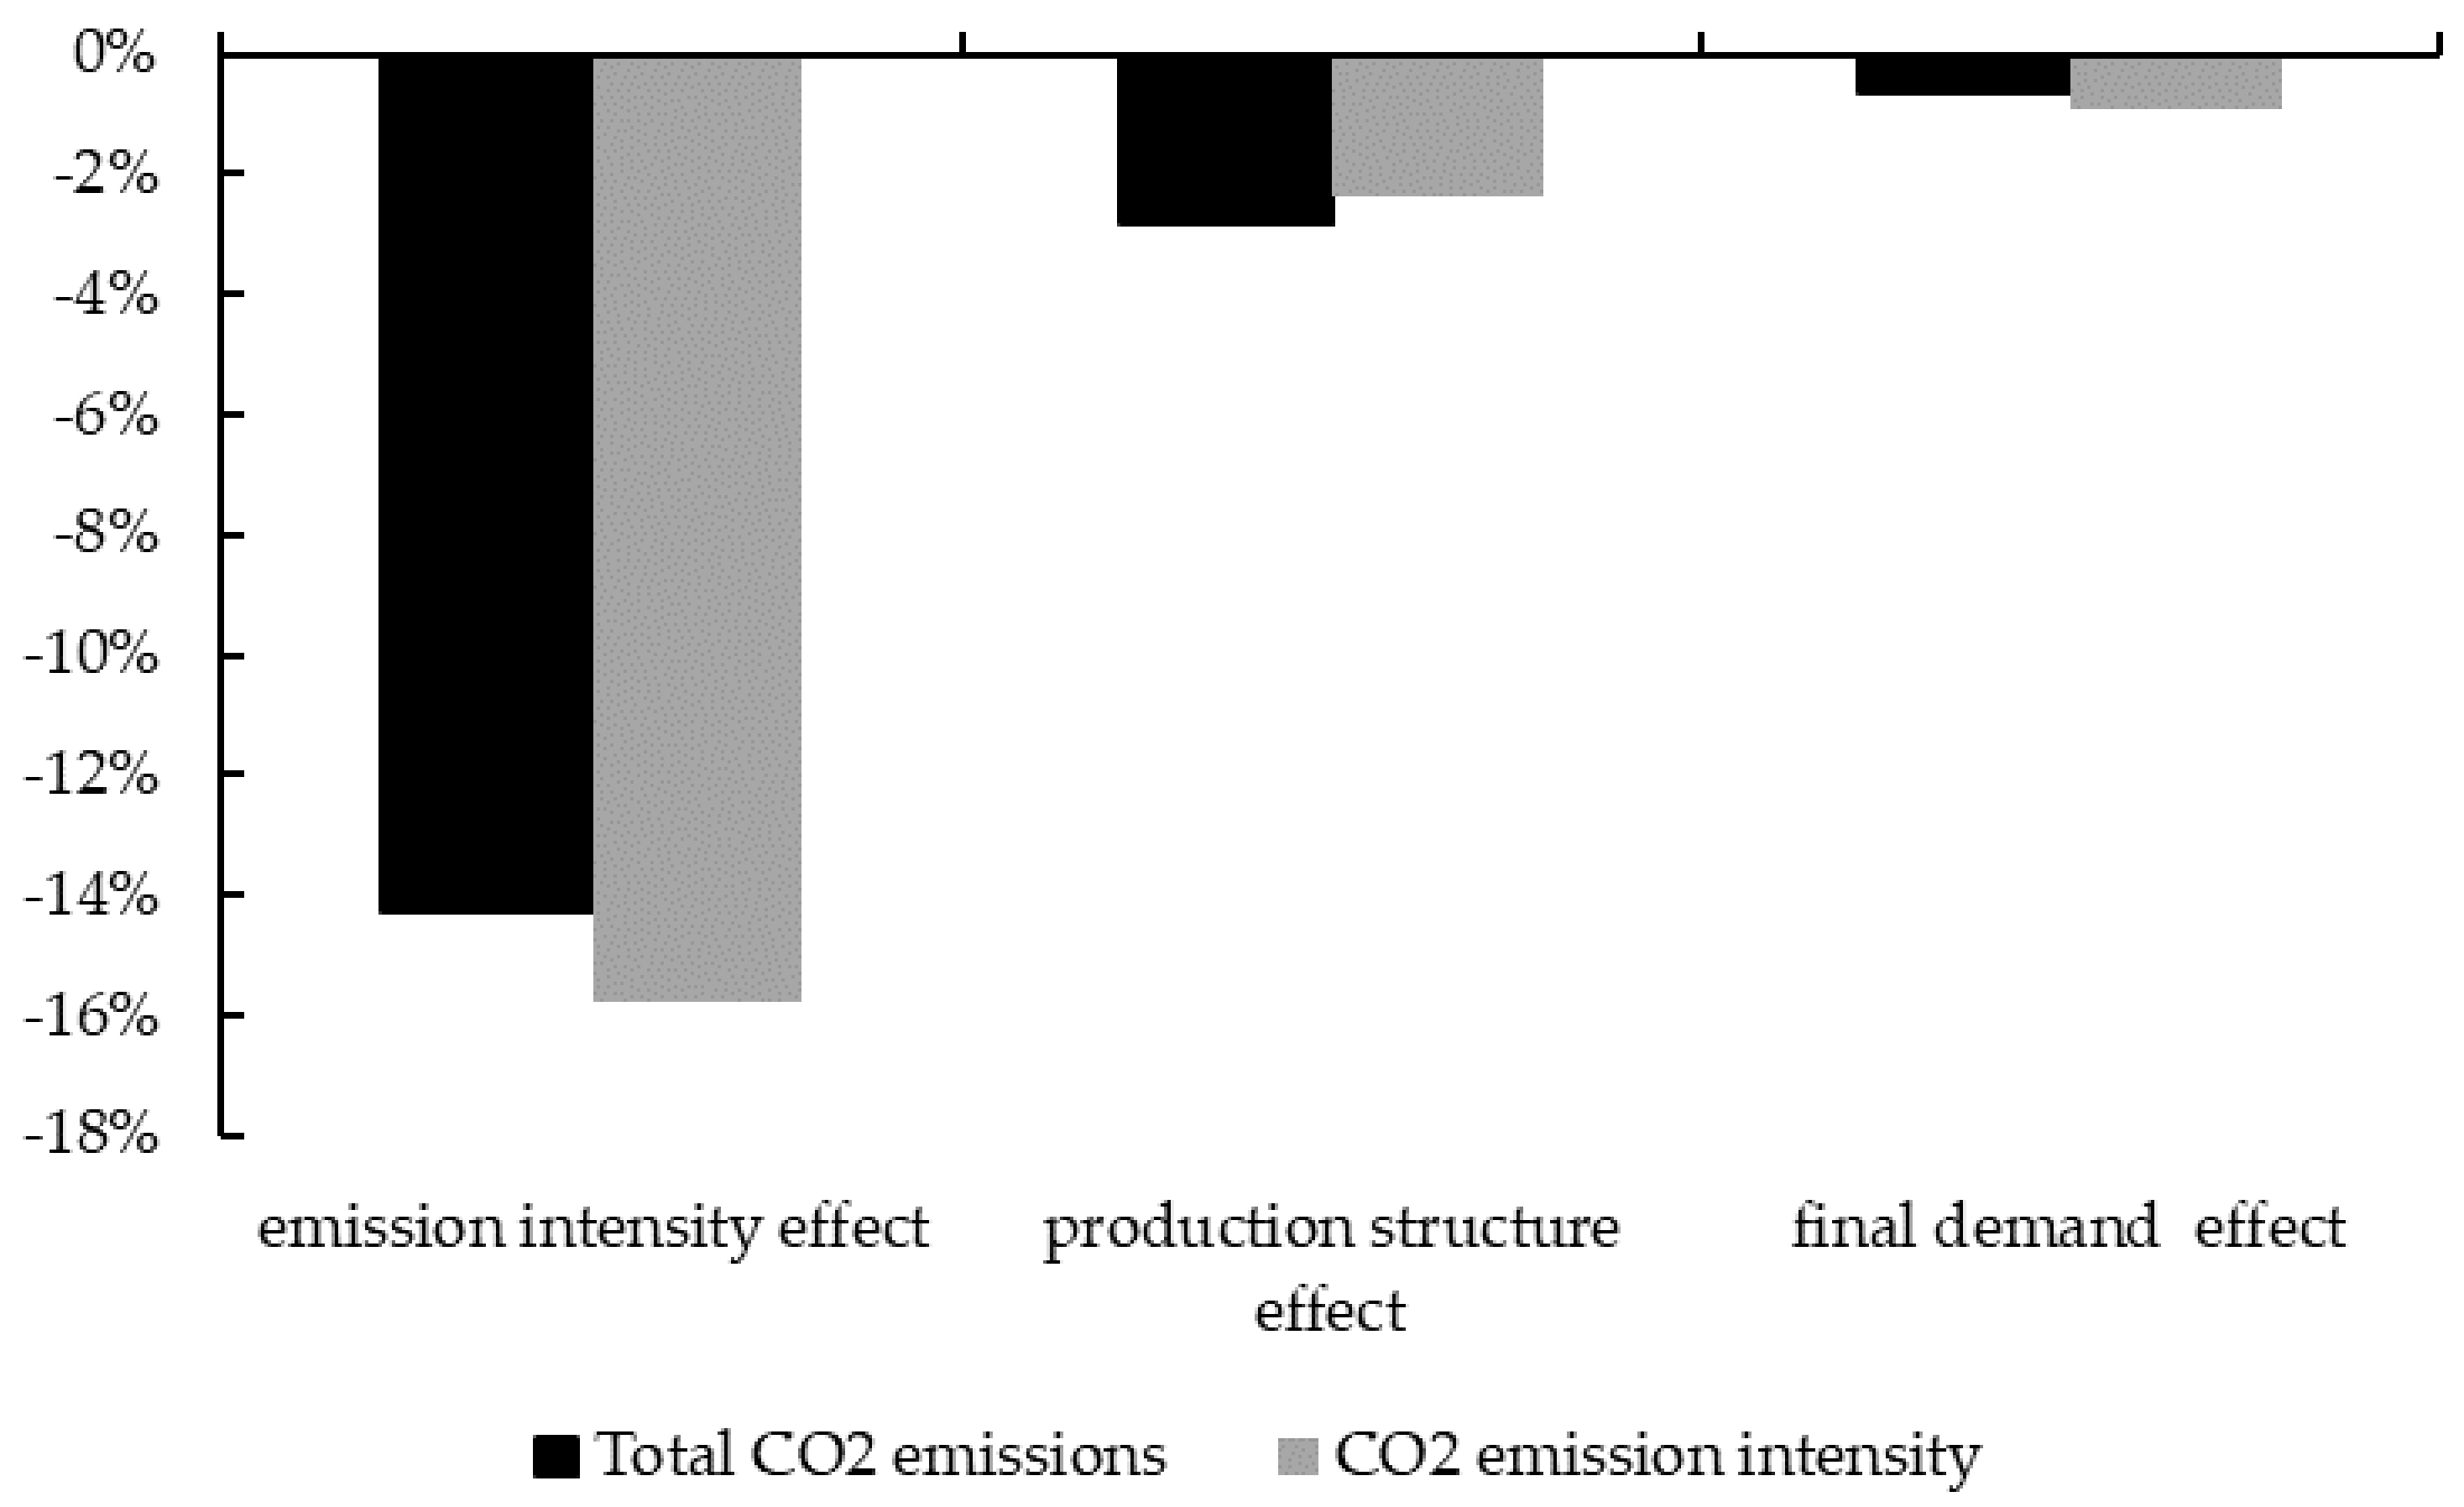
Taking the scenario uniEtax_tech3 as an example,
Figure 8 shows the results based on the SDA analysis of the factors driving national carbon dioxide emissions and intensity changes before and after the imposition of an energy tax. It can be seen that when the energy tax is imposed and energy utilization technology improves by 3%, the carbon emission intensity effect remains the leading factor driving the decline in national carbon emissions and carbon emission intensity. In contrast, the production structure effect plays a more significant role than in the scenario uniEtax15. The change in production structure drives the national carbon dioxide emissions and intensity to decline by 2% and 3%, respectively. The reason for this is that the total demand coefficients of coal mining and processing industry (S2), oil mining and processing industry (S3), natural gas mining and processing industry (S4), power production and supply industry (S9) products further decline in various industries, meaning that changes in the production structure further reduce national carbon emissions and intensity.
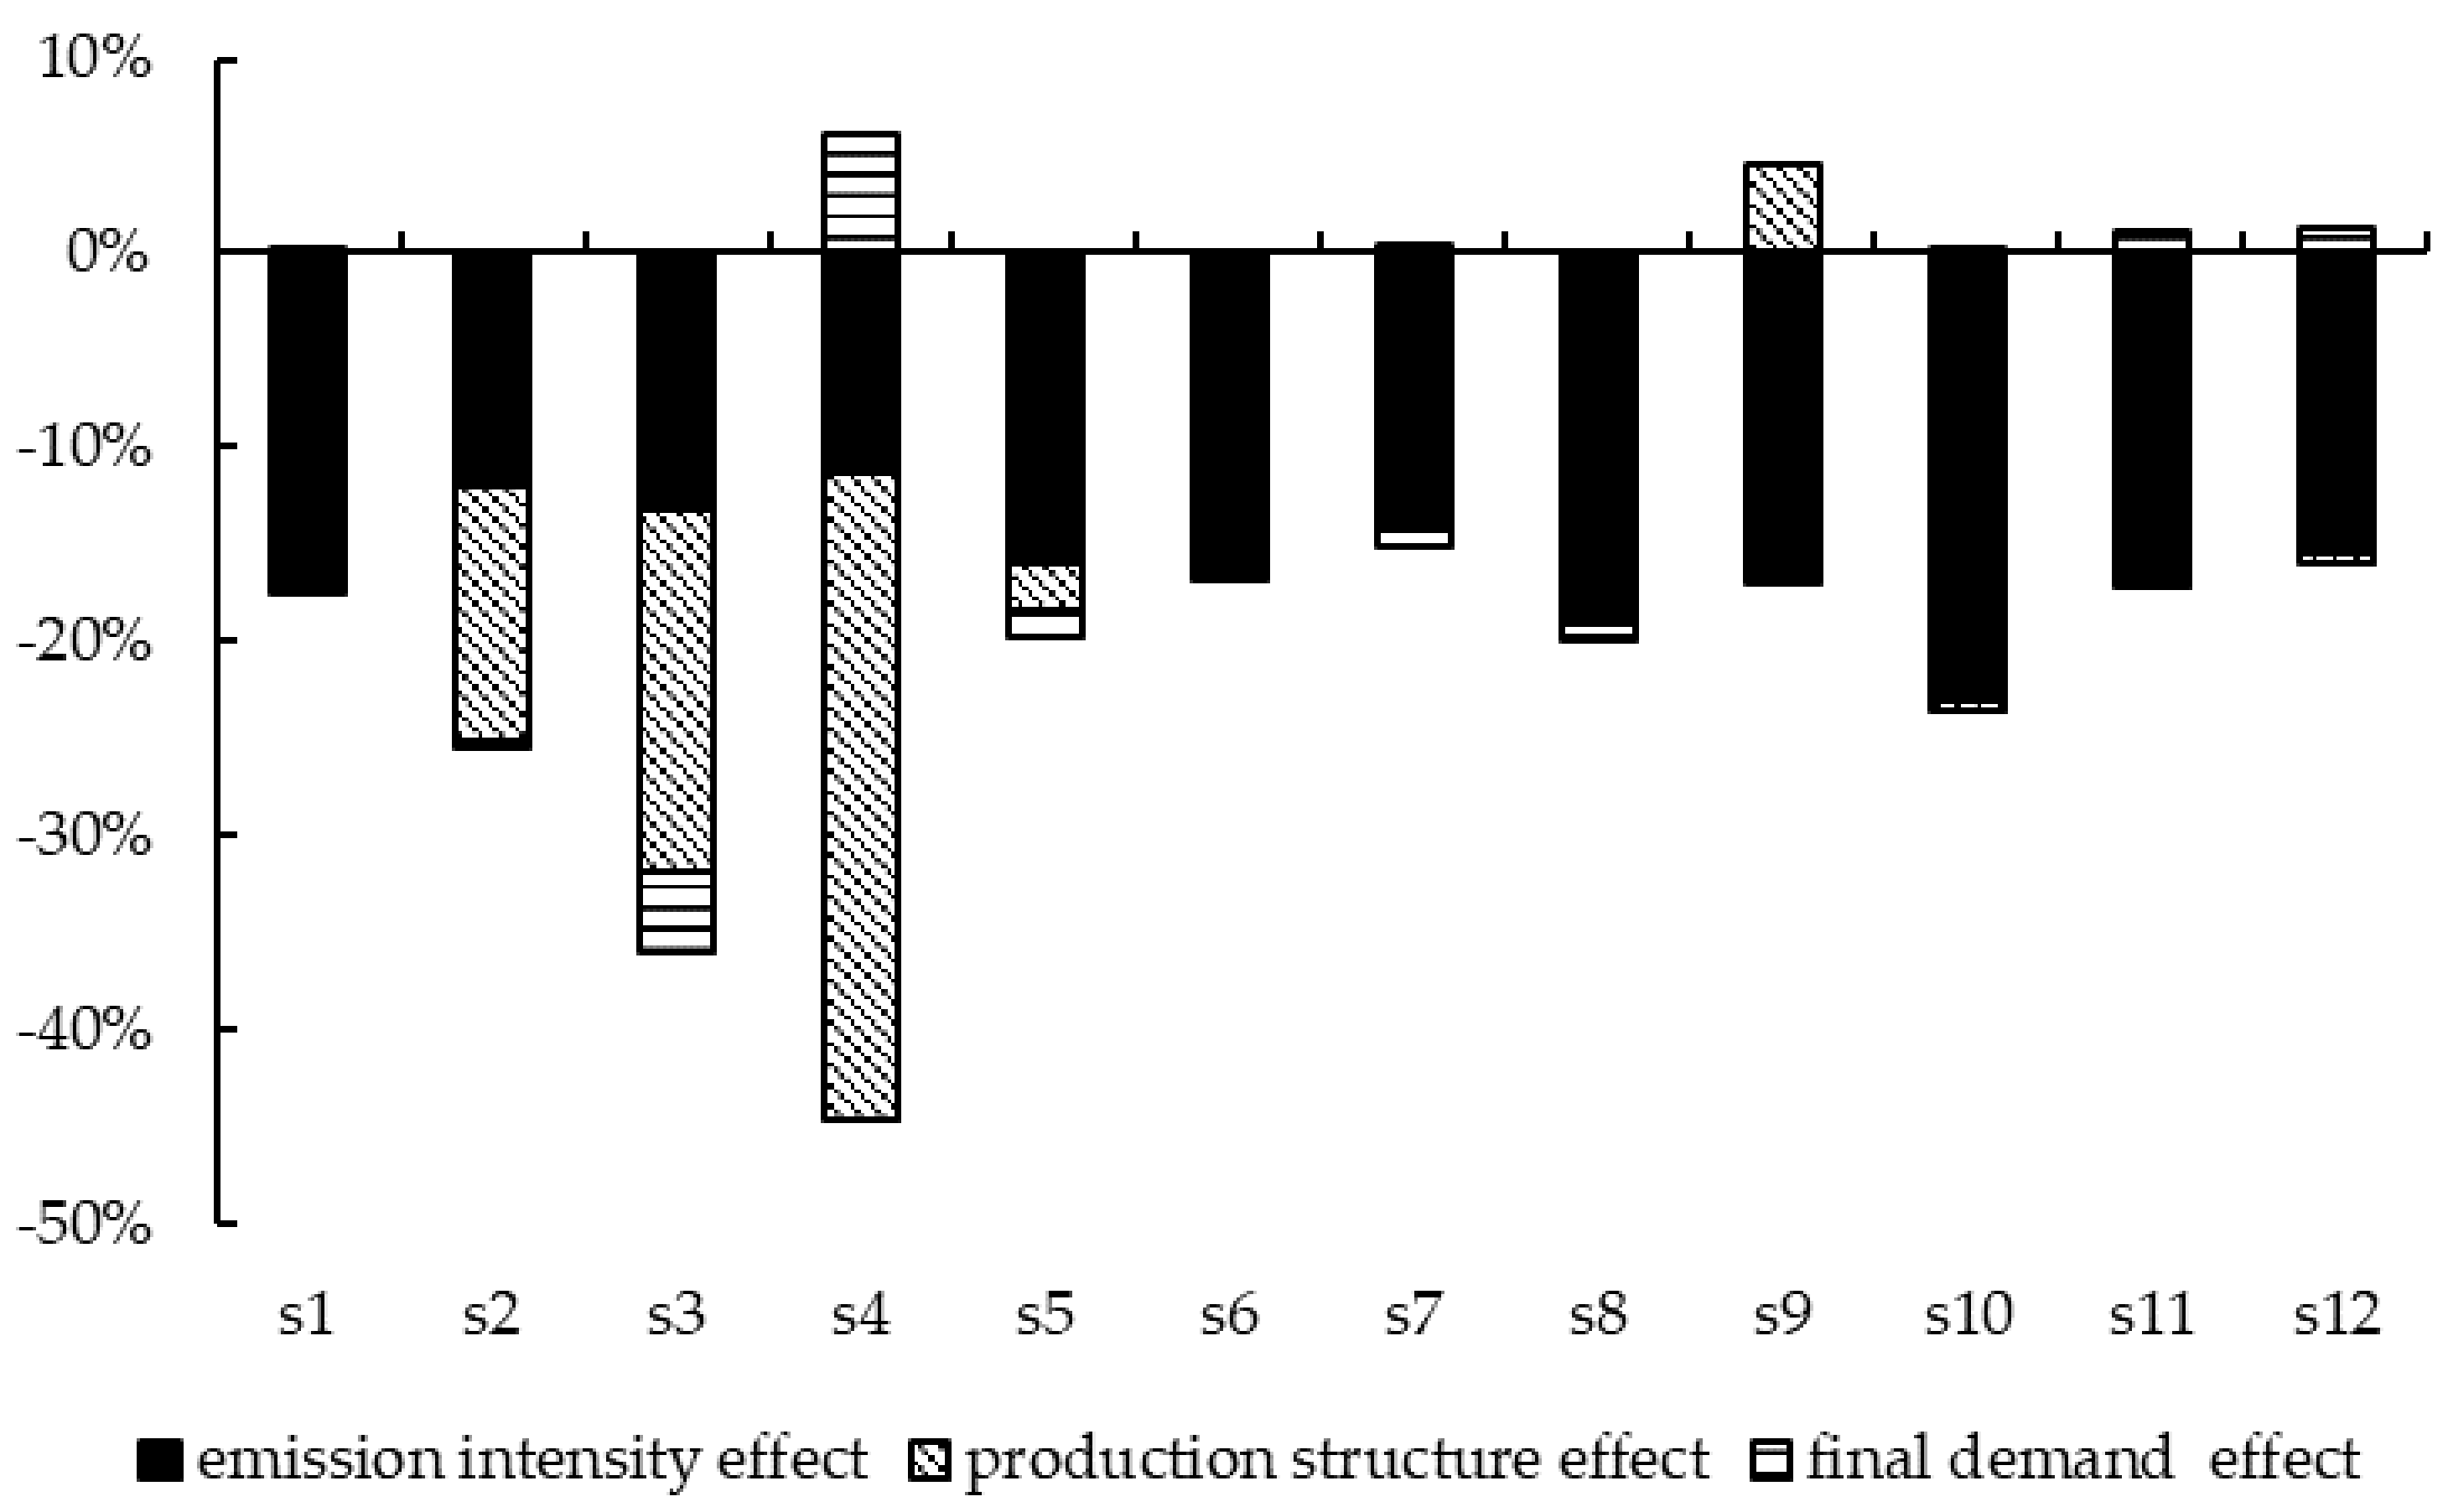
Figure 9 shows the SDA results for changes in carbon dioxide emissions in various industries. It can be seen that when compared with the uniEtax15 scenario, the carbon emission intensity effect in the scenario uniEtax_tech3 is not very different, although the production structure effect drives the carbon emissions of the energy industry (S2–S4, S9) to decrease further. The final demand effect reduces the carbon emissions of the energy industry the least amount, and even leads to an increase in carbon emissions. The reason for this is that the final demand of the oil extraction and processing industry (S3) under the scenario uniEtax_tech3 is CNY 114.133 billion higher than in the scenario uniEtax15. The production of the final product of this industry requires a large number of intermediate products of the natural gas extraction and processing industry (S4), which has a total demand coefficient of 0.43; thus, changes in final demand lead to an increase in carbon emissions from the natural gas extraction and processing industry (S4).
5.4. The Effects of Imposing a Differential Energy Tax
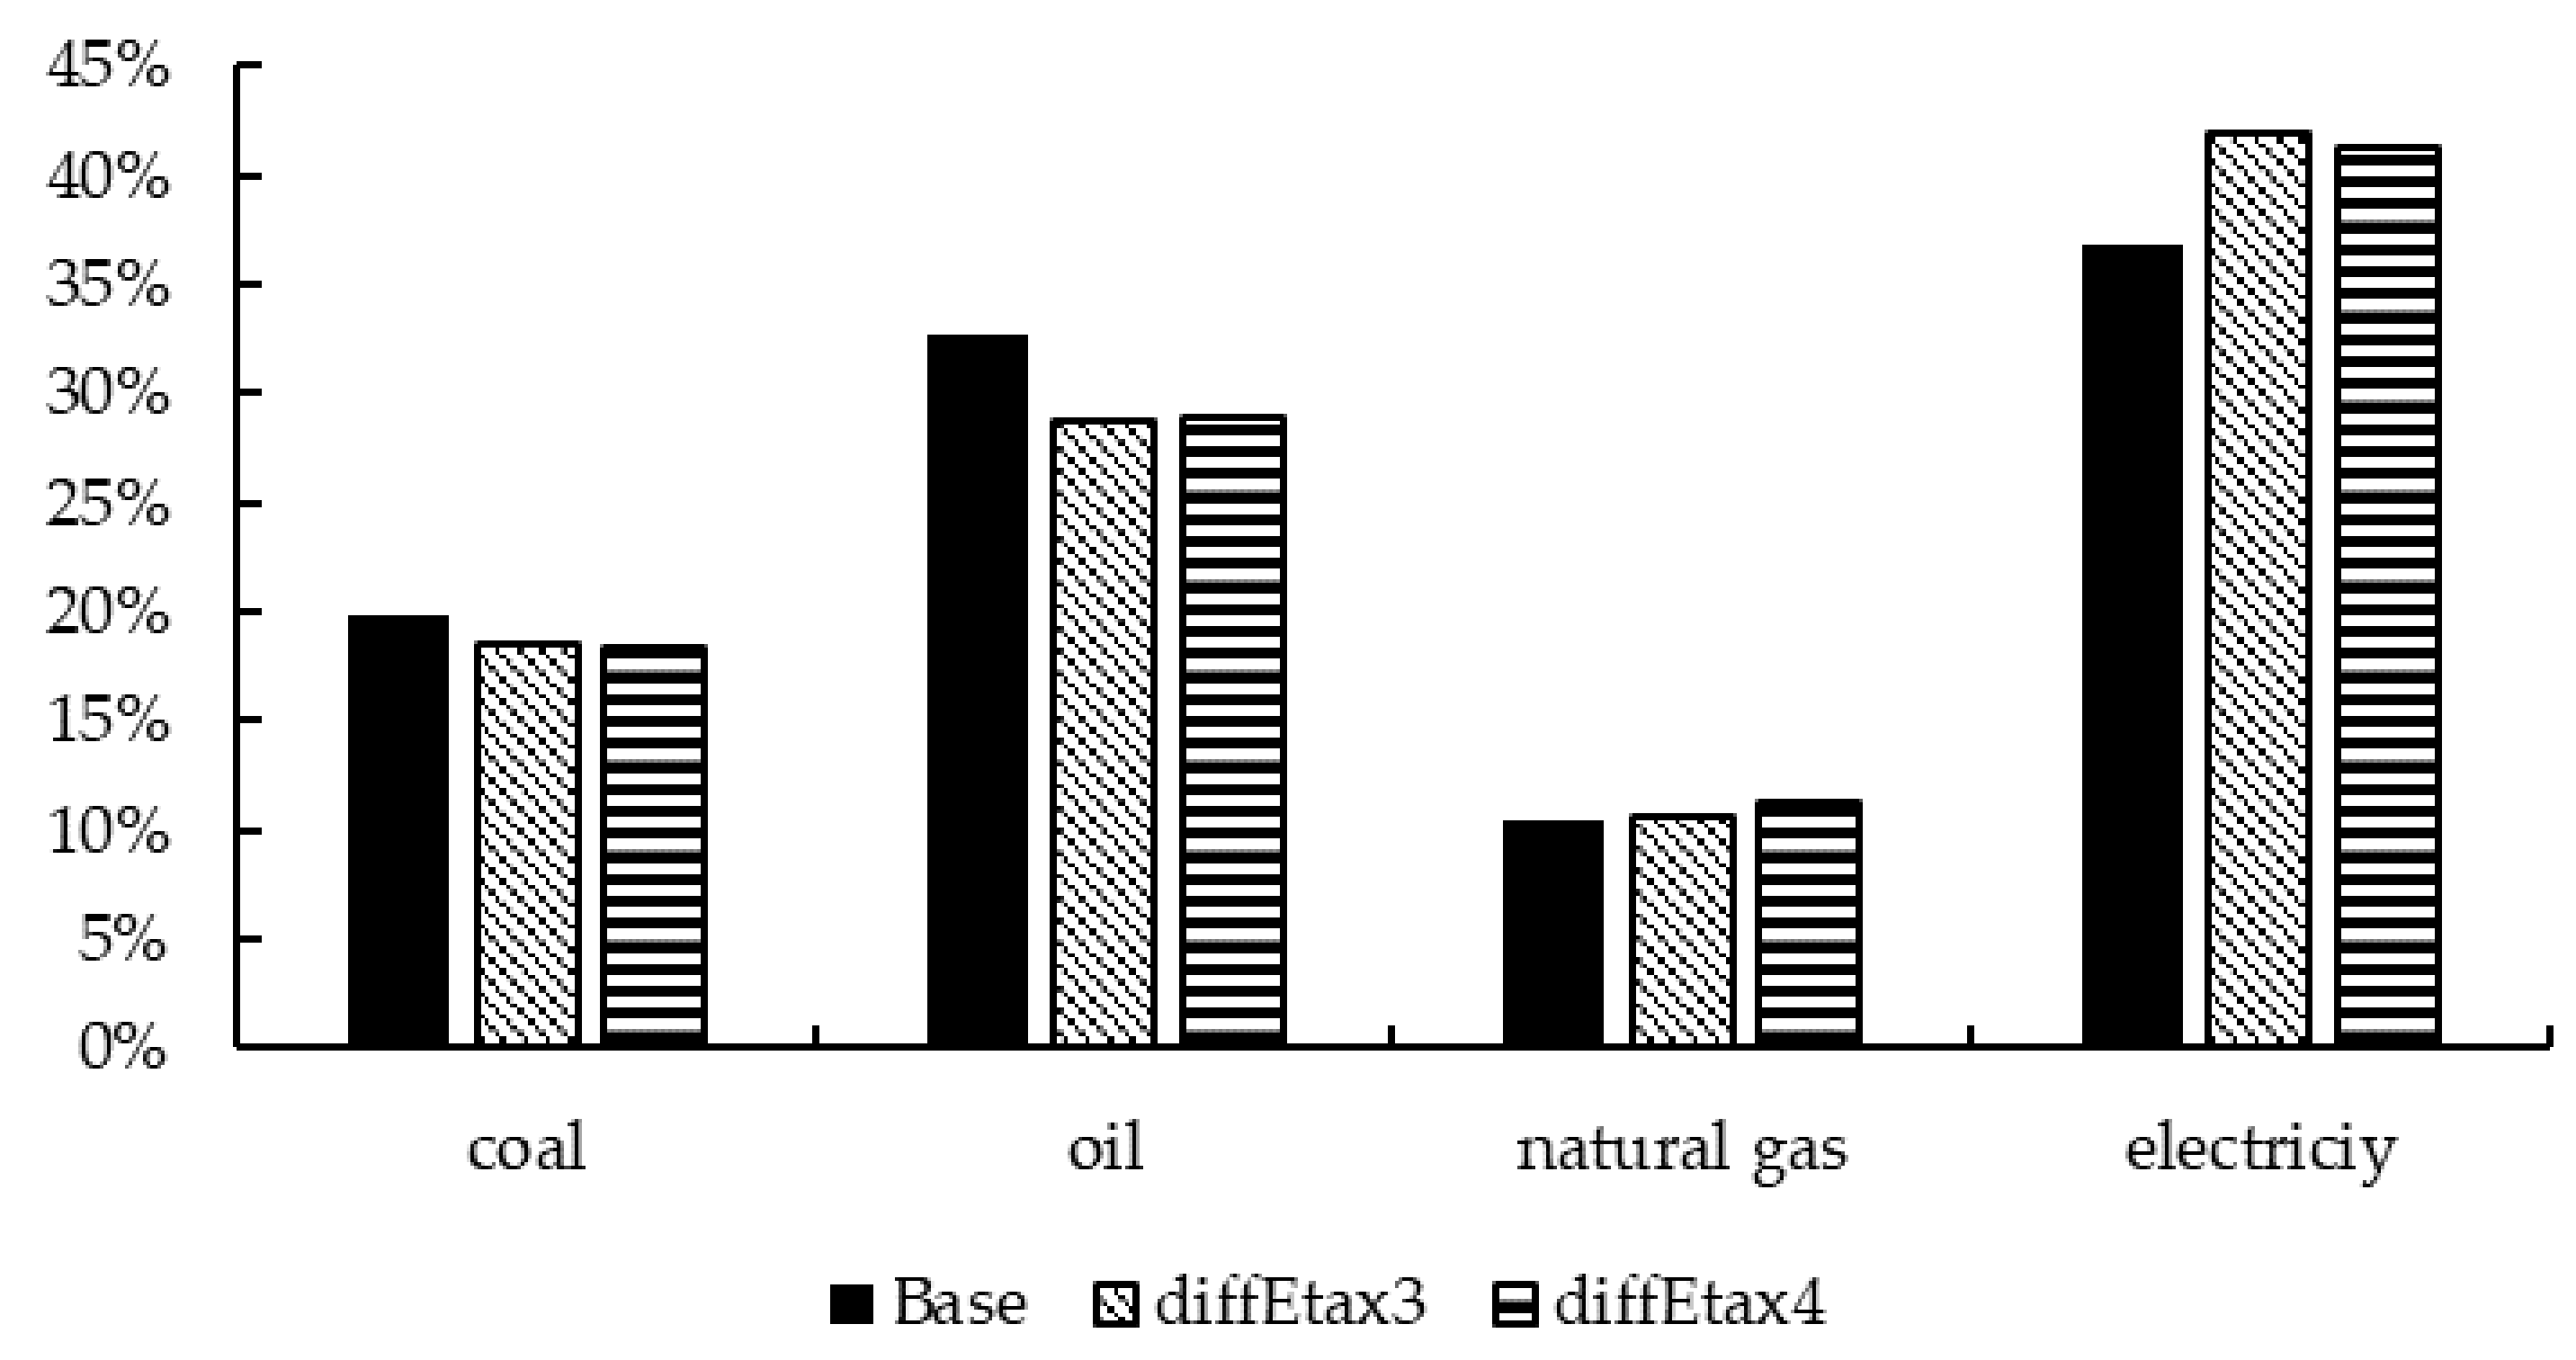
Table 7 shows the impact of differential energy taxes on carbon emissions and other macroeconomic variables. Compared with uniEtax15, which imposes a 15% energy tax on coal, oil and natural gas, reducing the energy tax on natural gas can alleviate the negative impact of energy tax policy on natural gas consumption. At the same time, it increases the proportion of natural gas consumption in total energy consumption and leads to a cleaner energy consumption structure. Under the diffEtax3 scenario, taxes on coal and oil significantly reduce the consumption of coal and oil, with gas consumption falling 9.48 percent due to higher gas prices, while electricity consumption increases by 2.09 percent. Under the diffEtax4 scenario where gas investment is subsidized, gas consumption drops only 1.36 percent while electricity consumption rises 2.81 percent. As shown in
Figure 10, when compared with no energy tax the energy consumption structure changes greatly in the scenarios diffEtax3 and diffEtax4, with the proportion of coal and oil consumption in total energy consumption decreases while the proportion of natural gas and electricity consumption in total energy consumption increases. Here, energy tax policy achieves the goal of energy saving and emission reduction while simultaneously leading to a cleaner energy consumption structure.
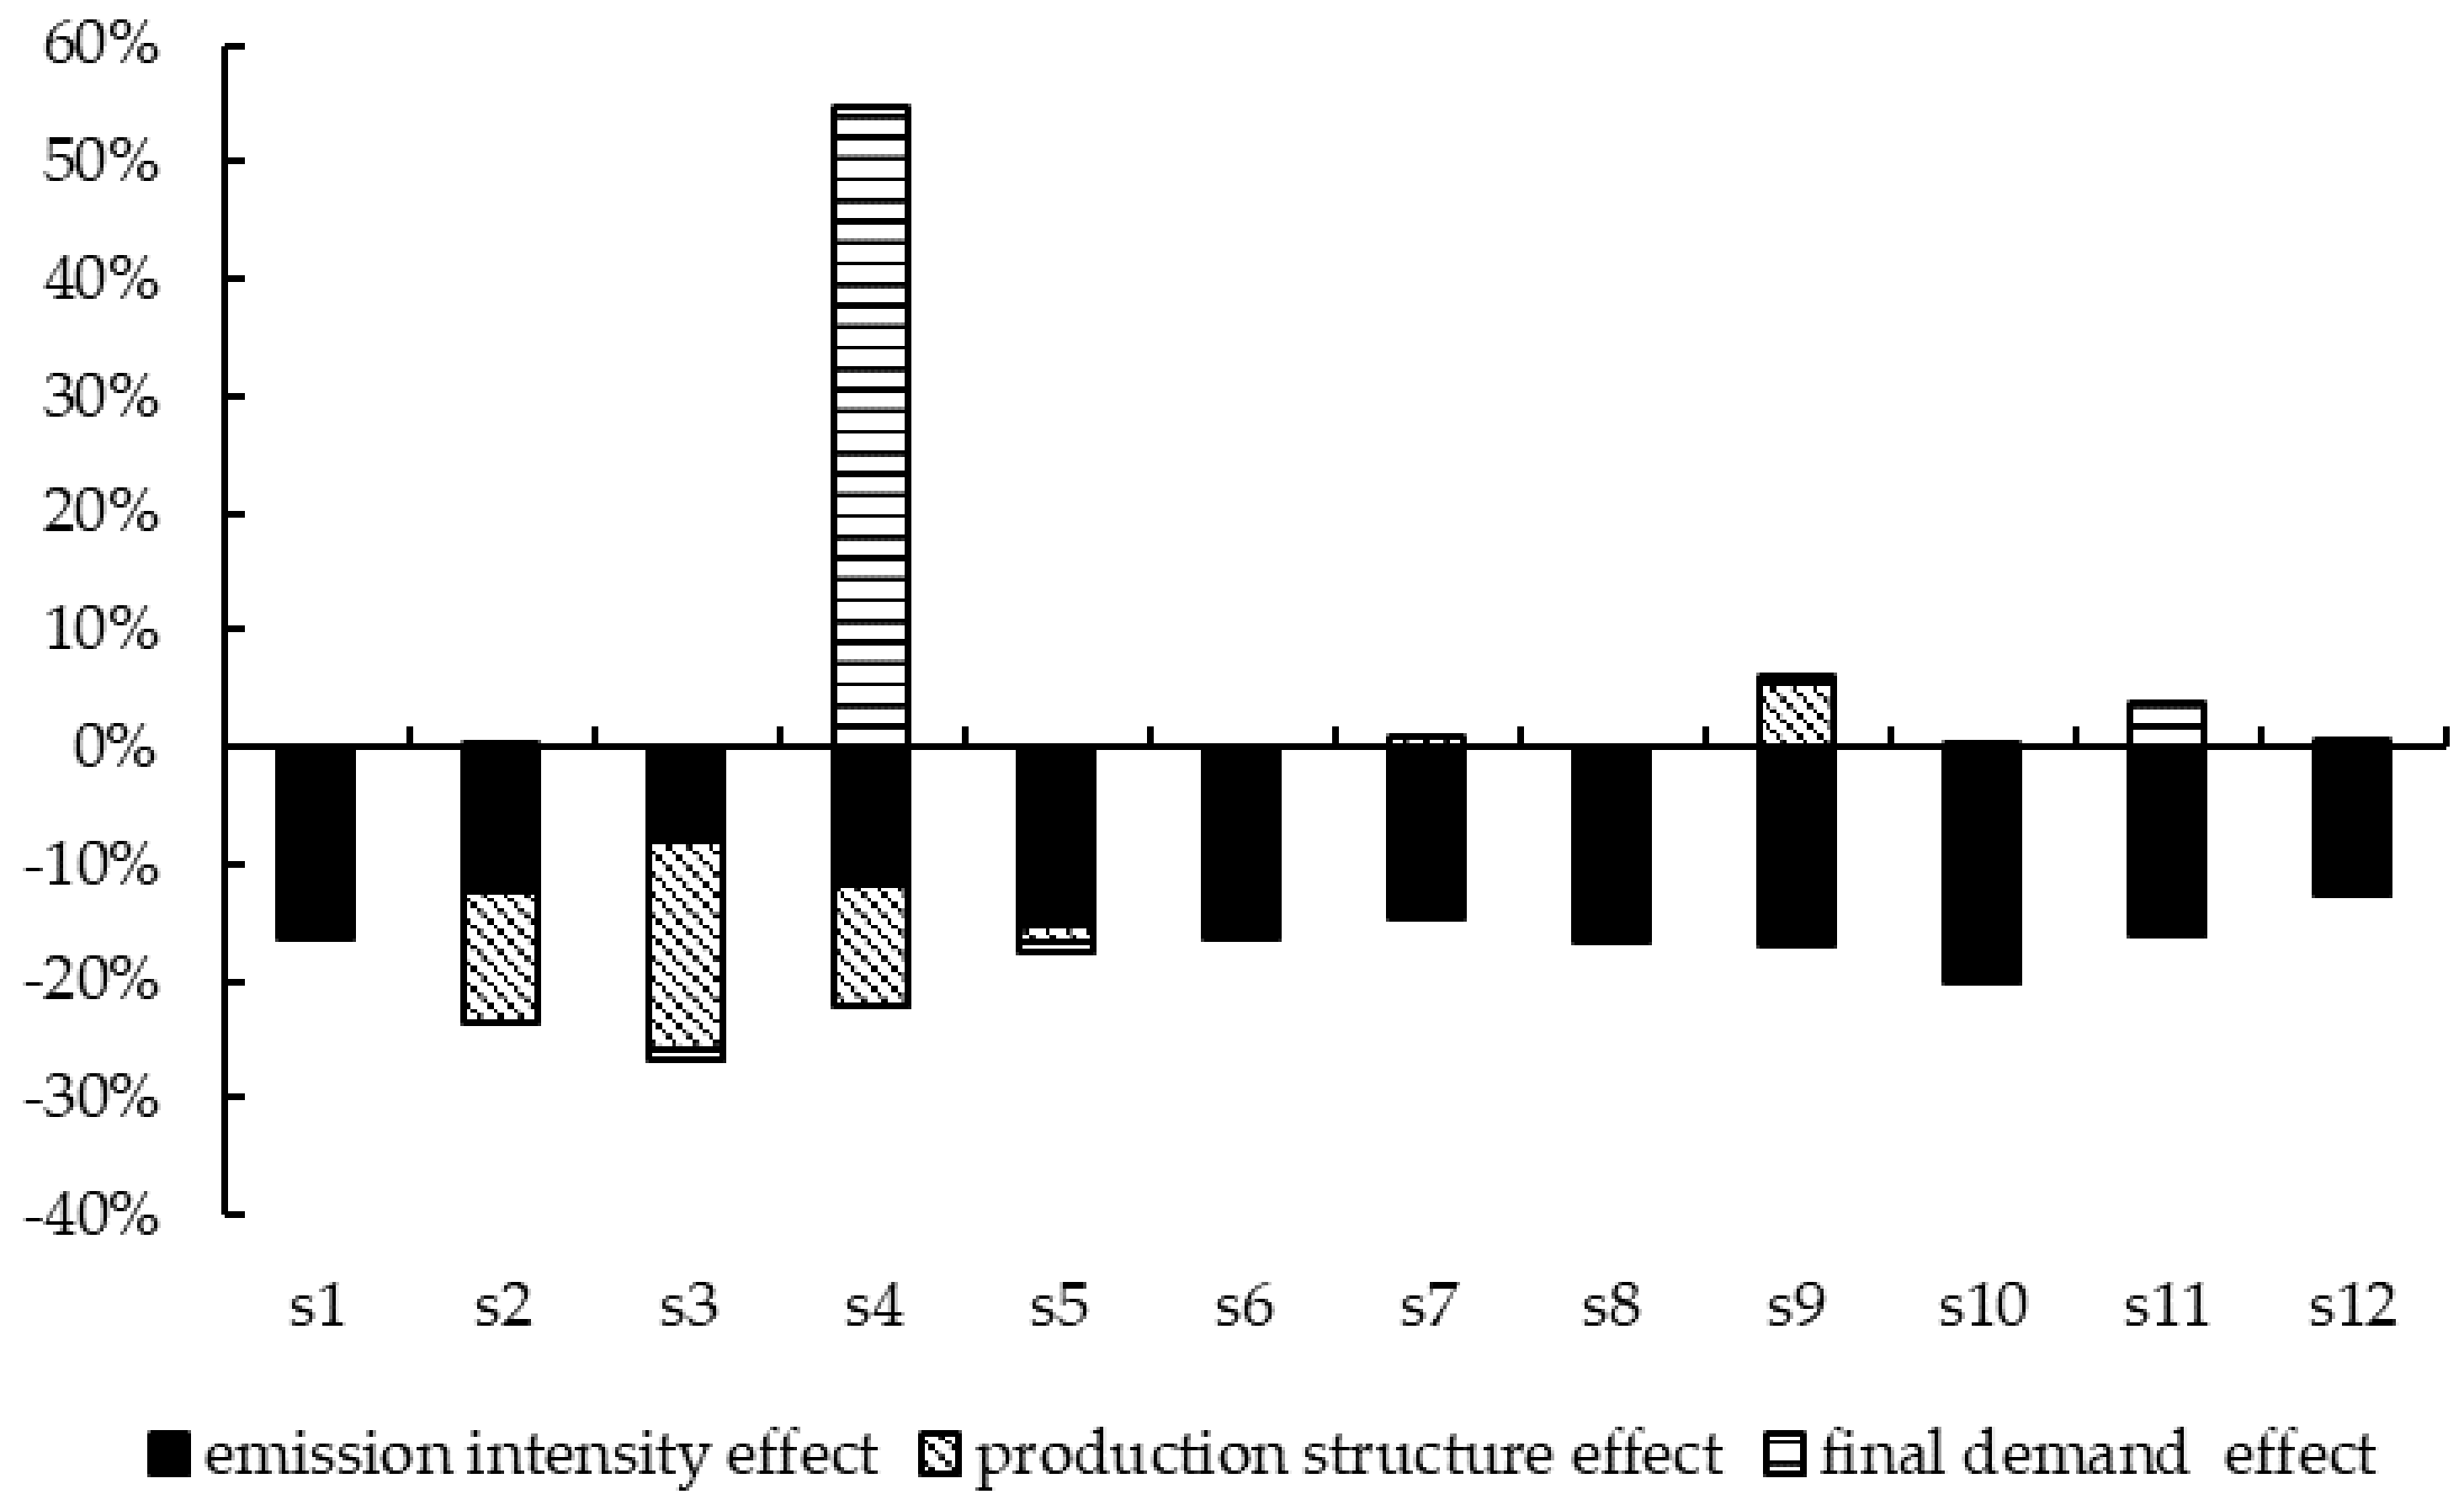
Under the scenario diffEtax4 SDA is used to analyze the factors driving changes in national carbon emissions and emission intensity, with the results shown in
Figure 11. The most important thing to note is that the final demand effect changes from a negative number in scenario uniEtax15 to a positive number here, indicating that changes in final demand lead to an increase in the total amount and intensity of national carbon emissions. The core reason for this may be that investment subsidies to the natural gas industry drive additional carbon emissions.
Figure 12 shows the SDA results for changes in the carbon emissions of various industries. It can be seen that after the collection of energy taxes and the use of energy tax revenue to subsidize the investment in the natural gas industry, the final demand of the natural gas extraction and processing industry (S4) increase by CNY 561.341 billion. Furthermore, the final demand changes increase the carbon emissions of the natural gas extraction and processing industry (S4) by 54.84%, which becomes the dominant factor driving changes in this industry’s carbon emissions.
6. Discussion
6.1. China’s Environmental Protection Tax and EU Energy Tax
Although China has not levied an independent energy tax recently, it does levy an environmental protection tax. This sub-section will introduce China’s environmental protection tax in detail and compare it with the EU’s energy tax.
During reform and opening up, the Chinese economy has improved by leaps and bounds. Although China’s extensive economic growth model with its high investment, high energy consumption, and high pollution has promoted rapid economic development, it has caused a series of energy-related and environmental problems as well, including severely low energy efficiency, an unreasonable energy consumption structure, apparent contradictions between energy supply and demand, and high levels of pollution. In recent years, China has continuously studied ways to solve energy and environmental problems through taxation tools. “
The Comprehensive Work Plan for Energy Conservation and Emission Reduction” issued by the State Council in 2007 proposed for the first time the formulation and improvement of taxation policies that encourage energy conservation and emission reduction, including promptly introducing resource tax reform plans, improving taxation methods, and increasing the level of the tax burden. Other details include the timely introduction of fuel taxes and research on levying environmental taxes and tax policies that promote the development of new energy. In the “
National Thirteenth Five-Year Plan”, active promotion of reform of environmental taxes and fees, selection of tax items with heavy prevention and control tasks, and maturation of technical standards in order to levy environmental protection taxes were proposed, along with a gradual expansion of the scope of tax collection. In 2016 China’s first environmental tax law, the “
Environmental Protection Tax Law of the People’s Republic of China”, was passed, with official implementation taking place on 1 January 2018. However, the original concept of the environmental protection tax eventually evolved from a discharge pollution fee to a tax. For pollutants discharged by enterprises, the original pollution discharge fee to was changed to an environmental protection tax. Although the problems of inconsistent pollution discharge fee standards and insufficient compulsory standards in various regions have been improved, the legislative framework and system design of the “
Environmental Protection Tax Law" are subject to many restrictions. According to this law, the taxable pollutants under the environmental protection tax are air pollutants, water pollutants, solid waste, and noise. However, the international definition of an environmental protection tax generally refers to environment-related taxes. For example, in the OECD statistical database the environmental protection tax base is divided into four categories: energy taxes, transport taxes, taxes on pollution and taxes on resources. Therefore, the broad definition of an environmental protection tax is supposed to include energy, transport, pollution, and resource taxes. In addition, according to Eurostat data the EU energy tax accounted for 77.9% of the EU’s total environmental protection tax revenue in 2019, far exceeding the transportation tax (18.9%) and the sum of the pollution tax and resource tax (3.2%). Therefore, the tax revenue of the EU countries derived specifically from pollutants accounts for a small proportion of environmental protection tax revenue, while energy tax revenues account for the largest proportion. This condition may result from the situation in the EU where the tax target is often pollution-related inputs or outputs. Moreover, many EU countries have not levied taxes specifically on pollutants [
46].
Until now, international agencies such as Eurostat have clearly defined energy taxes. According to “Environmental Taxes: A Statistical Guide (2013)”, jointly promulgated by Eurostat, the European Commission’s Directorate-General for the Environment, the European Commission’s Directorate-General of Taxation and the General Administration of Customs, the Organization for Economic Cooperation and Development, and the International Energy Agency, environmental taxes are a type of tax the base of which is on substances that have a clear negative impact on the environment. Energy taxes are such a type of environmental tax. Their tax base includes energy products used for transportation such as gasoline and diesel as well as energy products used for stationary purposes such as fuel oil, natural gas, coal, electricity, biofuels, and renewable energy. Carbon dioxide and sulfur dioxide taxes are thus energy taxes. The IPCC pointed out in its fourth assessment report that an energy tax, that is, a tax on the energy content of fuel, can reduce energy demand, thereby reducing carbon dioxide emissions from the use of fossil fuels, whereas a carbon tax is a tax on the carbon content of fossil fuels.
China has had no plans to impose an energy tax or carbon tax until recently. At present, Chinese scholars are still at the stage of theoretical discussion about energy taxes and have different opinions on the definition of an energy tax. These can generally be divided into a broad and a narrow definition. A broad energy tax definition includes all taxes seeking to save energy and improve energy efficiency, such as energy production taxes (i.e., value-added taxes), energy consumption taxes (i.e., fuel taxes), energy environmental taxes (i.e., carbon taxes), and energy special taxes (i.e., vehicle purchase taxes). Narrowly speaking, energy tax generally refers to energy consumption taxes on the consumption and use of energy. The difference between a broadly-defined and a narrowly-defined energy tax is essentially between energy-related taxes and energy taxes specifically. The former includes all energy-related taxes and is a comprehensive concept, while the latter refers to an independent tax belonging to the energy taxation part of the system. The energy taxes studied in this paper use the narrow definition of energy tax, namely, that energy tax refers to taxes levied on the use and consumption of fossil energy sources such as coal, oil, and natural gas in order to save energy and improve energy efficiency. Although there is no independent energy tax in China, the resource tax in the energy mining link and the fuel tax in the consumption link can be regarded as energy-related taxes to a certain extent. Above all, this paper believes that energy taxes should be placed in the category of consumption taxes, the theoretical basis of which is to internalize the negative externalities in the environment caused by energy consumption, to reflect external costs by increasing energy prices, and ultimately to achieve the goals of energy conservation and emission reduction.
6.2. Energy Taxes and Regional Equity
Environmental policies often face a trade-off between emissions reduction efficiency and development equity [
47,
48,
49]. Although this contradiction will eventually be resolved with the decoupling of carbon emissions and economic growth brought about by technological progress, it will exist for a long time in the course of moving towards carbon neutrality.
As far as China is concerned, the introduction of an energy tax and the reduction in carbon emissions caused by this policy instrument may further aggravate the imbalance in development among various regions. A typical example is that energy taxes mainly make enterprises which consuming high amounts of energy bear the additional costs of energy use, leading to a decline in the output of such enterprises. However, most of these enterprises are located in underdeveloped regions. Therefore, the levying of an energy tax may have a greater negative impact on economic growth and resident welfare in these regions, further deteriorating regional development equity.
Therefore, transfer payments should be used to deal with regional equity issues that the introduction of energy taxes may cause, as the products produced by energy-consuming provinces (i.e., often underdeveloped provinces) are ultimately used in provinces with large final demand (i.e., often developed provinces). The industries that consume high amounts of energy tend to have lower value-added rates, and do not bring very much economic growth to underdeveloped provinces. Therefore, while the demand of the developed provinces drives the production of the underdeveloped provinces, it is the underdeveloped provinces that bear a greater share of energy tax costs compared to the developed provinces. Based on the principles of consumer responsibility and fairness, the introduction of fiscal transfer payments from developed provinces to underdeveloped provinces may be considered in order to make up for the energy conservation and emissions reduction costs borne by underdeveloped regions in the context of emissions reduction efficiency and development equity.
6.3. Managerial Implications
China has proposed achieving a carbon peak by 2030 and achieving carbon neutrality by 2060. Environmental taxation via such means as energy taxes is an important fiscal policy lever for regulating energy consumption and mitigating carbon emissions, and is bound to play an essential role in energy conservation and emissions reduction in the future. This paper demonstrates the necessity and significance for China of levying an energy tax in order to achieve energy conservation and emissions mitigation, and explores the mechanisms by which energy taxes affect carbon emissions and carbon intensity. This paper suggests that when levying an energy tax, all regions and energy industries cannot be treated equally. Specific energy tax rates and related supporting policies should be formulated taking into account all regions and the characteristics of the different energy industries. Although energy taxes represent a market-incentive environmental policy, the government plays the most important role in ensuring the achievement of better effects on energy conservation and emissions mitigation without causing severe negative macroeconomic impacts. Regarding the setting of energy tax rates as well as collecting links, collecting methods, and revenue recycling methods, the government should carry out full demonstration and research in order to ultimately achieve energy tax policies that help China move towards carbon neutrality.
7. Conclusions and Limitation
7.1. Main Results
Beginning in the 1990s, climate change has been greatly concerned all countries in the world. Many climate-change related conferences have been held around the world in order to clarify the responsibilities of each country in facing this global environmental problem. China has taken the initiative to sign agreements on reducing greenhouse gas emissions, and issued a decree to put this commitment into action.
Focusing on an ad valorem energy tax on fossil fuels and adopting the computable general equilibrium model commonly used in energy and environmental economy, this paper analyzes the carbon reduction effects of an energy tax in China in detail and under different pre-set scenarios. This paper further observes the changes in major macroeconomic variables such as government net income. The results show that energy taxes have a positive effect on reducing carbon dioxide emissions. Subsidization of either private income tax or of indirect taxes on production with energy tax revenue can realize a double dividend effect. Technological progress in energy utilization can improve the output of unit energy consumption, alleviate the negative impact of energy taxes on real GDP, and even cause real GDP to increase rather than decrease. Therefore, technological progress in energy use is an essential way to promote emissions reduction and efficiency while achieving high-quality economic development. Imposing energy taxes only on coal and oil and exempting natural gas from energy tax or using energy tax revenues from the coal and oil industry to subsidize investment in the natural gas industry can optimize the energy consumption structure and promote the transformation to cleaner energy consumption.
This paper innovatively combines CGE and SDA, using SDA to analyze the mechanism of energy tax policies affecting carbon emissions and intensity and explore the factors driving change in carbon dioxide emissions and intensity across the country and in various industries before and after an energy tax is imposed, which has yet to be discussed in the existing literature. This paper reaches the following new conclusions. After an energy tax is imposed, the main factor driving the decline in national carbon emissions and carbon emission intensity is the carbon emission intensity effect. Although the production structure effect and the final demand effect play a role, their effects are relatively weak. When levying energy taxes, the carbon emission intensity effect is the leading factor in the decline of carbon emissions in most industries. However, the production structure effect of the energy industry (S2–S4, S9) has a relatively large contribution to the reduction of its carbon emissions, even more than the effect of carbon intensity. Using energy tax revenues to reduce personal income tax affects national carbon emissions and intensity by affecting the final demand structure. The progress of energy utilization technology will make the production structure effect play a more significant role as the total demand coefficient of energy industry products in various industries further decreases. The collection of energy taxes and the use of energy tax revenues to subsidize investment in the natural gas industry greatly increases final demand in the natural gas extraction and processing industry (S4), increasing its carbon emissions.
7.2. Policy Recommendations
First, the results show that the introduction of an energy tax can effectively reduce carbon emissions and carbon emission intensity, with the primary impact mechanism to reduce carbon emission intensity and improve carbon emission efficiency. Therefore, energy taxes are an effective fiscal policy instrument for achieving emissions mitigation and efficiency improvement. In order to achieve China’s goals of carbon peaking and carbon neutrality, the introduction of energy taxation is assumed to be necessary in the future. However, it is necessary to gradually increase the energy tax rate in order to avoid serious negative impacts on the real economy and social welfare in implementing the energy tax.
Second, this paper shows the different impacts on carbon emissions and the macroeconomics of revenue recycling methods. We should learn from the experience of European countries and explore ways to implement appropriate tax revenue recycling. For example, energy tax revenues could be transferred to reduce personal income taxes or corporate production taxes in order to alleviate the negative impact of the energy tax burden on the national economy and social welfare. Among these scenarios, if tax revenues are used to reduce personal income tax both a “green dividend” in emissions reduction and efficiency improvement and a “blue dividend” of promoting green and high-quality economic development and improving resident welfare can be realized.
In addition, this paper also proposes the following three recommendations that are less involved in the extant literature.
First, this paper finds a heterogeneous impact on the energy consumption structure when energy taxes are imposed on various energy sources with different tax rates. It is suggested that the collection of energy taxes should comprehensively consider the policy orientation of developing clean energy in order to guide enterprises and individuals to increase clean energy consumption by reducing or exempting the energy tax and thereby promoting the consumption structure of these energy sources. In particular, the world is currently transitioning from fossil energy to clean and renewable energy, and there may be an insufficient supply of renewable energy when fossil energy production declines. Natural gas is a cleaner fuel than coal and oil, and it is the energy of choice to make up for electricity shortages during this transition process.
Second, the results show that improving production-side carbon emissions efficiency and reducing carbon emissions per unit of output (which means promoting technology in energy utilization) is one of the most effective ways to reduce carbon emissions. Therefore, the government should vigorously develop energy-saving technology, promote the rapid development of energy utilization technology, and significantly improve enterprise energy utilization efficiency in order to achieve better energy-saving emissions reductions along with high-quality economic development.
Third, although changes in the production structure and final demand of various industries have an effect on reducing emissions and increasing efficiency, the effects need to be improved, which means that improving production structure and optimizing final demand has tremendous potential to help China reduce emissions and increase efficiency. On the one hand, optimizing the energy consumption structure represented by the electrification rate is a meaningful way to optimize the production structure. Improving the electrification rate, which refers to the ratio of electricity to total final energy consumption, is an important symbol of the progress of modern civilization and is the inevitable choice in the realization of carbon neutrality. Therefore, it is necessary further to promote the replacement of traditional fossil energy by electricity and increase the electrification rate, which will effectively promote emissions reduction and efficiency. On the other hand, optimizing the final demand structure and avoiding unnecessary demand will help to reduce carbon emissions and intensity from the demand side. Examples include controlling unreasonable demand and avoiding blind investment in industries with high embodied carbon such as the construction industry, advancing changes in the energy-saving and green consumption of residents, improving China’s position in the global value and industry chains, optimizing the structure of export products, and reducing embodied energy consumption for export demand. In the future, integrating energy tax policy with demand management will have significant potential for emissions reduction and energy conservation.
7.3. Limitation
However, this paper has one notable limitation. The latest input–output table data are from 2018, leading to time-dependent deviations in the research results. Thus, in order to quantitatively analyze the impact of energy taxes on different regions of China multi-regional input–output tables are needed for further research. In light of this important limitation, we hope to continue to improve our research work in the future.


