Article

Literature Review Reveals a Global Access Inequity to Urban Green Spaces

1
The Key Laboratory for Silviculture and Conservation of Ministry of Education, Key Laboratory for Silviculture and Forest Ecosystem of State Forestry and Grassland Administration, Research Center for Urban Forestry, Beijing Forestry University, Beijing 100083, China
2
Research Group Sylvanus, Institute for Technology Assessment and Systems Analysis, Karlsruhe Institute of Technology, Karlstr. 11, 76133 Karlsruhe, Germany
3
Chair of Silviculture, Institute of Forest Sciences, Faculty of Environment and Natural Resources, University of Freiburg, 79106 Freiburg, Germany
4
Department of Psychiatry and Psychotherapy, Central Institute of Mental Health, Medical Faculty Mannheim, University of Heidelberg, J5, 68159 Mannheim, Germany
*
Author to whom correspondence should be addressed.
Sustainability 2022, 14(3), 1062; https://doi.org/10.3390/su14031062
Submission received: 30 November 2021 / Revised: 12 January 2022 / Accepted: 13 January 2022 / Published: 18 January 2022
(This article belongs to the Special Issue Advances in Green Infrastructure Planning)

Abstract

:
Differences in the accessibility to urban resources between different racial and socioeconomic groups have exerted pressure on effective planning and management for sustainable city development. However, few studies have examined the multiple factors that may influence the mitigation of urban green spaces (UGS) inequity. This study reports the results of a systematic mapping of access inequity research through correspondence analysis (CA) to reveal critical trends, knowledge gaps, and clusters based on a sample of 49 empirical studies screened from 563 selected papers. Our findings suggest that although the scale of cities with UGS access inequity varies between countries, large cities (more than 1,000,000 population), especially in low- and middle-income countries (LMICs), are particularly affected. Moreover, the number of cities in which high socioeconomic status (high-SES) groups (e.g., young, rich, or employed) are at an advantage concerning access to UGS is substantially higher than the number of cities showing better accessibility for low-SES groups. Across the reviewed papers, analyses on mitigating interventions are sparse, and among the few studies that touch upon this, we found different central issues in local mitigating strategies between high-income countries (HICs) and LMICs. An explanatory framework is offered, explaining the interaction between UGS access inequity and local mitigating measures.

1. Introduction

Over half of the world’s population now live in urban areas, and this proportion is projected to increase to about 75% by 2050 [1]. Urban green spaces (UGS), as the critical connection between the natural environment and human beings in cities, can deliver a variety of ecosystem services that increase both the life quality and resilience of urban dwellers [2,3,4]. Moreover, UGS have been linked to increased physical and mental well-being, reduced psychological morbidity, and enhanced social cohesion [5,6]. Urban residents might be particularly vulnerable to the disparity between green, blue, and built infrastructures under the complicated circumstances of the multiple interacting ecological, social, and technological drivers of urban expansion. At the same time, disparities in access to UGS have been found among groups with different socioeconomic statuses (SES, often measured by income, education, and occupation), and this inequity has been investigated in different geographical settings. Access to UGS has been further conceptualized by Rigolon [7] in the light of three aspects—proximity, quantity, and quality—to compare empirical studies in high-income countries (HICs), and the geographical differences between inner-city areas (where UGS are relatively sparse and low-income residents are frequent) and suburbs might also contribute to access inequity. A recent comparative study of 290 Chinese cities revealed ubiquitous differences in UGS exposure between old and newly urbanized areas [8]. Rapidly urbanizing cities have been confronted with the sustainability issue of urban green system development and adding new parks might cause the increase in nearby housing prices and subsequent neighboring gentrification [9,10]. Although this inequity has been quantified and mapped, the underlying mechanisms of UGS access inequity and potential mitigation measures are not fully understood. Economic development and urban afforestation-related policies might exert divergent impacts on UGS distributions [11]. A review of the local contexts moderating UGS access inequality in various cities across different countries and continents may provide critical insights in this field of research.
The past two decades have seen increasing concerns related to UGS access and associated inequity. Empirical studies have been published in journals from various disciplines, including land use, urban planning, sustainable science, public health, and environmental science [12]. Research related to access inequity has focused on the disparity among groups based on income, age, gender, education, family structure, employment, race, and ethnicity. Previous research attempted to identify the critical areas of access inequity in densely populated areas [13] of a city, or the newly developed areas in a city’s rural or suburban areas [14]. Moreover, quantitative models have been developed and applied to reveal unfairness in the provision of UGS facilities, especially the quantity and proximity aspects of accessibility [15]. Another significant concern that accompanies the inequity is its consequences for social interaction and health inequalities [16]. To improve human health and well-being, various forms of UGS in different communities of a city require elaborate design, planning, and management [17,18]. Therefore, in urban areas, the associations between access inequity to UGS and human health inequities at both local and regional scales are important. Furthermore, more epidemiological evidence that combines spatially explicit urban environment data with socioeconomic conditions and individual health data is needed to dissect the individual and societal effects of inequity in the proximity, quantity, and quality of UGS. Mitigating inequity in access to green spaces in urban environments could deliver a triple win, including strengthened social cohesion, improved health outcomes, and sustainable urban ecosystems. Nevertheless, few systematic reviews of empirical studies on this topic have been published, and a synthesis of the findings and remaining gaps in knowledge is lacking.
The main objectives of this study were to reveal the relationship between city-scale and access inequity from global empirical studies, examine the multiple factors that may influence the mitigation of UGS inequity, and provide a systematic map to identify the gaps and clusters in research on inequity in access to UGS. We expect that our effort to collate evidence covering the field’s breadth will stimulate future research on UGS access inequity.

2. Methods

2.1. Literature Search

To conduct a systematic review of the literature on spatial accessibility to UGS in the context of inequity, we searched the databases of the Web of Science focused on empirical studies from 2000 to 2020. We focused on empirical studies using the method of equity mapping, which was developed in the late 1990s [7], and thus, we did not search studies published before 2000. We searched papers in peer-reviewed journals using the following multiple terms: (greenspace * or green space * or open space * or urban park * or park * or playground *) AND (access * or “accessibility” or “spatial distribution” or “provision” or equit * or inequ * or disparit * or “socioeconomic” or “socioeconomic” or “income”). Studies were identified and screened with the following criteria:
(i)
English language and full text available: Only studies published in English and studies with available full-text versions were included. Comments, conference abstracts, book chapters, and reviews were excluded.
(ii)
Empirical research: Studies that demonstrated accessibility using spatial data with a quantitative measure under the scope of proximity, quantity, or quality were included. Purely descriptive studies were excluded.
(iii)
Index of inequity: Studies that performed inequity analysis were required to include a quantitative measure related to socioeconomic or ethnic status.
(iv)
Study objects: Studies that focused on the intra-city inequity pattern were included. Studies that targeted more than one city but performed intra-city quantitative analysis for each city were also included. Multi-city studies that solely assessed inter-city differences were excluded.
The literature search initially identified a total of 563 articles, of which 118 articles were further screened in full text (Figure 1) after the title and abstract screening. In total, 49 studies were included in the review (Table 1).

2.2. Coding Methods to Perform Research Synthesis

To analyze the articles that met the review criteria, we used research feature variables to code the studies for synthesis. The codes were key variables for correspondence analysis (CA), including the type of access to UGS, measures of SES, findings for inequity, the country characteristics of the studied city, the population of the studied city, the spatial and temporal analysis scale, and the intervention analysis (Table 2). These variables were adopted to find critical trends, research gaps, and clusters in access inequity.

2.3. Evolution of Quantitative Models for Estimating UGS Accessibility

Various methods were applied to quantify the accessibility of UGS, and hence, we summarized the changes in those quantitative approaches in the articles analyzed in this study. We mapped the evolution of quantitative models on a time axis. Furthermore, we categorized the studies according to three typical aspects (i.e., quantity, proximity, and quality) of access to UGS [7] and listed the years of publication and the corresponding number of those publications (Supplementary, Figure S1).

2.4. Spatial Distribution of the Studied Cities and Access Inequity

To further illustrate the distribution patterns of studied cities, we analyzed the empirical studies according to their geographical areas. The single analysis unit of a country might not imply the varied spatial distribution patterns of the city under examination; we classified the studied cities by the population scale to which they belong. Accordingly, we checked each paper and recorded the specific city, county, or district that had been its focus on and then mapped the distribution using the vector data from the Database of Global Administrative Areas (GADM) for administrative subdivisions (https://gadm.org/, accessed on 17 February 2021).
The SES of urban residents can be identified from income, education, gender, age, housing price, employment, as well as ethnic/racial factors. Previous studies from HICs tended to emphasize the inequity of UGS accessibility among different ethnic groups (e.g., white or Latino), and most studies from LMICs did not analyze the variations of accessibility from the aspect of ethnic/racial groups. We gathered the advantage or disadvantage patterns from the 49 included articles and checked the inequity pattern of access to UGS.

2.5. Visualizing the Synthesis Analysis with Correspondence Analysis

Systematic mapping has been accepted as an effective method to describe and identify the characteristics of evidence synthesis. Given that the objectives of the review were not to answer a specific question about access inequity occurrence, but to present a broad synthesis of the access inequity research field to identify future study priorities, we did not choose meta-analysis but adopted CA as a combination of quantitative and qualitative measurement [65]. CA could facilitate the visualization of multiple features from reviewed studies in one figure through a display of a few dimensions. This method has been widely used in social sciences [66] and is now increasingly adopted in urban ecology [67,68], using novel data visualization methods to translate the evidence into a vital message for policymakers [69,70].
In this study, we characterized the individual empirical study using the nominal variables in Table 2 to link studies together and generated frequencies and two-way contingency tables. Mathematically, CA provides the spatial representation of similarity, similar to the principal component analysis, based on the chi-squared distance. Accordingly, we used CA to study the similarities between those empirical studies and examined whether some of those categories were closely related to each other. CA could visually display the rows and columns of the two-way contingency tables and describe the relationships between the categories of each variable. The CA biplots for the distribution pattern of variables could be used as an objective and effective method to demonstrate their interdependence. Specifically, a higher proximity of categories indicates a higher correspondence, and the same domain of the categories’ location according to the axes means a positive clustering, which could elucidate the key trends of the research field. To conduct CA, in this study, we used the R package ‘FactoMineR’ [71] to create the CA plots [6].

3. Results

3.1. The Global Distribution Patterns of City-Scale and Access Inequity

Table 3 presents the spatial distribution of the studied cities. We found very few studies in large areas of LMICs (e.g., Africa, South America, South Asia, Southeast Asia, eastern Europe, and Russia). Specifically, the majority of cities in these studies are on the scale of more than a population of 1,000,000 people, such as Munich, New York City, Sydney, and Beijing. It is noteworthy that studies in LMICs, especially China, predominantly emphasized large cities with a population of more than 5,000,000 people (blue circles). Comparatively, the distribution of studied cities in Europe and North America covered a broader range of city-scale.
Table 4 shows the access inequity of each studied city, and we found a global inequity in access to UGS. The number of cities where the high-SES groups were advantaged was substantially larger than that of cities showing better accessibility for the low-SES groups. However, we found that the proportion of cities demonstrating inequity in LMICs (84.2%) is slightly smaller than that in HICs (78.8%). Specifically, previous studies did not find significant inequity in accessibility to UGS for Tehran [23], Sheffield [24], Barcelona [29], Seattle [31] and Phoenix [43], Catania [41], and Beijing [57]. Those cities are distributed in three continents of Asia, Europe, and North America. By contrast, studies carried out for Sydney [22], New York City [59], and Shanghai [14] obtained the opposite conclusions and found the advantageous status of low-SES groups in terms of accessibility to UGS.
Those three cities are distributed in Asia, North America, and Oceania. There has been more than one study carried out on New York City, and the conclusion of inequity or equity is not absolute due to the research approach and data availability. Equitably distributed across different social groups might be the ideal goal of policymakers and practitioners. Xiao et al. [14] used the spatial clustering method to assess the social equity of accessibility to urban parks and found that two typical vulnerable groups (i.e., laid-off workers and rural migrants) are more favored over more affluent residents in Shanghai. They pointed out that this phenomenon might be attributed to the local municipal endeavors in ensuring the socially equitable access to parks, and it is noteworthy that the authors emphasized the critical influence of the planning legacy of China’s socialist era. The study by Astell-Burt et al. [22] adopted the negative binomial and logit regression model to examine the inequitable distribution through a cross-city comparison and found the varied magnitude between cities and the intra regions within a city. They inferred that because of urban sprawl, those suburbs distant from business centers could have cheaper land and more green space.

3.2. Interventions for Access Inequity Mitigation

Figure 2 shows the major factors of SES in those 49 empirical articles on access inequity. The income and age traits of the residents might be the most important aspects to consider when mitigating the inequity in access to UGS. Meanwhile, a few studies focused on gender, employment, or/and family structure traits. While a local, targeted urban greening policy might result in the inequity pattern of access to parks, it can also act as an effective amelioration measure to address this issue [72,73]. However, across the reviewed papers, we found that analyses of mitigating interventions are sparse, and inadequate attention has been paid to the implementation phase and to evaluating the effects of specific local policies, planning, or practical initiatives to improve accessibility and mitigate inequity. Table 5 lists the interventions described in the reviewed articles. Research on large cities in the USA (i.e., Atlanta and Boston), and China (i.e., Beijing, Hangzhou, Nanjing, and Shanghai), place their policy influence analysis in their discussion sections. Scholars focused on initiatives related to local social structures (e.g., Singapore), long-term urban master plans, or current investment in parks. The policies from two empirical studies in the US [15,28] focused on redeveloping urban parks and paid attention to the parks’ quality features (e.g., safety). Nevertheless, mitigation policies in the empirical studies in China shown in Table 5 mainly referred to the improvement of park areas and the walking time or distance to UGS, emphasizing the quantity and proximity aspects of accessibility. Notably, for Singapore, a typical multicultural city, social harmony might be the theme of urban green space planning and inequity mitigation interventions.

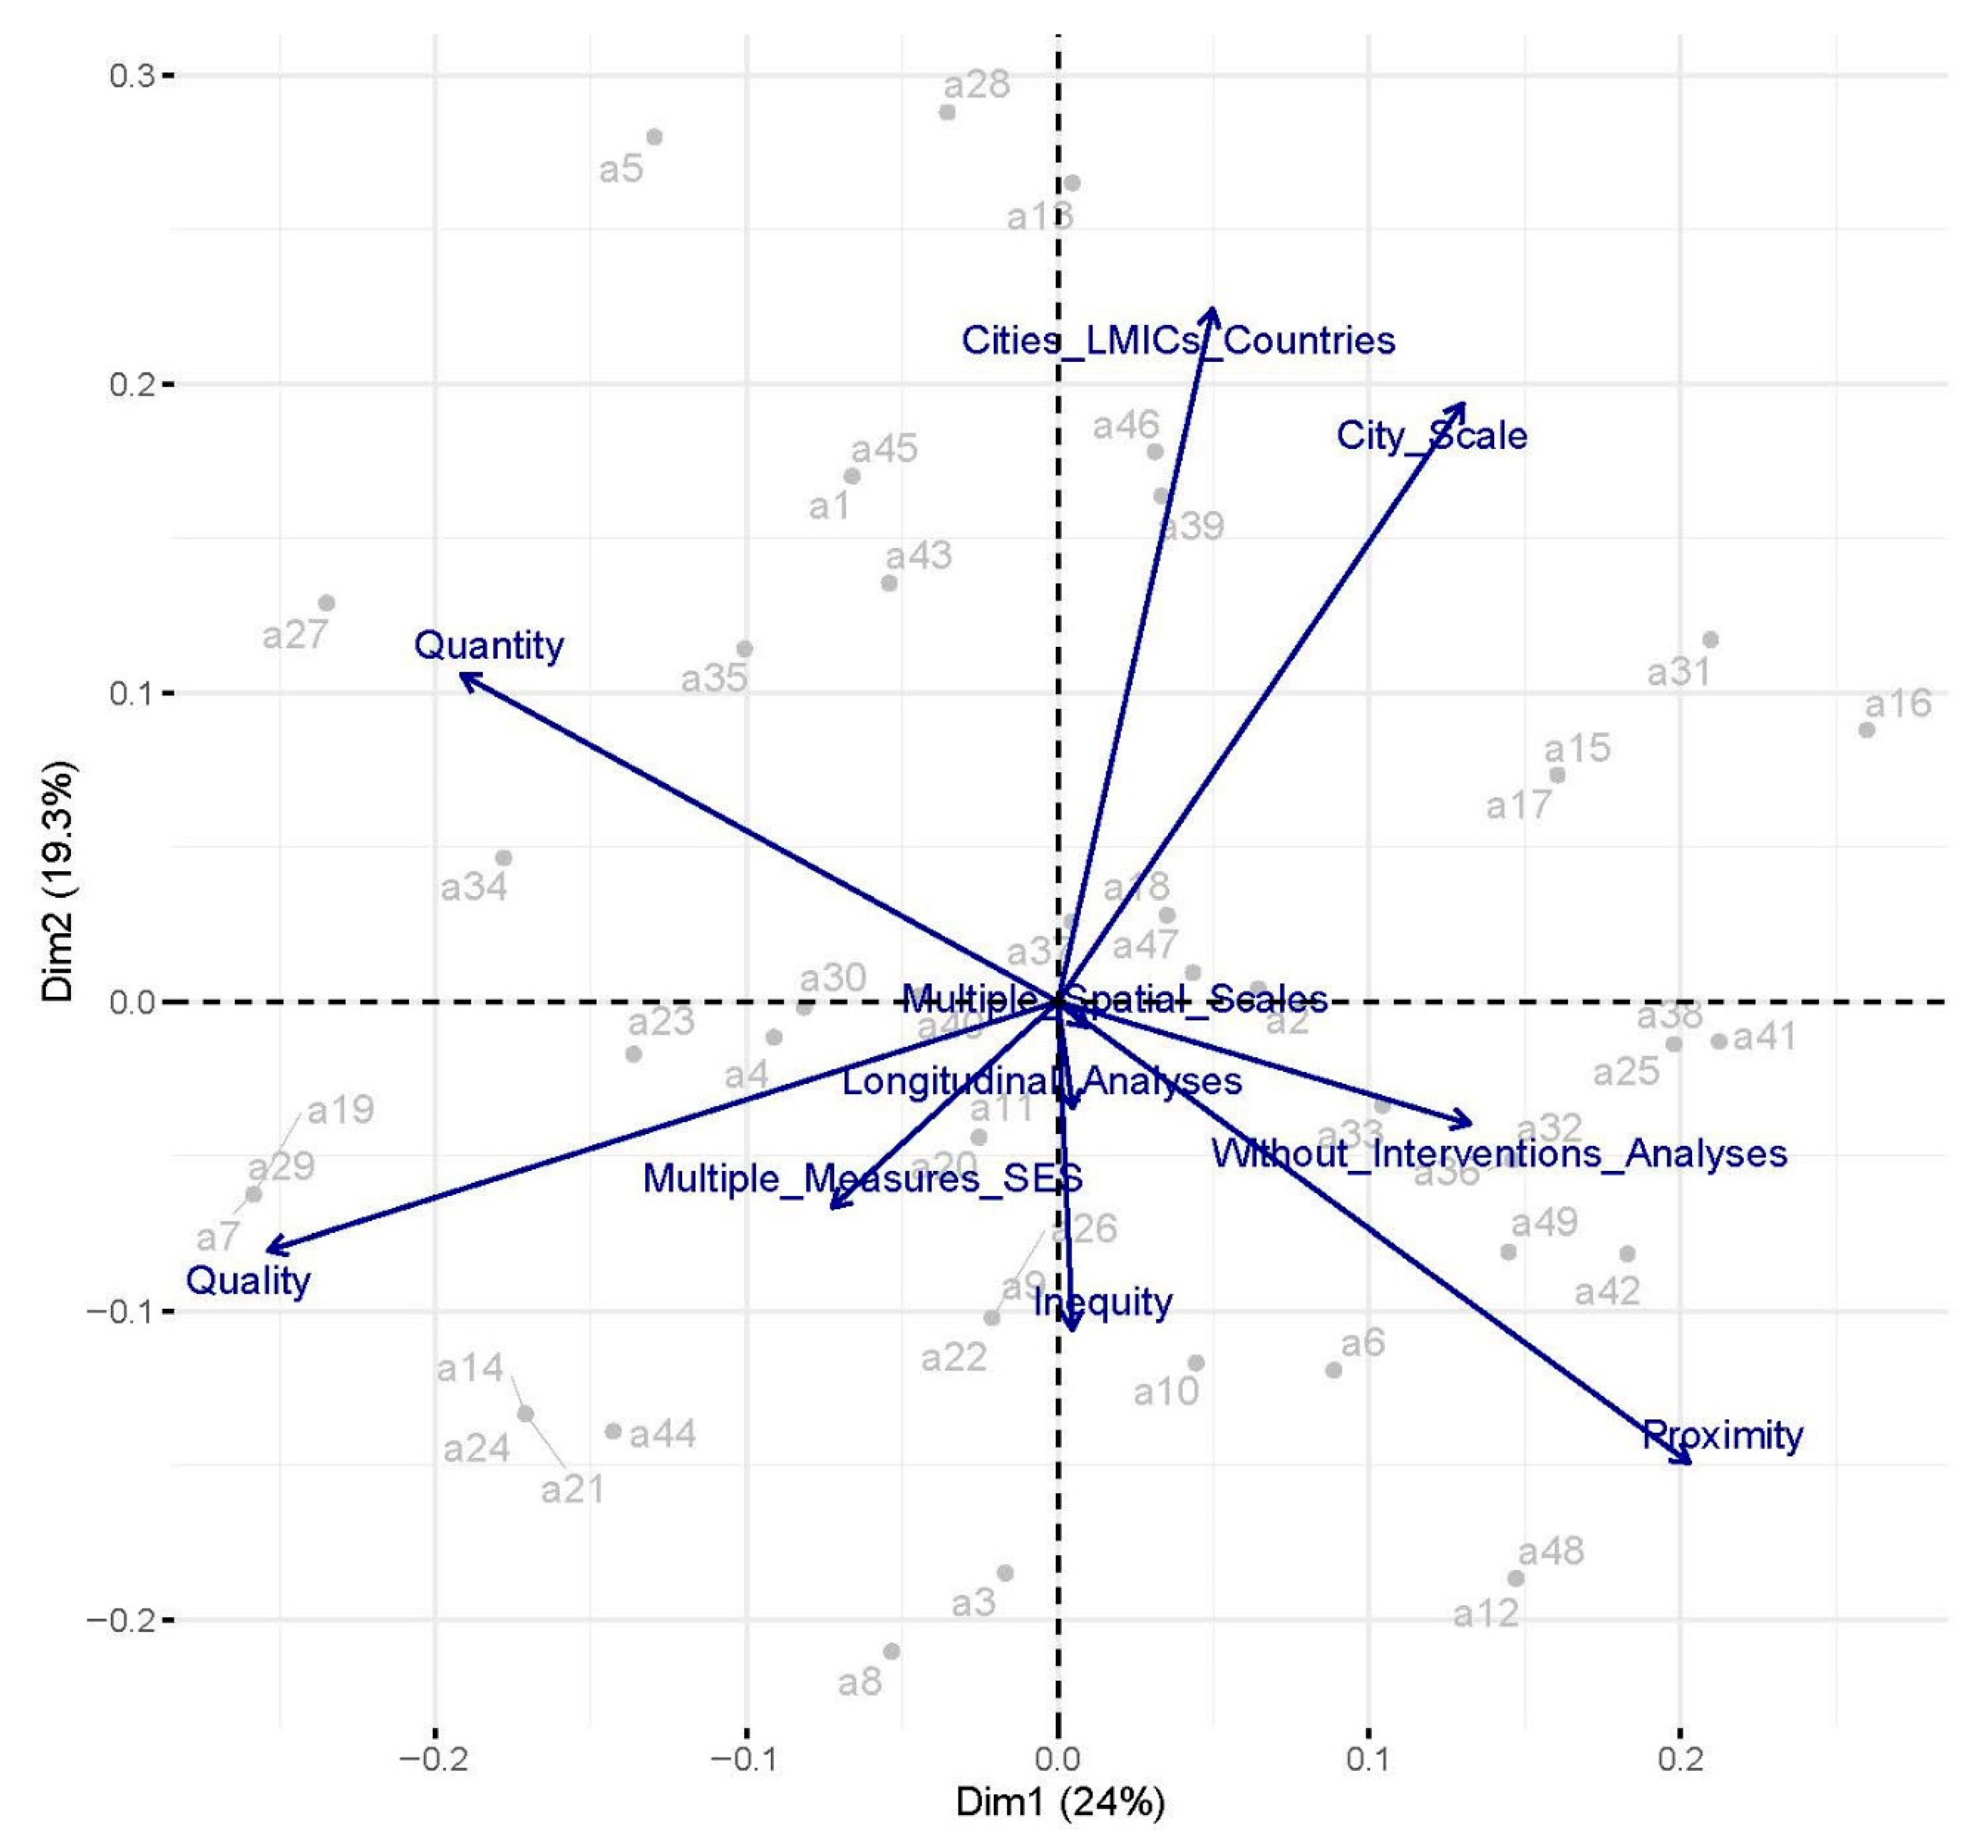
3.3. Systematic Map of the Features of Access Inequity Research

To find critical trends, knowledge gaps, and clusters in access inequity research, we used key variables (Table 2) for CA to code the reviewed studies to produce a systematic map. The correspondence biplot (Figure 3) shows the diversity of approaches applied in access inequity research (blue text). The distance between any points or text gives a measure of their similarity. The plot displays the first two dimensions, which together explained 43.3% of the total variability (Table S1) in study features.
There is a small angle between the lines of the feature “proximity” and a lack of intervention analyses, as well as a small angle between studies measuring “quality” and adopting multiple measures of SES in the negative quadrant (Table S2). UGS “proximity” is the primary measure of accessibility (59% of the final studies for synthesis), and studies that analyzed access inequity under the scope of “quality” contributed the smallest proportion (Table S3). A total of 39 articles used multiple measures, and the proportion of adopting multiple measures of SES for “proximity”, “quality”, and “quantity” is 76.7%, 87.5%, and 85.2%, respectively (Table S4). The variable “proximity” displays the highest proportion (23.3%) for the research approach of using a single SES index. The proximity indicator weights the user’s specified distance to measure the possibility of reaching an urban park, and the advance in access inequity research since 2000 has been accompanied by the increasing availability of spatial data and enhanced geographical information system (GIS) features, particularly the ArcGIS Network Analyst. The classic article of Dai (2011) [15] in the journal of Landscape and Urban Planning reported significantly poorer access to green spaces for neighborhoods with a higher proportion of African Americans in Atlanta. The author introduced a Gaussian-based two-step floating catchment (2SFCA) to assess the proximity, aiming to identify the key areas for intervention to address disparities. From the reviewed studies, the frequency of studies for “proximity” peaked in 2017 and kept being the dominant measure thereafter (Figure S1).
The variables “Without_Interventions_analyses” and “proximity” show similar trajectories in the CA biplot. There is either a weak or no correlation between “proximity” and “quantity” or “quality”. UGS “quality” accounts for the least proportion in those studies that lack intervention analyses (Table S5). Both the proximity and quantity metrics ignore the inner characteristics of urban parks, and likely, that UGS quality is among the attributes that continually attracts nearby residents to visit those parks. A comparative study in a large US metropolitan area found significant differences in quality (i.e., location, care and maintenance, and entertainment value) between groups with different household income characteristics [38]. The influence of park quality on park usage might vary by gender, and the groups of active or female users could be significantly affected [40]. However, both of the above-mentioned empirical studies did not move forward to corresponding inequity-mitigating initiatives analysis.
There is a strong correlation between the studies in LMICs and studies in city sizes of more than 1,000,000 in the positive quadrant. Studies showing significant inequity of access were less distributed (32%) in LMICs (Table S6). However, the large angle between the lines of the feature “inequity” and cities in developing countries and the long distance between the two features indicate weak or no correlation. Although studies in LMICs have focused on large cities and found prevalent inequity, there has been a global inequity pattern despite the scenarios of LMICs or HICs.
The variables of “Multiple_Spatial_Scales” and “Longitudinal_Analyses” showed a high level of similarity. Among the 49 reviewed articles for CA, only several articles were found to analyze the temporal dynamics of access inequity or analyzed inequity at different spatial scales (Tables S7 and S8). Wei [58] conducted a longitudinal study of Hangzhou, a megacity in China, and revealed the overall increase in park accessibility (i.e., proximity) from 2000 to 2010. This multi-temporal research was based on data acquisition from a variety of sources (i.e., statistical yearbooks, local government planning, and satellite images), but Wei found that neither access nor changes in access are significantly associated with the selected socioeconomic variables. Tan and Samsudin [55] explored the scale effects by comparing the park provisions and spatial equity from three different planning units (i.e., region, planning area, and subzones). They observed the pattern of stronger inequity with smaller scales in Singapore. To demonstrate the inequity variations, longitudinal and multi-spatial-scale research should address the challenge of overcoming socioeconomic and UGS distribution data availability and the selection of fitted statistical analysis models to reveal the mechanism of inequity dynamics.

4. Discussion

The global distribution map shows that studies have been concentrated in cities (blue circles) with more than 1,000,000 people, and large cities are predominantly affected by the inequity in access to UGS in LMICs. General interest in large cities might result from the fact that more data were available for large cities than for small cities in LMICs, as national governments tend to emphasize the sustainable development of capital cities and give priority to the budget for the census survey [74]. Population statistics data have been typically adopted to calculate accessibility when quantitative models (e.g., the 2SFCA were applied. The 2SFCA model was first proposed by Radke and Mu [75] to study spatial accessibility based on resource supplies and population demands. However, the administrative geographic units for the demographic data varied in many cases, and the spatialization method of population data to reduce the spatial mismatch between the urban park provision and population distribution pattern has not been investigated effectively. Recently, prognosis areas (sub-district level) in Berlin [13], US Census data by block group boundaries in Boston [28], and neighborhoods in Denver [76] were chosen as units from which demographic information was extracted. These studies assumed that the population is evenly distributed within the statistical unit, and therefore, they ignored the exceptionally high heterogeneity of population distribution in urban environments. The lack of spatialized population data of high resolution has been a limitation to improving inequity evaluation accuracy [77]. Tan et al. [54] used land cover type and demographic data to build a geographically weighted regression (GWR) model and generated the population grid map of 150 m resolution. They used the fine-scale population in their network analysis to obtain precise coverage data of different levels of accessibility. The input data of small-scale units for accessibility models can help diagnose the critical areas of spatial disparities to guide urban planning. Indeed, fine-scale building data could be incorporated into models for the grid map of demographic data [78], but those auxiliary data are often difficult to obtain.
The willingness of residents in large cities to visit urban forests might be influenced by the quality, due to various demands for recreation and relaxation [79]. The previous quantitative supply–demand models (e.g., the 2SFCA model), assuming that people are willing to visit nearby parks, might not work well if those parks are not aesthetically pleasing. Existing reviews have presented evidence suggesting that inequities of park quantity and quality exist in HICs and LMICs and that LMICs experienced a more consistent pattern of quality inequity than proximity and quantity [7,12]. Despite the recognized attraction of high park quality, present studies, in terms of urban park supply, have primarily focused on the presence/absence issues of urban parks rather than the intra-park characteristics. One of the most important reasons for this gap mentioned above is that researchers in this field may commonly rely on vector data (i.e., planning data for road and park boundaries). Admittedly, planning data could meet the research needs, to some extent, to demonstrate the inequality pattern of park coverage and proximity to urban residents. However, not enough is known about park quality, including vertical forest structure, vegetation type, landscape fragmentation, diversity, and complexity, all of which might influence the various ecosystem functions and services and could be effectively assessed using multi-source data [80,81]). The increasing availability of high-resolution, remote sensing data (e.g., images from QuickBird, Worldview, and SPOT satellites) and the LiDAR cloud data will allow for the spatially explicit evaluation of inequity concerning park quality. Future studies need to consider the increasing demand of urban residents to enjoy high-quality parks and explore the access inequity of parks at different quality levels in more detail. Future quantitative analyses should also focus on quantifying park-quality-related variables, such as forest structure, landscape diversity, and landscape fragmentation. More attention should be given to the integrated approach to strengthen the understanding of the driving mechanisms for park access inequity.
Of the existing access inequity studies, the majority are single-phase studies; hence, they lack a longitudinal analysis. A temporal comparative study can identify causal relationships between access inequity and its driving factors (e.g., socioeconomic, policy, or urban planning factors) and accordingly facilitate UGS planning optimization. The historical trajectories of infrastructure construction during the rapid urbanization process have shaped the spatial patterns of park access. Therefore, accessibility could be treated as a process with multiple dimensions rather than as an established state or outcome. The pioneering investigation of park access dynamics took place in Hangzhou, China [58]. This study demonstrated the predominant role of park investment on individual sub-districts to improve overall accessibility, but the research in Hangzhou did not show significant differences among socioeconomic groups in terms of park access variations. Barriers to the development of the study of the dynamics of access inequity are mainly due to the availability of multi-temporal park distribution data and place-based socioeconomic data [6]. In the future, multidisciplinary cooperation with training and skills presents an opportunity to make full use of multi-source data, detect the reasons that may cause inequity, and to help evaluate current policies efficiency through dynamic analyses. City planners and policymakers should focus on those areas and groups of people experiencing decreasing accessibility and those priority zones that have already benefited from effectively implemented initiatives to ameliorate access inequity. We found very few studies in large areas of LMICs and the possible reasons that most of the empirical studies on UGS equity are located in western Europe, China, Australia, and the US might be local urbanization processes and the high demand of UGS for public health [58,60]. Since the US and China have been the major contributors to the publications in this field and have accumulated spatially explicit studies for individual cities, one of the pressing research areas is the comparison of park accessibility and the changes in accessibility among socioeconomic groups. Furthermore, the urban land structure could significantly influence the provision of UGS [82]. Thus, taking the different spatiotemporal patterns of urbanization in China and the US into account might enrich the research on spatial and temporal access inequity to UGS.
Advances in research on UGS access inequity have profoundly enhanced our understanding of the effects of the provision of UGS on social inequity. However, research on the contribution of interventions to improve access inequity remains a nascent field with substantial knowledge deficits. Hunter et al. [83] identified 6997 articles when reviewing the equity effect of urban green space interventions (only 38 articles were finally included) and found that there was too little evidence to draw firm conclusions. Both the political and scientific communities have acknowledged the importance of UGS, and it is the practical intervention strategies that could tackle the inequity issue in local urban contexts. Furthermore, to avoid exacerbated inequity, local governments must propose new initiatives, especially projects that would benefit regions with deficit residents. Cost-effective ways of green infrastructure network optimization, such as nature-based solutions, should be adopted to increase access to green spaces [84]. However, some cities may not prioritize urban planning in the creation of UGS and might prioritize industrial development and economic growth. The access equity issue may also be compromised by real-estate investment. Therefore, the governance, planning, and maintenance measures regarding the construction and redevelopment of UGS should not be detached from the urbanization traits. In particular, the temporal and spatial patterns of urban land expansion and urban population growth could help us to understand the formation mechanism of access inequity. Local interventions should be proposed based on public surveys and in situ research to guarantee the effectiveness of specific measures [85]. UGS access is not a single-dimension issue of green infrastructure, and therefore, the corresponding adjustment of a city’s non-biotic or gray structures, especially the transport system, should be appropriately incorporated into the UGS planning system [60]. Sound UGS inequity mitigation policies, sensitive to the demographic distribution of income, age, ethnicity, or other social vulnerabilities, are much needed to effectively narrow the inequity gap. In the future, a combination of quantitative and qualitative methods might be essential to evaluate the effectiveness of policies and help policymakers find the pathways through which the inequity-intensifying impacts emerge. Scholarly local studies focusing on a given policy from a specific disciplinary view, and interdisciplinary considerations by the architectural, engineering, and construction professions are needed to enrich the research and develop new practical guidelines for urban green space planning. More studies are needed to uncover the access inequity issues for cities of LMICs with high populations concentrated in their urban areas.

5. Conclusions

We reported a systematic mapping of access inequity research based on a sample of 49 empirical studies screened from 563 selected papers. Although the scale of cities with UGS access inequity varies between countries, large cities (more than 1,000,000 population), especially in LMICs, are particularly affected. Disparities of UGS were found among different SES groups, and access inequity was investigated in different geographical settings. Across the reviewed papers, analyses on mitigating interventions are sparse. Using CA methodology, we found the critical trends, knowledge gaps, and clusters of this research field and underscored the incorporation of the UGS access inequity factor into urban planning and management to avoid exacerbated pressures on the sustainable development of cities. We provided the explanatory framework for the interaction between access inequity and local mitigating measures and have called for interdisciplinary cooperation by architectural, engineering, and construction professionals to reduce access inequity to UGS. In future research, it will be necessary to conduct comparative studies in various cities across different countries or continents for a comprehensive understanding of the factors that may influence the mitigation of this inequity.

Supplementary Materials

The following are available online at https://www.mdpi.com/article/10.3390/su14031062/s1. Figure S1: The time axis of quantitative models adopted for accessibility study and the number (in color) of publications for three typical aspects of access (quantity, proximity, and quality), Table S1: The inertia and contribution of individual dimensions, Table S2: The statistics of variables for the correspondence analysis in Figure 3, Table S3: Number of observational studies per different measure of access to urban green space, Table S4: Number of observational studies per different measure of SES, Table S5: Number of observational studies that included intervention analysis per different measure of exposure to urban green space, Table S6: Number of observational studies for each category of country level per different measure of urban green space access, Table S7: Number of observational studies for each category of temporal scale assessment per different measure of exposure to urban green space, Table S8: Number of observational studies for each category of spatial scale assessment per different measure of exposure to urban green space.

Author Contributions

Conceptualization, Y.S.; methodology, Y.S. and C.X.; validation, Y.S. and C.X.; formal analysis, Y.S.; investigation, Y.S. and X.K.; data curation, Y.S.; writing—original draft preparation, Y.S., S.S. and H.T.; writing—review and editing, Y.S., S.S., H.T. and C.X. All authors have read and agreed to the published version of the manuscript.

Funding

This study was supported by the National Natural Science Foundation of China (41801058) and the Fundamental Research Funds for the Central Universities (BLX201906). Somidh Saha thanks the German Aerospace Center (Das Deutsche Zentrum für Luft-und Raumfahrt e.V.) and The Federal Ministry of Education and Research of Germany (Das Bundesministerium für Bildung und Forschung—BMBF) for providing him a financial support (GrüneLunge project–funding reference number 01LR1726A, https://www.projekt-gruenelunge.de/ accessed on 25 November 2021).

Institutional Review Board Statement

Not applicable.

Informed Consent Statement

Not applicable.

Data Availability Statement

The data presented in this study are available from the corresponding author upon reasonable request.

Acknowledgments

We would like to thank anonymous reviewers for their constructive comments.

Conflicts of Interest

The authors declare no conflict of interest.

References

  1. United Nations. World Urbanization Prospects: The 2014 Revision; United Nations Department of Economics and Social Affairs, Population Division: New York, NY, USA, 2015. [Google Scholar]
  2. Demuzere, M.; Orru, K.; Heidrich, O.; Olazabal, E.; Geneletti, D.; Orru, H.; Bhave, A.G.; Mittal, N.; Feliu, E.; Faehnle, M. Mitigating and adapting to climate change: Multi-functional and multi-scale assessment of green urban infrastructure. J. Environ. Manag. 2014, 146, 107–115. [Google Scholar] [CrossRef] [PubMed]
  3. Panno, A.; Carrus, G.; Lafortezza, R.; Mariani, L.; Sanesi, G. Nature-based solutions to promote human resilience and wellbeing in cities during increasingly hot summers. Environ. Res. 2017, 159, 249–256. [Google Scholar] [CrossRef]
  4. Meerow, S.; Newell, J.P. Spatial planning for multifunctional green infrastructure: Growing resilience in Detroit. Landsc. Urban Plan. 2017, 159, 62–75. [Google Scholar] [CrossRef]
  5. Tost, H.; Reichert, M.; Braun, U.; Reinhard, I.; Peters, R.; Lautenbach, S.; Hoell, A.; Schwarz, E.; Ebner-Priemer, U.; Zipf, A.; et al. Neural correlates of individual differences in affective benefit of real-life urban green space exposure. Nat. Neurosci. 2019, 22, 1389–1393. [Google Scholar] [CrossRef] [PubMed]
  6. Collins, R.M.; Spake, R.; Brown, K.A.; Ogutu, B.O.; Smith, D.; Eigenbrod, F. A systematic map of research exploring the effect of greenspace on mental health. Landsc. Urban Plan. 2020, 201, 103823. [Google Scholar] [CrossRef]
  7. Rigolon, A. A complex landscape of inequity in access to urban parks: A literature review. Landsc. Urban Plan. 2016, 153, 160–169. [Google Scholar] [CrossRef]
  8. Song, Y.; Chen, B.; Kwan, M.-P. How does urban expansion impact people’s exposure to green environments? A comparative study of 290 Chinese cities. J. Clean. Prod. 2020, 246, 119018. [Google Scholar] [CrossRef]
  9. Kong, X.; Sun, Y.; Xu, C. Effects of Urbanization on the Dynamics and Equity of Access to Urban Parks from 2000 to 2015 in Beijing, China. Forests 2021, 12, 1796. [Google Scholar] [CrossRef]
  10. Wu, L.; Rowe, P.G. Green space progress or paradox: Identifying green space associated gentrification in Beijing. Landsc. Urban Plan. 2022, 219, 104321. [Google Scholar] [CrossRef]
  11. Wu, L.; Kim, S.K. Does socioeconomic development lead to more equal distribution of green space? Evidence from Chinese cities. Sci. Total Environ. 2021, 757, 143780. [Google Scholar] [CrossRef]
  12. Rigolon, A.; Browning, M.; Jennings, V. Inequities in the quality of urban park systems: An environmental justice investigation of cities in the United States. Landsc. Urban Plan. 2018, 178, 156–169. [Google Scholar] [CrossRef]
  13. Kabisch, N.; Haase, D. Green justice or just green? Provision of urban green spaces in Berlin, Germany. Landsc. Urban Plan. 2014, 122, 129–139. [Google Scholar] [CrossRef]
  14. Xiao, Y.; Wang, Z.; Li, Z.G.; Tang, Z.L. An assessment of urban park access in Shanghai—Implications for the social equity in urban China. Landsc. Urban Plan. 2017, 157, 383–393. [Google Scholar] [CrossRef]
  15. Dai, D. Racial/ethnic and socioeconomic disparities in urban green space accessibility: Where to intervene? Landsc. Urban Plan. 2011, 102, 234–244. [Google Scholar] [CrossRef]
  16. Mitchell, R.; Popham, F. Effect of exposure to natural environment on health inequalities: An observational population study. Lancet 2008, 372, 1655–1660. [Google Scholar] [CrossRef] [Green Version]
  17. McCormack, G.R.; Rock, M.; Toohey, A.M.; Hignell, D. Characteristics of urban parks associated with park use and physical activity: A review of qualitative research. Health Place 2010, 16, 712–726. [Google Scholar] [CrossRef]
  18. Schipperijn, J.; Bentsen, P.; Troelsen, J.; Toftager, M.; Stigsdotter, U.K. Associations between physical activity and characteristics of urban green space. Urban For. Urban Green. 2013, 12, 109–116. [Google Scholar] [CrossRef]
  19. Abercrombie, L.C.; Sallis, J.F.; Conway, T.L.; Frank, L.D.; Saelens, B.E.; Chapman, J.E. Income and racial disparities in access to public parks and private recreation facilities. Am. J. Pre. Med. 2008, 34, 9–15. [Google Scholar] [CrossRef]
  20. Almohamad, H.; Knaack, A.L.; Habib, B.M. Assessing Spatial Equity and Accessibility of Public Green Spaces in Aleppo City, Syria. Forests 2018, 9, 706. [Google Scholar] [CrossRef] [Green Version]
  21. Arroyo-Johnson, C.; Woodward, K.; Milam, L.; Ackermann, N.; Komaie, G.; Goodman, M.S.; Hipp, J.A. Still Separate, Still Unequal: Social Determinants of Playground Safety and Proximity Disparities in St. Louis. J. Urban Health 2016, 93, 627–638. [Google Scholar] [CrossRef] [PubMed] [Green Version]
  22. Astell-Burt, T.; Feng, X.Q.; Mavoa, S.; Badland, H.M.; Giles-Corti, B. Do low-income neighbourhoods have the least green space? A cross-sectional study of Australia’s most populous cities. BMC Public Health 2014, 14, 292. [Google Scholar] [CrossRef] [PubMed]
  23. Bahrini, F.; Bell, S.; Mokhtarzadeh, S. The relationship between the distribution and use patterns of parks and their spatial accessibility at the city level: A case study from Tehran, Iran. Urban For. Urban Green. 2017, 27, 332–342. [Google Scholar] [CrossRef] [Green Version]
  24. Barbosa, O.; Tratalos, J.A.; Armsworth, P.R.; Davies, R.G.; Fuller, R.A.; Johnson, P.; Gaston, K.J. Who benefits from access to green space? A case study from Sheffield, UK. Landsc. Urban Plan. 2007, 83, 187–195. [Google Scholar] [CrossRef]
  25. Bruton, C.M.; Floyd, M.F. Disparities in Built and Natural Features of Urban Parks: Comparisons by Neighborhood Level Race/Ethnicity and Income. J. Urban Health 2014, 91, 894–907. [Google Scholar] [CrossRef] [PubMed]
  26. Chen, S.L.; Christensen, K.M.; Li, S.J. A comparison of park access with park need for children: A case study in Cache County, Utah. Landsc. Urban Plan. 2019, 187, 119–128. [Google Scholar] [CrossRef] [Green Version]
  27. Comber, A.; Brunsdon, C.; Green, E. Using a GIS-based network analysis to determine urban greenspace accessibility for different ethnic and religious groups. Landsc. Urban Plan. 2008, 86, 103–114. [Google Scholar] [CrossRef] [Green Version]
  28. Cradock, A.L.; Kawachi, I.; Colditz, G.A.; Hannon, C.; Melly, S.J.; Wiecha, J.L.; Gortmaker, S.L. Playground safety and access in Boston neighborhoods. Am. J. Prev. Med 2005, 28, 357–363. [Google Scholar] [CrossRef] [PubMed]
  29. Dadvand, P.; de Nazelle, A.; Figueras, F.; Basagana, X.; Su, J.; Amoly, E.; Jerrett, M.; Vrijheid, M.; Sunyer, J.; Nieuwenhuijsen, M.J. Green space, health inequality and pregnancy. Environ. Int. 2012, 40, 110–115. [Google Scholar] [CrossRef]
  30. de Mola, U.L.; Ladd, B.; Duarte, S.; Borchard, N.; La Rosa, R.A.; Zutta, B. On the Use of Hedonic Price Indices to Understand Ecosystem Service Provision from Urban Green Space in Five Latin American Megacities. Forests 2017, 8, 478. [Google Scholar] [CrossRef] [Green Version]
  31. Engelberg, J.K.; Conway, T.L.; Geremia, C.; Cain, K.L.; Saelens, B.E.; Glanz, K.; Frank, L.D.; Sallis, J.F. Socioeconomic and race/ethnic disparities in observed park quality. BMC Public Health 2016, 16, 395. [Google Scholar] [CrossRef] [Green Version]
  32. Feng, S.; Chen, L.D.; Sun, R.H.; Feng, Z.Q.; Li, J.R.; Khan, M.S.; Jing, Y.C. The Distribution and Accessibility of Urban Parks in Beijing, China: Implications of Social Equity. Int. J. Environ. Res. Public Health 2019, 16, 4894. [Google Scholar] [CrossRef] [PubMed] [Green Version]
  33. Gu, X.K.; Tao, S.Y.; Dai, B. Spatial accessibility of country parks in Shanghai, China. Urban For. Urban Green. 2017, 27, 373–382. [Google Scholar] [CrossRef]
  34. Guo, S.H.; Song, C.; Pei, T.; Liu, Y.X.; Ma, T.; Du, Y.Y.; Chen, J.; Fan, Z.D.; Tang, X.L.; Peng, Y.; et al. Accessibility to urban parks for elderly residents: Perspectives from mobile phone data. Landsc. Urban Plan. 2019, 191, 103642. [Google Scholar] [CrossRef]
  35. He, S.W.; Wu, Y.L.; Wang, L. Characterizing Horizontal and Vertical Perspectives of Spatial Equity for Various Urban Green Spaces: A Case Study of Wuhan, China. Front. Public Health 2020, 8, 10. [Google Scholar] [CrossRef] [Green Version]
  36. Hoffimann, E.; Barros, H.; Ribeiro, A.I. Socioeconomic Inequalities in Green Space Quality and Accessibility-Evidence from a Southern European City. Int. J. Environ. Res. Public Health 2017, 14, 916. [Google Scholar] [CrossRef]
  37. Iraegui, E.; Augusto, G.; Cabral, P. Assessing Equity in the Accessibility to Urban Green Spaces According to Different Functional Levels. ISPRS Int. Geo-Inf. 2020, 9, 308. [Google Scholar] [CrossRef]
  38. Jenkins, G.R.; Yuen, H.K.; Rose, E.J.; Maher, A.I.; Gregory, K.C.; Cotton, M.E. Disparities in Quality of Park Play Spaces between Two Cities with Diverse Income and Race/Ethnicity Composition: A Pilot Study. Int. J. Environ. Res. Public Health 2015, 12, 8009–8022. [Google Scholar] [CrossRef] [PubMed] [Green Version]
  39. Kamel, A.A.; Ford, P.B.; Kaczynski, A.T. Disparities in park availability, features, and characteristics by social determinants of health within a US-Mexico border urban area. Prev. Med. 2014, 69, S111–S113. [Google Scholar] [CrossRef] [PubMed] [Green Version]
  40. Knapp, M.; Gustat, J.; Darensbourg, R.; Myers, L.; Johnson, C. The Relationships between Park Quality, Park Usage, and Levels of Physical Activity in Low-Income, African American Neighborhoods. Int. J. Environ. Res. Public Health 2019, 16, 85. [Google Scholar] [CrossRef] [PubMed] [Green Version]
  41. La Rosa, D.; Takatori, C.; Shimizu, H.; Privitera, R. A planning framework to evaluate demands and preferences by different social groups for accessibility to urban greenspaces. Sust. Cities Soc. 2018, 36, 346–362. [Google Scholar] [CrossRef]
  42. Lara-Valencia, F.; Garcia-Perez, H. Space for equity: Socioeconomic variations in the provision of public parks in Hermosillo, Mexico. Local Environ. 2015, 20, 350–368. [Google Scholar] [CrossRef]
  43. Lara-Valencia, F.; Garcia-Perez, H. Disparities in the provision of public parks in neighbourhoods with varied Latino composition in the Phoenix Metropolitan Area. Local Environ. 2018, 23, 1107–1120. [Google Scholar] [CrossRef]
  44. Lin, B.; Meyers, J.; Barnett, G. Understanding the potential loss and inequities of green space distribution with urban densification. Urban For. Urban Green. 2015, 14, 952–958. [Google Scholar] [CrossRef]
  45. Manta, S.W.; Reis, R.S.; Benedetti, T.R.B.; Rech, C.R. Public open spaces and physical activity: Disparities of resources in Florianopolis. Rev. Saude Publica 2019, 53, 112. [Google Scholar] [CrossRef] [Green Version]
  46. Nero, B.F. Urban green space dynamics and socio-environmental inequity: Multi-resolution and spatiotemporal data analysis of Kumasi, Ghana. Int. J. Remote Sens. 2017, 38, 6993–7020. [Google Scholar] [CrossRef]
  47. Park, J.H.; Lee, D.K.; Park, C.; Kim, H.G.; Jung, T.Y.; Kim, S. Park Accessibility Impacts Housing Prices in Seoul. Sustainability 2017, 9, 185. [Google Scholar] [CrossRef] [Green Version]
  48. Rahman, K.M.A.; Zhang, D.F. Analyzing the Level of Accessibility of Public Urban Green Spaces to Different Socially Vulnerable Groups of People. Sustainability 2018, 10, 3917. [Google Scholar] [CrossRef] [Green Version]
  49. Reyes, M.; Paez, A.; Morency, C. Walking accessibility to urban parks by children: A case study of Montreal. Landsc. Urban Plan. 2014, 125, 38–47. [Google Scholar] [CrossRef]
  50. Sathyakumar, V.; Ramsankaran, R.; Bardhan, R. Linking remotely sensed Urban Green Space (UGS) distribution patterns and Socio-Economic Status (SES)-A multi-scale probabilistic analysis based in Mumbai, India. Gisci Remote Sens. 2019, 56, 645–669. [Google Scholar] [CrossRef]
  51. Schule, S.A.; Gabriel, K.M.A.; Bolte, G. Relationship between neighbourhood socioeconomic position and neighbourhood public green space availability: An environmental inequality analysis in a large German city applying generalized linear models. Int. J. Hyg. Environ. Health 2017, 220, 711–718. [Google Scholar] [CrossRef]
  52. Shen, Y.A.; Sun, F.; Che, Y.Y. Public green spaces and human wellbeing: Mapping the spatial inequity and mismatching status of public green space in the Central City of Shanghai. Urban For. Urban Green. 2017, 27, 59–68. [Google Scholar] [CrossRef]
  53. Sugiyama, T.; Villanueva, K.; Knuiman, M.; Francis, J.; Foster, S.; Wood, L.; Giles-Corti, B. Can neighborhood green space mitigate health inequalities? A study of socio-economic status and mental health. Health Place 2016, 38, 16–21. [Google Scholar] [CrossRef] [PubMed]
  54. Tan, C.D.; Tang, Y.H.; Wu, X.F. Evaluation of the Equity of Urban Park Green Space Based on Population Data Spatialization: A Case Study of a Central Area of Wuhan, China. Sensors 2019, 19, 2929. [Google Scholar] [CrossRef] [Green Version]
  55. Tan, P.Y.; Samsudin, R. Effects of spatial scale on assessment of spatial equity of urban park provision. Landsc. Urban Plan. 2017, 158, 139–154. [Google Scholar] [CrossRef]
  56. Tian, Y.H.; Jim, C.Y.; Liu, Y.Q. Using a Spatial Interaction Model to Assess the Accessibility of District Parks in Hong Kong. Sustainability 2017, 9, 1924. [Google Scholar] [CrossRef] [Green Version]
  57. Tu, X.Y.; Huang, G.L.; Wu, J.G. Contrary to Common Observations in the West, Urban Park Access Is Only Weakly Related to Neighborhood Socioeconomic Conditions in Beijing, China. Sustainability 2018, 10, 1115. [Google Scholar] [CrossRef] [Green Version]
  58. Wei, F. Greener urbanization? Changing accessibility to parks in China. Landsc. Urban Plan. 2017, 157, 542–552. [Google Scholar] [CrossRef]
  59. Weiss, C.C.; Purciel, M.; Bader, M.; Quinn, J.W.; Lovasi, G.; Neckerman, K.M.; Rundle, A.G. Reconsidering Access: Park Facilities and Neighborhood Disamenities in New York City. J. Urban Health 2011, 88, 297–310. [Google Scholar] [CrossRef] [Green Version]
  60. Wende, H.E.W.; Zarger, R.K.; Mihelcic, J.R. Accessibility and usability: Green space preferences, perceptions, and barriers in a rapidly urbanizing city in Latin America. Landsc. Urban Plan. 2012, 107, 272–282. [Google Scholar] [CrossRef]
  61. Xu, C.; Haase, D.; Pribadi, D.O.; Pauleit, S. Spatial variation of green space equity and its relation with urban dynamics: A case study in the region of Munich. Ecol. Indic. 2018, 93, 512–523. [Google Scholar] [CrossRef]
  62. Yang, J.; Li, C.; Li, Y.C.; Xi, J.H.; Ge, Q.S.; Li, X.M. Urban green space, uneven development and accessibility: A case of Dalian's Xigang District. Chin. Geogr. Sci. 2015, 25, 644–656. [Google Scholar] [CrossRef]
  63. Zhang, J.G.; Cheng, Y.Y.; Wei, W.; Zhao, B. Evaluating Spatial Disparity of Access to Public Parks in Gated and Open Communities with an Improved G2SFCA Model. Sustainability 2019, 11, 5910. [Google Scholar] [CrossRef] [Green Version]
  64. Zhou, X.L.; Kim, J. Social disparities in tree canopy and park accessibility: A case study of six cities in Illinois using GIS and remote sensing. Urban For. Urban Green. 2013, 12, 88–97. [Google Scholar] [CrossRef]
  65. Brown, G.; Brabyn, L. An analysis of the relationships between multiple values and physical landscapes at a regional scale using public participation GIS and landscape character classification. Landsc. Urban Plan. 2012, 107, 317–331. [Google Scholar] [CrossRef]
  66. Dembek, K.; Sivasubramaniam, N.; Chmielewski, D.A. A Systematic Review of the Bottom/Base of the Pyramid Literature: Cumulative Evidence and Future Directions. J. Bus. Ethics 2019, 165, 365–382. [Google Scholar] [CrossRef]
  67. Caula, S.; Marty, P.; Martin, J.-L. Seasonal variation in species composition of an urban bird community in Mediterranean France. Landsc. Urban Plan. 2008, 87, 1–9. [Google Scholar] [CrossRef]
  68. Zabret, K.; Šraj, M. Evaluating the Influence of Rain Event Characteristics on Rainfall Interception by Urban Trees Using Multiple Correspondence Analysis. Water 2019, 11, 2659. [Google Scholar] [CrossRef] [Green Version]
  69. Greenacre, M. Correspondence analysis of raw data. Ecology 2010, 91, 958–963. [Google Scholar] [CrossRef] [Green Version]
  70. James, K.L.; Randall, N.P.; Haddaway, N.R. A methodology for systematic mapping in environmental sciences. Environ. Evid. 2016, 5, 7. [Google Scholar] [CrossRef] [Green Version]
  71. Lê, S.; Josse, J.; Husson, F. FactoMineR: An R package for multivariate analysis. J. Stat. Softw. 2008, 25, 1–18. [Google Scholar] [CrossRef] [Green Version]
  72. Ibes, D.C. A multi-dimensional classification and equity analysis of an urban park system: A novel methodology and case study application. Landsc. Urban Plan. 2015, 137, 122–137. [Google Scholar] [CrossRef]
  73. Xing, L.; Liu, Y.; Liu, X.; Wei, X.; Mao, Y. Spatio-temporal disparity between demand and supply of park green space service in urban area of Wuhan from 2000 to 2014. Habitat Int. 2018, 71, 49–59. [Google Scholar] [CrossRef]
  74. Martinez-Vazquez, J.; Qiao, B.; Zhang, L. The role of provincial policies in fiscal equalization outcomes in China. China Rev. 2008, 8, 135–167. [Google Scholar]
  75. Radke, J.; Mu, L. Spatial Decompositions, Modeling and Mapping Service Regions to Predict Access to Social Programs. Geogr. Inf. Sci. 2000, 6, 105–112. [Google Scholar] [CrossRef]
  76. Rigolon, A.; Flohr, T. Access to Parks for Youth as an Environmental Justice Issue: Access Inequalities and Possible Solutions. Buildings 2014, 4, 69–94. [Google Scholar] [CrossRef]
  77. Lee, G.; Hong, I. Measuring spatial accessibility in the context of spatial disparity between demand and supply of urban park service. Landsc. Urban Plan. 2013, 119, 85–90. [Google Scholar] [CrossRef]
  78. Li, L.; Li, J.; Jiang, Z.; Zhao, L.; Zhao, P. Methods of Population Spatialization Based on the Classification Information of Buildings from China’s First National Geoinformation Survey in Urban Area: A Case Study of Wuchang District, Wuhan City, China. Sensors 2018, 18, 2558. [Google Scholar] [CrossRef] [PubMed] [Green Version]
  79. Jim, C.Y.; Chen, W.Y. Recreation–amenity use and contingent valuation of urban greenspaces in Guangzhou, China. Landsc. Urban Plan. 2006, 75, 81–96. [Google Scholar] [CrossRef]
  80. Raciti, S.M.; Hutyra, L.R.; Newell, J.D. Mapping carbon storage in urban trees with multi-source remote sensing data: Relationships between biomass, land use, and demographics in Boston neighborhoods. Sci. Total Environ. 2014, 500–501, 72–83. [Google Scholar] [CrossRef]
  81. Mitchell, M.G.E.; Johansen, K.; Maron, M.; McAlpine, C.A.; Wu, D.; Rhodes, J.R. Identification of fine scale and landscape scale drivers of urban aboveground carbon stocks using high-resolution modeling and mapping. Sci. Total Environ. 2018, 622–623, 57–70. [Google Scholar] [CrossRef]
  82. Boulton, C.; Dedekorkut-Howes, A.; Byrne, J. Factors shaping urban greenspace provision: A systematic review of the literature. Landsc. Urban Plan. 2018, 178, 82–101. [Google Scholar] [CrossRef]
  83. Hunter, R.F.; Cleland, C.; Cleary, A.; Droomers, M.; Wheeler, B.W.; Sinnett, D.; Nieuwenhuijsen, M.J.; Braubach, M. Environmental, health, wellbeing, social and equity effects of urban green space interventions: A meta-narrative evidence synthesis. Environ. Int. 2019, 130, 104923. [Google Scholar] [CrossRef] [PubMed]
  84. Faivre, N.; Fritz, M.; Freitas, T.; de Boissezon, B.; Vandewoestijne, S. Nature-Based Solutions in the EU: Innovating with nature to address social, economic and environmental challenges. Environ. Res. 2017, 159, 509–518. [Google Scholar] [CrossRef] [PubMed]
  85. Stessens, P.; Canters, F.; Huysmans, M.; Khan, A.Z. Urban green space qualities: An integrated approach towards GIS-based assessment reflecting user perception. Land Use Policy 2020, 91, 104319. [Google Scholar] [CrossRef]
Figure 1. The conceptual diagram for the literature search process.
Sustainability 14 01062 g001
Figure 2. The major socioeconomic factors that influence access inequity.
Sustainability 14 01062 g002
Figure 3. Biplot of the correspondence analysis with the 49 included studies. The studies are in gray points and characteristics (from Table 2) are in blue text. This symmetric plot shows the distribution pattern within the data. The percentage of explained variances of the first two dimensions are shown in the axes’ labels. The distance between any points or text gives a measure of their similarity. Long lines of the text or points to the origin indicate a strong association. Small angles between two lines of text that point to the origin indicate associations. Lines with angles near 180 degrees present negative associations.
Sustainability 14 01062 g003
Table 1. Articles selected for systematic mapping.
Author(s) and Date
Abercrombie et al. [19]Almohamad et al. [20]Arroyo-Johnson et al. [21]
Astell-Burt et al. [22]Bahrini et al. [23]Barbosa et al. [24]
Bruton et al. [25]Chen et al. [26]Comber et al. [27]
Cradock et al. [28]Dadvand et al. [29]Dai [15]
de Mola et al. [30]Engelberg et al. [31]Feng et al. [32]
Gu et al. [33]Guo et al. [34]He et al. [35]
Hoffimann et al. [36]Iraegui et al. [37]Jenkins et al. [38]
Kabisch & Haase [13]Kamel et al. [39]Knapp et al. [40]
La Rosa et al. [41]Lara-Valencia & Garcia-Perez [42]Lara-Valencia & Garcia-Perez [43]
Lin et al. [44]Manta et al. [45]Nero [46]
Park et al. [47]Rahman & Zhang [48]Reyes et al. [49]
Sathyakumar et al. [50]Schule et al. [51]Shen et al. [52]
Sugiyama et al. [53]Tan et al. [54]Tan & Samsudin [55]
Tian et al. [56]Tu et al. [57]Wei [58]
Weiss et al. [59]Wende et al. [60]Xiao et al. [14]
Xu et al. [61]Yang et al. [62]Zhang et al. [63]
Zhou & Kim [64]
Table 2. Coded variables for correspondence analysis (CA).
Code VariablesCategoriesDefinition
Type of access studiedProximityDistance to UGS
QuantityAmount or coverage of UGS within given areas
QualityMulti-dimensional features of UGS
(e.g., amenities, safety, biodiversity)
MultipleTwo or more aspects of access were studied
Measures of SESSingleOnly one measure of SES
MultipleTwo or more measures of SES
InequityYes/NoStudies defined as “Yes” explicitly stated that they found differences in access to UGS among groups of different SES status
Country characteristicsHICs The city (or cities) studied in the article is in a high-income country
LMICs The city (or cities) studied in the article is in a low- or middle-income country
City sizeMore than 1,000,000The population of the studied city; the multi-city studies containing one city of more than 1,000,000 population were also coded into this category
Less than 1,000,000The population of the studied city (or cities)
Temporal scaleCross-sectionalThe empirical analyses were based on data at a single point in time
LongitudinalThe empirical analyses were based on multiple-year data
Spatial scaleSingle scaleResults were analyzed at a single spatial resolution
Multiple scalesResults were analyzed at different spatial resolutions
InterventionsYes/NoStudies defined as “Yes” mentioned the influence of local policy, planning, or initiatives on inequity
Note: HICs: high-income countries; LMICs: low- and middle-income countries; UGS: urban green spaces.
Table 3. The city-scale (population) distributions from the reviewed empirical studies.
City ScaleCity Number Location
5,000,000 and greater19Australia, Bangladesh, Chile, China, Columbia, Ghana, Iran, Mexico, Peru, Singapore, South Korea, US
1,000,000 to 5,000,00016Argentina, Australia, Bolivia, Canada, Germany, India, Japan, Spain, Syria, US
500,000 to 1,000,0006Brazil, Mexico, UK, US
250,000 to 500,0008Italy, Portugal, UK, US
100,000 to 250,0003US
Table 4. The distribution of access inequity from the reviewed empirical studies.
Access InequityCity NumberLocation
Found42Argentina, Australia, Bangladesh, Bolivia, Brazil, Canada, Chile, China, Columbia, Germany, Ghana, Japan, India, Mexico, Peru, Portugal, Singapore, South Korea, Syria, UK, US
Not Found10China, Australia, Iran, Italy, Spain, UK, US
Table 5. Policies or interventions to mitigate access inequity described in the reviewed articles.
Author(s)Study LocationUrban Green Space Planning and Inequity Mitigation InitiativesGoals
Cradock et al.,
2005 [28]
Boston, USARenovation by the Boston Parks and Recreation DepartmentImprove the safety of playgrounds
Dai, 2011 [15]Atlanta, USAAtlanta beltline redevelopment plan (Atlanta Development Authority, 2005)Create 1200 acres of new or expanded parks; Improvements to over 700 acres of existing parks
Tan and Samsudin, 2017 [55]SingaporeEthnic Integration PolicyMaintain a racial mix quota in public housing estates and avoid forming racial enclaves in residential areas
Tu et al., 2018 [57]Beijing, ChinaUrban Green Space System Planning (2004–2020)Fund and build more than 100 public urban parks with a total area of 1700 hectares during 2005–2010
Wei, 2017 [58]Hangzhou, China Urban Green Space System Planning in HangzhouRecommend a 2 km distance for city parks and a 1–2 km for district parks with driving by private vehicles
The Green Space Planning in Hangzhou
The Public Open Space Planning in Hangzhou
Xiao et al., 2017 [14]Shanghai, ChinaThe 13th Five Year Plan’s Public Green Space Special Plan (Ministry of Housing and Urban–Rural Development of the People’s Republic of China, 2015)Reduce the walking distance to public green space in the city proper to 500 m
Gu et al., 2017 [33]Shanghai, ChinaShanghai Master Plan (2015–2040)Develop a new urban–rural parks system by 2040 to improve the accessibility of public green spaces
Zhang et al., 2019 [63]Nanjing, ChinaThe Planning of Nanjing City Parks (2017–2035)Recommend that people enjoy a 10 min walk to the community-level park and a 20 min walk to the district-level park.
Publisher’s Note: MDPI stays neutral with regard to jurisdictional claims in published maps and institutional affiliations.

