
Numerical Investigation of Roof Stability in Longwall Face Developed in Shallow Depth under Weak Geological Conditions

 , , and
Abstract
1. Introduction
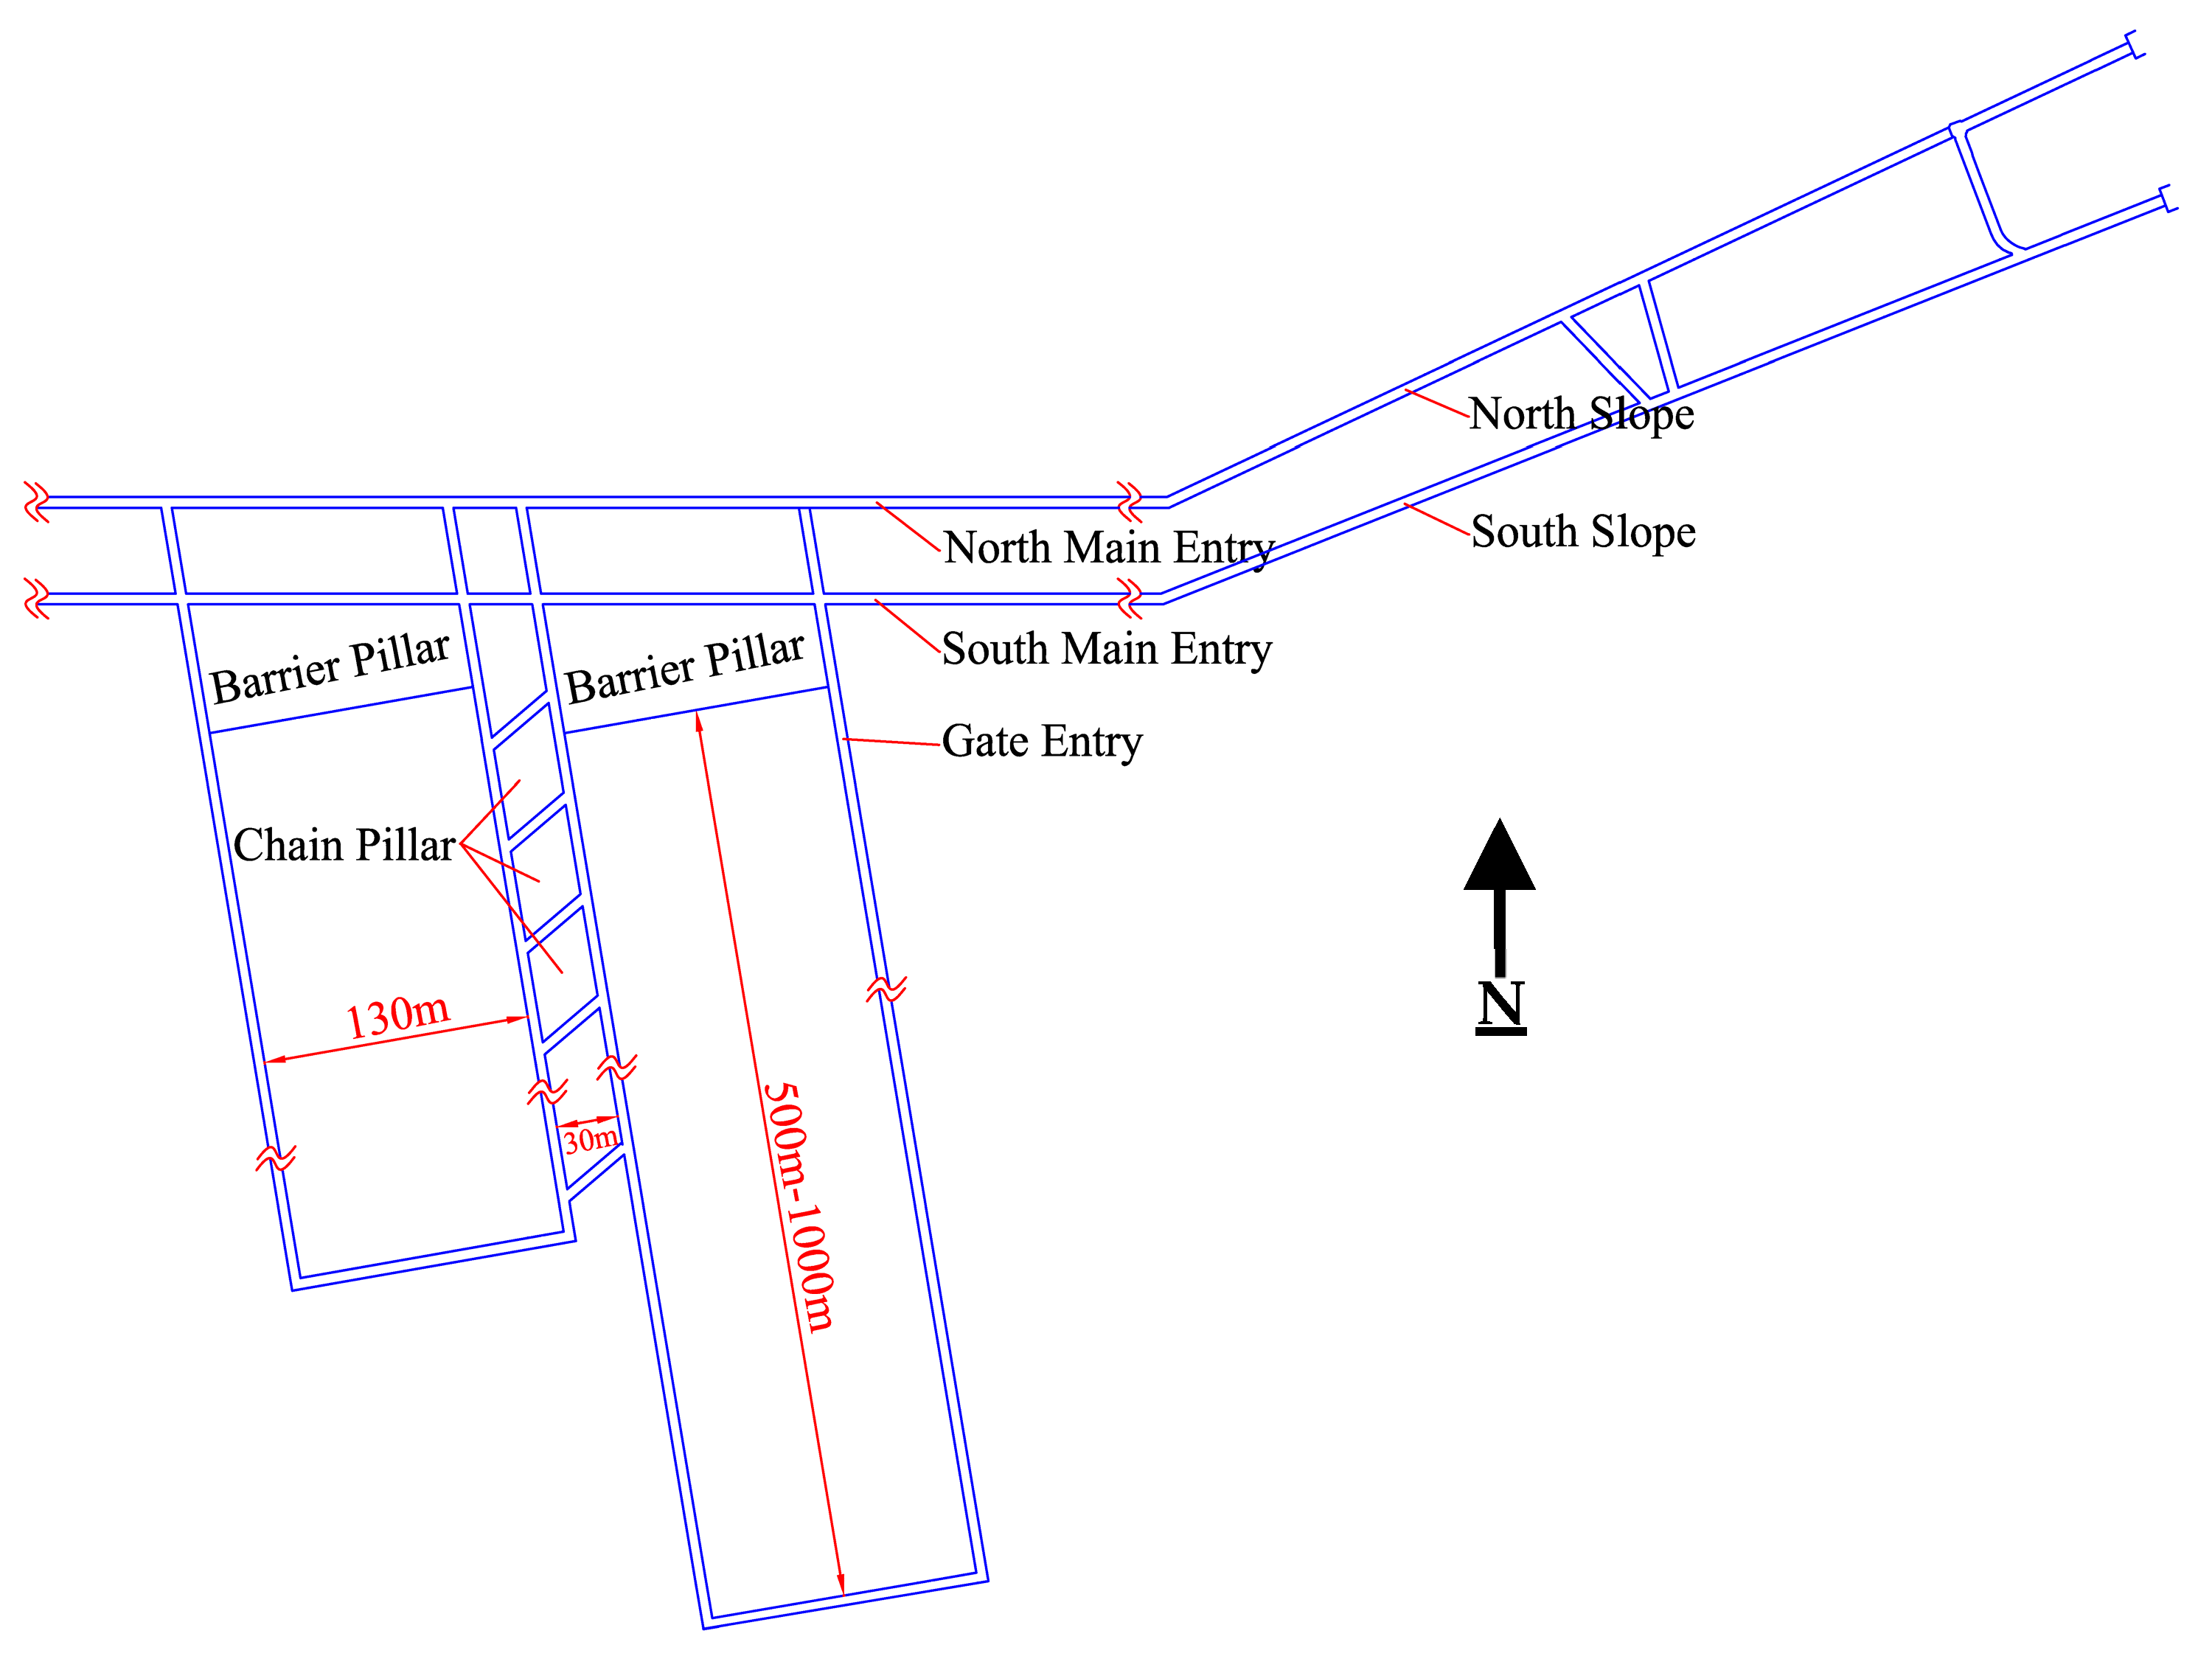
2. Studied Site
3. Establishment of Numerical Model
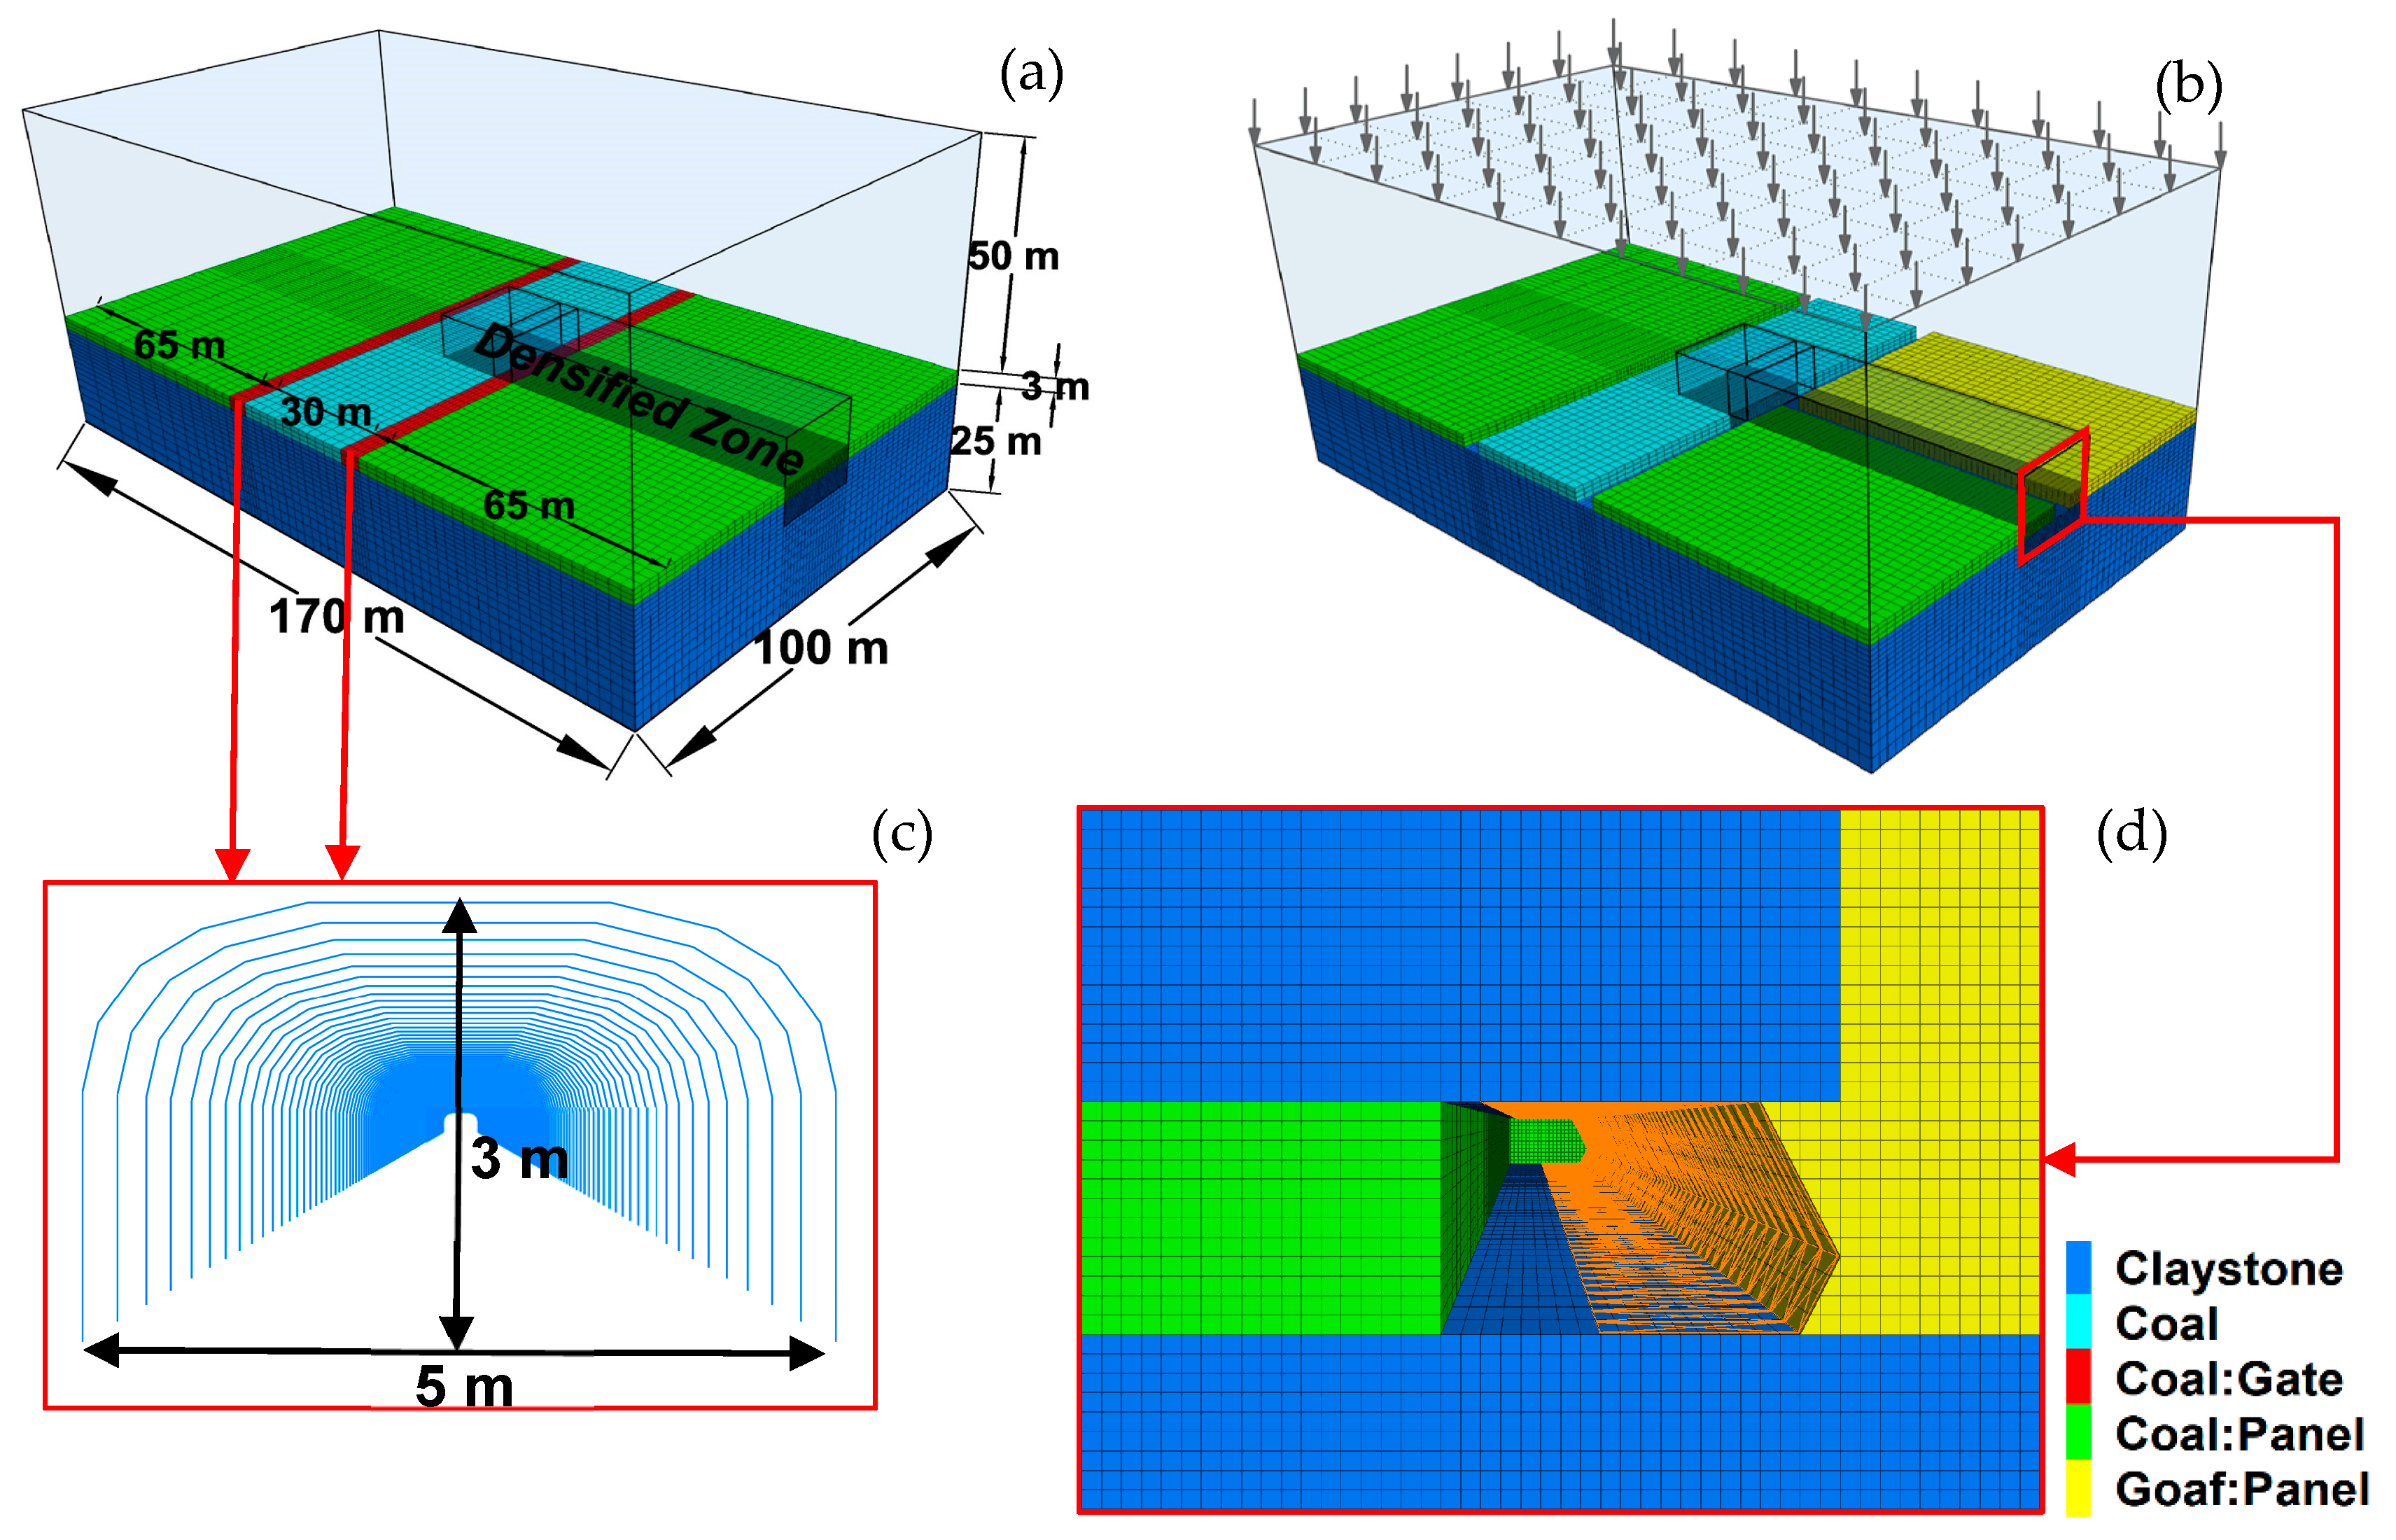
3.1. Global Model Description
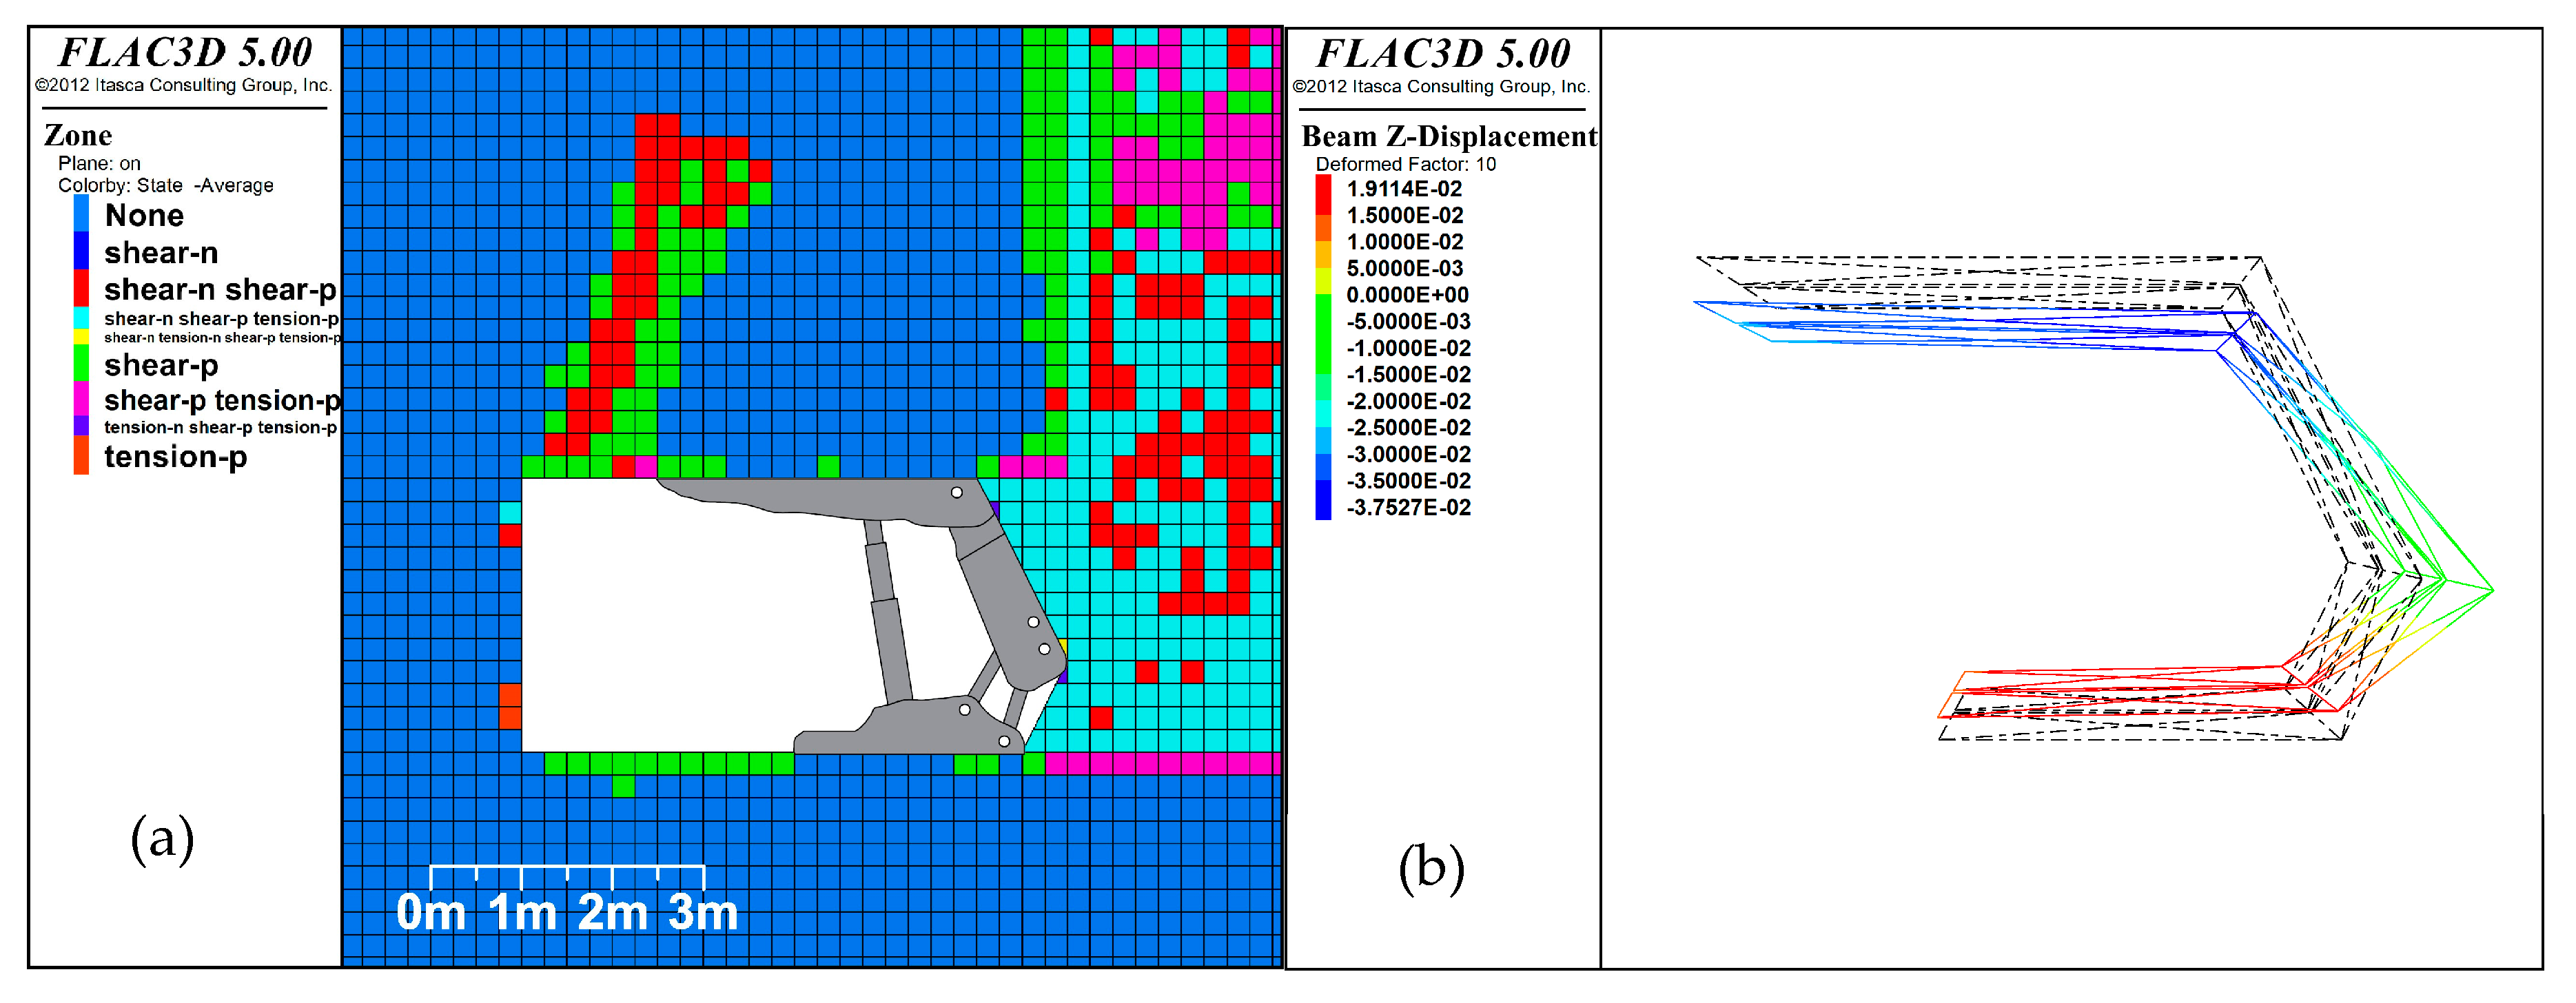
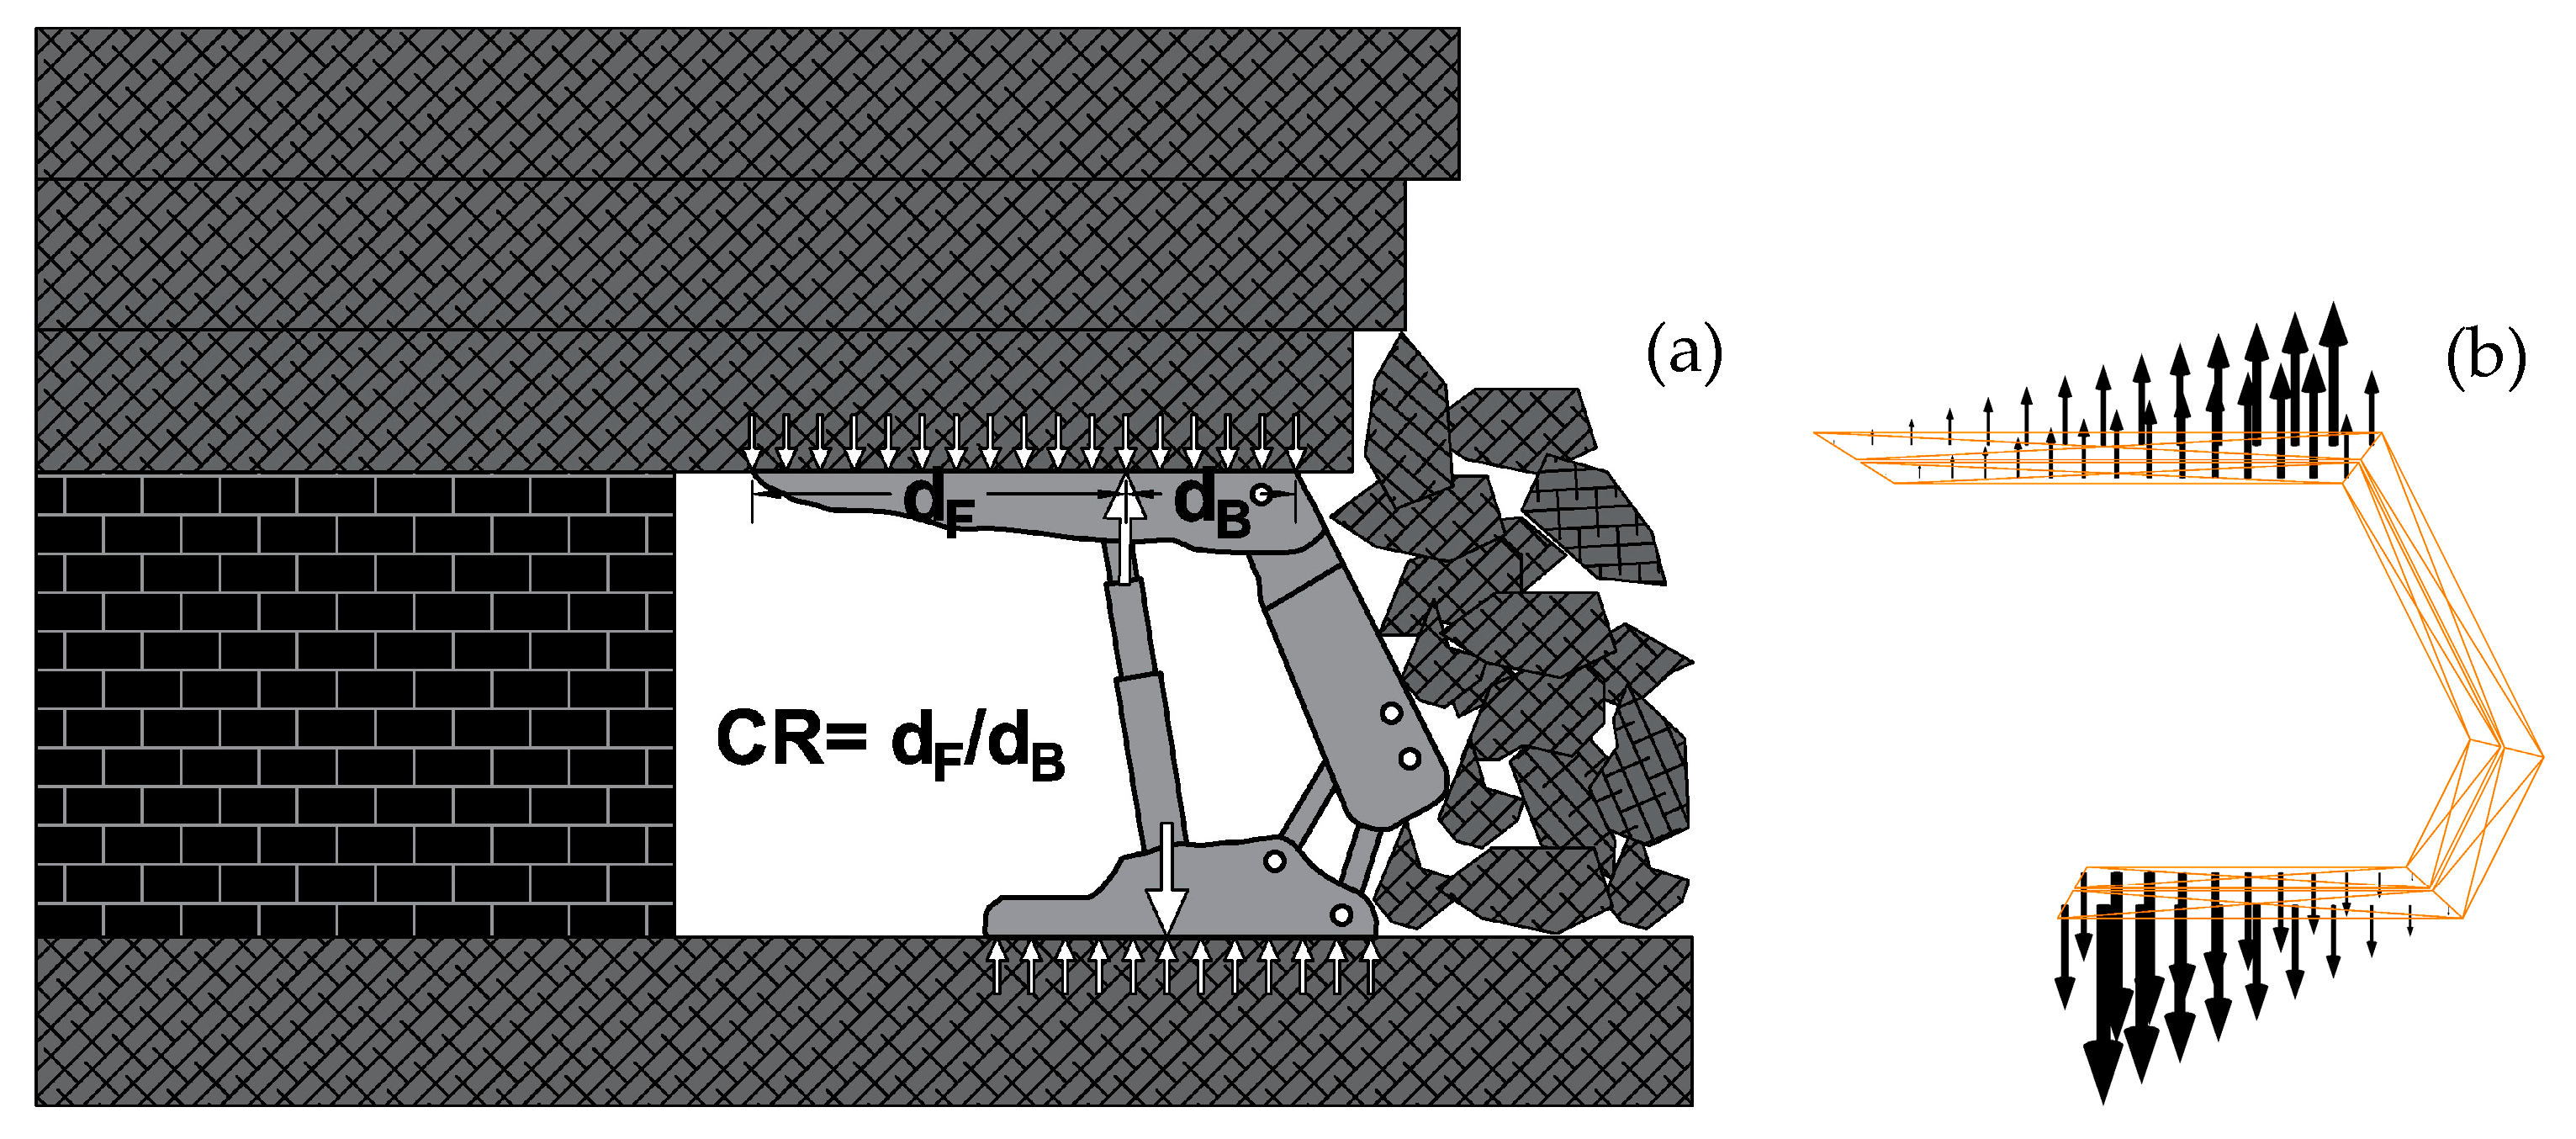
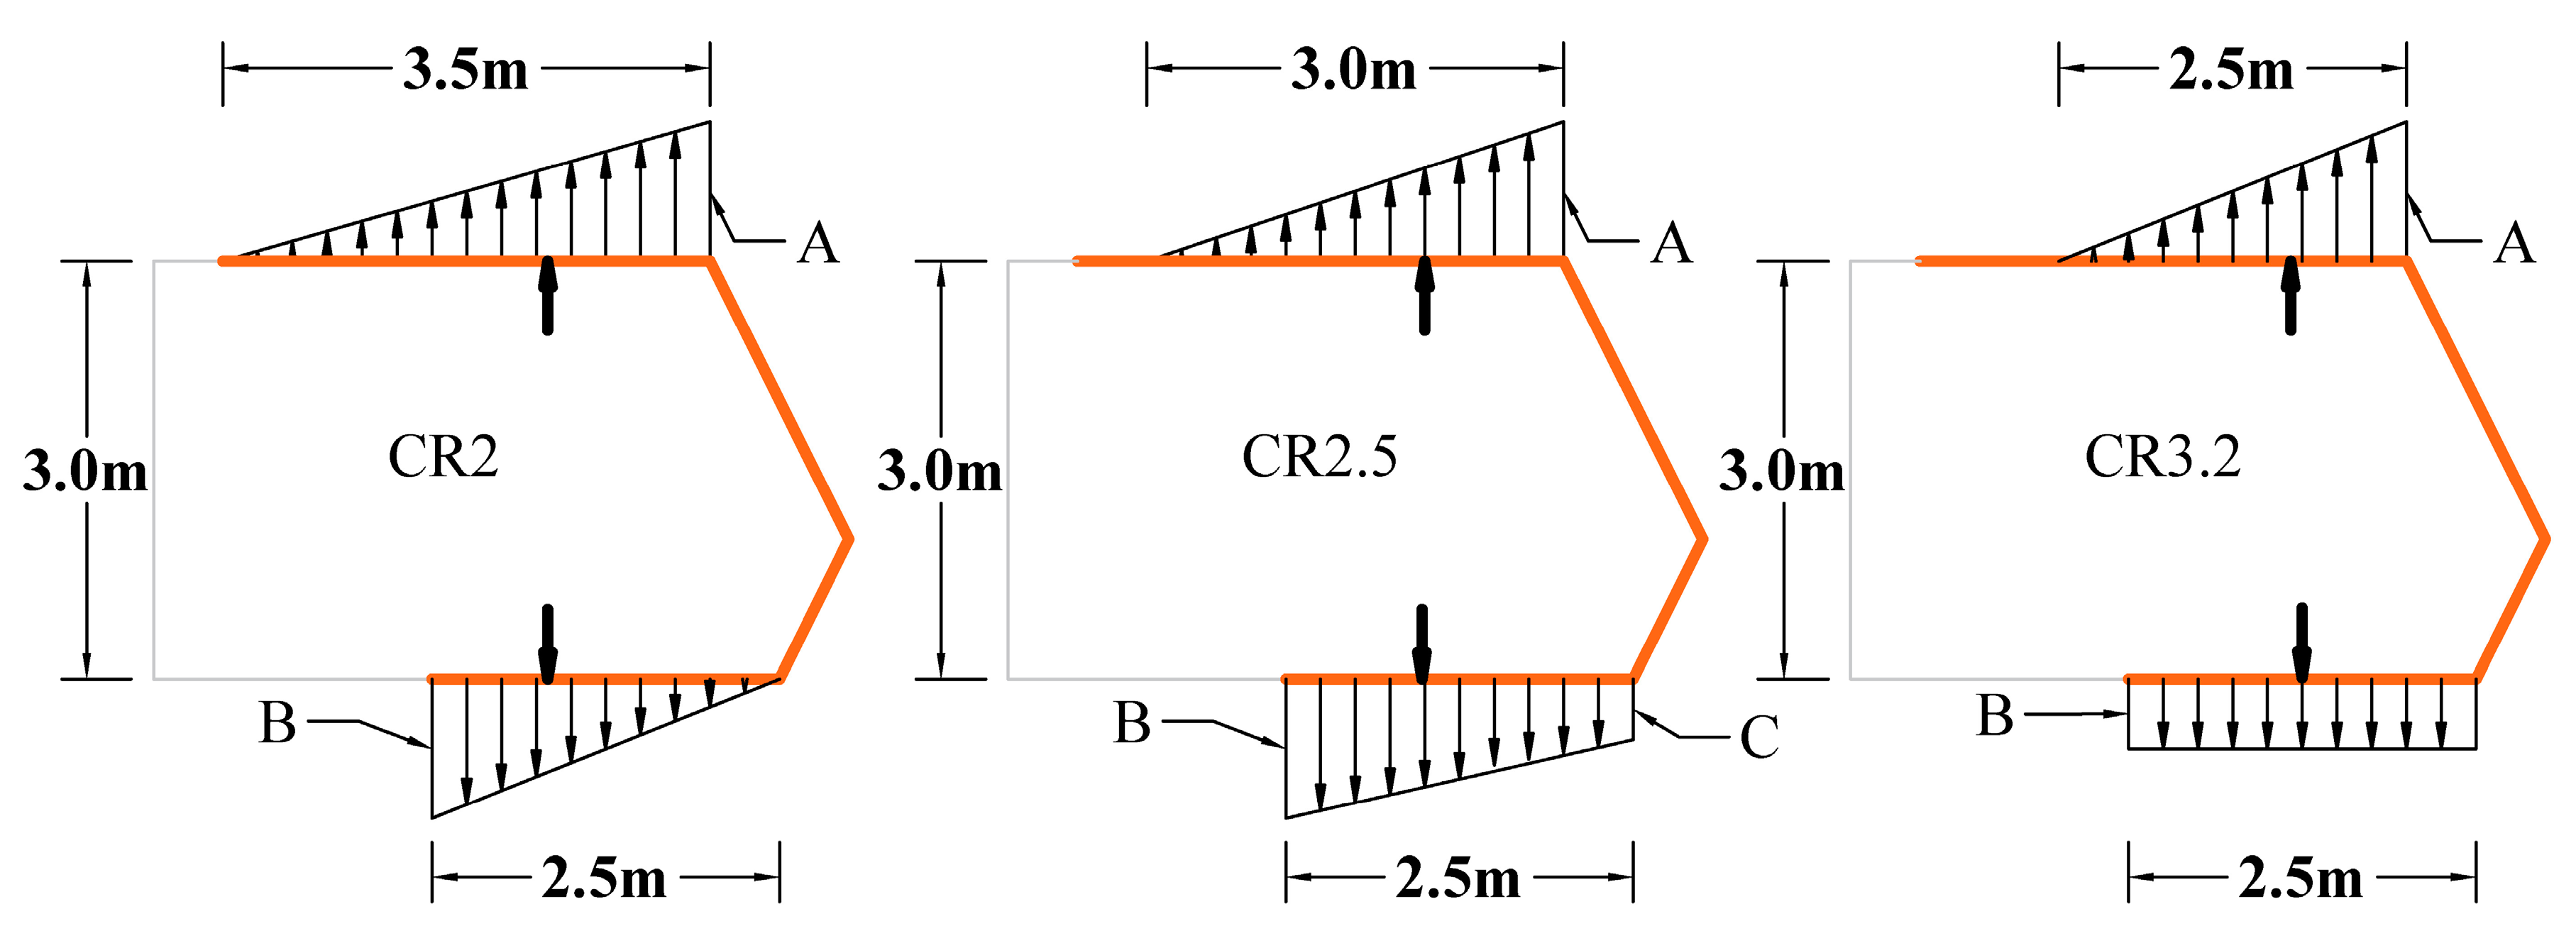
3.2. Simulation Model of Powered Shield Support
3.3. Research Scheme
- Canopy ratios are CR2, CR2.5, and CR3.2.
- Shield resistance forces are 6000 kN, 8000 kN, 10,000 kN, 12,000 kN
- Stress ratios K are 0.5, 1, 1.5, and 2
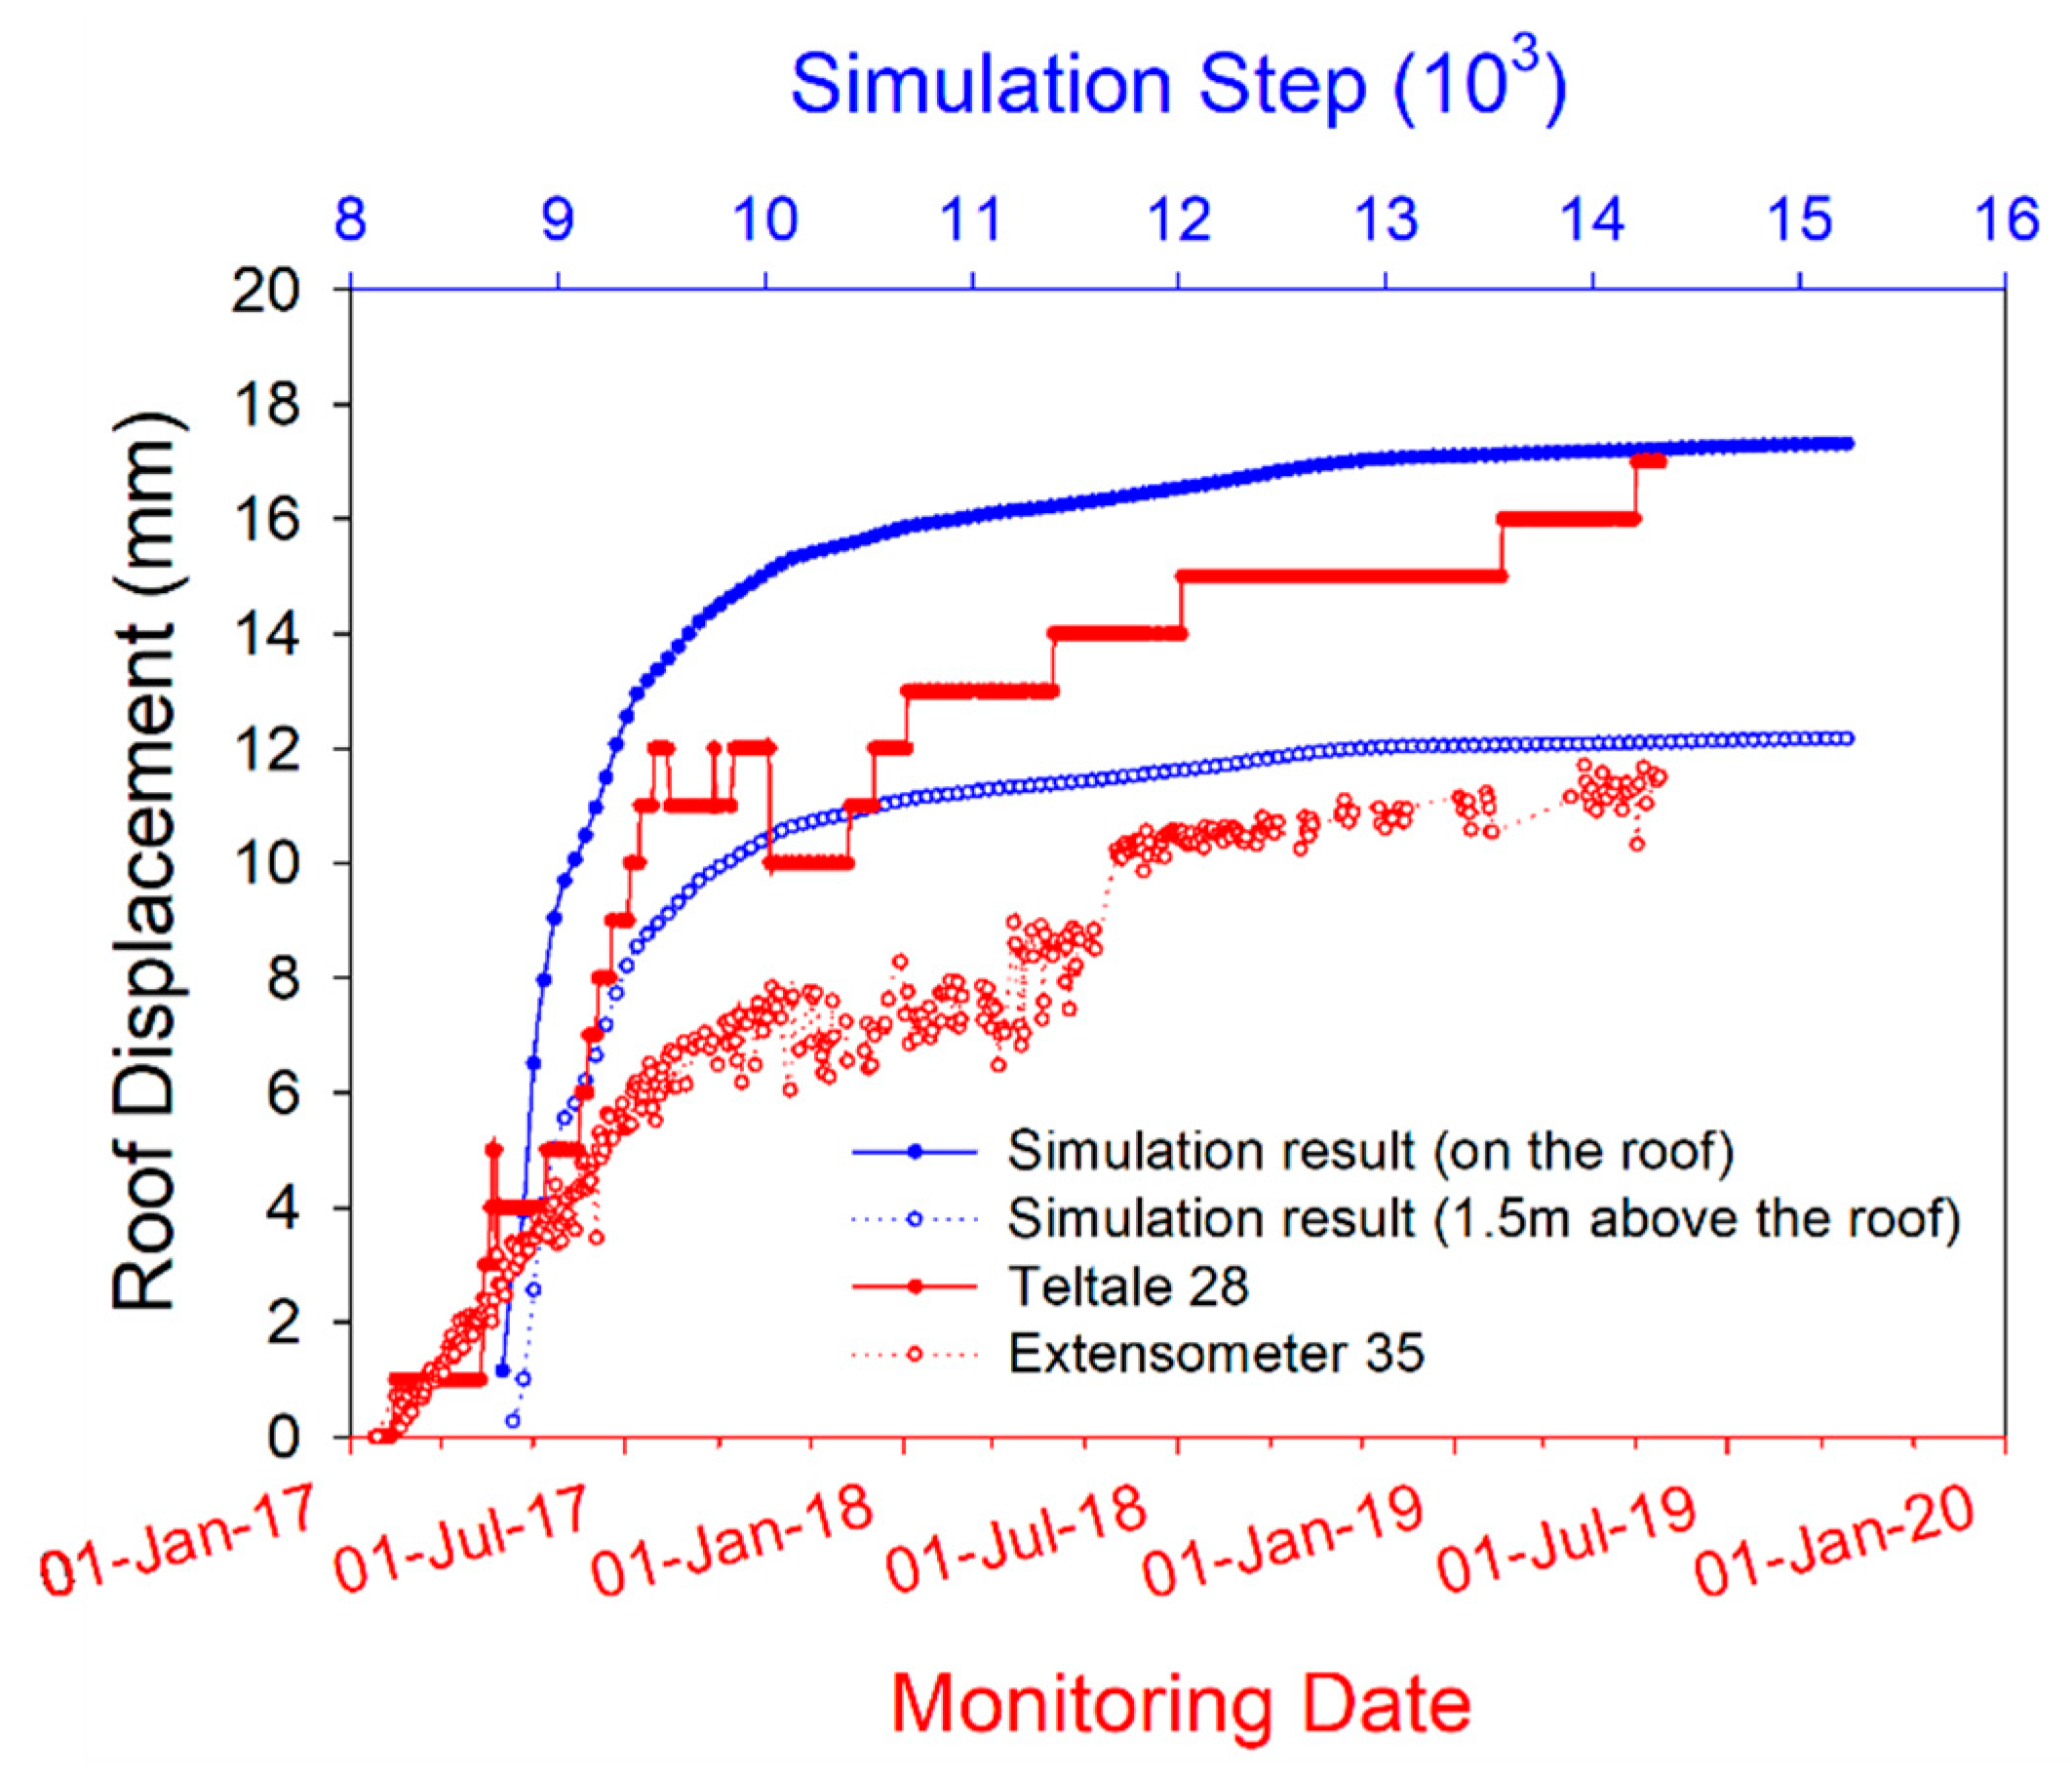
3.4. Model Validation
3.4.1. Roadway Roof Displacement
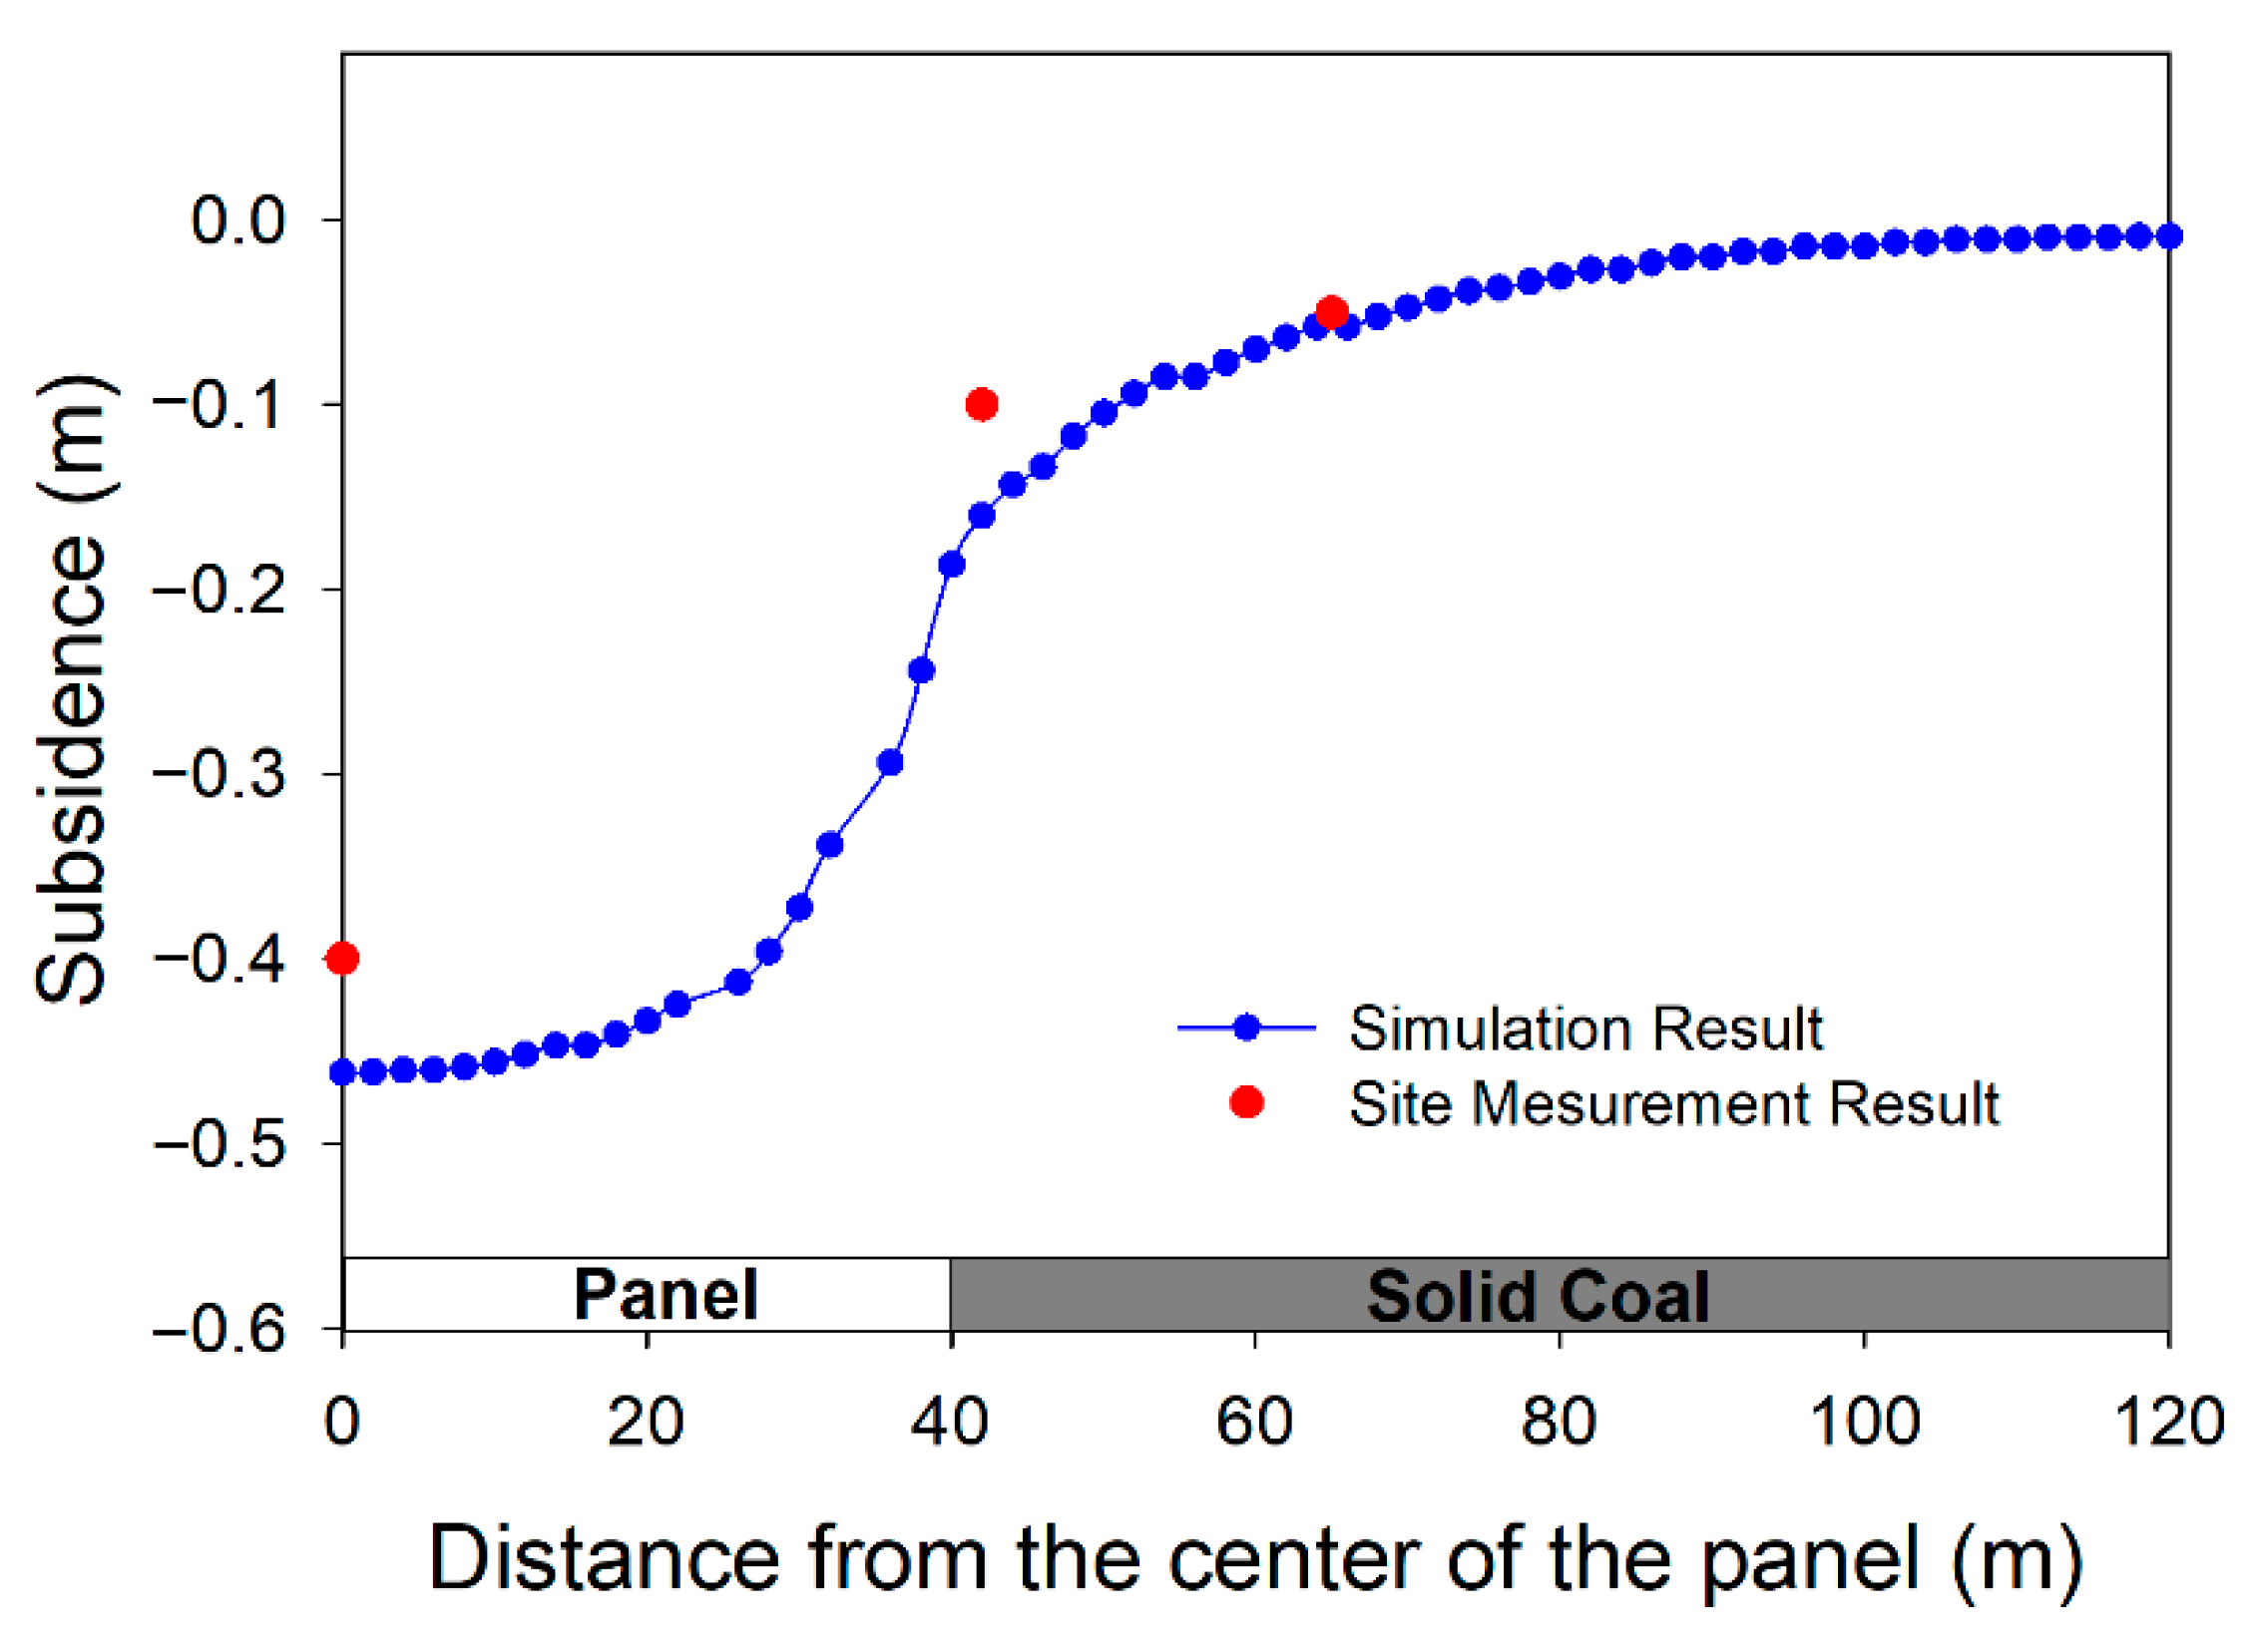
3.4.2. Surface Subsidence
4. Results and Discussion
4.1. Effect of Shield Support Canopy Ratio on Stability of Longwall Face
4.1.1. Failure Zone Surrounding Longwall Face
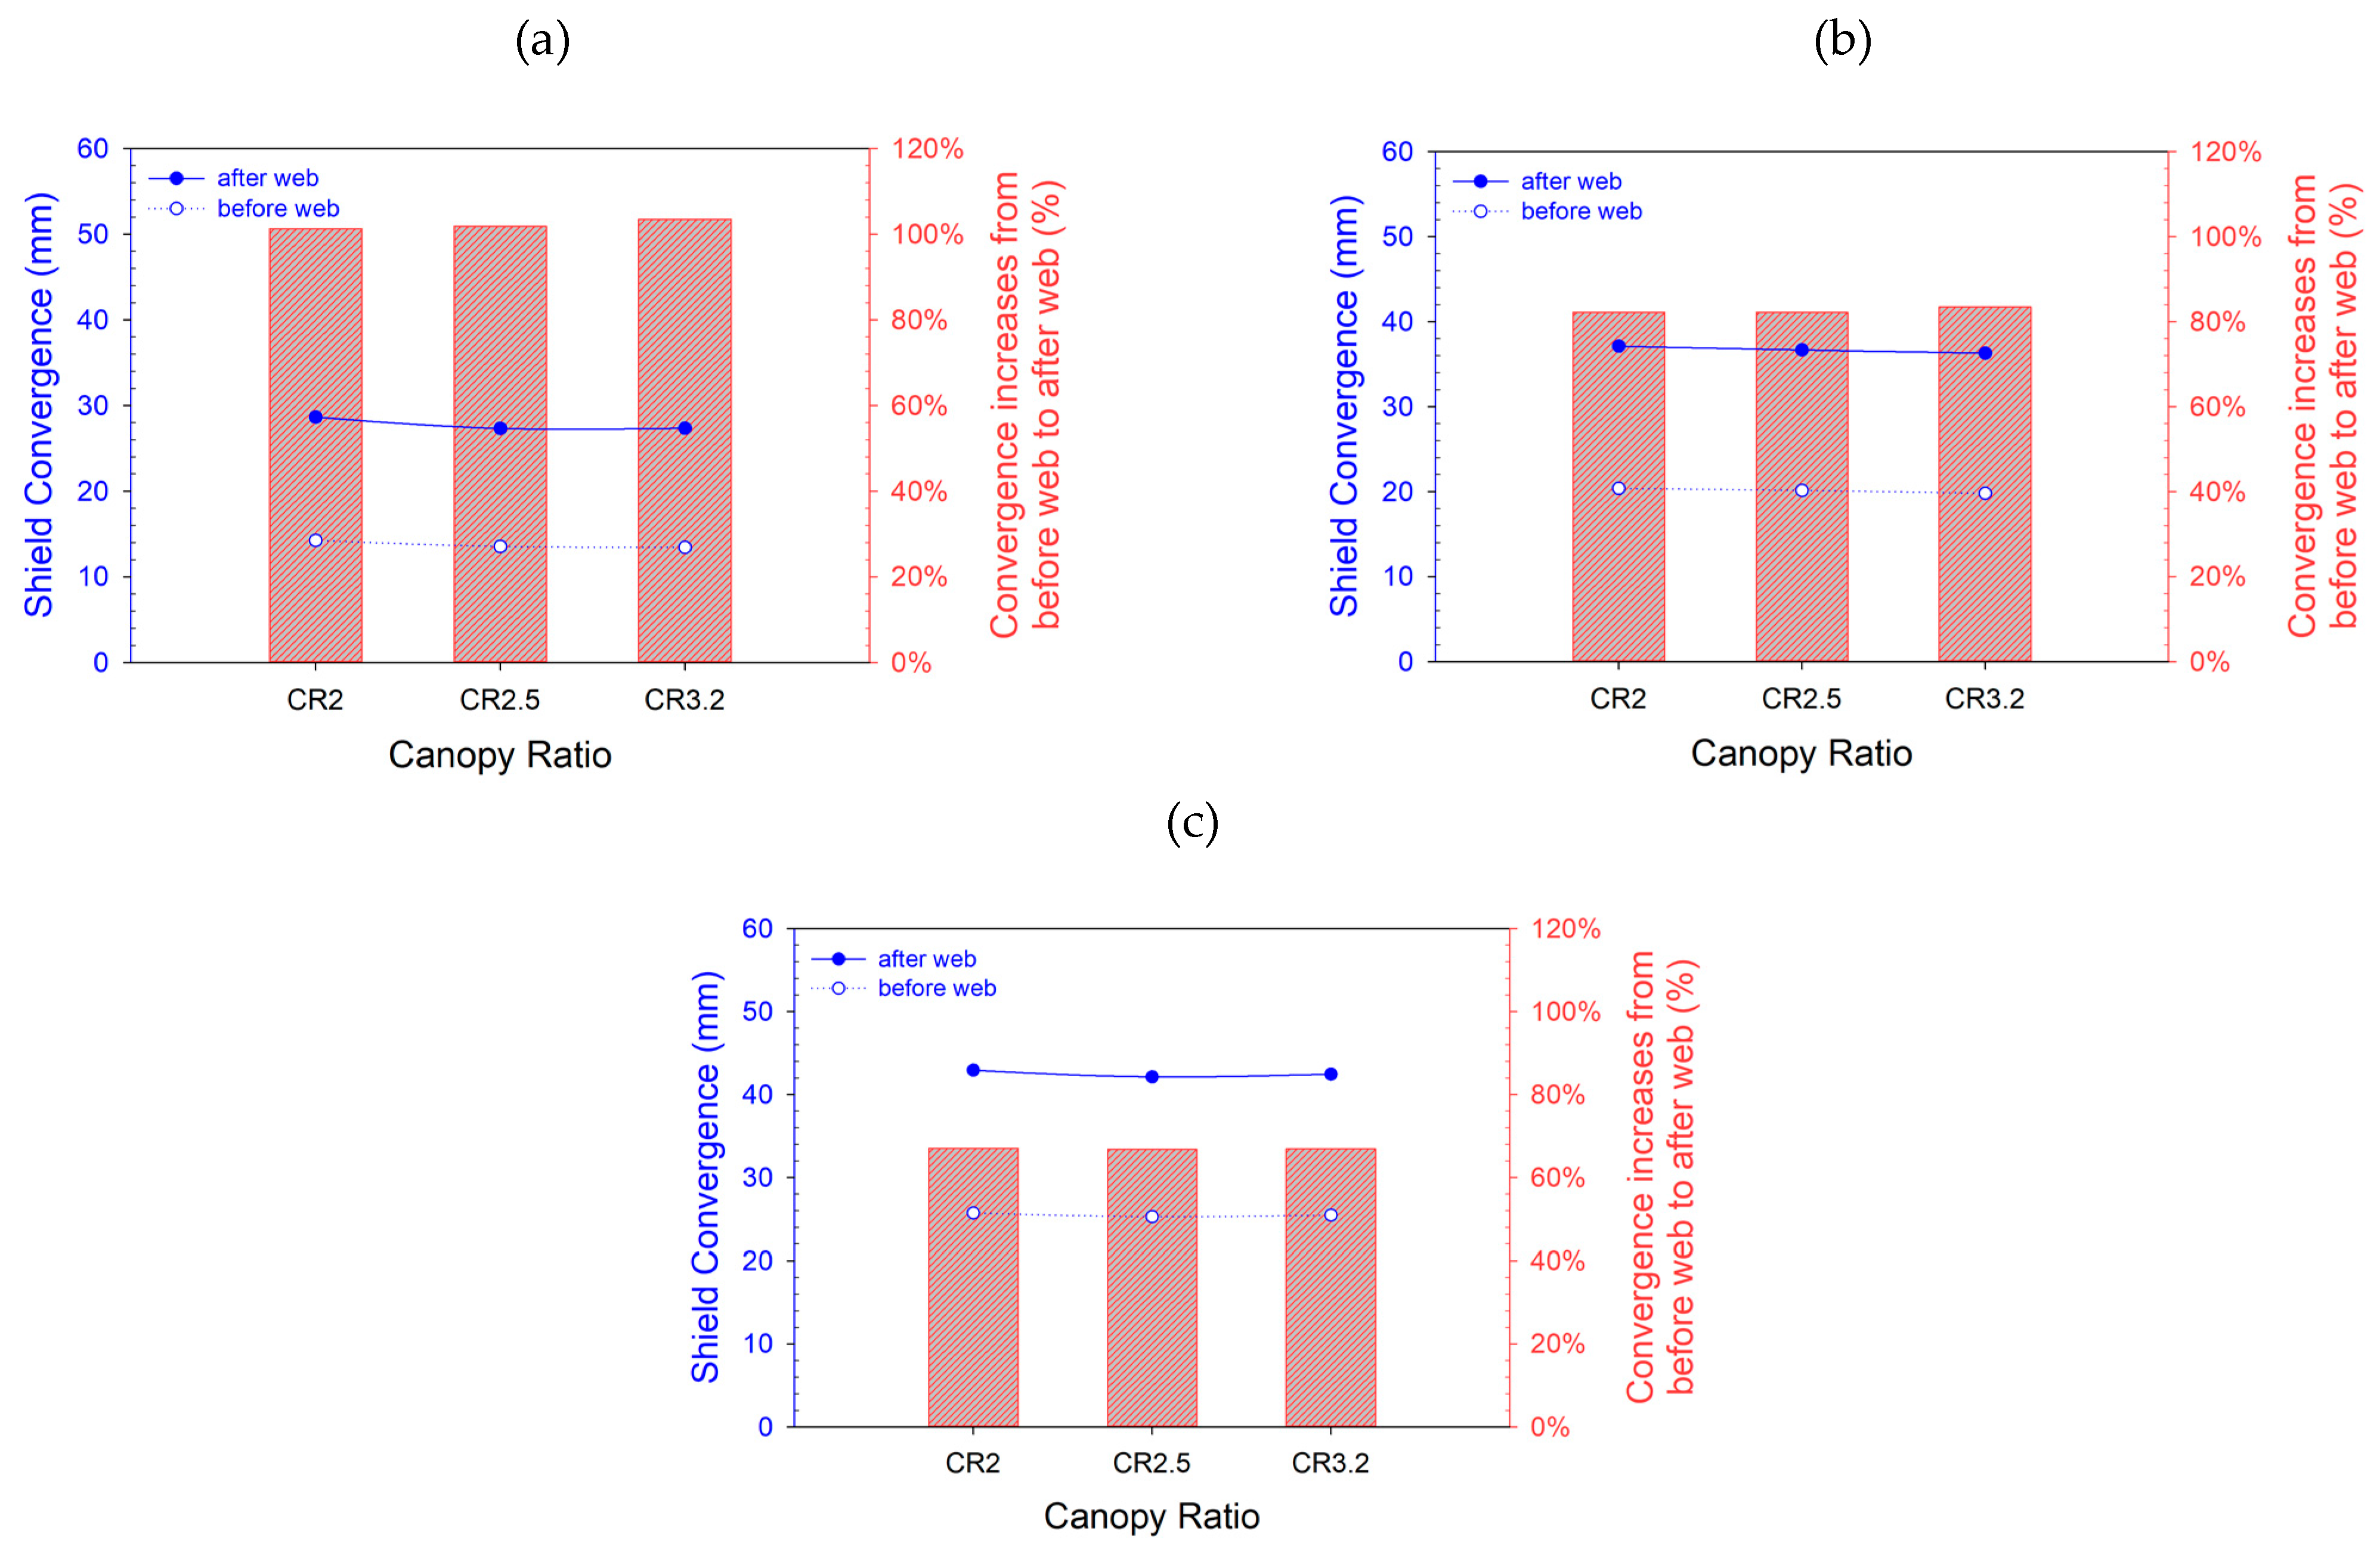
4.1.2. Shield Convergence
4.2. Effect of Shield Resistance Force on Stability of Longwall Face
4.2.1. Failure Zone Surrounding Longwall Face
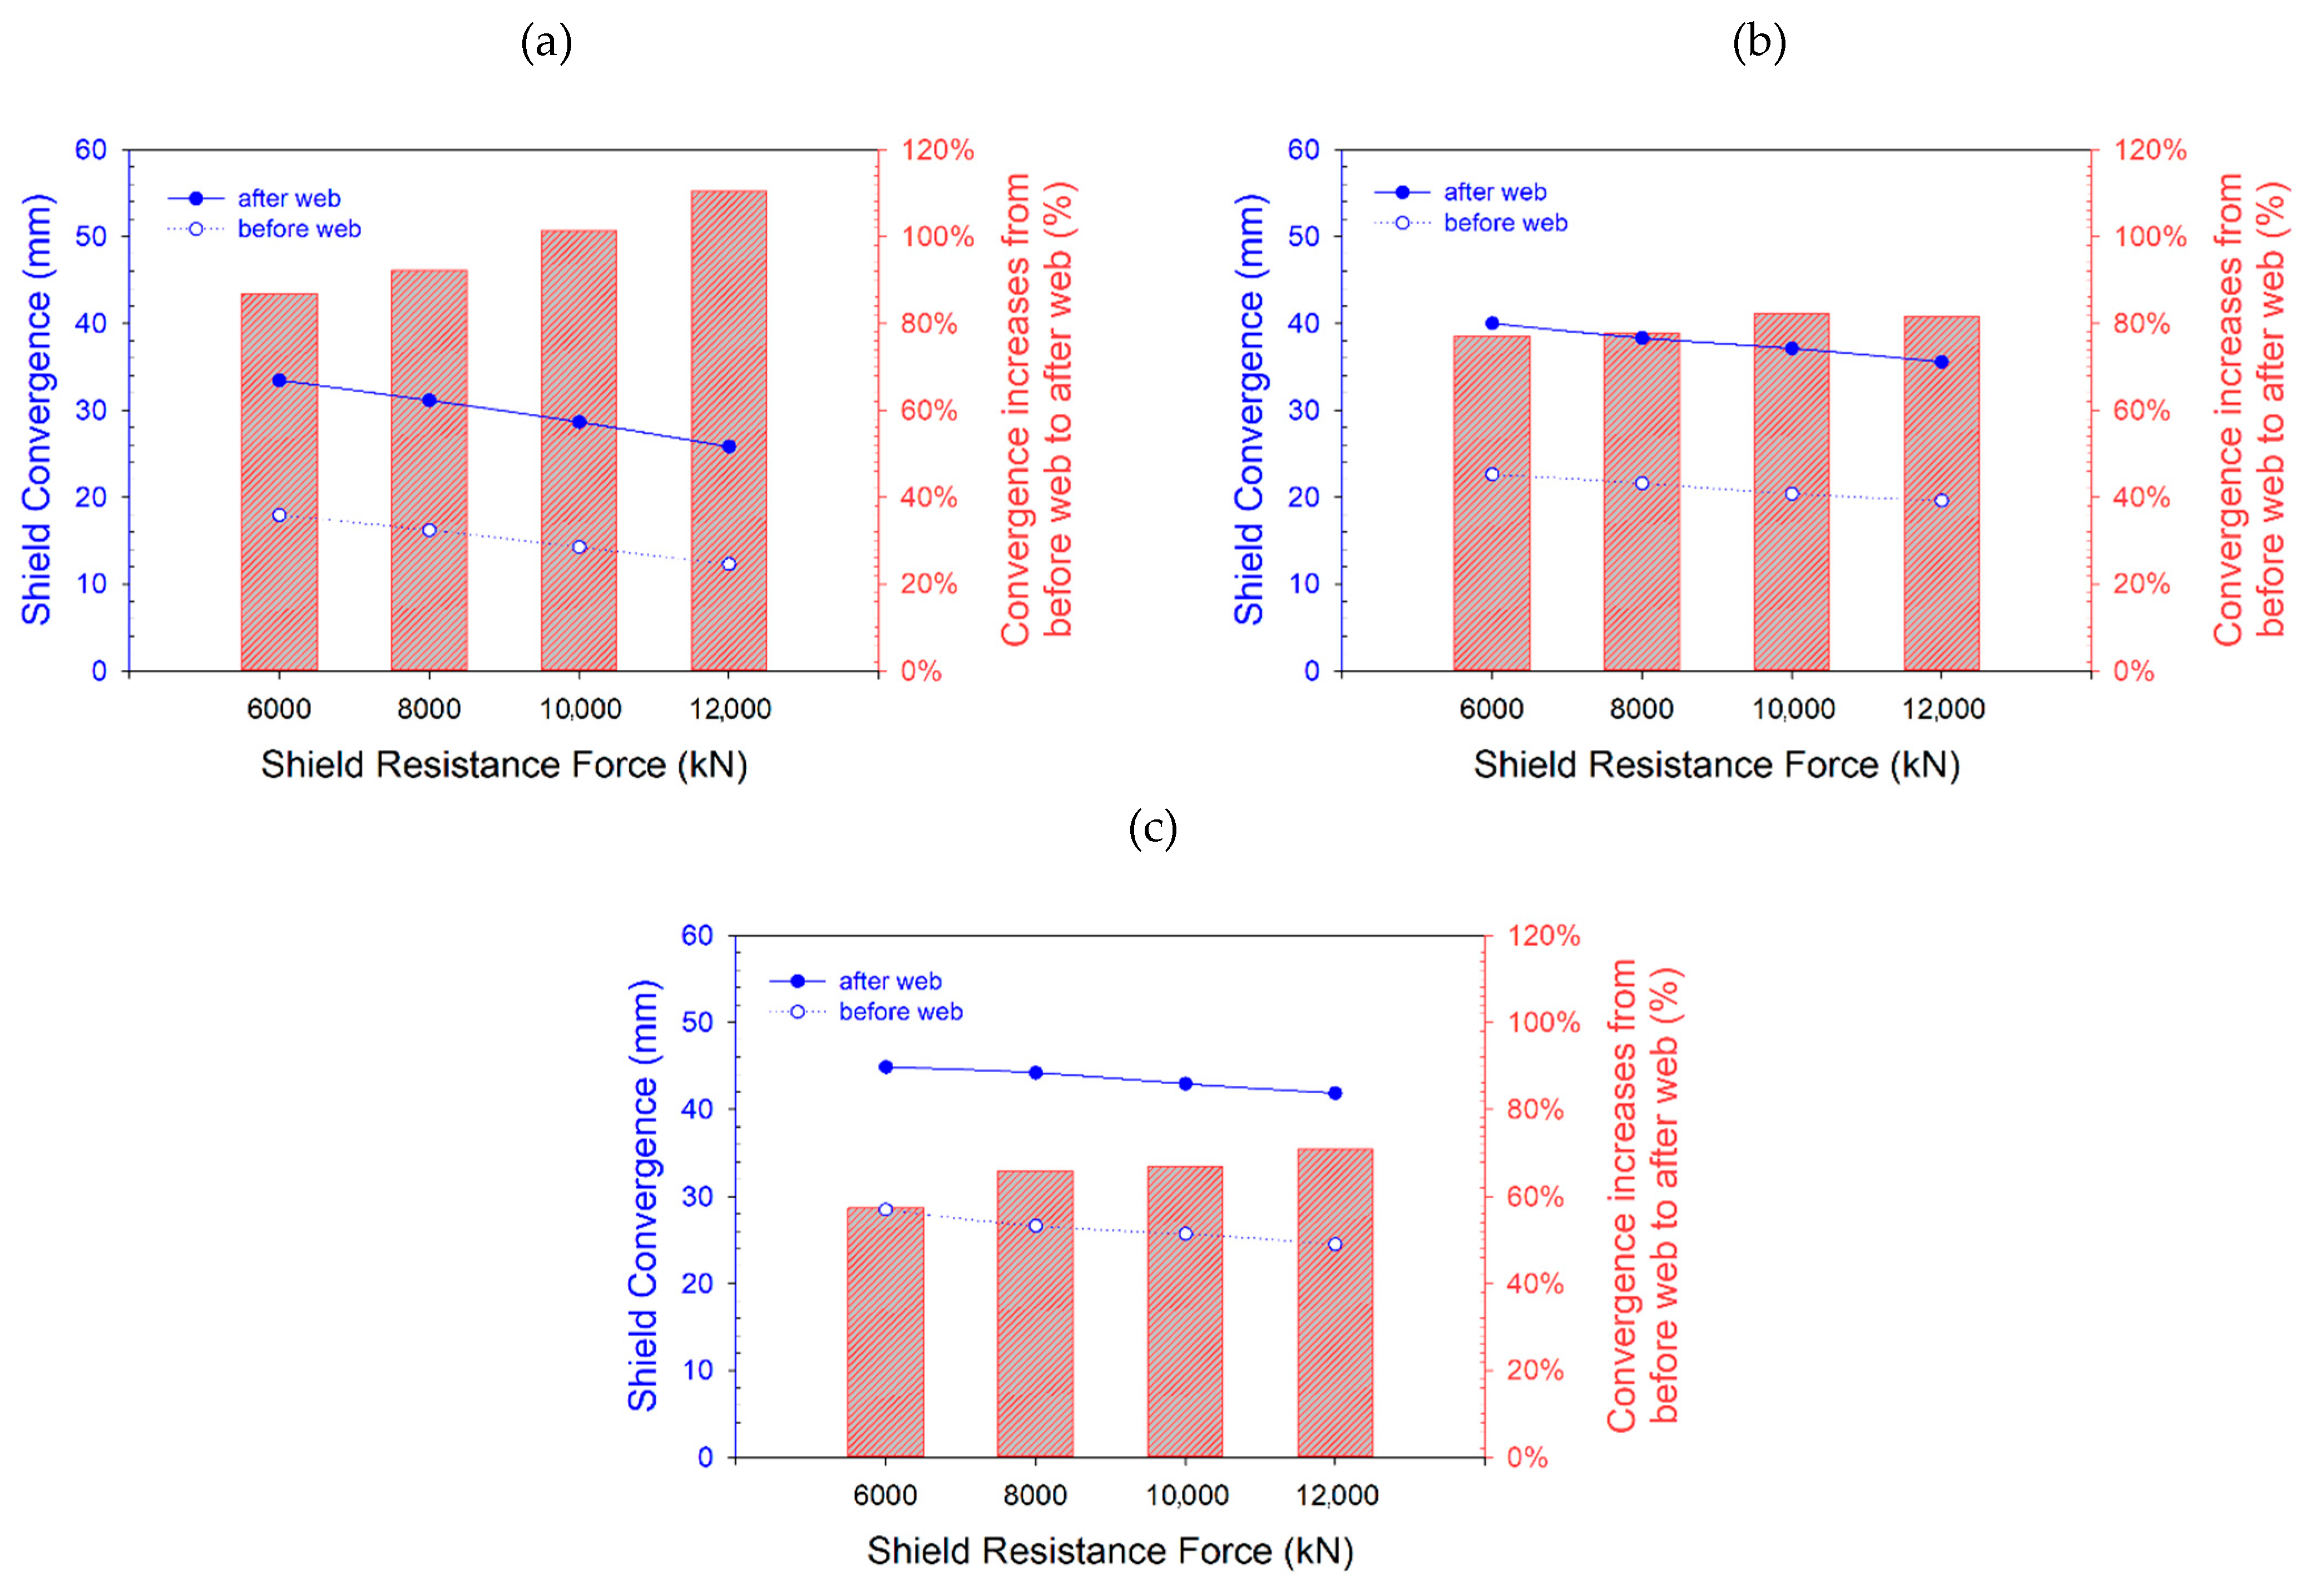
4.2.2. Shield Convergence
4.3. Effect of Stress Ratio on Stability of the Longwall Face
4.3.1. Failure Zone Surrounding Longwall Face
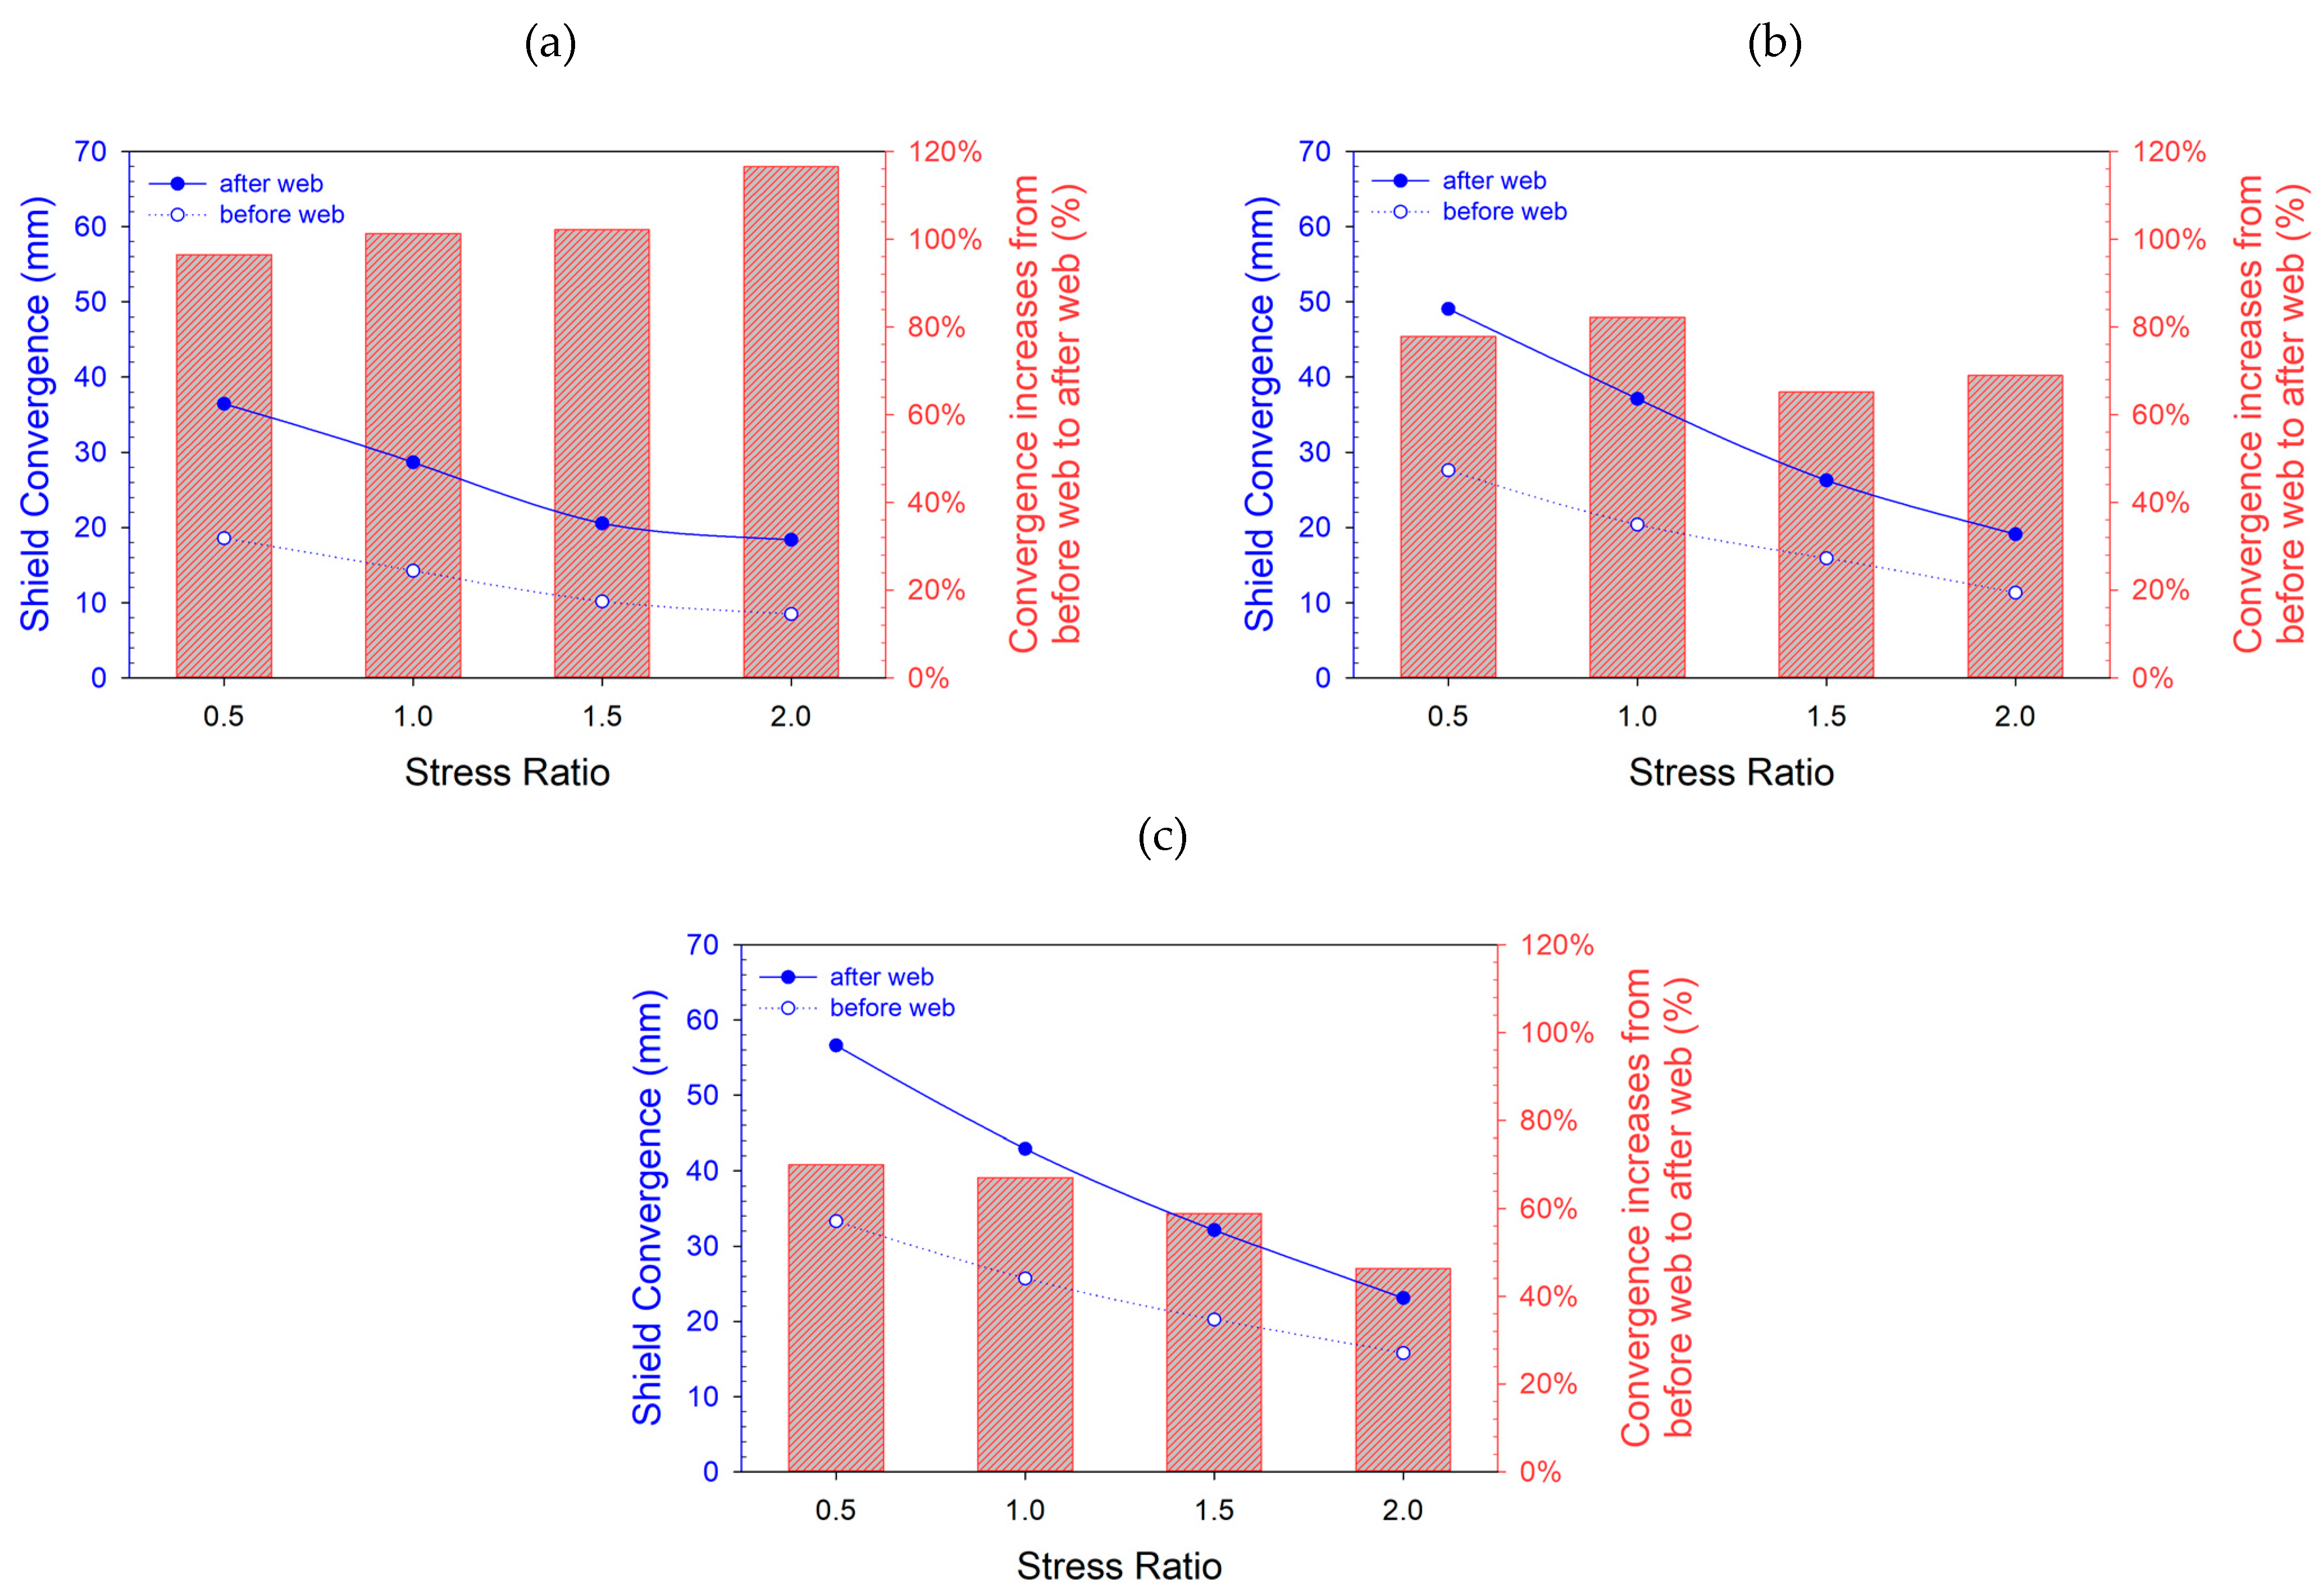
4.3.2. Shield Convergence
5. Stability Control of Longwall Face Stability under the Weak Geological Conditions
6. Conclusions
- In weak rock, shield canopy ratio value is preferred to be nearby to 2. Shield setting pressure at the beginning of the loading cycle can be set as low as 6000 kN and after web higher shield resistance force provides better roof condition.
- The influence of the stress ratio on the roof failure zone is significant. The propagation of the failure zone above the roof of the longwall face decreases when the stress ratio increases, as the increase of horizontal stress in higher stress ratio could help counteract roof caving. However, from stress ratio 2, the horizontal failure zone starts to increase which is plausible to promote the vertical failure zone especially for weaker roofs due to excessively horizontal stress. In the lower stress ratio of 0.5, the roof caving behavior is following the detached block model. However, when the stress ratio is 1 or above, the roof caving behavior in the longwall face is following the bulking model concept.
- Shield convergence decreases following the increase of shield resistance force. The same can be said when stress ratio increases. The increment of convergence between before and after web increases in correlation with the increase of roof rock strength.
Author Contributions
Funding
Institutional Review Board Statement
Informed Consent Statement
Acknowledgments
Conflicts of Interest
References
- Aydin, G. The modeling and projection of primary energy consumption by the sources. Energy Sources Part B Econ. Plan. Policy 2015, 10, 67–74. [Google Scholar] [CrossRef]
- Azadeh, A.; Tarverdian, S. Integration of genetic algorithm, computer simulation and design of experiments for forecasting electrical energy consumption. Energy Policy 2007, 35, 5229–5241. [Google Scholar] [CrossRef]
- Aydin, G.; Karakurt, I.; Aydiner, K. Analysis and mitigation opportunities of methane emissions from the energy sector. Energy Sources Part A Recovery Util. Environ. Eff. 2012, 34, 967–982. [Google Scholar] [CrossRef]
- Aydin, G. The Application of trend analysis for coal demand modeling. Energy Sources Part B Econ. Plan. Policy 2015, 10, 183–191. [Google Scholar] [CrossRef]
- Peng, S.S. Longwall mine design. In Longwall Mining, 3rd ed.; CRC Press: Boca Raton, FL, USA, 2019. [Google Scholar]
- Prusek, S.; Rajwa, S.; Wrana, A.; Krzemień, A. Assessment of roof fall risk in longwall coal mines. Int. J. Min. Reclam. Environ. 2017, 31, 558–574. [Google Scholar] [CrossRef]
- Frith, R.C. A holistic examination of the load rating design of longwall shields after more than half a century of mechanised longwall mining. Int. J. Min. Sci. Technol. 2015, 25, 687–706. [Google Scholar] [CrossRef]
- Ji, S.; He, H.; Karlovšek, J. Application of superposition method to study the mechanical behaviour of overlying strata in longwall mining. Int. J. Rock Mech. Min. Sci. 2021, 146, 104874. [Google Scholar] [CrossRef]
- Tian, M.; Han, L.; Xiao, H.; Meng, Q. Experimental study of deformations and failures of the coal wall in a longwall working face. Eng. Fail. Anal. 2021, 125, 105428. [Google Scholar] [CrossRef]
- Rajwa, S.; Janoszek, T.; Prusek, S. Model tests of the effect of active roof support on the working stability of a longwall. Comput. Geotech. 2020, 118, 103302. [Google Scholar] [CrossRef]
- Rajwa, S.; Janoszek, T.; Prusek, S. Influence of canopy ratio of powered roof support on longwall working stability—A case study. Int. J. Min. Sci. Technol. 2019, 29, 591–598. [Google Scholar] [CrossRef]
- Zhao, T.; Liu, C.; Yetilmezsoy, K.; Gong, P.; Chen, D.; Yi, K. Segmental adjustment of hydraulic support setting load in hard and thick coal wall weakening: A study of numerical simulation and field measurement. J. Geophys. Eng. 2018, 15, 2481–2491. [Google Scholar] [CrossRef]
- Song, G.; Chugh, Y. 3D analysis of longwall face stability in thick coal seams. J. South. Afr. Inst. Min. Metall. 2018, 118, 131–142. [Google Scholar] [CrossRef]
- Chuang, L.; Huamin, L.; Dongjie, J. Numerical simulation study on the relationship between mining heights and shield resistance in longwall panel. Int. J. Min. Sci. Technol. 2017, 27, 293–297. [Google Scholar] [CrossRef]
- Lv, J.; Wan, Z.; Yang, Y.; Wang, J.; Zhang, Y.; Liu, S. Failure characteristics and stability control technology of dynamic pressure roadway affected by the mining activity: A case study. Eng. Fail. Anal. 2022, 131, 105857. [Google Scholar] [CrossRef]
- Ta, X.; Wan, Z.; Zhang, Y.; Shi, P.; Wei, Z.; Sun, X.; Jia, L. Field and Numerical Investigation on the Coal Pillar Instability of Gob-Side Entry in Gently Inclined Coal Seam. Adv. Civ. Eng. 2021, 2021, 4901670. [Google Scholar] [CrossRef]
- Barczak, T.M. Research developments that contributed to the landscape of longwall roof support design over the past 25 years. In Advances in Coal Mine Ground Control; Peng, S.S., Ed.; Elsevier: Amsterdam, The Netherlands, 2017; pp. 1–34. [Google Scholar]
- Wang, J.; Li, Y. Thick seam coal mining and its ground control. In Advances in Coal Mine Ground Control; Elsevier: Amsterdam, The Netherlands, 2017; pp. 379–407. [Google Scholar]
- Witek, M.; Prusek, S. Numerical calculations of shield support stress based on laboratory test results. Comput. Geotech. 2016, 72, 74–88. [Google Scholar] [CrossRef]
- Sasaoka, T.; Takamoto, H.; Shimada, H.; Oya, J.; Hamanaka, A.; Matsui, K. Surface subsidence due to underground mining operation under weak geological condition in Indonesia. J. Rock Mech. Geotech. Eng. 2015, 7, 337–344. [Google Scholar] [CrossRef]
- Pongpanya, P. Appropriate Design of Longwall Coal Mining System under Weak Geological Conditions in Indonesia; Kyushu University: Fukuoka, Japan, 2018. [Google Scholar]
- Mao, P.; Shimada, H.; Hamanaka, A.; Wahyudi, S.; Oya, J.; Naung, N. Three-Dimensional Analysis of Gate-Entry Stability in Multiple Seams Longwall Coal Mine Under Weak Rock Conditions. Earth Sci. Res. 2020, 9, 1–72. [Google Scholar] [CrossRef]
- Pongpanya, P.; Sasaoka, T.; Shimada, H.; Hamanaka, A.; Wahyudi, S. Numerical Study on Effect of Longwall Mining on Stability of Main Roadway under Weak Ground Conditions in Indonesia. J. Geol. Resour. Eng. 2017, 3, 93–104. [Google Scholar] [CrossRef][Green Version]
- Pongpanya, P.; Sasaoka, T.; Shimada, H.; Ulaankhuu, B.; Oya, J.; Dwiki, S.; Karian, T. Numerical Study on Roadway Stability under Weak Geological Condition of PT Gerbang Daya Mandiri Underground Coal Mine in Indonesia. J. Geol. Sci. 2017, 3. [Google Scholar] [CrossRef]
- Sasaoka, T.; Mao, P.; Shimada, H.; Hamanaka, A.; Oya, J. Numerical Analysis of Longwall Gate-Entry Stability under Weak Geological Condition: A Case Study of an Indonesian Coal Mine. Energies 2020, 13, 4710. [Google Scholar] [CrossRef]
- Molinda, G.; Mark, C. Ground failures in coal mines with weak roof. Electron. J. Geotech. Eng. 2010, 15, 547–588. [Google Scholar]
- Zhou, G.; Zhao, Z.; Song, Z.; Wang, H. Stability Analysis and Protection Measures of Large Section Tunnel in Coal Rich Weak Rock Stratum. Geofluids 2021, 2021, 1–15. [Google Scholar] [CrossRef]
- Ghasemi, E.; Ataei, M.; Shahriar, K.; Sereshki, F.; Jalali, S.E.; Ramazanzadeh, A. Assessment of roof fall risk during retreat mining in room and pillar coal mines. Int. J. Rock Mech. Min. Sci. 2012, 54, 80–89. [Google Scholar] [CrossRef]
- Guney, A.; Gul, M. Analysis of surface subsidence due to longwall mining under weak geological conditions: Turgut basin of Yatağan-Muğla (Turkey) case study. Int. J. Min. Reclam. Environ. 2019, 33, 445–461. [Google Scholar] [CrossRef]
- Matsui, K.; Shimada, H.; Furukawa, H.; Kramadibrata, S.; Anwar, H. Ground control problems and roadheader drivage at Ombilin coal mine, Indonesia. In Proceedings of the 18th International Mining Congress and Exhibition of Turkey-IMCET, Antalya, Turkey, 10–13 June 2003; pp. 99–104. [Google Scholar]
- Sasaoka, T.; Shimada, H.; Lin, N.Z.; Takamoto, H.; Matsui, K.; Kramadibrata, S.; Sulistianto, B. Geotechnical issues in the application of rock bolting technology for the development of underground coal mines in Indonesia. Int. J. Min. Reclam. Environ. 2014, 28, 150–172. [Google Scholar] [CrossRef]
- Sasaoka, T.; Hamanaka, A.; Shimada, H.; Matsui, K.; Lin, N.Z.; Sulistianto, B. Punch multi-slice longwall mining system for thick coal seam under weak geological conditions. J. Geol. Resour. Eng. 2015, 1, 28–36. [Google Scholar] [CrossRef][Green Version]
- Garcia, A.; Altounyan, P.; Nitaramorn, A.; Lewis, A. Ground control aspects of a successful underground coal mine trial in weak strata in Indonesia. In Proceedings of the 29th International Conference on Ground Control in Mining, Morgantown, WV, USA, 27–29 June 2010; pp. 1–9. [Google Scholar]
- Zhang, P.; Gearhart, D.; Dyke, M.V.; Su, D.; Esterhuizen, E.; Tulu, B. Ground response to high horizontal stresses during longwall retreat and its implications for longwall headgate support. Int. J. Min. Sci. Technol. 2019, 29, 27–33. [Google Scholar] [CrossRef] [PubMed]
- Wang, F.; Zhang, C.; Zhang, X.; Song, Q. Overlying strata movement rules and safety mining technology for the shallow depth seam proximity beneath a room mining goaf. Int. J. Min. Sci. Technol. 2015, 25, 139–143. [Google Scholar] [CrossRef]
- Anderson, T. A comparison of shallow and deep mining. In Proceedings of the Deep Mining 2014: Proceedings of the Seventh International Conference on Deep and High Stress Mining, Sudbury, ON, Canada, 16–18 September 2014; pp. 181–187. [Google Scholar]
- Esterhuizen, G.S.; Tulu, I.B.; Gearhart, D.F.; Dougherty, H.; Van Dyke, M. Assessing support alternatives for longwall gateroads subject to changing stress. Int. J. Min. Sci. Technol. 2021, 31, 103–110. [Google Scholar] [CrossRef]
- Stanford, C.E. Coal Resources, Production and Use in Indonesia. In The Coal Handbook: Towards Cleaner Production; Osborne, D., Ed.; Woodhead Publishing: Sawston, UK, 2013; Volume 2, pp. 200–219. [Google Scholar]
- Widodo, S.; Oschmann, W.; Bechtel, A.; Sachsenhofer, R.F.; Anggayana, K.; Puettmann, W. Distribution of sulfur and pyrite in coal seams from Kutai Basin (East Kalimantan, Indonesia): Implications for paleoenvironmental conditions. Int. J. Coal Geol. 2010, 81, 151–162. [Google Scholar] [CrossRef]
- Ngueyep Mambou, L.L.; Ndop, J.; Ndjaka, J.M.B. Numerical investigations of stresses and strains redistribution around the tunnel: Influence of transverse isotropic behavior of granitic rock, in situ stress and shape of tunnel. J. Min. Sci. 2015, 51, 497–505. [Google Scholar] [CrossRef]
- Alehossein, H.; Poulsen, B.A. Stress analysis of longwall top coal caving. Int. J. Rock Mech. Min. Sci. 2010, 47, 30–41. [Google Scholar] [CrossRef]
- Yavuz, H. An estimation method for cover pressure re-establishment distance and pressure distribution in the goaf of longwall coal mines. Int. J. Rock Mech. Min. Sci. 2004, 41, 193–205. [Google Scholar] [CrossRef]
- Cheng, Y.; Wang, J.; Xie, G.; Wei, W. Three-dimensional analysis of coal barrier pillars in tailgate area adjacent to the fully mechanized top caving mining face. Int. J. Rock Mech. Min. Sci. 2010, 47, 1372–1383. [Google Scholar] [CrossRef]
- Itasca Consulting Group Inc. Fast Lagrangian Analysis of Continua in Three-Dimensions Manual, Ver. 5.0; Itasca: Minneapolis, MN, USA, 2012. [Google Scholar]
- Medhurst, T.; Hatherly, P.; Hoyer, D. Investigation of the relationship between strata characteristics and longwall caving behaviour. In Proceedings of the 14th Coal Operators Conference, University of Wollongong, Wollongong, Australia, 12–14 February 2014; pp. 51–62. [Google Scholar]
- Cheng, J.; Peng, S.S. Study on the factors influencing the load capacity of shield. In Advances in Coal Mine Ground Control; Peng, S.S., Ed.; Elsevier: Amsterdam, The Netherlands, 2017; pp. 35–65. [Google Scholar]
- Galvin, J.M. Longwall Mining. In Ground Engineering-Principles and Practices for Underground Coal Mining; Galvin, J.M., Ed.; Springer: Berlin, Germany, 2016. [Google Scholar]


| Rock | Compressive Strength (MPa) | Density (kg/m3) | Young’s Modulus (MPa) | Poisson’s Ratio | Cohesion (MPa) | Internal Friction Angle (°) | Tensile Strength (MPa) |
|---|---|---|---|---|---|---|---|
| Claystone (50 m) | 2.72 | 2095 | 268 | 0.28 | 0.14 | 33.08 | 0.38 |
| Claystone (100 m) | 4.84 | 2110 | 800 | 0.28 | 0.60 | 37.45 | 0.52 |
| Claystone (200 m) | 9.08 | 2140 | 1880 | 0.28 | 1.07 | 46.18 | 0.80 |
| Claystone (300 m) | 13.32 | 2160 | 2960 | 0.28 | 1.54 | 54.91 | 1.08 |
| Coal | 8.16 | 1380 | 1300 | 0.32 | 2.63 | 45.60 | 0.58 |
| Goaf | - | 1700 | 15 | 0.25 | 0.001 | 25 | - |
| Density (kg/m3) | Young’s Modulus (GPa) | Poisson’s Ratio | Cross-Sectional Area (cm2) | Maximum Yield Strength (MPa) | Second Moment Y-Axis (m4) | Second Moment Z-Axis (m4) | Polar Moment of Inertia (m4) |
|---|---|---|---|---|---|---|---|
| 7800 | 200 | 0.3 | 36.5 | 540 | 732 × 10−8 | 154 × 10−8 | 22 × 10−8 |
| Strata Strength | Compressive Strength (MPa) | Coefficient | |
|---|---|---|---|
| c1 | c2 | ||
| Hard Rock | >40 | 2.1 | 16 |
| Medium-hard Rock | 20–40 | 4.7 | 19 |
| Weak Rock | <20 | 6.2 | 32 |
| Shield Resistance Force (kN) | Applied Stress (MPa) | |||||
|---|---|---|---|---|---|---|
| CR2 | CR2.5 | CR3.2 | ||||
| Canopy | Base | Canopy | Base | Canopy | Base | |
| 6000 | A = 1.71 | B = 2.40 | A = 2.00 | B = 2.40 C = 0.50 | A = 2.40 | B = 1.20 |
| 8000 | A = 2.28 | B = 3.20 | A = 2.66 | B = 2.53 C = 0.66 | A = 3.20 | B = 1.60 |
| 10,000 | A = 2.85 | B = 4.00 | A = 3.33 | B = 3.16 C = 0.83 | A = 4.00 | B = 2.00 |
| 12,000 | A = 3.42 | B = 4.80 | A = 4.00 | B = 3.80 C = 1.00 | A = 4.80 | B = 2.40 |
| Depth | Canopy Ratio: CR | ||
|---|---|---|---|
| 2.0 | 2.5 | 3.2 | |
| 100 m |  | ||
| 200 m | |||
| 300 m | |||
| Depth | Canopy Ratio: CR | ||
|---|---|---|---|
| 2.0 | 2.5 | 3.2 | |
| 100 m |  | ||
| 200 m | |||
| 300 m | |||
| Depth | Shield Resistance Force (kN) | |||
|---|---|---|---|---|
| 6000 | 8000 | 10,000 | 12,000 | |
| 100 m |  | |||
| 200 m | ||||
| 300 m | ||||
| Depth | Shield Resistance Force (kN) | |||
|---|---|---|---|---|
| 6000 | 8000 | 10,000 | 12,000 | |
| 100 m |  | |||
| 200 m | ||||
| 300 m | ||||
| Depth | Stress Ratio: K | |||
|---|---|---|---|---|
| 0.5 | 1 | 1.5 | 2 | |
| 100 m |  | |||
| 200 m | ||||
| 300 m | ||||
| Depth | Stress Ratio: K | |||
|---|---|---|---|---|
| 0.5 | 1 | 1.5 | 2 | |
| 100 m |  | |||
| 200 m | ||||
| 300 m | ||||
| Depth | Stress Ratio: K | |||
|---|---|---|---|---|
| 0.5 | 1 | 1.5 | 2 | |
| 100 m |  | |||
| 200 m | ||||
| 300 m | ||||
| Depth | Stress Ratio: K | |||
|---|---|---|---|---|
| 0.5 | 1 | 1.5 | 2 | |
| 100 m |  | |||
| 200 m | ||||
| 300 m | ||||
Publisher’s Note: MDPI stays neutral with regard to jurisdictional claims in published maps and institutional affiliations. |
© 2022 by the authors. Licensee MDPI, Basel, Switzerland. This article is an open access article distributed under the terms and conditions of the Creative Commons Attribution (CC BY) license (https://creativecommons.org/licenses/by/4.0/).
Share and Cite
Mao, P.; Hashikawa, H.; Sasaoka, T.; Shimada, H.; Wan, Z.; Hamanaka, A.; Oya, J. Numerical Investigation of Roof Stability in Longwall Face Developed in Shallow Depth under Weak Geological Conditions. Sustainability 2022, 14, 1036. https://doi.org/10.3390/su14031036
Mao P, Hashikawa H, Sasaoka T, Shimada H, Wan Z, Hamanaka A, Oya J. Numerical Investigation of Roof Stability in Longwall Face Developed in Shallow Depth under Weak Geological Conditions. Sustainability. 2022; 14(3):1036. https://doi.org/10.3390/su14031036
Chicago/Turabian StyleMao, Pisith, Hiroto Hashikawa, Takashi Sasaoka, Hideki Shimada, Zhijun Wan, Akihiro Hamanaka, and Jiro Oya. 2022. "Numerical Investigation of Roof Stability in Longwall Face Developed in Shallow Depth under Weak Geological Conditions" Sustainability 14, no. 3: 1036. https://doi.org/10.3390/su14031036
APA StyleMao, P., Hashikawa, H., Sasaoka, T., Shimada, H., Wan, Z., Hamanaka, A., & Oya, J. (2022). Numerical Investigation of Roof Stability in Longwall Face Developed in Shallow Depth under Weak Geological Conditions. Sustainability, 14(3), 1036. https://doi.org/10.3390/su14031036