Article

An Interactive Visualization Tool for Collaborative Construction Logistics Planning—Creating a Sustainable Project Vicinity

1
Department of Science and Technology, Linköping University, Campus Norrköping, 60174 Norrköping, Sweden
2
The Swedish National Road and Transport Research Institute (VTI), MAP Unit, 58330 Linköping, Sweden
3
Division Digital System, RISE Research Institutes of Sweden AB, 43153 Mölndal, Sweden
*
Authors to whom correspondence should be addressed.
Sustainability 2022, 14(24), 17032; https://doi.org/10.3390/su142417032
Submission received: 10 October 2022 / Revised: 7 December 2022 / Accepted: 14 December 2022 / Published: 19 December 2022
(This article belongs to the Section Economic and Business Aspects of Sustainability)

Abstract

:
The intensity of urban development is presently high, creating a construction boom. The number of transports per project is a major consideration in urban goods transport and emissions from a project. Presently, the stakeholders take part in a “blame game” in assigning fault for the emissions from construction transport and the disturbances to society in the vicinity of construction sites. Incorporation of logistics into urban planning requires an increased understanding of the interaction between construction transport flows and urban land use, and the inclusion of different stakeholders. The purpose of the study is to support collaborative planning of construction transport in urban planning, and specifically to explore how a planning tool based on interactive visualization could be designed. An action research process has generated two prototypes of an interactive visualization tool for collaborative planning of construction transport. The prototype facilitates a “shared deliberation space” by identifying alternatives and assessing predicted consequences, which supports a collaborative urban planning process. Based on the research conducted, we claim that the responsibility of construction transport planning should be taken by the municipality, i.e., the urban planning and traffic planning functions.

1. Introduction

The intensity of urban development is presently high worldwide due to densification and urbanization, creating a construction boom of new houses, apartment buildings, workplaces, hospitals, schools, and supportive infrastructure. Furthermore, there is an ongoing and growing climate crisis raising the need to decrease greenhouse gas emissions (GHG). Urban planning practices are central in reaching goals toward more sustainable cities [1]. As an effect of urban development comes construction of transport. Construction is heavily dependent on logistics activities; according to Guerlain et al. [2], the cost of materials represents 30–40% of the overall construction cost and in general sites receives 2–10 deliveries or 8–10 tonnes of material per day. The number of transports per project make the construction transports account for at least 30% of the urban goods transports [2], and transports stand for about 10% of GHG emissions in a housebuilding project [3]. Therefore, the GHG emissions from construction are not negligible and construction logistics should be a natural part of urban planning practices.
Construction logistics can be divided into two primary functions: the management of logistics activities on construction sites (on-site logistics), and the transport of resources and materials to and from construction sites (off-site logistics) [4]. Logistics aim for resource efficiency, i.e., avoiding unnecessary movements. There is great potential to decrease GHG emissions of the construction industry through improved logistics [3,4], as presently construction transport efficiency is low [5,6].
Construction-related transports share the infrastructure with other road users and the additional transport load from construction transport increases congestion in the urban infrastructure [7,8], creating several different types of disturbances to the urban environment [9]. Thus, construction-related transport not only causes GHG emissions in itself; it also creates a lack of space and disturbances on the surrounding society and the transport system [10] that are experienced by different stakeholders. Stakeholders can be defined as individuals or groups of individuals who can influence the objectives of an organisation or be influenced by these objectives [5]. Fredriksson et al. [9] identify construction transport stakeholders as internal or external to the project, with internal stakeholders being those who are directly involved in construction projects and external stakeholders being those who are significantly affected by construction activities (e.g., neighbours, road users, local authorities), but are not part of the project.
The ability to decrease disturbances and environmental impact through improved construction logistics has not yet reached its full potential. Two reasons behind this are lack of logistical knowledge among municipalities conducting the transport and urban planning [11,12], and a remaining lack of focus on and understanding of logistics in the construction industry [5]. In most cases, these two reasons make construction logistics a forgotten question in the urban planning process [12], leading to a lack of demand on how to decrease its impact. However, to decrease the disturbances of construction transport, there is a need to see the interrelationships between construction logistics activities and urban planning [12], including environmental regulatory frameworks [13]. However, incorporating logistics into urban planning requires an increased understanding of the interaction between transport flows and urban land use, and the integration of different stakeholders into the planning [14]. Presently, there is a lack of planning tools providing an overview of the total transport demand (including both regular freight transport and construction transport) and the spatial impact of construction transport from a city perspective, as well as a lack of processes supporting the collaborative coordination of construction transport in urban planning. Therefore, the purpose of this paper is to present support to collaborative planning of construction transport in urban planning, and specifically to explore how a planning tool based on interactive visualization could be designed. By combining planning and visualization, this paper is providing a contribution towards a more integrated understanding of the topic of smart sustainable cities as asked for by [1].
Visualization in general refers to the visual rendering of data and information, and interactive visualization means visualization that can be manipulated and modified to present the data in different ways. In professional contexts, it is more or less unanimously agreed that interactive visualization can provide insight—supporting the exploration of a collection of data; understanding the overall character of the data; focusing attention on salient aspects of the data; discovering patterns, outliers, correlations between parameters; and so on.
Moreover, visualization is generally recognised as playing an important role in mediating and facilitating collaboration. There is a sense in which a visualization can serve as common ground for joint deliberation, providing a shared understanding of external conditions and constraints pertinent to the situation under consideration. An interactive visualization for collaborative use can become a platform for communicative action, providing a means of expression for proposals and counterproposals, as well as serving as a living repository documenting the current state of shared understanding along with a record of past deliberations and hitherto unresolved issues.
The general nature of this study is an explorative multidisciplinary or interdisciplinary one, where we bring specialist competencies together from the fields of urban planning, construction logistics, and interaction design to address the question of how the planning of urban construction projects can be improved to reduce the disturbances to city residents. We approach the question on two levels, one of which concerns working practices and processes for multi-stakeholder collaborative planning and the other aims towards designing an interactive visualization tool to be used in such planning practices and processes. There is a strong interdependence between these two levels, as is always the case; in any practice, tools and their uses co-determine each other. Our overall research method can be characterized as a qualitative single-case study of action research, and specifically the kind of action research that is known as constructive design research. In order to capture the context of where the tool is to be used, the research process has involved several different stakeholders such as traffic planners, urban planners, construction logistics consultants, developer/contractors, and IoT developers.
The paper is organised as follows: first, the theoretical background to the research areas in which the study is based are presented, and thereafter, the action research process. The results of the process are then introduced in the form of the prototype development, and finally, these are discussed, and conclusions are drawn.

2. Theoretical Background

The theoretical background first presents construction logistics to provide an understanding of its background; thereafter, urban planning and collaborative planning practices are discussed.

2.1. Construction Logistics

Construction logistics research is generated from two streams with different perspectives [15]. The first stream originates from a need to improve the efficiency of construction production, generally taking the perspective of the developer or main contractor. The second stream originates from the area of city logistics, taking the perspective of the municipality and its need to control construction transport within the city area to decrease the number of transports on a general level.
As a starting point in the first stream, the responsibility for planning and coordinating the supply chain and construction site resides with the main contractor [16]. As such, the main contractor faces the challenge of managing a large number of flows with different materials, products and resources to and from the construction sites [17]. From this perspective, [18] describe four roles that supply chain management (SCM) and logistics can play to improve coordination and enhance productivity in construction. [19] has further developed this work and introduced a fifth role. These five roles are: (1) focus on clarifying the interface between the supply chain and site activities with the goal of reducing the duration and cost of site activities through improved reliability in the delivery of goods and resources, (2) focus on improving the supply chain with the goal of reducing lead times and costs of transportation and inventory, (3) focus on improving logistics at the construction site to streamline materials handling times and decrease costs on site, (4) transfer activities from the site to the supply chain to improve conditions on site or to achieve a wider concurrency between activities with the goal of reducing costs and time, and (5) manage the site and the supply chain as an integrated domain to accomplish integrated supply-chain planning and clear roles and responsibilities among actors.
The second stream focuses on the municipality and their need to coordinate construction transport with the rest of the transports in the city. Previous studies, e.g., [20,21], have noted that cities and authorities have not traditionally focused on urban goods transport strategies or on coordinating the needs of different stakeholders. Instead, goods transport and logistics have been viewed as a problem for the logistics industry to solve [11]. However, construction logistics must compete for space with urban freight and public and private transport, as well as maintain a good relationship with residents and businesses in decreasing disturbances [9]. To handle these issues, municipalities have started to initiate logistics setups that coordinate flows to and from construction sites [22]. Findings by [22] show a clash between the incentives and goals of public actors with construction logistics, with the responsibility of reducing disturbances for third-parties, and the business models of private actors involved. Therefore, to some extent the demands set by public actors regarding the planning and control of construction logistics interfere with the logic in the business models of private contractors [22].
Construction logistics setup is a governance structure for a construction project that has been agreed on to control, manage, and follow-up the flow of materials, waste, resources, and personnel to/from/on the construction site [15]. These can include measures to control construction transport, such as terminals consolidating goods leading to less transports for the last mile into site, or check-points for controlling arrival times of transports going to site [15]. Through this, the number of transports can be decreased or distributed to a timewise point with less load on the urban transport network.

2.2. Urban Planning and Collaborative Planning

In Sweden the urban planning authority is the local municipality, which holds a land-use planning monopoly for its territory. The monopoly includes long-term planning on an overview level for the entire urban area(s) and detailed planning concerning specific land use matters, such as industry location, housing, transport, and water, wastewater, and energy systems for both public and private land within the urban area. The long-term overview planning of the entire area has no legal status but should be concerned as a vision or guideline for the more long-term development of the city. The detailed planning, on the other hand, has legal status and is necessary for application of building permit, which is obligatory for major renovations or new buildings within the urban area [23,24].
The municipality is the owner of transport infrastructure within the urban area, which is considered public land; therefore, the municipality is responsible for the planning of traffic and the long-term formation of infrastructure, as well as traffic lights, traffic signs, and more temporary solutions during constructions and events which need public land for their fulfilment [25,26]. Many Swedish municipalities are major landowners in their urban area; therefore, they sell land to private actors that will develop it into for example residential areas, shopping areas, or offices. Such processes may be organised in different manners, but often they are regulated in an exploitation treaty which regulates how the municipality and the private landowner should collaborate during the planning process, what should be built and when, and sometimes how the construction should be organised [27].
In summary, the Swedish municipalities are concerned with several layers of urban planning: overview planning, detailed planning, exploitation treaties, and temporary traffic planning. The detailed planning and the exploitation treaties regulate the finished result of a construction. However, during the construction process there is also need for planning of temporary solutions concerning transport and traffic, both in connection to the construction itself and in regards to the surrounding on-going urban life. Sometimes the exploitation treaties regulate these temporary solutions (e.g., [28] report on this). The short-term temporary solutions, which may be current over several years, are often not planned for in a systematic way; different functions within the municipality do not fully collaborate on these matters, and most planners lack tools for planning several temporary solutions together in a wider urban perspective. The temporary planning is mostly due to experience and tacit knowledge of the individual civil servant.
Goodman and Haslak [29] see the urban planners as the ones responsible for coordinating the logistics stakeholders in urban development. However, there is an inherent relationship between land use and logistics [30]. The decisions made by the municipalities regarding development areas and zoning plans, for example, restrict which decisions can be made by developers, which, in turn, restricts the possible action space for the main contractor and its supply chain. Based on this [31] has developed a description of the construction logistics system as consisting of three major subsystems: developer, main contractor, and municipality. According to Fredriksson and Huge-Brodin [31], to make change happen anywhere in the system or at the overall system level, a single actor or subsystem focus is not sufficient; it is important to understand the relationships between the subsystems and their actors, and how the subsystems influence each other, as decisions taken by actors in each of the subsystems have an effect on, and at the same time are restricted by, decisions in the other subsystems.
Planning is often described as a process of trying to make sense of the uncertain future and to be able to deal with it in a structural and organized way. The organization of planning and the actual planning practice are two important components of this sensemaking process and there are many different suggestions in the literature on how to structure these components effectively to deal with uncertainty [32]. In the case of construction logistics within the urban realm there are, as described above, a number of different actors involved in the construction logistics system [31] and even more external stakeholders who are affected by it. In such cases, the collaborative planning approach provides the idea of dialogue as a means to shape and develop institutional capacity for future actions that affect a number of actors [33,34,35,36]. If the actors get the possibility to collaborate and discuss solutions to a common problem, the decisions then taken by the planning authority may be considered more legitimate and possible to follow [36]. The complexity and number of actors and stakeholders within the construction logistics system, therefore, calls for collaborative planning processes on different levels, both between the subsystems and within the different subsystems. However, it is not simple to create a dialogue that actually develops institutional capacity for future actions, especially between actors driven by different logics and meanings [37]. Therefore, facilitators may be necessary, for example, to use boundary objects, which bring different actors together and make it possible for them to create common solutions despite having different objectives [38]. In the process described in this paper, we have started the creation of such a boundary object that may bring the actors within the construction logistics system together to be able to create common solutions. As Timms [39] argues, we are using forecasting models as a tool for communication, but in a visualized way to make it more accessible. Here we thus describe a process of making a boundary object for collaborative planning; a visualization tool based on forecasting transport flows for different planned construction projects.

3. Methodology

This paper presents the design and validation of the interactive visualization tool. Our overall research method is oriented towards the future in the sense that we want to present a new approach to collaborative planning of construction logistics in the urban planning process, including practices and processes as well as a supportive tool. This calls for an explorative qualitative research method as it provides a rich understanding of the context in which the problem exists, and is central for designing tools to be implemented in existing processes [40]. The research design followed the qualitative approach of action research described by [41,42], which highlight that the action research approach represents an interpretivist ontology, suggesting that knowledge is contextual and socially co-created. Action research implies iterative cycle of plan, check, do, and act combining research and application through both data collection and validating contributing to change [43]. Therefore, the research process is also a learning process, and one of the most important learning outcomes is increased and improved participant experiences [44].
This study has been part of the Vinnova-financed project Disturbance free cities (in Swedish: Störningsfri Stad). Disturbance free cities was a three-year project with the purpose of developing knowledge and competence that allow for the development of planning systems that can visualize the traffic impact of development and traffic plans during urban planning. In the action research process, the researchers bring their respective disciplinary expertise into an engagement with key stakeholders in attempting to understand the current situation, identify the most promising directions for improvement, envision a future situation and validate this envisioned future. Therefore, one important part in the design of the research process here was to identify how the research areas of construction logistics, urban planning, and visualization design could be combined to reach the goal of the Disturbance free cities project. To ensure that knowledge was exchanged between researchers and participants, we followed [42] and their practice of “academic plannings” for evaluating the visualization prototypes, but allowed the “local expertise” (i.e., the stakeholder groups) to adapt the prototypes to better support the actors and stakeholder needs during the collaborative planning process. The dual roles of the researchers to contribute to proposed change and to study the validity of the proposed change make this a typical example of multidisciplinary action research [41]. The context of the engagement is the city of Norrköping, Sweden, with key stakeholders including local urban planners, property developers and construction logistics companies and contractors. Norrköping is a midsize Swedish city with several large development projects planned, such as a new area close to the old port, a new railway station, and new high speed railway connection to Stockholm. This context is suitable for a single-case study [41], which is a very common way of deploying an action research project. During the action research process, we developed two visualization prototypes, which were validated with stakeholders through interviews and workshops.
The design of an interactive visualization tool for multi-stakeholder collaborative planning constitutes one of the two levels in this action research study. The design process broadly consists of growing an understanding of desirable collaborative planning practices and processes in the case study, and manifesting this understanding into concrete design of a prototype that illustrates functions and features deemed appropriate for facilitating the collaborative planning. The prototype is designed iteratively in a cycle of making concrete design proposals and validating them with key stakeholders. In terms of research methodology, this can be characterized as a part of action research known as constructive design research [45], where the practical design work forms an essential part of the knowledge production. Specifically, the way in which the design process is interdependent with the planning process level implies that it produces two kinds of knowledge in our case. First, there is the prototype itself embodying our growing understanding of what could be improved in collaborative planning of urban construction projects. Second, the insights gained throughout the design process inform the work on the planning process level.
A slightly more detailed view of the explorative design process comprises five overall stages: problem framing, concept development, a first prototype, validation, and a second prototype. The next section describes the execution of the five stages. However, we also note that the iterative design process weaves together three strands of practice reflecting the multidisciplinary organization of the research team: fieldwork in the form of interviews and workshops to identify key actors and their agendas and needs, the development of a simulation model capable of predicting urban transport flow, and the explorative design of an interactive visualization prototype intended to embody our emerging ideas of how collaborative planning could (or should) be done. Figure 1 provides a schematic overview of the design process.

4. Action Research Results—The Explorative Design Process towards a Collaborative Visualization Tool

This section summarizes the explorative design process, its outcomes, and its embodied claims.

4.1. Problem Framing

The process of urban planning is owned and controlled by the municipality, however, also involves the developers and contractors who are the ones responsible for the actual commencement and carrying through of the project. Initial fieldwork with urban and traffic planners and developers (i) using Future Workshop methods [46] suggested that
  • the effects on urban traffic flows represent the most significant negative impact of urban construction,
  • a big-picture plan for urban construction projects on a ten-year timescale can be constructed,
  • there are several alternatives for how the big-picture plan can be detailed,
If those alternatives could be explored and compared with respect to traffic flow impact, the big-picture plan could be improved significantly in terms of reducing urban disturbance.

4.2. Concept Development

These findings were taken as initial directions for the ideation of an interactive visualization concept realizing the notion of a shared deliberation space (ii) and projected in Figure 2. Some general interactive visualization design principles were identified and articulated as being particularly conducive to the goal of supporting shared deliberation, including linked views [47], overview plus details on demand [48], and the experiential quality of pliability [49].
The initial concept was based on the juxtaposition of three views (see Figure 2): (1) the project planning view, where a big-picture plan is constructed involving several urban construction projects; (2) the key effects view where the most important traffic flow impact measures are predicted in temporal synchronization with the project planning view; and (3) the map view showing the geotemporal integration of urban traffic flow impact. The main forms of interaction in the initial concept were planned to be experimentation with the big-picture plan in a Gantt-like representation and setting filters such as time window or time-of-day selection to control the integrated presentation in the map view.
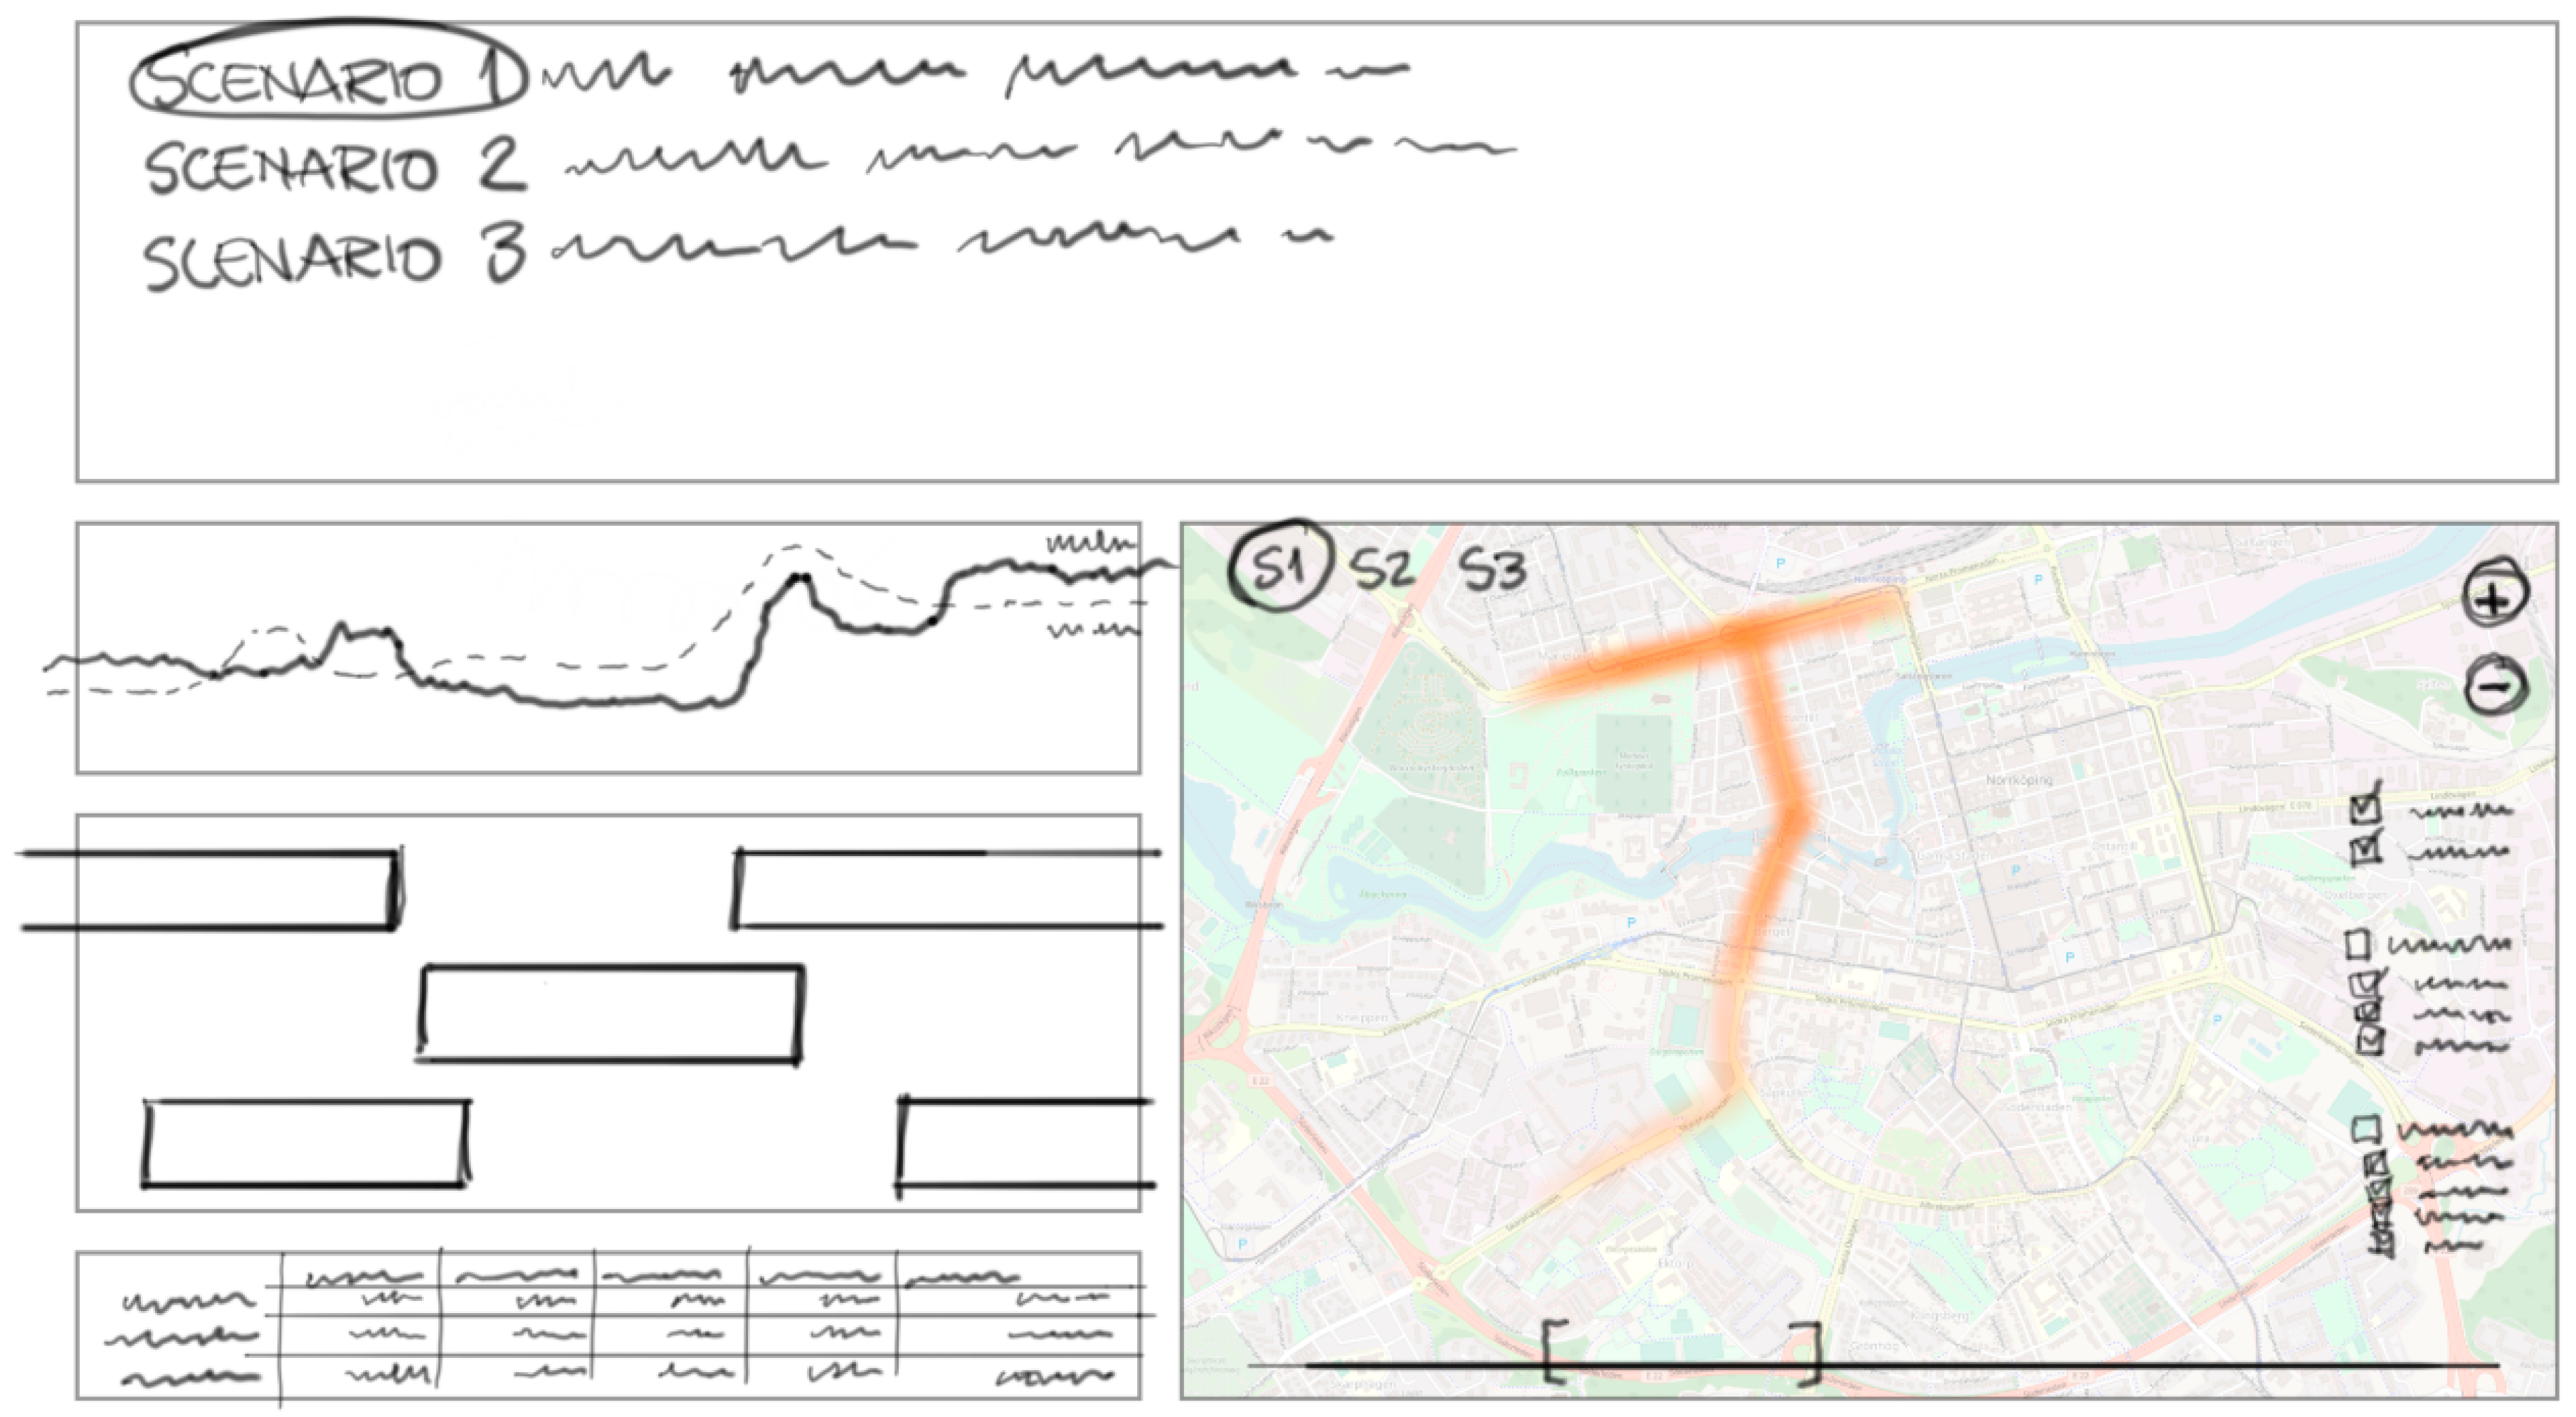
One important aspect from a project planning view was to identify what types of planning scenarios should be incorporated and what stakeholder perspectives they should represent. For instance, urban planning and traffic planning perspectives comprise planning scenarios such as closing off streets and issuing policies limiting hours of transport, whereas construction logistics perspectives imply measures such as using terminals for consolidation and check-points for setting time-slots for arrivals. At this early stage of the design process, we ended up considering planning scenarios that were limited mostly to syntactic manipulations of the Gantt diagram representation of the construction projects, such as changing starting times and durations of projects with the impact of moving the total transport burden of the city in large time steps forward and backward. Input from the fieldwork at this point suggested that we should also focus on daily impacts, such as traffic delay times and number of construction trucks as key effects, and that we should incorporate estimated costs per project in another dependent view. The result was an initial medium-fidelity interface sketch (see Figure 3).

4.3. The First Prototype

The next step in the design process consisted of a plan to bring front-end design of an interactive visualization interface ((iv) in Figure 1) together with the back-end development of the traffic flow simulation model ((iii) in Figure 1). Our goal was to convey the sense of an interactive tool calculating in real-time the effects of changes through the planning to the big-picture plan, but our resources did not allow for an actual implementation with those capabilities. We focused on creating a user story in which the interactive visualization was used to compare and refine three or four different big-picture plan planning scenarios. In this stage, the planning scenarios focused on different ways to combine a given number of planned urban construction projects in a ten-year timeframe (when to start and end a project) and to specify their construction logistics planning (if they are to use a terminal or check-point to control transports). Our plan was to pre-compute simulation model outcomes for all combinations of input parameters given by the use story and thus provide an interactive prototype that would perform correctly within the use story limits.
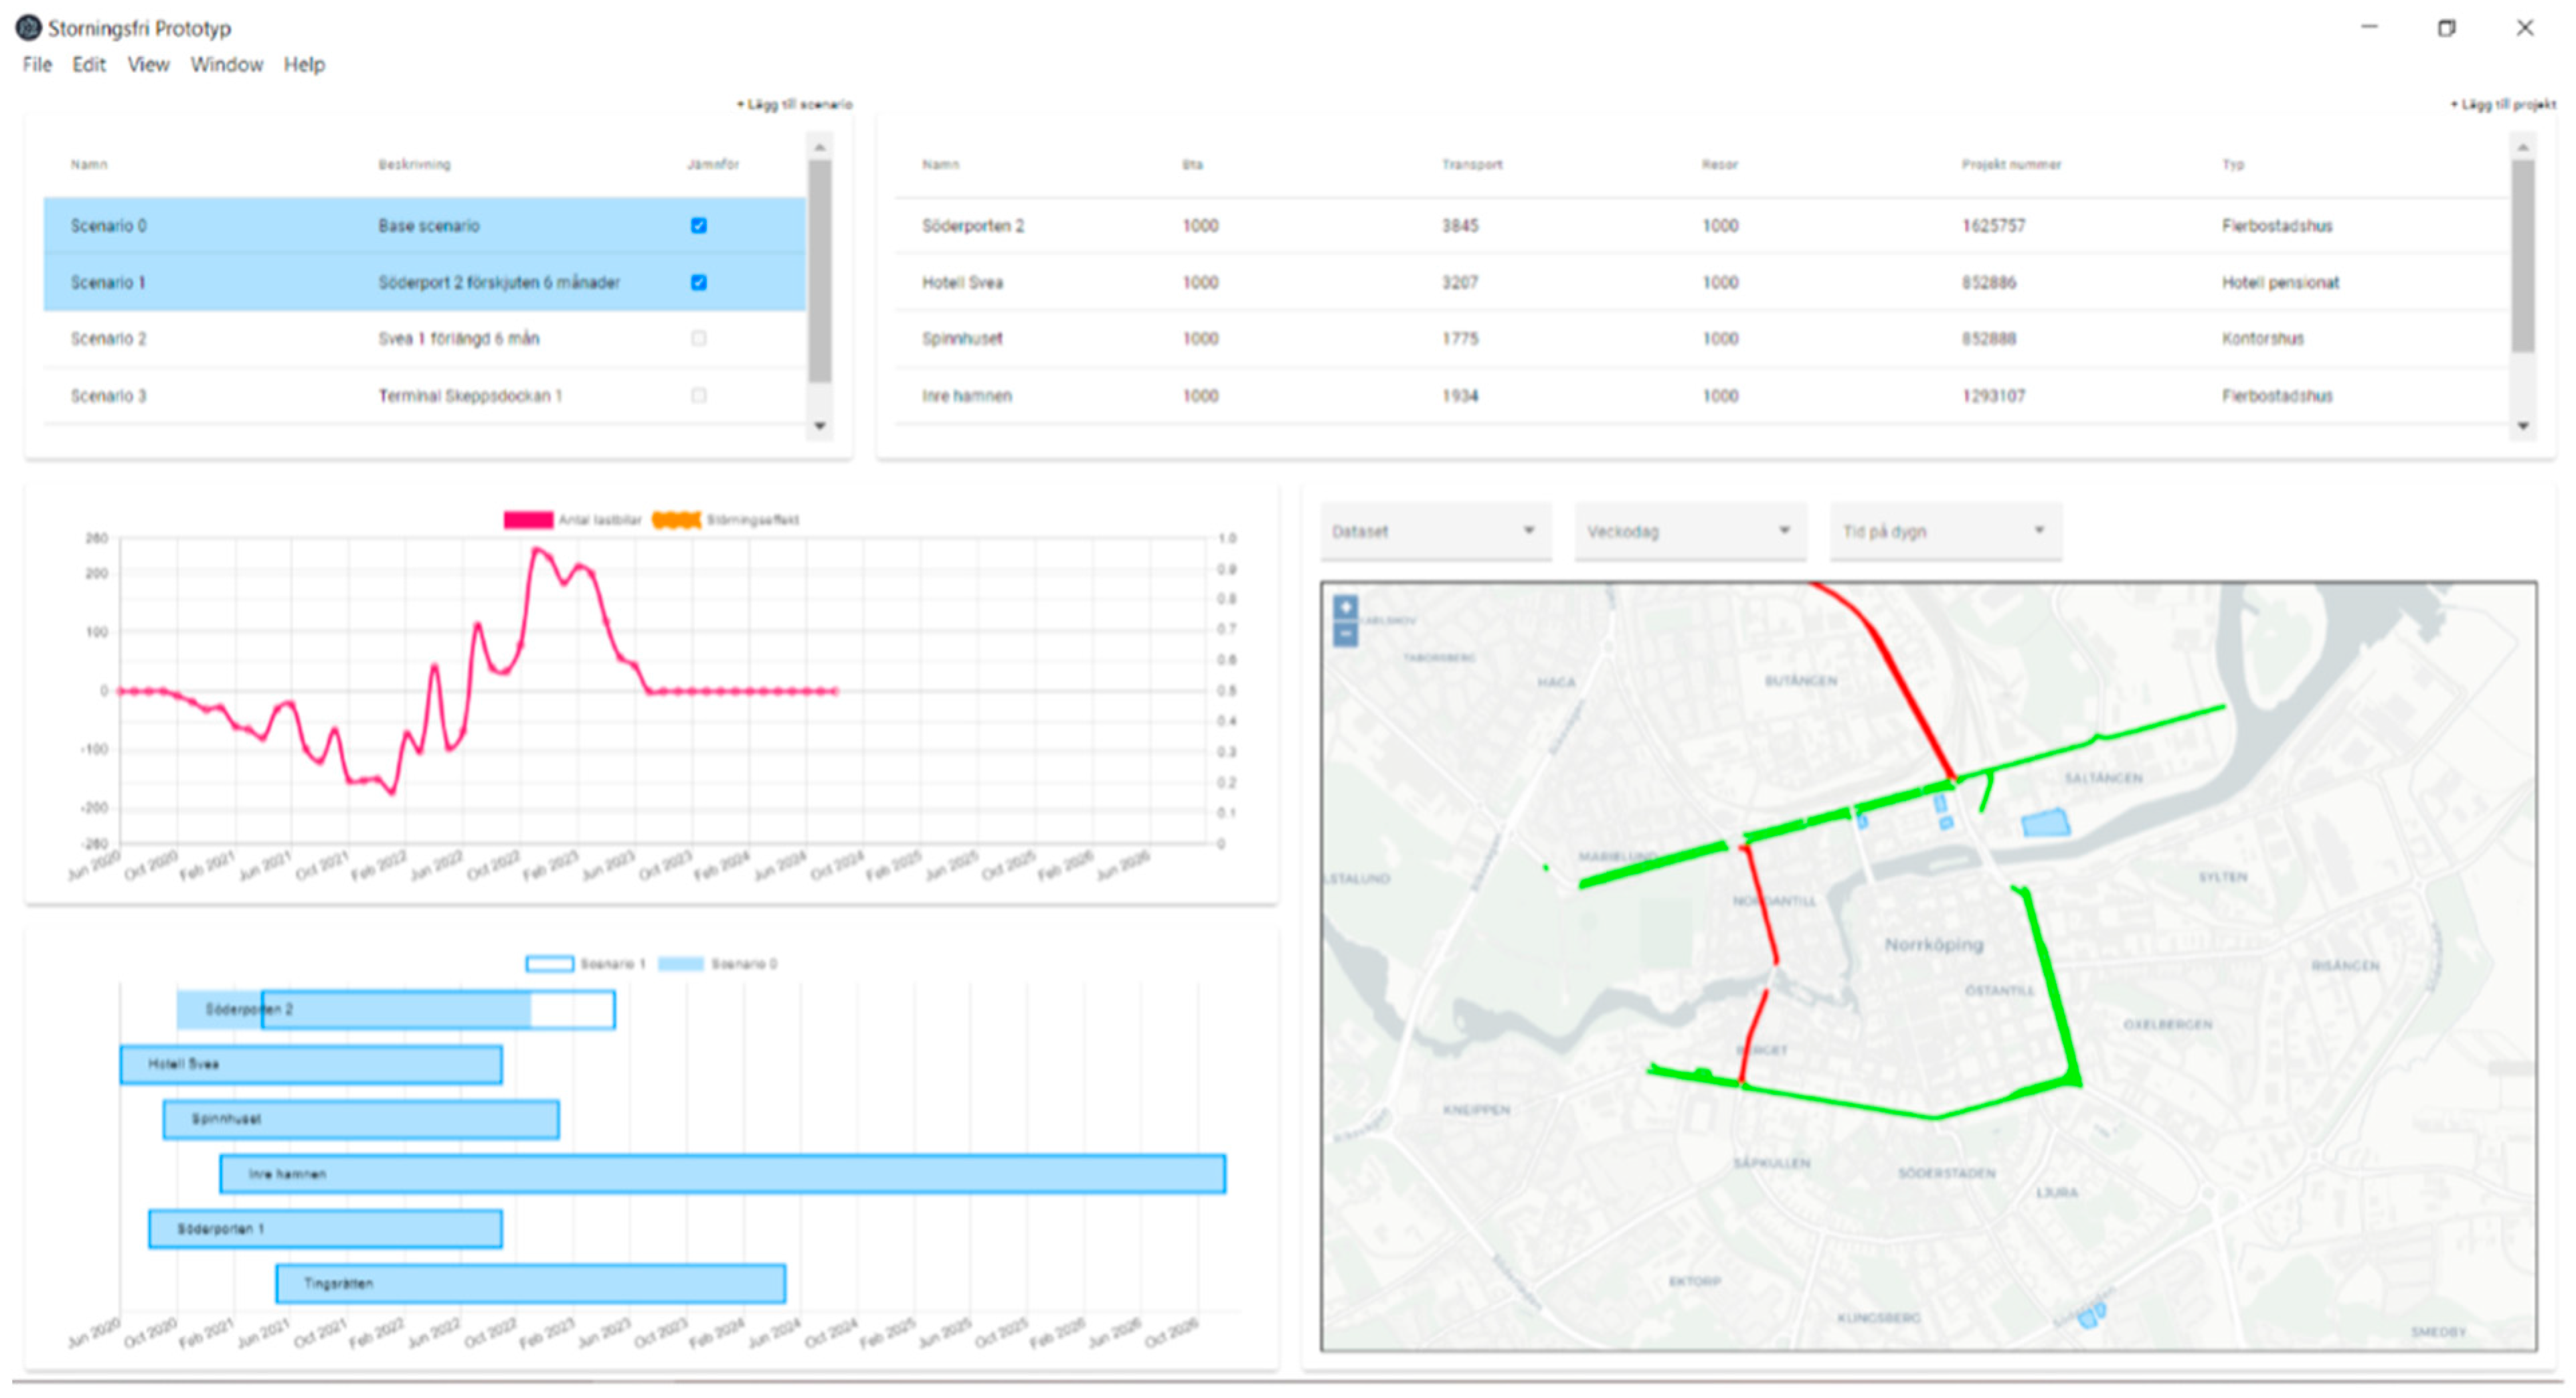
The decision to focus on the user story of three or four planning scenarios also reminded us that the visualization should provide interaction touchpoints for the scenarios (top pane). The resulting interface sketches (Figure 4) formed the basis for the implementation of a first working prototype (Figure 5).
The prototype (Figure 5) essentially worked as intended, with the ability to inspect and compare different scenarios (top left pane) for the big-picture plan of several urban construction projects (lower left pane). When two scenarios are selected and compared, the key effect’s view and map view change to show variation around a baseline of no difference between the two scenarios. The key effects shown are the total number of trucks for the included projects (top left pane) and the traffic delay effects (lower right pane). In the picture, we compare scenario 1 (where the start of project “Söderporten 2” is delayed) to scenario 0. Scenario 0 presents the situation of no action to handle the construction transports total effects. We can see how it would result in fewer trucks from February 2021 to June 2022, then more trucks until June 2023. We can also see in the map view how the traffic situation in terms of delay would improve on the green-marked links but become worse on the red-marked links. The main differences between the prototype and the previous sketches were that information about the urban construction projects being considered in the big-picture scenarios was included (top right pane) and that the cost estimates per project were omitted.

4.4. Validation

The prototype was validated in two steps. First, three focus group sessions ((v) in Figure 1) were conducted during November and December 2020. The focus of these were on the actual design of the visualization tool. The focus groups included 12 persons in total representing municipal urban and traffic planners. The selection of the participants was based on our fieldwork, which had provided strong indications that municipal ownership of the planning process and the interactive visualization would be the most productive way forward. Second, validation was conducted in March 2021. This part was workshop based and focused on how the tool would be used in a collaborative planning process. The workshop included 15 persons in total representing urban planners, traffic planners, developers, construction logisticians, and contractors.
The results of the validation indicated that a collaborative planning tool like the one envisioned in the prototype would be a valuable resource in the work of engaging all concerned stakeholders in the coordination of urban construction projects. Our assumption about municipal ownership was confirmed. Several possible improvements were identified, mainly concerning the accuracy and usefulness of impact simulation and how it is visualized in the key effects and map views. It was also indicated that more detailed control of construction traffic routing and other performance requirements would be needed in real planning situations.

4.5. The Second Prototype

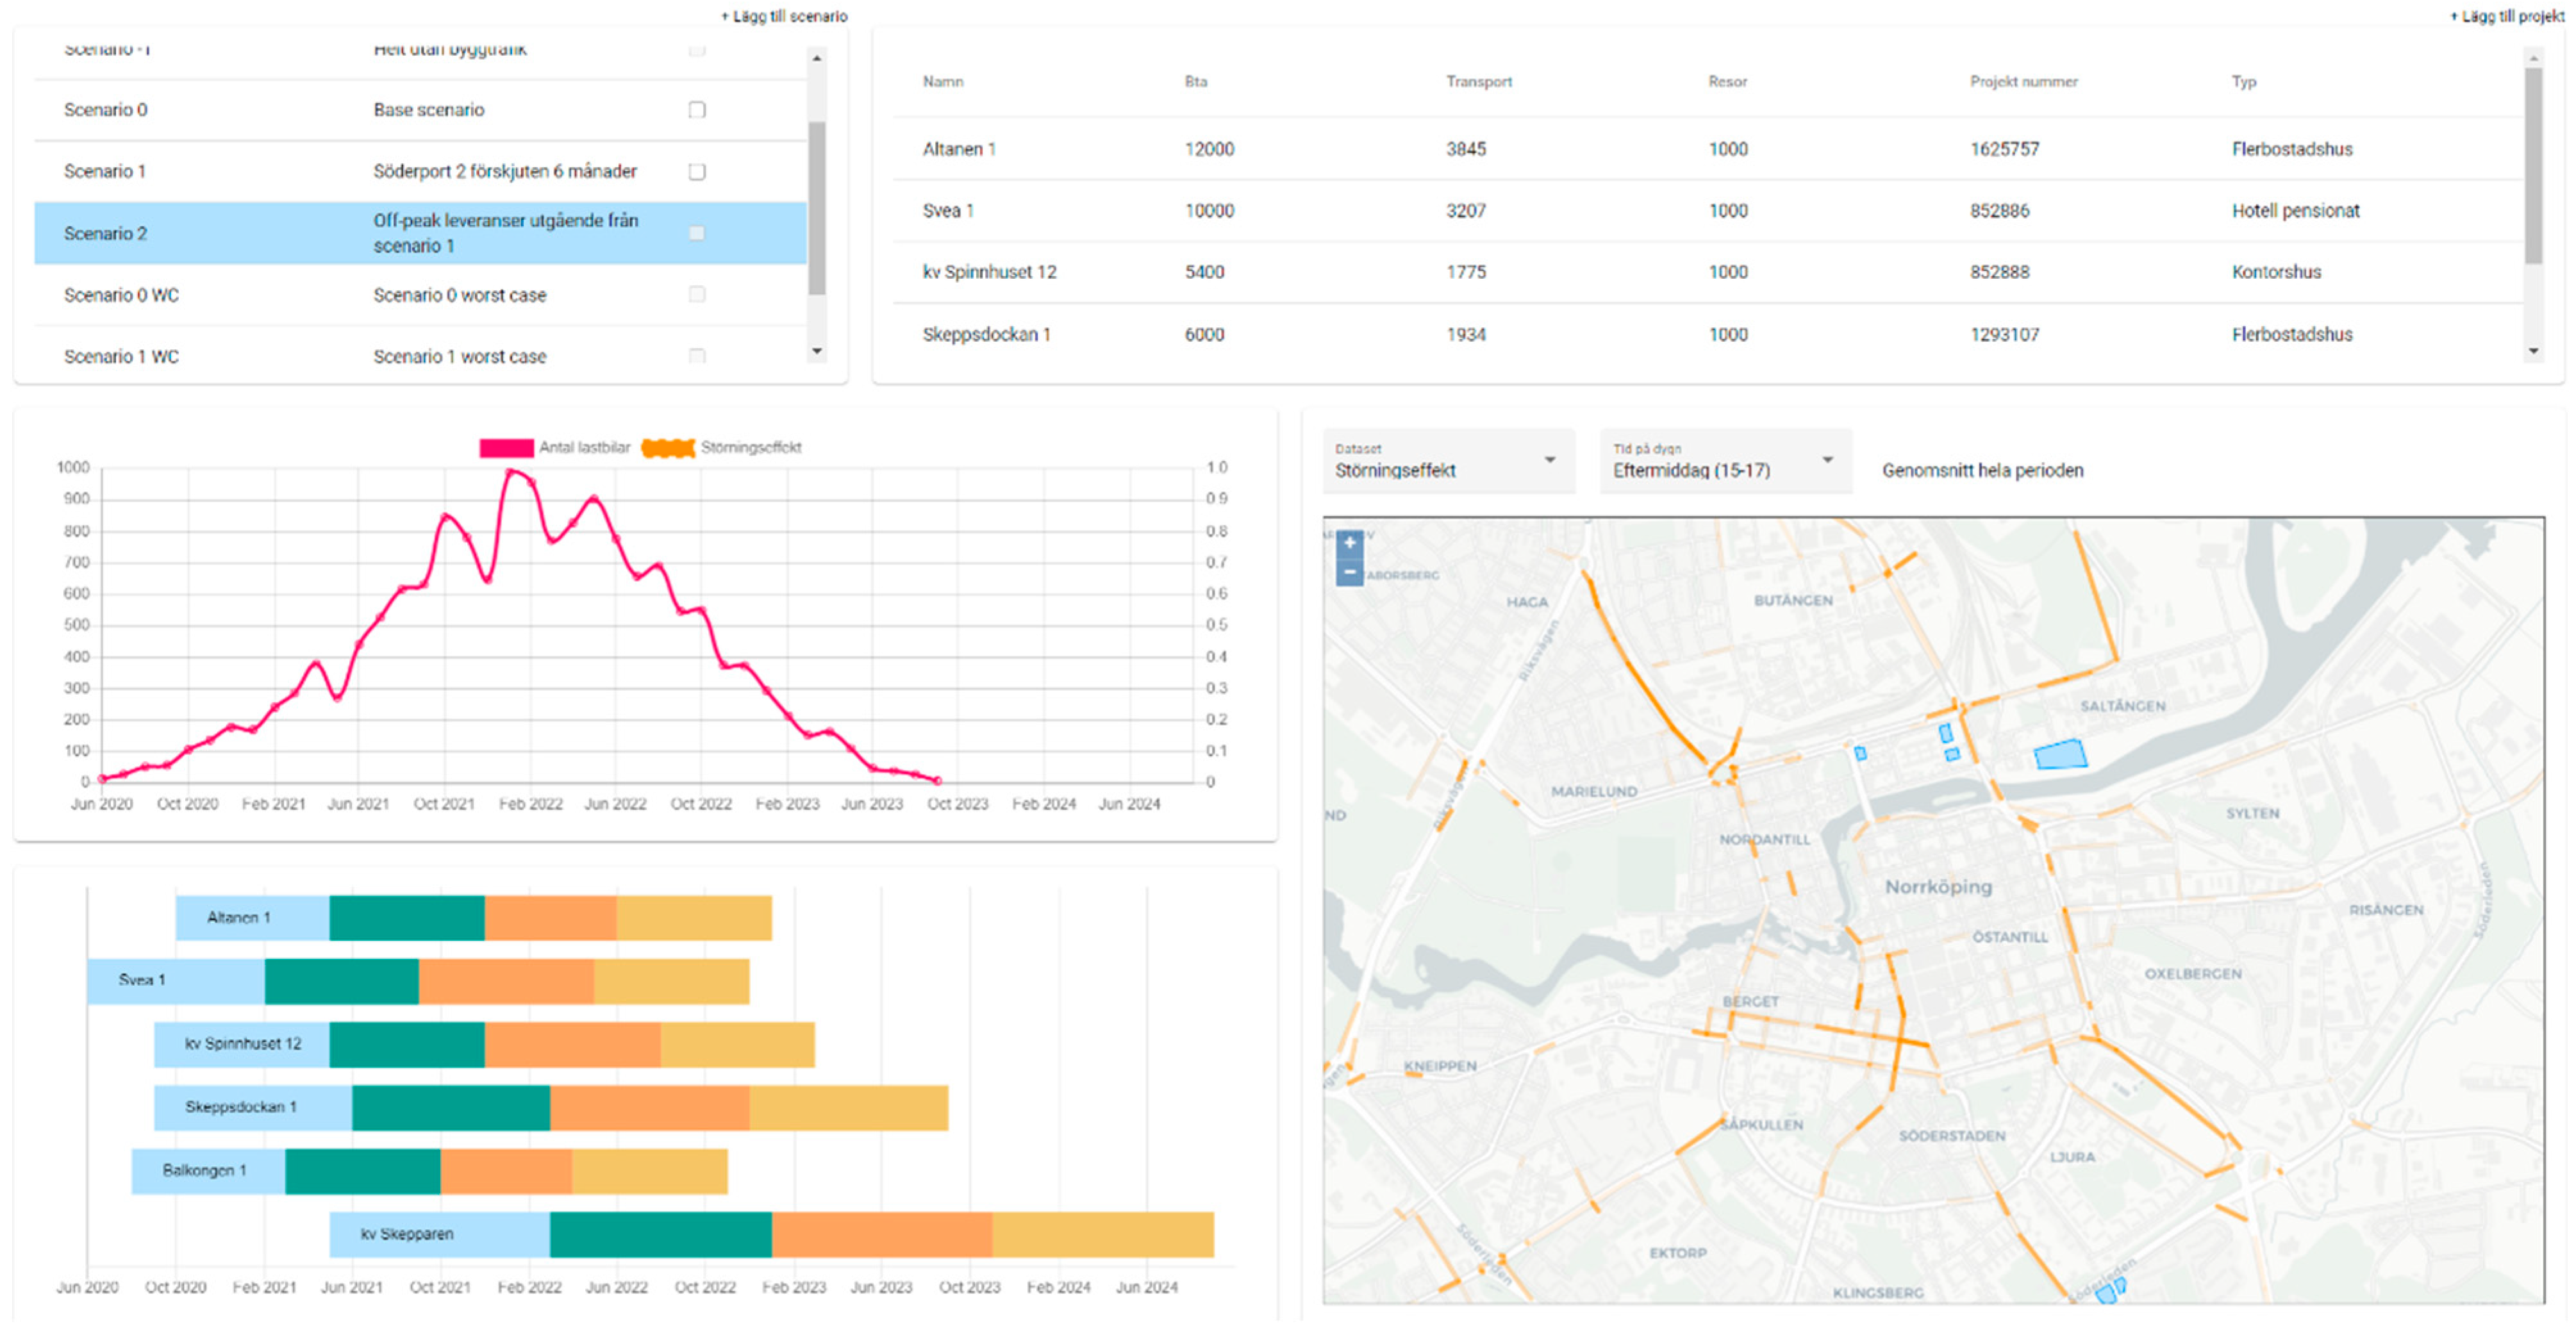
The results of the validation, combined with new input from the fieldwork (vi), yielded a design direction (viii) for a revised prototype (Figure 6). An important improvement for the external validity and utility of the revised prototype concerns the data used and presented, where the traffic flow simulation model (vii) uses empirically calibrated data and the urban construction projects being planned are more closely modeled on actual construction plans, including the different phases of the construction projects. Another improvement is the ability to focus on specific time intervals within the full planning period. The most important improvement, however, concerns the planning scenarios. In the revised prototype, the previous planning scenarios illustrating the effects of shifting the start and end times of construction projects were complemented with new planning scenarios drawing on more substantial construction logistics knowledge and findings from our ongoing fieldwork ((i), (v), (vi) in Figure 1). For example, Figure 6 shows the predicted effects of a planning scenario implementing an off-peak delivery policy; the revised prototype also contains planning scenarios based on construction logistics setups such as the use of cargo terminals. In a sense, the revised prototype thus illustrates how our multidisciplinary, practice-oriented project moves towards a synthesis of professional planning needs with research-based knowledge in traffic flow simulation and construction logistics.

5. Conclusions

The purpose of this paper was to present support to collaborative planning of construction transport in urban planning, and specifically to explore how a planning tool based on interactive visualization could be designed. The purpose was fulfilled through an explorative action research case study, during which a visualization tool was designed and validated through an iterative process. The study has generated two prototypes of an interactive visualization tool for collaborative planning of construction transport. Based on the validation of these prototypes the following hypothesis is developed; This prototype may facilitate communication between stakeholders by identifying alternatives and assessing their predicted consequences (a “shared deliberation space”), and that this is indeed potentially useful in a collaborative urban planning process facilitated and owned by the municipality. As this is a hypothesis generated from qualitative research, further research is needed to verify this through more tests and quantitative evaluations.
This research followed an action research approach as we aimed to explore a question that would require the combination of different areas of research on construction transport planning and disturbances, including academic and professional knowledge in the intended context. Construction transport has been a forgotten question in urban planning [12], leading to a lack of ownership of the question. Presently, the stakeholders take part in a “blame game” on whose fault it is, so nobody takes responsibility for planning construction transport from an urban perspective, thus leading to increased emissions and disturbances in vicinity of projects. Based on the action research process used, we were able to make the hypothesis that the responsibility of construction transport planning should be taken on by municipality actors, and specifically the urban planning and traffic planning functions. They are, therefore, proposed to be the future owners of the visualization tool and the initiators of a collaborative planning process. Through this, the disturbances of construction transports will decrease as questions regarding how to organize logistics within and between projects will be discussed based on the impact of transports from the same perspective on the urban space. Consideration will be given to risks of queues, noise, dust, and vibration disturbances to citizens in the vicinity of construction projects as well as along the main roads used to go between the city’s outskirts and the project. These questions are not discussed today, at least not in Sweden, though all participants in the study highly value the evaluation of such questions as part of the collaborative planning process, as supported by the designed and validated visualization tool prototype.
That the municipality actors should take a greater ownership of logistics is not a new claim (e.g., [11]); however, there are also researchers (e.g., [50]) arguing against public interventions in a private market. This is true for logistics in general, but the construction logistics system is different compared to the general logistics system [31] as the municipal actors are the ones controlling the land use (how urban space is utilized for different activities) and the construction project. Thereby, the construction logistics are dependent on the decisions made regarding land use. Furthermore, when we validated our prototype, we could see that the municipal actors (urban planners) are the only ones who have the overview of the total amount of ongoing and planned construction projects in an urban area, and as traffic planners, they also can set limitations regarding routing, delivery hours, and types of vehicles through policies. Without the support of a tool like the prototype, the question of construction transport is not visible to them, and they thereby do not prioritize the same. The action research process has pinpointed the importance of municipal ownership, as the key output effects have shifted during the prototype development from a cost focus (construction stakeholder focus) to a disturbance focus mainly considering queues and traffic delays (municipal stakeholder focus). This move from a construction project tool to an urban planning tool has been agreed upon by all the involved stakeholders. However, as has been shown in the action research process, the municipal actors have so far lacked the ability to see the disturbances and hence the transport implications of urban planning decisions as they have not had the access to a tool visualizing the combined effects of construction transport and general traffic from an urban view, i.e., what disturbances the transports causes to the general public also further away than the immediate vicinity [9]. The prototype developed in this project aims to fill that gap.
The action research process has not only been a learning process for the stakeholders, but also for the researchers. Taking on the work of developing prototypes has forced discussions among researchers from different disciplines, which would otherwise not have taken place as the actual process of making something together requires making concrete decisions. Therefore, we would like to claim that the prototyping process acts as a catalyst for multidimensional interdisciplinary learning. During the development of the prototype, the researchers have had to agree on the functionality of the prototype. This has been especially clear regarding the development of the planning scenarios, which is shown in the difference between prototype 1 and prototype 2. The prototype had to visualize the difference between planning scenarios, hence the key output effects (disturbances) had to be impacted by the planning scenarios. In prototype 1, the planning scenarios were rather generic, illustrating mostly superficial manipulations of project start and end times. However, in prototype 2 we had developed an understanding of how construction logistics planning impact the traffic output and vice versa; therefore, we were able present explicit planning scenarios with effects on different disturbances, which the actors saw as potential discussion during a collaborative planning process.
As a final concluding remark, we would like to highlight remaining work to take the prototype into a tool fully supporting a collaborative multi-stakeholder planning process. The prototype shows the output effect of traffic delays on specific roads; however, this is not enough to fully understand the disturbances that construction traffic creates. In [9], more than 40 types of disturbances are presented and distributed over three zones in geographic relation to the construction site, where most of them appear close to the sites. The question remaining is how to be able to zoom in and out in the tool to capture the disturbances related to the immediate surrounding of a construction project and how to handle issues specific to construction logistics, such as unloading zones, creating cues outside gates, and the use of public space for construction activities during the project time. Ref. [12] also shows the need to be able to incorporate more than one stakeholder perspective. This is something that needs to be incorporated in a future prototype, as the present version has focused on the municipality need for an overview of the total amount of planned and ongoing projects, excluding aspects such as the costs of logistics setups. Finally, during the interviews, stakeholders have expressed a need to be able to visualize the uncertainty of planning. All planning is about viewing a future state, which is built on forecasts based on historic data. Therefore, plans are uncertain. It is a general challenge, and to some extent an open research question, to visualize forecasts and predictions in ways that support well-grounded decision and action without instilling a false sense of security. Visualizing predicted disturbances arising from construction transport is no exception in this regard.

Author Contributions

Data curation, D.E.; Writing—original draft, A.F., L.E. and J.L.; Writing—review & editing, N.L.; Visualization, D.E. All authors have read and agreed to the published version of the manuscript.

Funding

This work was supported by the Swedish Innovation Agency (VINNOVA) under Grant 2018-04114.

Data Availability Statement

Not applicable.

Conflicts of Interest

The authors declare no conflict of interest.

References

  1. Giles-Corti, B.; Moudon, A.V.; Lowe, M.; Adlakha, D.; Cerin, E.; Boeing, G.; Higgs, C.; Arundel, J.; Liu, S.; Hinckson, E.; et al. Creating healthy and sustainable cities: What gets measured, gets done. Lancet Glob. Health 2022, 10, e782–e785. [Google Scholar] [CrossRef] [PubMed]
  2. Guerlain, C.; Renault, S.; Ferrero, F. Understanding Construction Logistics in Urban Areas and Lowering Its Environmental Impact: A Focus on Construction Consolidation Centres. Sustainability 2019, 11, 6118. [Google Scholar] [CrossRef] [Green Version]
  3. Sezer, A.A.; Fredriksson, A. Environmental impact of construction transport and the effects of building certification schemes. Resour. Conserv. Recycl. 2021, 172, 105688. [Google Scholar] [CrossRef]
  4. Ghanem, M.; Hamzeh, F.; Seppänen, O.; Zankoul, E. A new perspective of construction logistics and production control: An exploratory study. In Proceedings of the 26th Annual Conference of the International Group for Lean Construction, Chennai, India, 16–22 July 2018; GonzáLez, V.A., Ed.; pp. 992–1001. [Google Scholar]
  5. Sundquist, V.; Gadde, L.-E.; Hulthén, K. Reorganizing construction logistics for improved performance. Constr. Manag. Econ. 2018, 36, 49–65. [Google Scholar] [CrossRef]
  6. Naz, F.; Fredriksson, A.; Kjellsdotter-Ivert, L. The potential of improving construction transport time efficiency—A freight forwarder perspective. Sustainability 2022, 14, 10491. [Google Scholar] [CrossRef]
  7. Neghabadi, P.D.; Samuel, K.E.; Espinouse, M.-L. Systematic literature review on city logistics: Overview, classification and analysis. Int. J. Prod. Res. 2019, 57, 865–887. [Google Scholar] [CrossRef]
  8. Behrends, S.; Lindholm, M.; Woxenius, J. The Impact of Urban Freight Transport: A Definition of Sustainability from an Actor’s Perspective. Transp. Plan. Technol. 2008, 31, 693–713. [Google Scholar] [CrossRef] [Green Version]
  9. Fredriksson, A.; Angelakis, V.; Gundlegård, D.; Sezer, A. Construction related urban disturbances: Identification and linking with an IoT-model. Autom. Constr. 2022, 134, 104038. [Google Scholar] [CrossRef]
  10. Kooragamage, R. Managing construction logistics for confined sites in urban areas. In Supply Chain Management and Logistics in Construction: Delivering Tomorrow’s Built Environment; Lundesjö, G., Ed.; Kogan Page: London, UK, 2015; pp. 205–224. [Google Scholar]
  11. Lindholm, M.; Behrends, S. Challenges in urban freight transport planning—A review in the Baltic Sea Region. J. Transp. Geogr. 2012, 22, 129–136. [Google Scholar] [CrossRef]
  12. Janné, M.; Fredriksson, A.; Billger, M.; Brusselears, N.; Fufa, S.M.; Al-Fahel, R.; Mommens, K. Smart Construction Logistics Governance—A systems view of construction logistics in urban development. In Proceedings of the 57th ISOCARP World Planning Congress, Doha, Qatar, 8–11 November 2021. [Google Scholar]
  13. Hu, W.; Dong, J.; Hwang, B.-G.; Ren, R.; Chen, Z. A Scientometrics Review on City Logistics Literature: Research, Trends, Advanced Theory and Pracitce. Sustainability 2019, 11, 2724. [Google Scholar] [CrossRef]
  14. Sanchez-Diaz, I.; Browne, M. Accommodating urban freight in city planning. Eur. Transp. Res. Rev. 2018, 10, 55. [Google Scholar] [CrossRef]
  15. Fredriksson, A.; Janné, M.; Rudberg, M. Characterizing Third-party Logistics Setups in the context of construction. Int. J. Phys. Distrib. Logist. Manag. 2021, 51, 325–349. [Google Scholar] [CrossRef]
  16. Azambuja, M.; O´Brien, W.J. Construction supply chain modeling: Issues and perspectives. In Construction Supply Chain Management Handbook, 1st ed.; O’Brien, W.J., Formoso, C.T., Vrijhoef, R., London, K., Eds.; Taylor & Francis Group: Abingdon, UK, 2009. [Google Scholar]
  17. Lundesjö, G. Consolidation centres in construction logistics. In Supply Chain Management and Logistics in Construction: Delivering Tomorrow’s Built Environment, 1st ed.; Lundesjö, G., Ed.; Kogan Page: London, UK, 2015; pp. 225–242. [Google Scholar]
  18. Vrijhoef, R.; Koskela, L. The four roles of supply chain management in construction. Eur. J. Purch. Supply Manag. 2000, 6, 169–178. [Google Scholar] [CrossRef]
  19. Ekeskär, A.; Rudberg, M. Third-party logistics in construction: The case of a large hospital project. Constr. Manag. Econ. 2016, 34, 174–191. [Google Scholar] [CrossRef] [Green Version]
  20. Ballantyne, E.E.F.; Lindholm, M.; Whiteing, A. A comparative study of urban freight transport planning: Addressing stakeholder needs. J. Transp. Geogr. 2013, 32, 93–101. [Google Scholar] [CrossRef]
  21. Fossheim, K.; Andersen, J. Plan for sustainable urban logistics—Comparing between Scandinavian and UK practices. Eur. Transp. Res. Rev. 2017, 9, 52. [Google Scholar] [CrossRef] [Green Version]
  22. Hulthén, K.; Sundquist, V.; Eriksson, V.; Fredriksson, A.; Janné, M. The role of public actors in construction logistics: Effects on and of relational interfaces. Constr. Manag. Econ. 2021, 39, 791–806. [Google Scholar] [CrossRef]
  23. Montin, S.; Wikström, J. Moderna Kommuner; Liber: Malmö, Sweden, 2004. [Google Scholar]
  24. Nyström, J.; Tonell, L. Planeringens Grunder: En Översikt; Studentlitteratur: Lund, Sweden, 2012. [Google Scholar]
  25. SKR. TRAST—Trafik för en Attraktiv Stad, Handbok; LTAB: Linköping, Sverige, 2015. [Google Scholar]
  26. SKR. Gatuarbete i Tätort; LTAB: Linköping, Sweden, 2019. [Google Scholar]
  27. SKR. Kommunal Mark, Markanvisningar; LTAB: Linköping, Sweden, 2022. [Google Scholar]
  28. Janné, M.; Fredriksson, A. Construction logistics governing guidelines in urban development projects. Constr. Innov. 2019, 19, 89–109. [Google Scholar] [CrossRef] [Green Version]
  29. Goodman, A.S.; Hastak, M. Infrastructure Planning Handbook—Planning, Engineering and Economics; McGraw Hill Construction: New York, NY, USA, 2006. [Google Scholar]
  30. World Economic Forum. The Future of the Last-Mile Ecosystem, Transition Roadmaps for Public- and Private-Sector Players; World Economic Forum: Cologny, Switzerland, 2020. [Google Scholar]
  31. Fredriksson, A.; Huge-Brodin, M. Green Construction Logistics—A Multi-actor Challenge. Res. Transp. Bus. Manag. 2022, 45, 100830. [Google Scholar] [CrossRef]
  32. Adelfio, M.; Hamiduddin, I.; Miederna, E. Londons´s King´s Cross Redevelopment: A compact, resource efficient and “liveable” global city model for an era of climate emergency? Urban Res. Pract. 2021, 14, 180–200. [Google Scholar] [CrossRef]
  33. Fischer, F.; Forester, J. The Argumentative Turn in Policy Analysis and Planning; Duke University Press: Durham, NC, USA, 1993. [Google Scholar]
  34. Healey, P. Collaborative Planning: Shaping Places in Fragmented Societies; UBC Press: Vancouver, BC, Canada, 1997. [Google Scholar]
  35. Healey, P. Collaborative Planning in perspective. Plan. Theory 2003, 2, 101–123. [Google Scholar] [CrossRef] [Green Version]
  36. Tornberg, P. Making Sense of Integrated Planning: Challenges to Urban and Transport Planning Processes in Sweden. Ph.D. Thesis, Architecture and the Built Environment, KTH Royal Institute of Technology, Stockholm, Sweden, 2001. [Google Scholar]
  37. Berger, P.L.; Luckmann, T. The Social Construction of Reality: A Treatise in the Sociology of Knowledge; Anchor Books: New York, NY, USA, 1967. [Google Scholar]
  38. Star, S.L.; Griesemer, J.R. Institutional Ecology, ‘Translations’ and Boundary Objects: Amateurs and Professionals in Berkeley’s Museum of Vertebrate Zoology, 1907–1939. Soc. Stud. Sci. 1989, 19, 387–420. [Google Scholar] [CrossRef]
  39. Timms, P. Transport models, philosophy and language. Transportation 2008, 35, 395–410. [Google Scholar] [CrossRef]
  40. Farquhar, J.; Michels, N.; Robson, J. Triangulation in industrial qualitative case study research: Widening the scope. Ind. Mark. Manag. 2020, 87, 160–170. [Google Scholar] [CrossRef]
  41. Coughlan, P.; Coghlan, D. Action research for operations management. Int. J. Oper. Prod. Manag. 2002, 22, 220–240. [Google Scholar] [CrossRef]
  42. Abrahamsen, M.H.; Henneberg, S.C.; Huemer, L.; Naudé, P. Network picturing: An action research study of strategizing in business networks. Ind. Mark. Manag. 2016, 59, 107–119. [Google Scholar] [CrossRef] [Green Version]
  43. Rönnbäck, Å. Co-creation of Value in Public Transportation—A Quality Management Perspective. Ph.D. Thesis, Chalmers University of Technology, Göteborg, Sweden, 2010. [Google Scholar]
  44. Wallén, G. Vetenskapsteori och Forskningsmetodik; Studentlitteratur: Lund, Sweden, 1996. [Google Scholar]
  45. Koskinen, I.; Zimmerman, J.; Binder, T.; Redström, J.; Wensveen, S. Design Research through Practice: From the Lab, Field and Showroom; Morgan Kaufmann: Middlesex County, MA, USA, 2012. [Google Scholar]
  46. Jungk, R.; Müllert, N. Future Workshops: How to Create Desirable Futures; Institute for Social Inventions: London, UK, 1987. [Google Scholar]
  47. Wills, G. Linked data views. In Handbook of Data Visualization; Chen, C., Härdle, W., Unwin, A., Eds.; Springer: Berlin/Heidelberg, Germany, 2008; pp. 217–241. [Google Scholar]
  48. Shneiderman, B. The eyes have it: A task by data type taxonomy for information visualizations. In Proceedings of the IEEE Symposium on Visual Languages, Boulder, CO, USA, 3–6 September 1996; IEEE Computer Society Press: Washington, DC, USA, 1996; pp. 336–343. [Google Scholar]
  49. Löwgren, J. Pliability as an experiential quality: Exploring the aesthetics of interaction design. Artifact 2007, 1, 85–95. [Google Scholar] [CrossRef] [Green Version]
  50. Li, L.; Bao, H.X.H.; Robinson, G.M. The return of state control and its impact on land market efficiency in urban China. Land Use Policy 2020, 99, 104878. [Google Scholar] [CrossRef]
Figure 1. Process diagram of the research process, roman numerals are references used to the figure in the text in Section 4.
Sustainability 14 17032 g001
Figure 2. September 2019 Concept sketch.
Sustainability 14 17032 g002
Figure 3. October 2019 Interface sketch.
Sustainability 14 17032 g003
Figure 4. March 2020 interface sketch.
Sustainability 14 17032 g004
Figure 5. September 2020, the first prototype.
Sustainability 14 17032 g005
Figure 6. The second prototype.
Sustainability 14 17032 g006
Publisher’s Note: MDPI stays neutral with regard to jurisdictional claims in published maps and institutional affiliations.