Article

Estimating the Generation of Discarded Mobile Phones and Highlighting Areas for Recycling Precious Metals from Printed Circuit Boards in Thailand

1
International Programs in Hazardous Substance and Environmental Management, Graduate School, Chulalongkorn University, Bangkok 10330, Thailand
2
Center of Excellence on Hazardous Substance Management, Chulalongkorn University, Bangkok 10330, Thailand
*
Author to whom correspondence should be addressed.
Sustainability 2022, 14(24), 17025; https://doi.org/10.3390/su142417025
Submission received: 10 November 2022 / Revised: 7 December 2022 / Accepted: 9 December 2022 / Published: 19 December 2022

Abstract

:
Over the last decade, Thailand imported approximately 21 million units of new mobile phones every year, equivalent to 262 million. While technology changes, consumers want the newest model to serve their lifestyle. These discarded mobile phones will be a challenging issue for waste management systems because of the metals in mobile phones, especially in printed circuit boards (PCBs). Sufficient and sustainable management is needed to maximize the benefits of recycling metals and minimize potential risks to public health. This study aims to estimate the possible range of DMP generation in Thailand (2012–2021) with the Approximation 2, Simple Delay, and Time Step methods using the government published data and a literature review. The results show that the discarded mobile phones ranged from approximately 1700 to 2500 tons/year, equivalent to 0.027 to 0.038 kg/year/capita over the last ten years. In 2021, more than half of the total mobile phone waste generated in the northeastern and central areas of Thailand was around 468.73 and 325.14 tons/year, respectively. Additionally, 1.28 tons of precious metals (Ag, Au), 5.33 tons of rare earth elements, and 7.26 tons of toxic metals (As, Cd, Cr, Pb) can be found in the PCB waste of DMPs.

1. Introduction

In 2020, mobile cellular subscriptions worldwide increased by over 10-fold. They increased from 0.74 billion to 8.27 billion subscriptions since 2000, exceeding the global population at 7.76 billion for the year 2020. East Asia and the Pacific accounted for 36.39% of total subscriptions globally. China had the highest number of mobile subscriptions at 1718.41 million by the end of 2020 [1,2]. Thailand had the highest penetration rate of mobile subscriptions per 100 people in Southeast Asia in 2020 at 166.61%, followed by Singapore and Vietnam with 144.05% and 142.73%, respectively [3]. For example, each person in Rio de Janeiro, Brazil, has around two mobile phones [4], and 47.95% of respondents in the UAE purchased a new mobile phone every year [5]. Approximately 43–50% of unused mobile phones were stored at home [6,7].
The telecommunications market in Thailand has been increasing year by year. Approximately 130.28 million units of mobile phones were imported to Thailand between 2009 and 2014, as reported by the National Broadcasting and Telecommunication Commission (NBTC) [8], and telephones for cellular networks or other wireless networks were imported at approximately 26.24 million units per year from 2012 to 2021 [9]. More than 7300 models from 600 brands of mobile cellular phones were launched into the telecommunications market from 2003 to 2020 [10]. According to the survey on the number of mobile phone users in Thai households in 2021, 94.7% of Thai people aged 6 year and above used mobile phone. Considering the number of mobile phone users by region, the central area had the highest ratio of phone users at 30.52% of the total users in the whole country, followed by the northeastern area (26.32%), and the northern area (16.10%). Meanwhile, Bangkok had the highest penetration rate, or the number of mobile phone users per 100 people, which was 97.4% [11].
The increasing consumption and the decreasing lifespan caused by the evolution of electronic products prompt the discarding of unused mobile phones [12,13]. The lifespan of mobile phones ranges from 1.76 years to 4 years in different countries [13,14,15]. Furthermore, mobile phone waste was defined as the category of small IT and telecommunications equipment in the global e-waste report. This category of waste accounted for approximately 4.7 million tons or 8.76% of total e-waste generation in 2019. Moreover, the amount of global e-waste in 2030 was forecasted to increase by 39.36% compared with the generated e-waste in 2019 and exceeds 9 kg/capita [16].
Mobile phones contain a variety of metals in varying concentrations depending on the component. Many studies have investigated the metal concentration in printed circuit boards (PCBs), LCD screens, and lithium-ion batteries [17,18,19]. Especially, PCBs are the most valuable components that contain precious metals such as gold, rare earth elements, and platinum-group metals [19,20,21]. For instance, gold was reported at 300-350 g/ton of cellular handsets. This was higher than mining gold from primary ores, which was reported at 5 g of gold from 1 ton of ore [22]. Additionally, smartphones had a higher silver, gold, and palladium content than cellular phones [23]. The estimated metals from seven EEE products (including mobile phones) had an economic worth of over USD 67.45 million in Rio de Janeiro, Brazil [4], and mobile phones are in the top five of the highest-value products for recycling in Malaysia [24]. On the other hand, some toxic metals such as arsenic, cadmium, and lead in discarded mobile waste can have negative impacts on the environment and human health [21,25].
The mobile phone is grouped into the telephone category, one of seven categories of waste from electrical and electronic equipment, or e-waste, and WEEE, the municipal hazardous waste from Thai households. According to the Hazardous Waste Situation in Thai Communities in 2021, e-waste accounted for around 65% or 435,187 tons of total municipal hazardous waste. The telephone waste generated was estimated at approximately 25,200 tons. Only 22% of total e-waste generation was collected and treated in a proper manner, as reported by the Pollution Control Department (PCD) [26].
In terms of e-waste regulation and law in Thailand, the draft of the WEEE Management Act (B.E....), which is based on the Extended Producer Responsibility (EPR) concept, has been revised after taking into account comments from the public hearing held on the website from April to May 2021. In this draft, the discarded mobile phone was classified as controlled e-waste under the WEEE Management Act (B.E....) [27]. Additionally, on July 2021, the draft of the WEEE Integrated Management Action Plan 2022–2026 was uploaded to the website for public consultation. The five categories of WEEE in the action plan, including telephones/mobile phones, computers, televisions, refrigerators, and air conditioners targeted a collection rate of 10% or higher of the total expected WEEE generation in 2026. No less than 10% of the total expected WEEE generation in 2026 will be disassembled, recycled, and disposed of properly [28,29].
Even though the WEEE act has not been enforced in Thailand, many organizations have launched e-waste collection projects to raise awareness of the proper disposal of EEE products. Unused mobile phones and batteries were collected at around 40 tons in 2017 and 36.89 tons between 2019 and 2021 and treated with proper management [26,30,31,32]. This presents a positive trend in the cooperation from stakeholders in both public and private sectors to support the collection process of e-waste.
Several estimation methods could be used to forecast the potential amount of DMP generation, such as approximation 1, consumption and use, market supply A, Time Step, population balance model (PBM), and system dynamic model. These models have been used in studies in Brazil, China, Colombia, Dubai, Iran, and Korea [6,13,15,33,34,35]. Moreover, different estimation methods were applied to compare the results of WEEE generation and identify applicable methods for each product, including mobile phones, laptops, desktops, TV, refrigerators, and washing machines [36].
It was observed that Thailand’s historical trend of waste generation rate, waste generation per user, and a comparison of estimation methods for discarded mobile phones are limited. Previous studies have estimated the waste generated in the studied period. For example, around 956 tons were generated in 2003, as estimated by the sale quantities and replacement factor [37]; 10.9 million units were generated in 2016 (expected to be produced at 13.42 million units in 2021) [38]; and 3,764 tons of mobile phone waste was produced in 2019, as estimated by the consumption and use method [39].
Hence, this study aims to (1) present the possible amount of DMP generation and DMP generation per capita in Thailand between 2012 and 2021 with different estimation methods including Approximation 2, Time Step, and Simple Delay—the input parameters have been replaced with continuous data from authoritative organizations and a literature review; (2) evaluate the quantities of recycling metals and toxic metals in the PCB waste of discarded mobile phones in Thailand in 2021; and (3) highlight the density of DMP generation in Thailand (2021) by province. The results from this study will assist policymakers in managing WEEE in Thailand. Moreover, it also supports the circular economy and sustainable development goals (SDGs) such as good health and well-being (SDG 3) and sustainable development goal 12 (SDG 12).

2. Materials and Methods

2.1. Study Area and Definition

Thailand, located in Southeast Asia, has a land area around of 514,000 km2. The maximum distance from north to south is approximately 1600 km, while east to west is approximately 870 km [40]. The total population in Thailand was 66.17 million people, with a population growth rate of 0.26% (22.63 million households), in 2021 [41]. Additionally, the total population aged 6 years and above was 63.98 million people, and 13.07% live in Bangkok, the capital city. There are 77 provinces, classified into five study areas: central (25 provinces), northeastern (20 provinces), northern (17 provinces), southern (14 provinces), and Bangkok [11]. The list of provinces in each area of the study is presented in Appendix A. The highlighting map of the study area is shown in Figure 1. Unused mobile phones or mobile phone waste is defined as discarded mobile phones (DMPs).

2.2. Objectives

According to the draft of the WEEE Management Act (B.E....) and the WEEE Integrated Management Action Plan 2022–2026 discarded mobile phones will be controlled in the future. The improvement of the collection rate and the proper disassembly, recycling, and disposal of generated waste can enhance the efficiency of waste management [27,28,29].
The aim of this study was to prepare supporting information for mobile phone waste management in Thailand because the historical trends of waste generation rate, density maps of waste generated at the provincial level, and the potential amount of rare earth elements (REEs) of discarded mobile phones in Thailand are limited. The objectives are listed as follows: (1) to estimate the possible range of DMP generation (tons/year) by different estimation methods (Approximation 2, Simple Delay, Time Step method); (2) to estimate the waste generated per capita in Thailand between 2012 and 2021; (3) to assess the potential for recycling metals and toxic metals in printed circuit boards (PCBs) in DMP generation in 2021; and (4) to construct a province-level density map of the generation rate and stock of discarded mobile phones in Thailand in 2021.

2.3. Estimation of the Discarded Mobile Phone Waste (DMP) Generation in Thailand (2012–2021)

2.3.1. Possible Range for DMP Generation

Selecting the estimation method for DMP generation, the estimation method can be adapted from WEEE estimation, which can be calculated with several methods [13,15,33,34,35]. The Approximation 2, Simple Delay, and Time Step methods require a few variables, including the quantities of sales, stocks, or use of mobile phones, average weight, and average lifespan, which are shown in Table S1 (Supplementary Material) [36].
The methodology of the estimation procedure for discarded mobile phones is adapted from the explanation of WEEE estimation methods by M. Ikhlayel, (2016) [36]. The summarized calculation method is presented below.
Approximation   2 :   D M P s   w t = S t
Simple   Delay :   D M P s   w t = S t L
Time   Step :   D M P s   w t = S t S t t S t t 1
S t = I t + P t E t
where the waste generation of discarded mobile phones in the year t is denoted by DMPs w(t). S(t) in the sale of mobile phones in a year (t) is calculated in Equation (4) by subtracting the amount of export, E(t), from the sum of import and export, I(t) + P(t), in a year (t). L is the average lifespan of a mobile phone. S(t − L) is the number of mobile phones sold in the year (t − L). St(t) is the stock of mobiles phone in a year (t). St(t − 1) is the stock of mobile phones in a year (t − 1). In this study, the estimation period covered the historical and presented discarded mobile phone (DMPs) generation in Thailand starting from 2012 to 2021. The production of mobile phones was assumed to be zero. The average lifespan and average weight of mobile phones were assumed at 2 years, 3 years, and 4 years [13,14,15] and 110 g/unit [33,35,42,43,44], respectively. Hence, the required data for these estimation methods are the annual imports and sales of mobile phones from 2008 to 2021 obtained from Thai Customs. The Harmonized System (HS) code of telephones for cellular networks or other wireless networks (HS-code 85171200) was assumed to be the mobile phone [9]. The stock of mobile phones in use was assumed to be equal to the number of mobile subscribers or active numbers in Thai’s telecom network [43]. The number of mobile subscribers between 2011 and 2021 was obtained from the office of the National Broadcasting and Telecommunications Commission (NBTC) [45]. The details of all required data are presented in Table S2 (Supplementary Material). The results of DMP generation from all estimation methods were calculated and the average value is presented as the DMP generation rate in Thailand (million units/year and tons/year).

2.3.2. DMPs Generated per Person

The annual waste produced per person is the indicator used to monitor waste intensity and compare it to other areas and countries [46,47]. The WEEE or e-waste generation per capita in each piece of equipment was calculated to identify the higher production rate, such as mobile phones, laptops, desktops, and refrigerators [33,36]. The number of DMPs produced per person for a year (t) is expressed in Equation (5).
D M P s   g e n e r a t i o n   p e r   p e r s o n   t   = D M P s   g e n e r a t i o n   r a t e   t   T o t a l   n u m b e r   o f   p o p u l a t i o n   t  
where D M P s   g e n e r a t i o n   t is the amount of discarded mobile phone generation in a given year (t). T o t a l   n u m b e r   o f   p o p u l a t i o n   t is the total number of a population in a given year (t). In this study, the produced waste per person was calculated from the years 2012 to 2021. Thus, the required data for waste generated per capita were the DMP generation rate (ton/year) from 2012 to 2021, which was obtained from the average value of estimated DMP generation from all methods in the year (t) in Section 2.3.1. The number of persons from registration in Thailand is published by National Statistical Office [48]. The data are presented in Table S3 (Supplementary Material).
Equation (5) is adapted to calculate the DMPs generated per household in Thailand from 2012 to 2021 by replacing the total number of populations with the total number of households, expressed in Equation (6).
D M P s   g e n e r a t i o n   p e r   h o u s e h o l d   t   = D M P s   g e n e r a t i o n   t   T o t a l   n u m b e r   o f   h o u s e h o l d   t  
The number of households in Thailand is published by the National Statistical Office [49]. The data are presented in Table S4 (Supplementary Material). The average weight of a mobile phone was assumed to be 110 g/unit [33,35,42,43,44]. The results of the DMPs generated per capita and the DMPs generated per household are expressed as kg/year/capita and kg/year/household, respectively.

2.3.3. Density Map of DMP Generation in Thailand (2021) by Province

The intensity of mobile phone waste generation by area, especially at the provincial level, can be guided or identified as the potential area to establish the collection and recycling center. This will enhance the efficiency of mobile waste management. Thus, the DMPs generated in 2021 by province were calculated by multiplying the DMPs generated per person with the total number of populations in each province, which will be expressed as tons/year. Moreover, the results are presented in a geographic map chart in Microsoft Excel.

2.4. Estimation of Precious and Toxic Metals in the PCBs from DMPs Generated in Thailand (2021)

The main components of a mobile phone can be categorized into PCBs, batteries, and display units, while the mass fraction (weight/weight) fluctuation could be caused by the different models, brands, and evolution of mobile phones [20,23,34,50,51,52]. The results are presented in Table S5 (Supplementary Material).
However, PCBs are important components because they contain various metals, including precious metals, base metals, and toxic metals. The metal elements can be categorized into six groups, including iron and ferroalloys (Co, Fe, Mn, Mo, Ni), base metals (Al, Sb, Cu, Sn, Zn), precious metals (Ag, Au), rare earth elements (REEs) (Ce, Sc, Th, Ti, V, Zr), and platinum-group metals or PGMs (Pd, Pt), by considering the Mineral Import of Thailand list and critical minerals in mineral commodity summaries [53,54]. As, Cd, Cr, and Pb have been identified as toxic metals that could harm the environment and human health [21,25].
The range of the metal concentrations of twenty-four elements in the PCBs from mobile phone waste from the literature review is presented in Table 1 [19,20,21,23,34,50,51,55,56,57].
After having obtained the average value of the discarded mobile phone generation rate, the potential quantities of metals in the PCBs from discarded mobile phones were calculated by multiplying the annual generation of PCBs in DMP generation with the average weight of metals. The formula to calculate the metals in the annual PCBs from DMPs can be adapted from the calculation of metals in mobile phone wastes and is expressed in Equation (7) [13].
m k t = D M P s   g e n e r a t i o n   t     ×   m a s s f r a c t i o n   o f   PCBs   in   DMPs   ×   C k i n   P C B s
where m k t is the quantity of metal k in a year (t).   m a s s f r a c t i o n   of   PCBs   in   DMP is the mass fraction of PCBs in discarded mobile phones. C k   i n   P C B s is the average weight of metal k in printed circuit boards (PCBs). In this study, the quantities of metal in the PCBs from discarded mobile phones generated in Thailand in 2021 were estimated. As a result, the required data were the 2021 DMPs generated from the average value of waste estimation in Section 2.3.1, expressed in tons/year. The average mass fraction of PCBs in a mobile phone was computed. The mass fraction of PCBs in DMPs was assumed to be 0.23 on average. The details are presented in Table S5 (Supplementary Material) [20,23,34,50,51,52]. Table 1 was used to calculate the average weight of metal k per PCB, expressed as kg of metal k per ton of PCBs (kg of metal/ton of PCBs).

2.5. Data Sources

The present and historical generation of discarded mobile phones in Thailand is limited. The main sources of data for this study are secondary data obtained from published reports, national statistical data, database websites, research studies, literature reviews, and data assumptions. This saves time and resources from data collection. However, the reliability and consistency of data have been considered.

3. Results and Discussion

3.1. Estimation of Discarded Mobile Phone (DMP) Generation

3.1.1. Possible Range of DMP Generation

The amount of discarded mobile phone generation in Thailand between 2012 and 2021, by applying each estimation method, is presented in Table 2. The average value of DMP generation in each year was computed and is presented in the table. Over the last decade, the trend of DMPs generated in Thailand can be divided into three periods. In the first period (2012–2014), the annual amount of generated DMPs increased from 2012 to 2014, with an annual growth rate of 15.77% on average. In the second period (2015–2017), the produced waste had a similar amount of around 21 to 22 million units/year, with a change rate of less than 1% on average. In the last period (2018–2021), it steadily declined to 6.78% on average. The average amount of DMP generation is 20.09 million units/year from 2012 to 2021. Thailand produced mobile phone waste at 22.59 million units in 2015, which is quite far from the generated waste in China (781.1 million units) reported by X. Guo and K. Yan (2015) [13], while the rate of waste generation per capita in China and Thailand 2015 are 0.062 and 0.038 kg/capita/year, respectively [48,58]. India produced approximately 1.65 in 2010 and had an extreme growth to 157 million units of mobile phone waste in 2019 [59].
The estimated results differed between the methods in each year. M. Ikhayel (2016) found that the market condition of a product is a criterion for selecting the proper method to estimate the waste generation for WEEE products [36]. As X. Guo and K. Yan (2015) reported, the Simple Delay and Time Step method produced similar results for the calculation of mobile phone and laptop waste in Switzerland (2010) [13]. This study has not identified the proper estimation method for DMP generation in Thailand because of the lack of historical data on mobile phone waste generation in Thailand for 2012–2021. More importantly, these results will be the primary data to compare with other estimation methods and will be used to determine the most capable method for Thailand in the future.
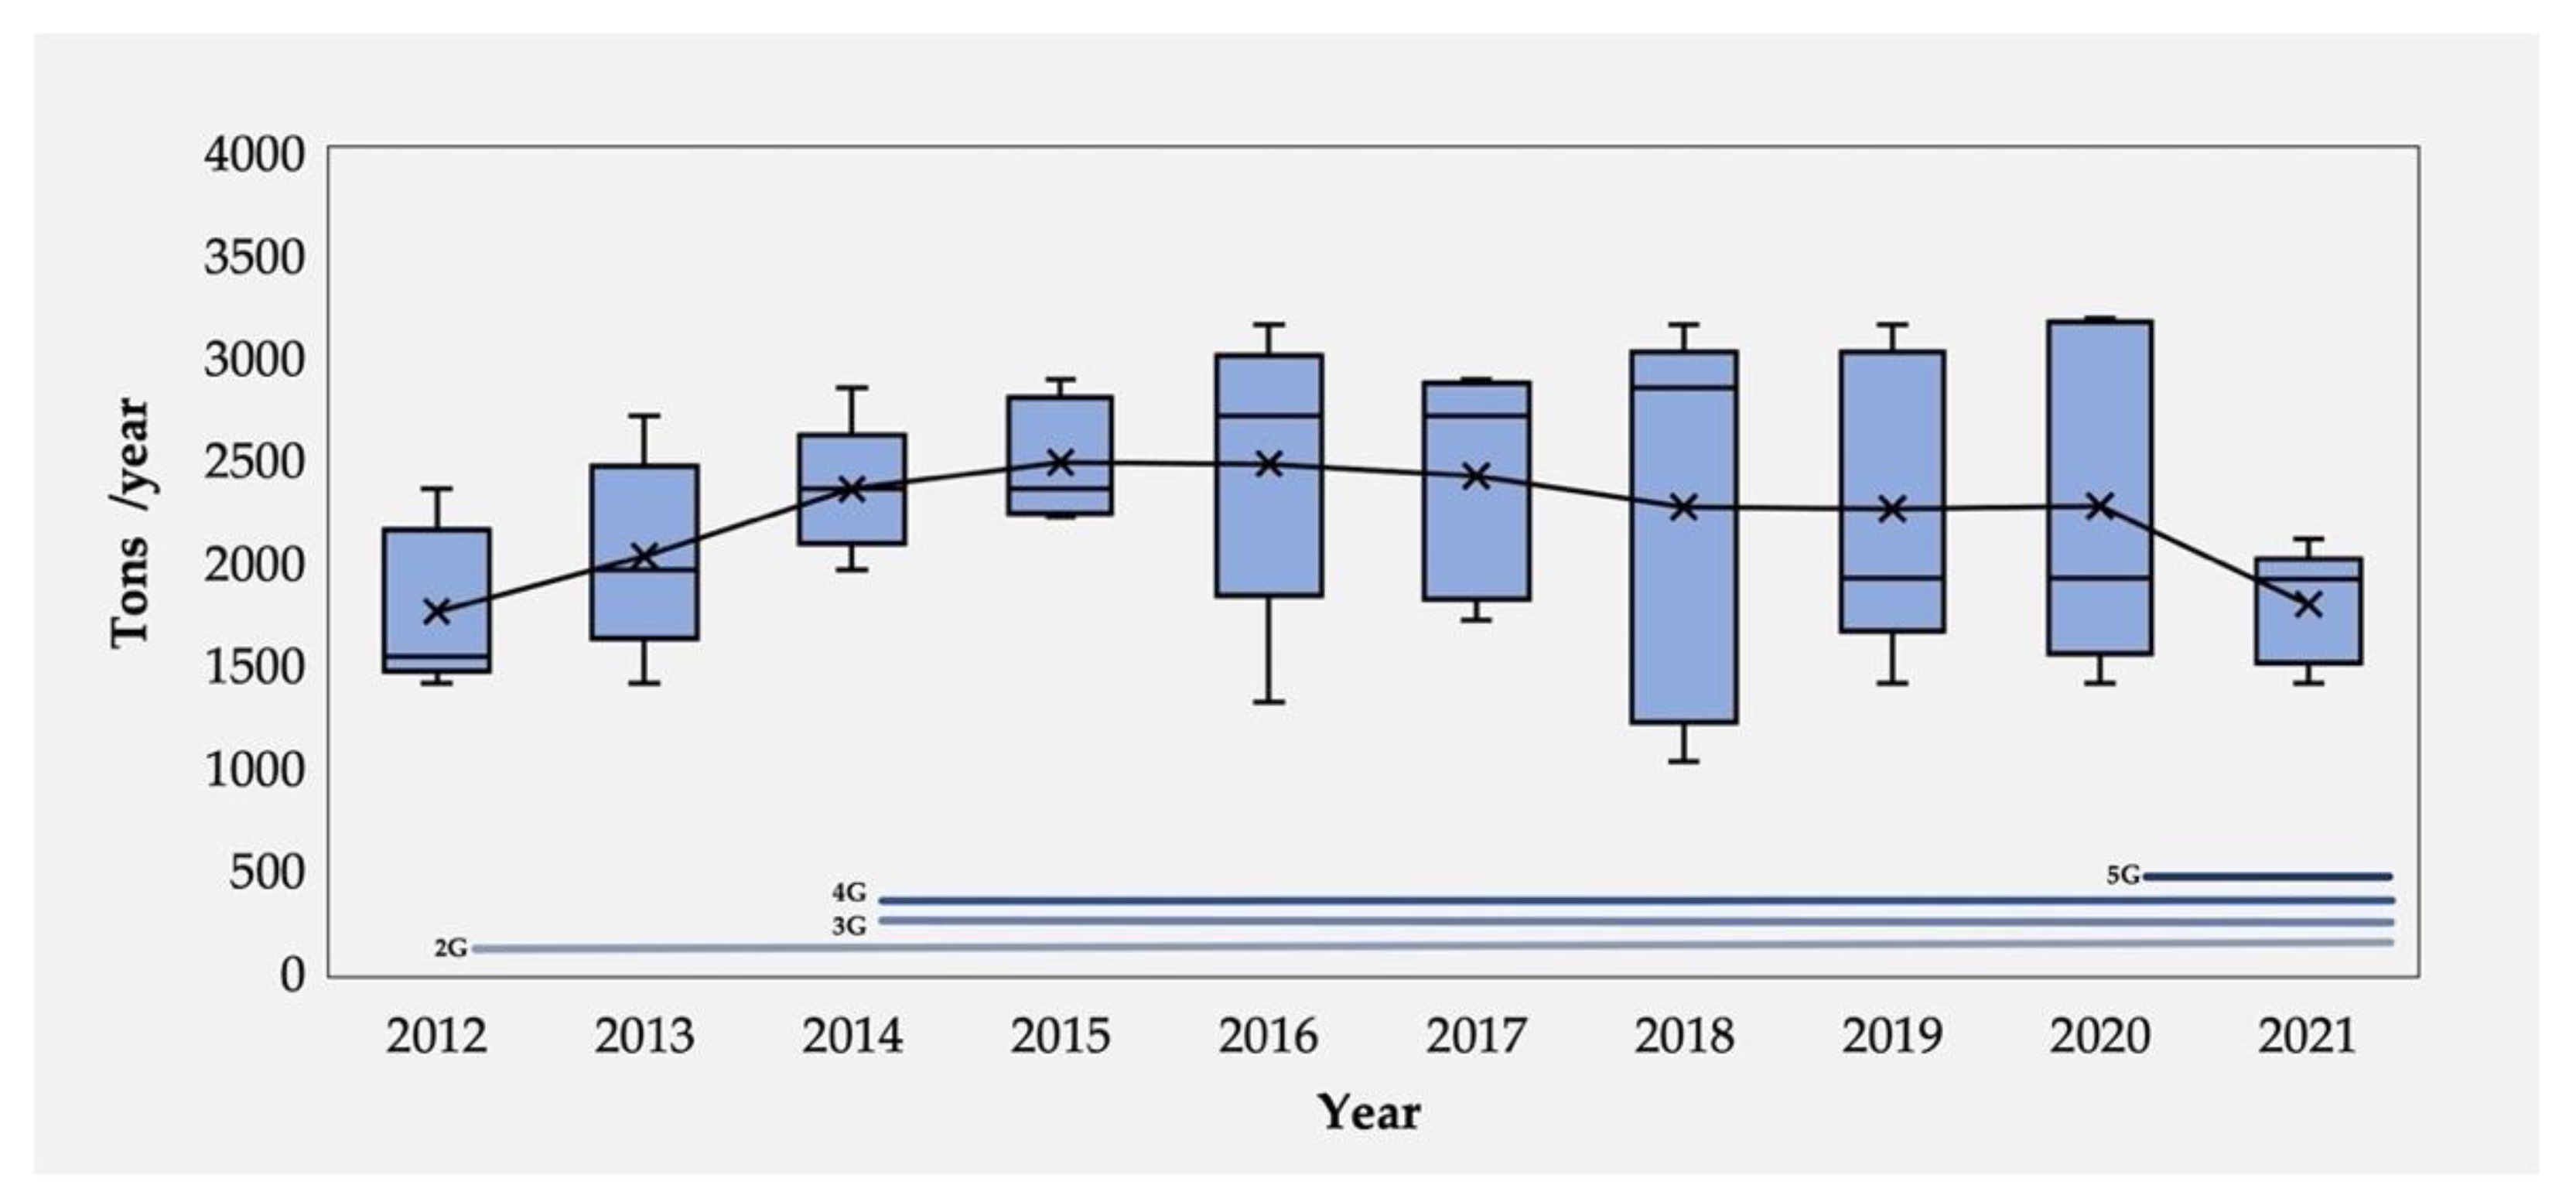
Figure 2 shows the variation of the estimated results of DMP generation in Thailand between 2012 and 2021 using the Approximation 2, Simple Delay, and Time Step methods, while the average value of DMP generations measured by weight is presented in the line. Thailand produced discarded mobile phones at approximately 1756.22 tons/year in 2012, reaching approximately 2353.98 tons/year in 2014. Then, the produced waste was maintained at around 2400 tons/year (2015–2017). Then, it continually declined from 2,265.86 tons/year in 2018 to 1791.40 tons/year in 2021. A significant decrease in mobile phone waste generation at 21.14% occurred between 2020 and 2021. The overview trend of mobile phone waste generation in Thailand from historical data to the present is divided into three periods: the first period (2012–2014), the second period (2015–2017), and the third period (2018–2021) are related to the adaptation timeline of cellular generation from 2G to 5G in Thailand, as presented in Figure 2. Cellular technology in Thailand in 2014 adopted the mobile cellular model for 3G and 4G in the market [10]. The new technology could affect consumer behavior to discard mobile phones [60]. Even though 5G technology launched in 2020, the smartphone market sales in Thailand dropped around 8% YoY in 2019. The annual GDP growth has continuously decreased until 2021 since the COVID-19 pandemic [61,62].
Additionally, the results found that the possible range of produced waste from the mobile phone is in a range of approximately 1700 to 2500 tons/year; that is significant information for considering and preparing proper management systems, such as collection centers, dismantling processes, and recycling facilities for mobile phone waste management in Thailand.

3.1.2. DMPs Generation Rate per Capita

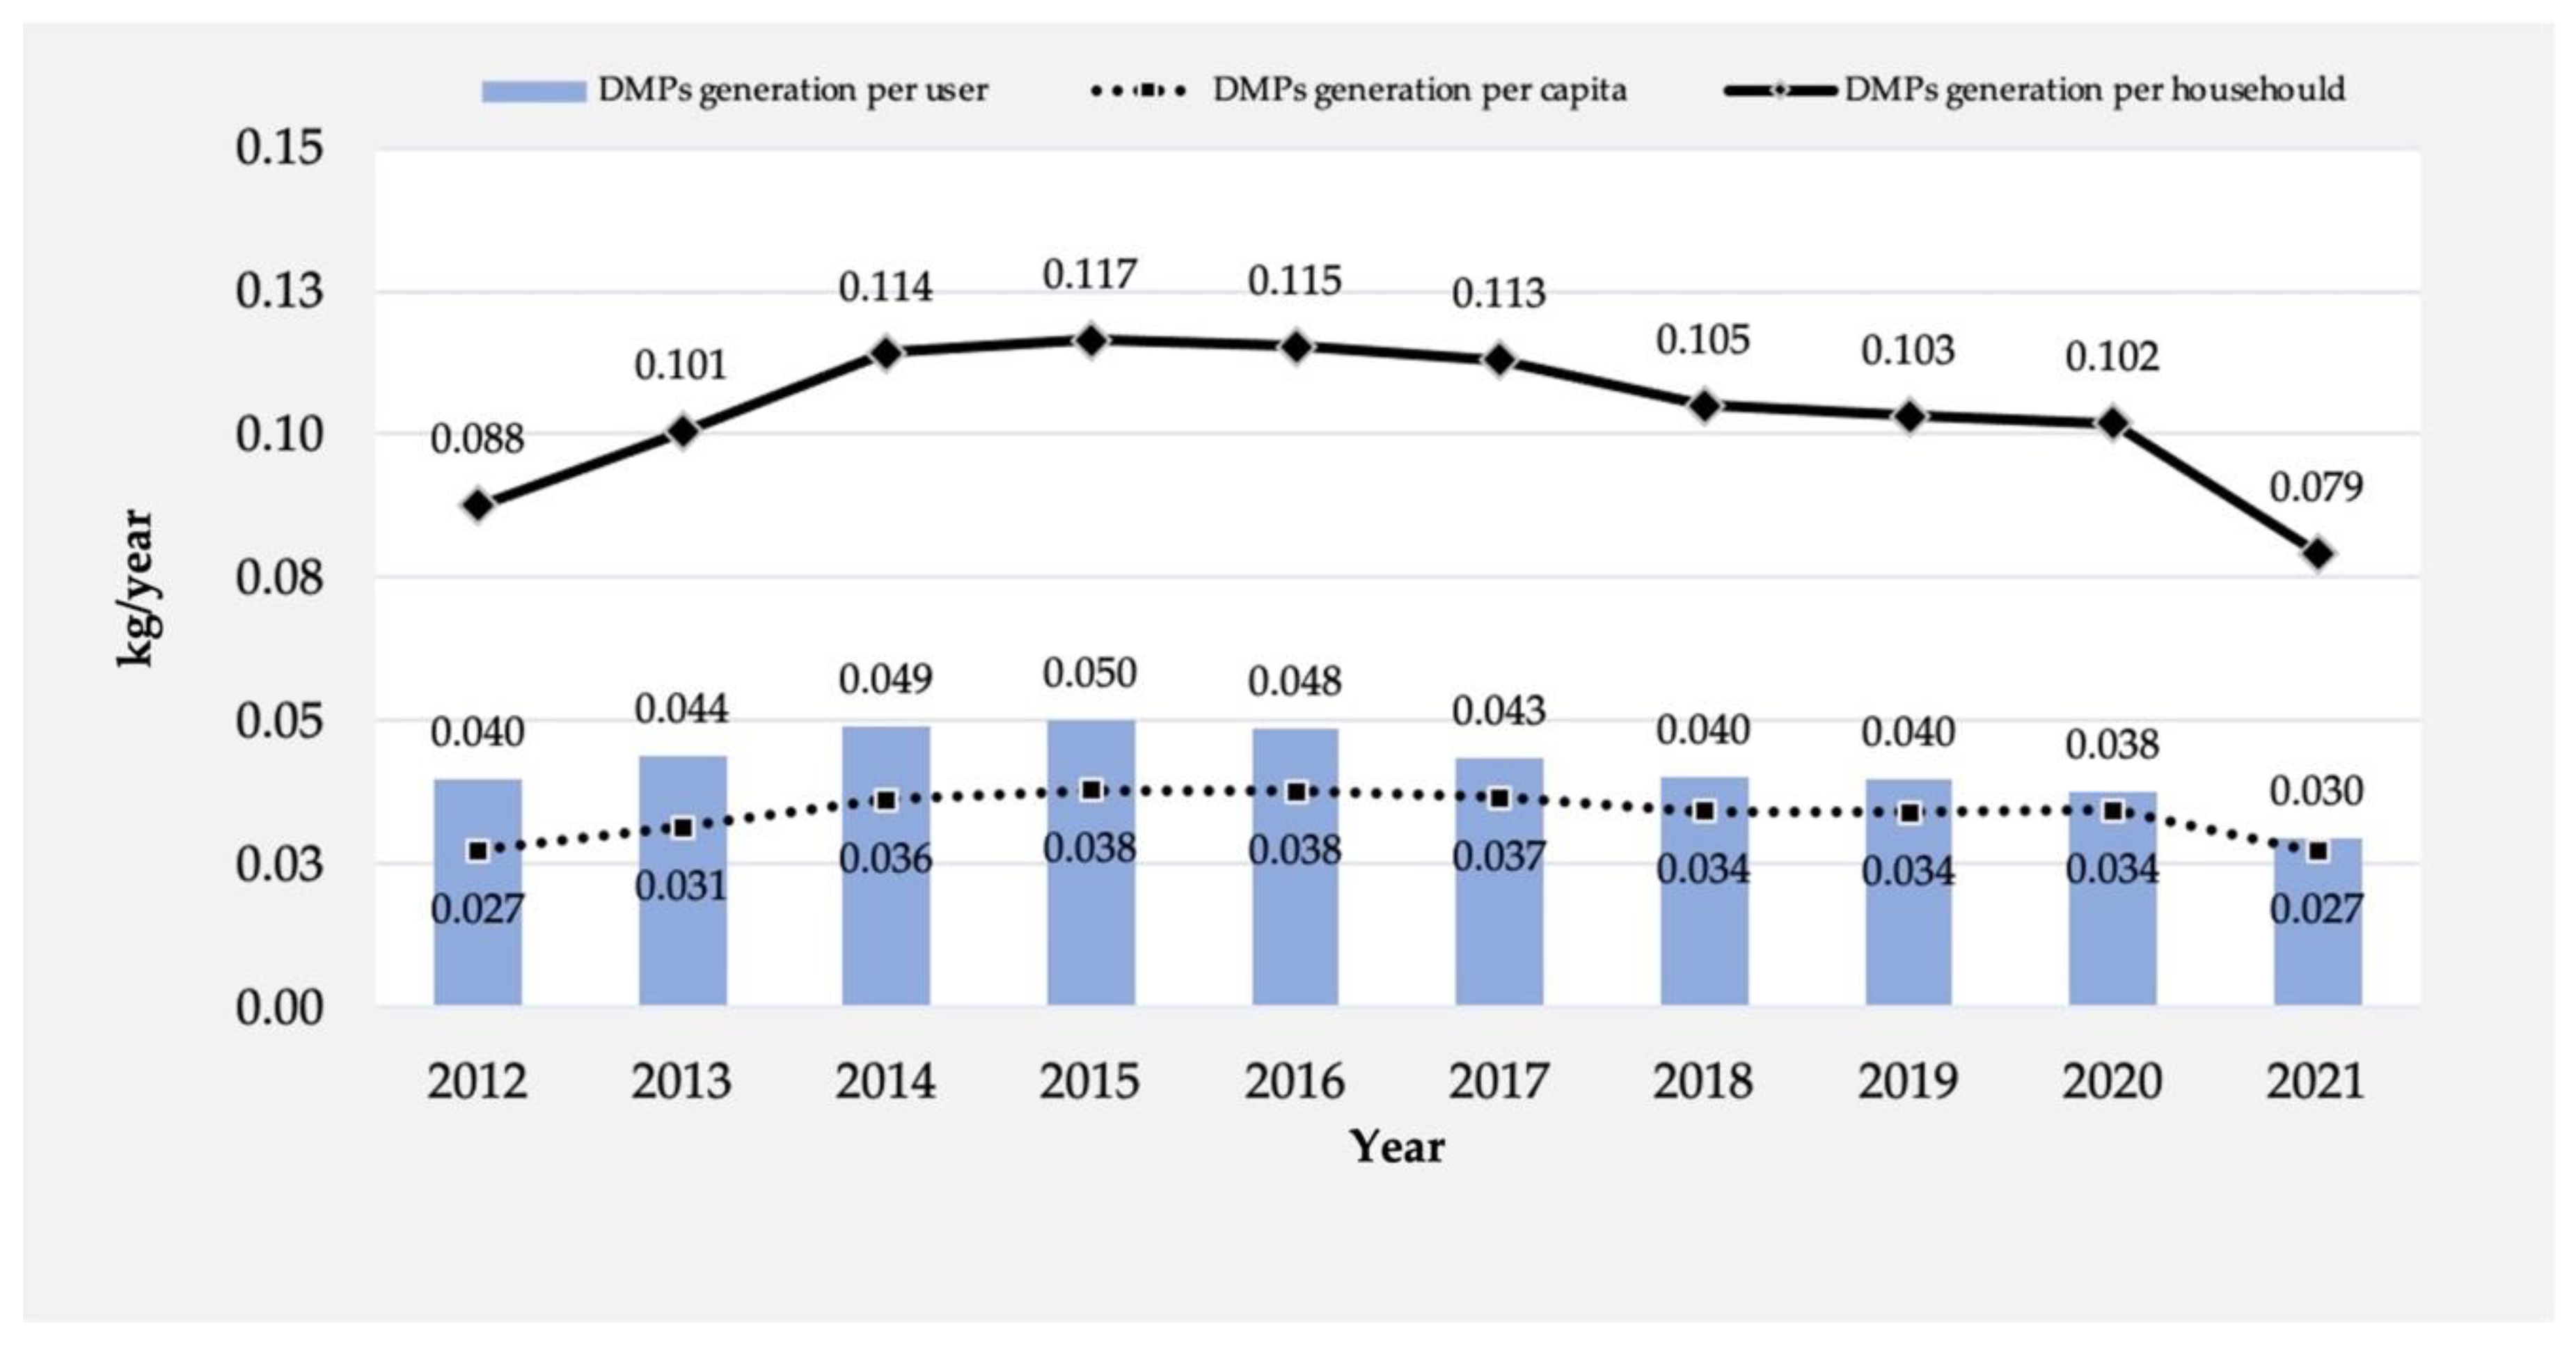
Figure 3 shows that the value of waste generation per capita for mobile phones in Thailand (2012–2021) fluctuated from 0.027 to 0.038 kg/year/capita. This means each person used a mobile phone for around 3 to 4 years, then it became an unused mobile phone. The highest waste production rate was 0.038 kg/year/capita between 2015 and 2016. Comparing the results in the year 2012, Thailand’s produced mobile phone waste (0.027 kg/year/capita) is higher than Brazil’s (0.01 kg/year/capita), at around 0.011 kg or 11 g per year per capita [33], similar to the DMP generation rate in Ahvaz, Iran in 2011 (0.025 kg/year/capita) [15].
The estimated results of the DMP generation rate per mobile phone user and mobile phone household are also included in Figure 3 for comparison. The annual waste generation per user is higher than the annual waste generation per capita by around 25.44% on average. The gap has narrowed and produced comparable quantities in 2020 and 2021, with a gap of less than 10%. The portion of mobile phone users of the population aged 6 years and above is 70.14% from 2012, which has increased to 94.61% in 2021, as presented in Table S6 (Supplementary Material) [11].

3.1.3. Percentage of Estimated DMP Generation in Thailand by Area

According to the National Statistical Office, the number of mobile phone users in five areas in Thailand between 2012 and 2021 is presented in Table S6 (Supplementary Material). Thus, the estimated DMP distribution and proportion of DMP generation over the central, northeastern, northern, Bangkok, and southern areas for the period of 2012 to 2021 is presented in Table S7 (Supplementary Material). Between 2012 and 2021, it is estimated that over 20,000 tons of mobile phone waste will be produced cumulatively in these five areas. The northeastern and central areas had the highest proportion of DMP generation between 2012 and 2021, which was in the range of 25%–31% and 25%–30%, respectively. Next was the northern area, generating mobile phone waste in the range of 16%–17%; Bangkok generated mobile phone waste in the range of 11%–14%; and the southern area generated mobile phone waste in the range of 12%–13%.
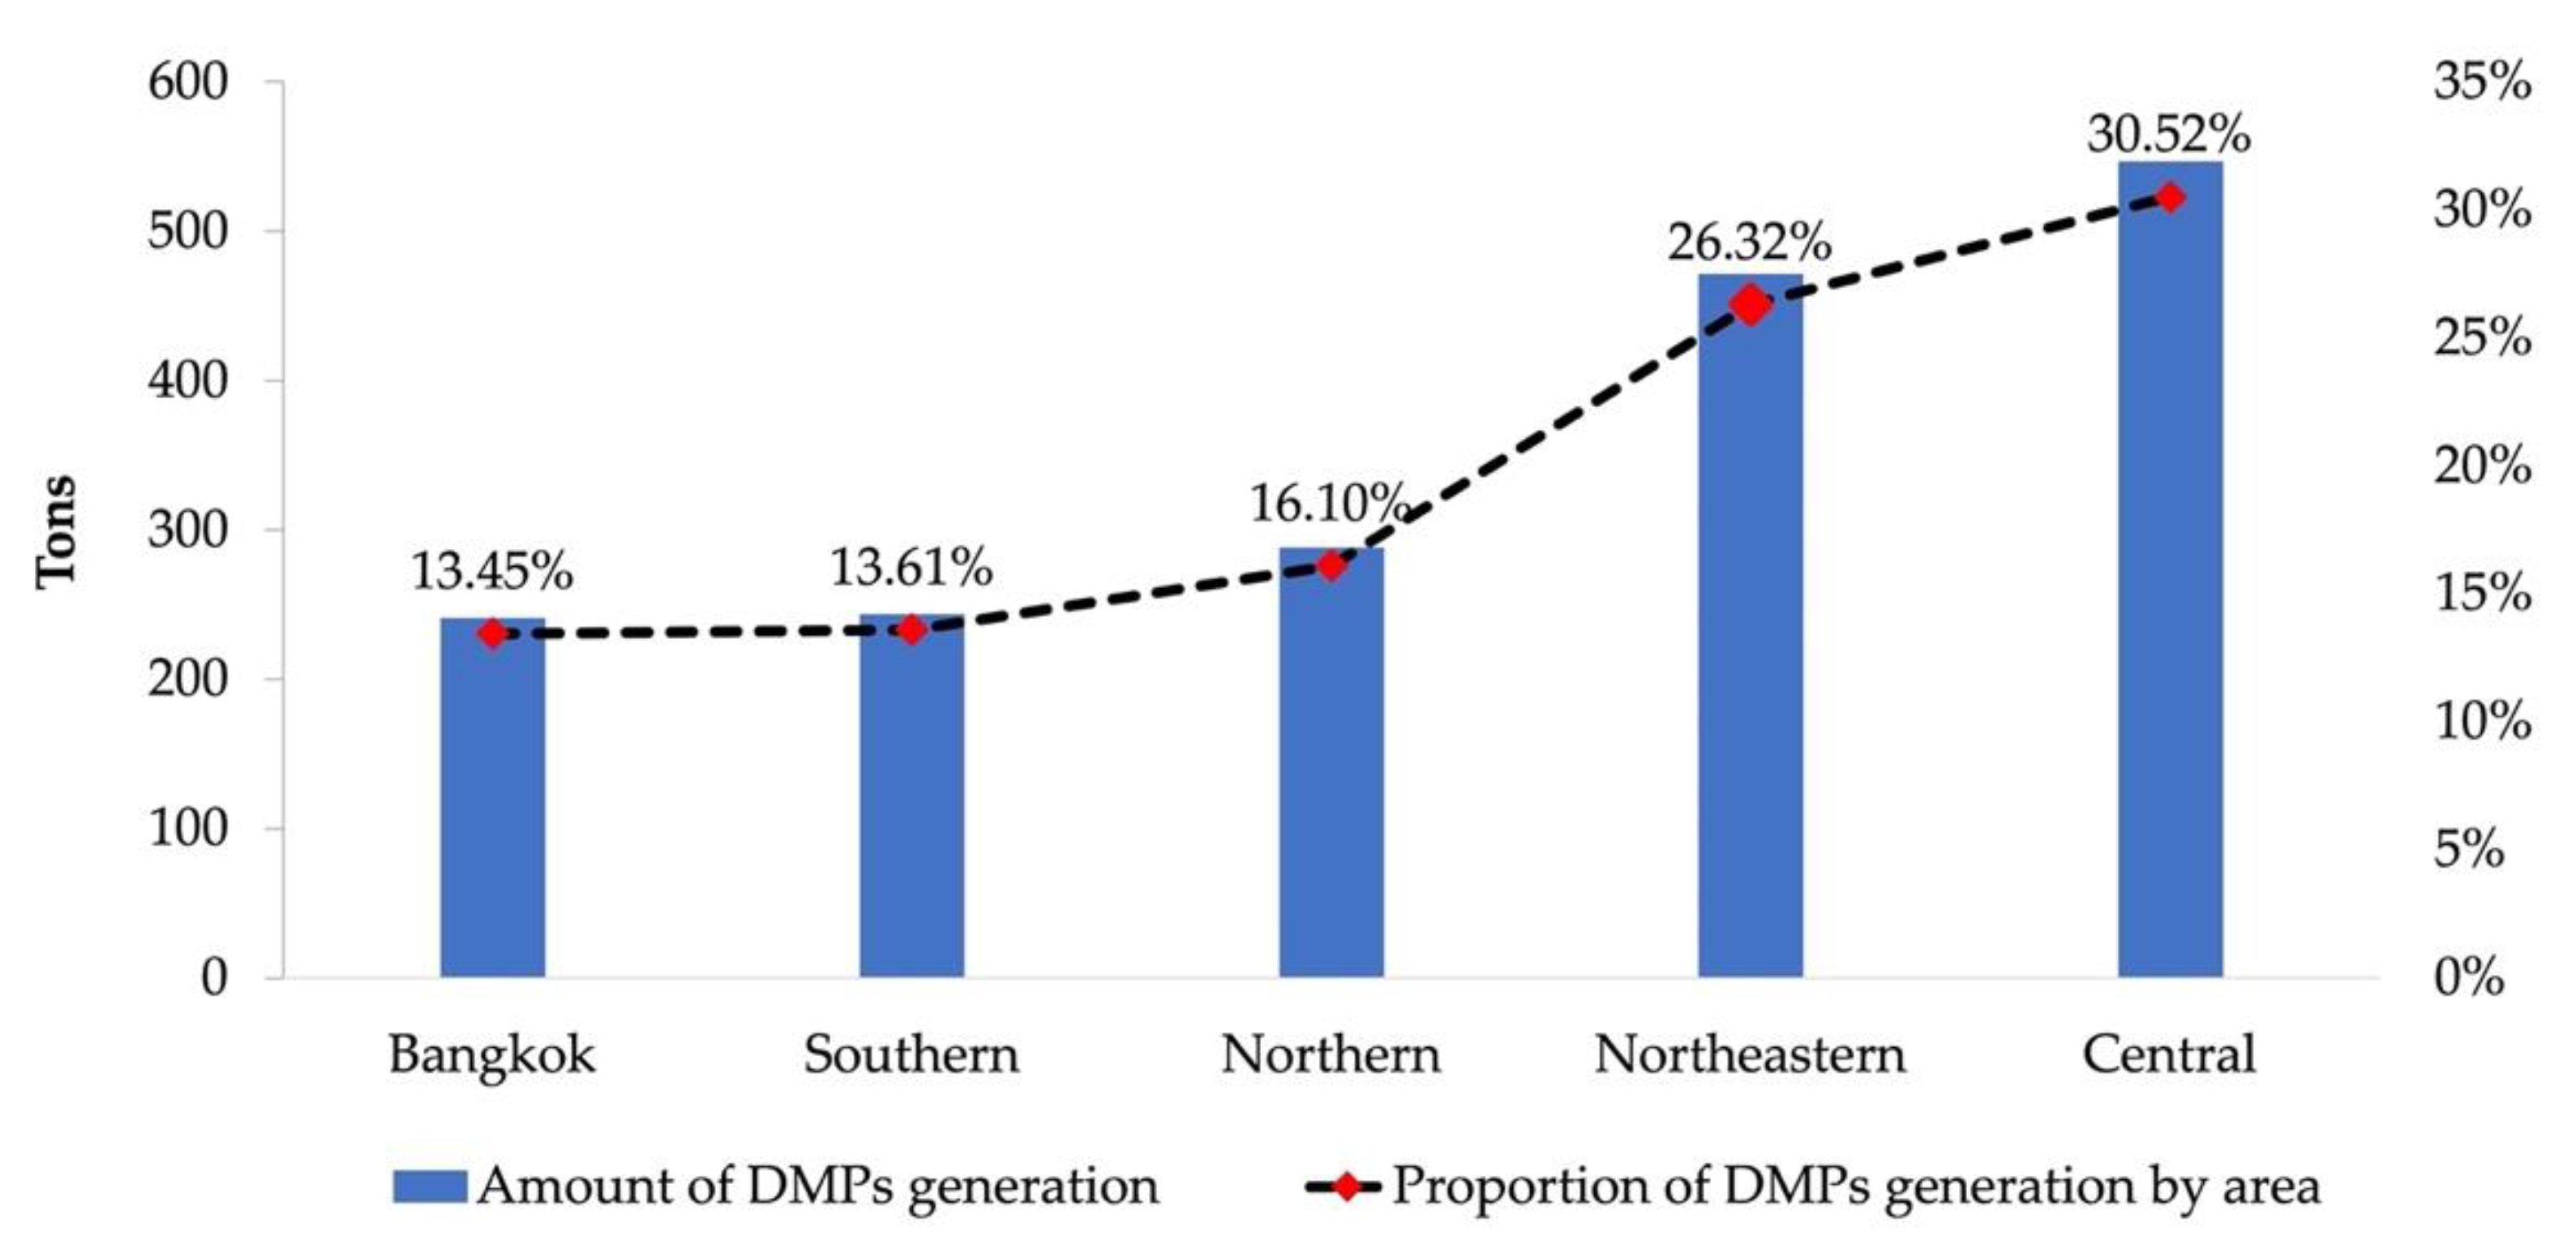
Figure 4 shows the distribution of DMPs in Thailand in 2021 by area, based on five areas. The quantity of produced mobile phone waste in the central area was approximately 546.81 tons, or equivalent to 30.52% of the total DMP generation. Next is the northeastern area at 26.32% (471.45 tons) and the northern area at 16.10% (288.41 tons). The southern and Bangkok areas produced similar amounts of waste generation, accounting for approximately 13% of total DMP generation in 2021. This information will be useful for authorities to design the capacity and location of collection centers to create a sufficient management system by considering the potential of DMP generation at the area level.

3.2. DMPs Generation in Thailand (2021) by Province

Density Map of DMP Generation
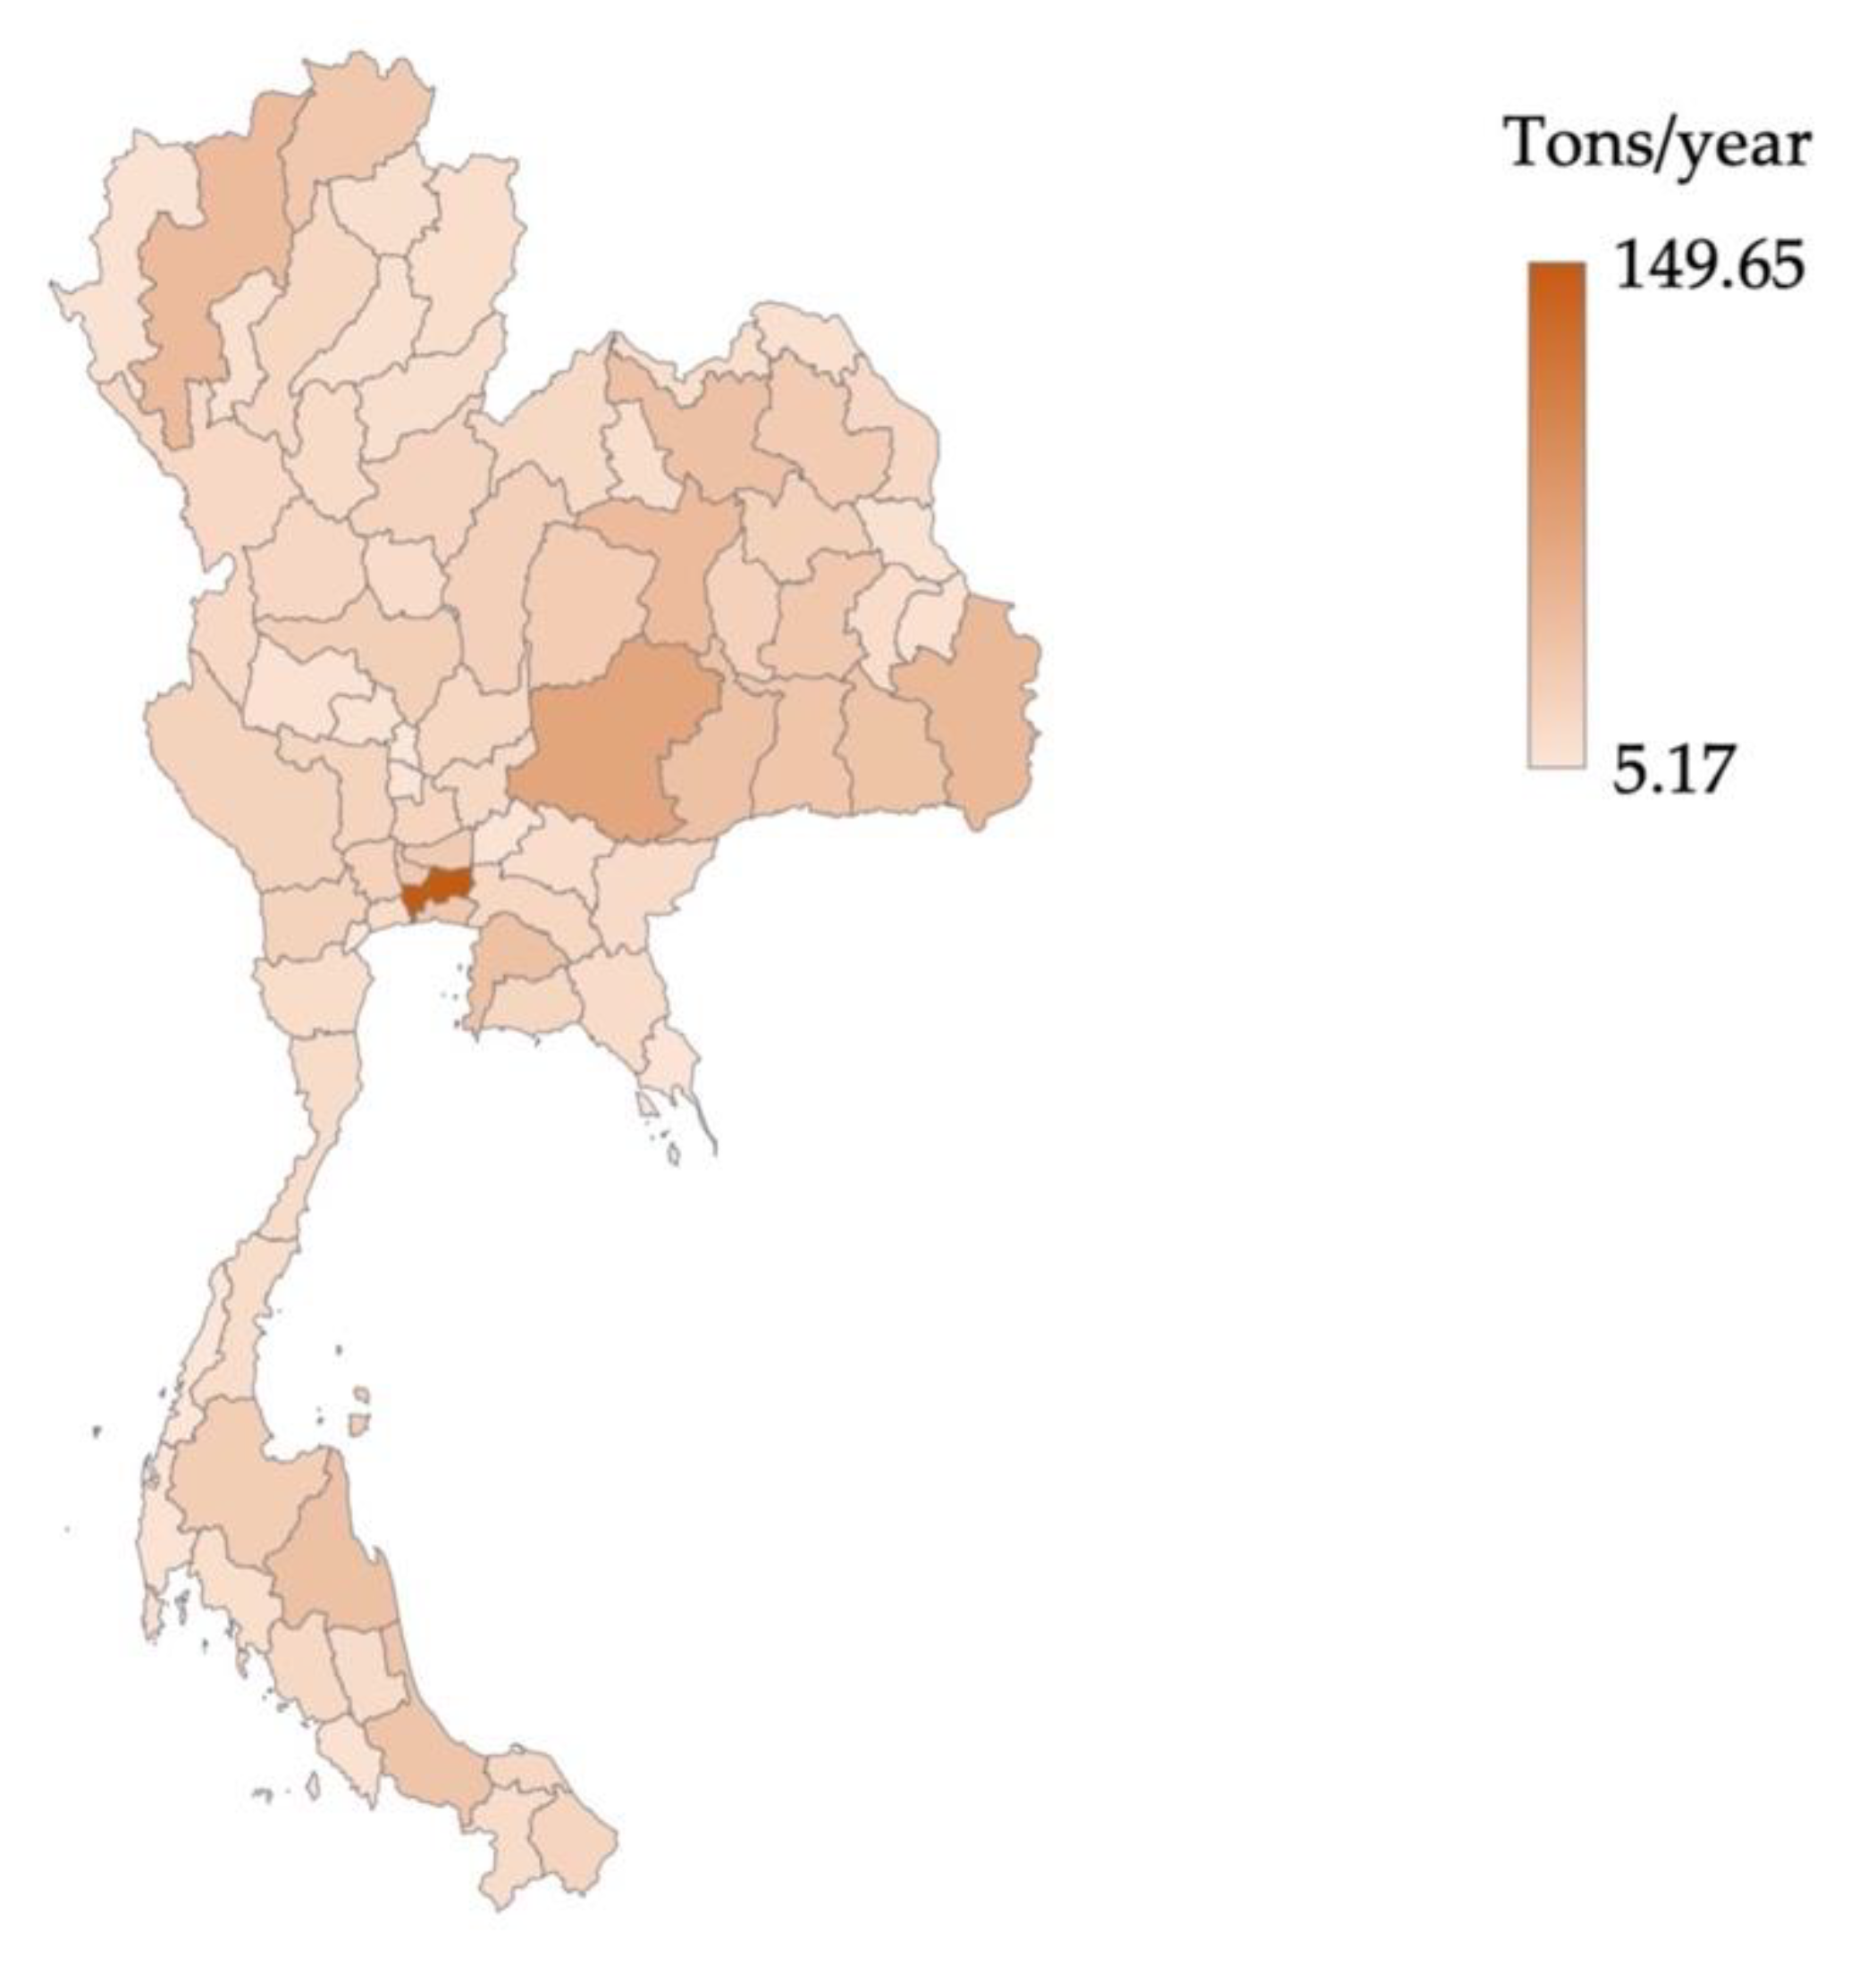
According to the results of the average estimated DMP generation in Thailand, the total amount of mobile phone waste per capita in 2021 was approximately 1791.40 tons/year, equivalent to 0.027 kg/year/capita. Of the total generated mobile phone waste in 2021, 32.99% (590.90 tons/year) was produced in the northeastern area, 26.17% (468.73 tons/year) in the central area, 18.15% (325.14 tons/year) was produced in the northern area, 14.34% (256.98 tons/year) was produced in the southern area, and 8.35% (149.65 tons/year) was produced in Bangkok, as presented in Table S8 (Supplementary Material). The first-ranked in the amount of generated mobile phone waste by province is Bangkok, producing mobile phone waste at 8.35%, equivalent to 149.65 tons/year, similar to the generation rate in Dubai, UAE, in 2021 (150.94 tons) [6]. Next is Nakhon Ratchasima at 3.98% (71.31 tons/year), Ubon Ratchathani at 2.82% (50.58 tons/year), Khon Kaen at 2.71% (48.48 tons/year), and Chiang Mai at 2.70% (48.44 tons/year), as presented in Figure 5.

3.3. Estimation of Recycling and Toxic Metals in the PCBs from DMP Generation in Thailand, 2021

The average amount of generated DMPs was approximately 16.28 million units or equivalent to 1791.40 tons/year in 2021, producing around 412.02 tons of PCB waste. Table 3 presents the potential amount of recycling metals and toxic metals in the PCBs from DMP generation in Thailand, 2021, as follows: iron and ferroalloys (Co, Fe, Mn, Mo, Ni), base metals (Al, Sb, Cu, Sn, Zn), precious metals (Ag, Au), rare earth elements (REEs) (Ce, Sc, Th, Ti, V, Zr), platinum-group metals or PGMs (Pd, Pt), and toxic metals (As, Cd, Cr, Pb). The PCBs from DMPs have a high quantity of element metals. In particular, copper is at 68.09% of the total metal content in PCBs, while scandium is the lowest metal content at less than 1% of the total metal content. The amount of precious metals was estimated at 1.28 tons, including 936 kg of silver (Ag) and 347.31 kg of gold (Au). The rare earth elements (REEs) were estimated at 5.33 tons, including 4288.92 kg of titanium (Ti), 803.44 kg of zirconium (Zr), 203.74 kg of thorium (Th), 17.33 kg of cerium (Ce), 6.88 kg of scandium (Sc), and 4.99 kg of vanadium (V). The PCBs from mobile phone waste have several metals that can be recycled to be the metal supply for metal industries, which will increase economic growth and save the environment from mining activities. Recycling PCBs from mobile phone waste can be one alternative urban mining resource to supply minerals for consumption and exportation. Moreover, mobile phone waste has been defined as the targeted e-waste product in the draft of the action plan for e-waste management between 2022 and 2026. Otherwise, 7.26 tons of toxic metals (As, Cd, Cr, Pb) are a concern due to negative impacts on the environment and human health.
The metal concentration is the key to indicating the benefits of recycling metals and the possible risk from toxic metals. Table 1 shows the lower and upper limits of the metal concentration range of twenty-four elements in PCBs. These values were applied to present the sensitivity analysis of the minimum and maximum amounts of metal contents in PCBs from DMP generation in Thailand in 2021, as presented in Table S9 (Supplementary Material). Considering the total amount of metal contents in PCBs from DMP generation in Thailand in 2021 by mineral group, the base metals had the highest metal content, ranging from 47.42 to 323.59 tons. Next were the iron and ferroalloys (8.63–85.25 tons) and toxic metals (1.25–16.09 tons). The rare earth elements (REEs) and PGMs (Ce, Sc, Th, Ti, V, Zr, Pd, Pt,) and precious metals (Ag, Au) had maximum amounts of 7.09 tons and 2.31 tons, respectively, as shown in Figure 6.

4. Conclusions

According to the historical import data of mobile phones over the last decade, Thai’s telecommunication market has continued to expand, and mobile phones are sold at 20.90 million per year on average. The considerable amount of mobile phone waste concerns two points: the potential economic value of valuable metals and the negative impact of toxic metals from improper disposal. Moreover, DMPs can be the alternative source of critical minerals such as gold and rare earth elements (REEs) for the metal industry’s processing to create a circular economy. Currently, Thailand is preparing to develop a proper WEEE act and action plan for electrical and electronic equipment products, including mobile phones. However, the historical data on the possible range of discarded mobile phone generation in Thailand were limited. This study presents the DMP generation in Thailand between 2012 and 2020 ranging from approximately 1700 to 2500 tons/year or equivalent at 0.027 to 0.038 kg/year/capita. More than 50% of the total estimated DMP generation in the whole country was produced in the northeastern and central areas. At the provincial level, Bangkok has the highest generation rate of DMPs at 8.35% of total DMP generation in 2021 (149.65 tons/year). The PCBs from DMP generation in 2021 can be recycled into approximately 1.28 tons of precious metals (Ag, Au) and 5.33 tons of rare earth elements. In comparison, 7.26 tons of toxic metals (As, Cd, Cr, Pb) present a concern regarding the environment and human health.

Supplementary Materials

The following supporting information can be downloaded at: https://www.mdpi.com/article/10.3390/su142417025/s1, Table S1: Review of the required data for the estimation method for mobile phone waste generation; Table S2: The detail of the data to estimate the DMP generation (unit: million of units); Table S3: Number of persons from registration in Thailand by area: 2012–2021 (unit: person; Table S4: Number of households in Thailand by area: 2012–2021 (unit: thousand households); Table S5: Literature review on the mass fraction (weight/weight) of main components in mobile phone; Table S6: Number of mobile phone users in Thailand by area: 2012–2021 (unit: thousand); Table S7: The estimated amount and proportion of DMP generation by area (based on the number of mobile phone users); Table S8: The estimated amount and proportion of DMP generation by area (based on the number of persons from registration); Table S9: Sensitivity analysis of metal content in printed circuit boards (PCBs) from DMP generation in Thailand, 2021.

Author Contributions

Conceptualization, J.B. and S.K.; methodology, J.B. and S.K.; investigation, J.B.; writing—review and editing, J.B. and S.K. All authors have read and agreed to the published version of the manuscript.

Funding

This research was funded by the 100th Anniversary Chulalongkorn University Fund for Doctoral Scholarship.

Institutional Review Board Statement

Not applicable.

Informed Consent Statement

Not applicable.

Data Availability Statement

Not applicable.

Acknowledgments

The research was funded by Chulalongkorn University, namely, the 100th Anniversary Chulalongkorn University Fund for Doctoral Scholarship. The authors thank the Center of Excellence on Hazardous Substance Management (Chulalongkorn University, Thailand) for supporting. Finally, the authors appreciate the supporting data for this research published by the Customs Department, Department of Provincial Administration, Office of the National Broadcasting and Telecommunications Commission, Pollution Control Department, and National Statistical Office.

Conflicts of Interest

The authors declare no conflict of interest.

Abbreviations

DMPsDiscarded mobile phones
PCBsPrinted circuit boards
WEEEWaste electrical and electronic equipment
REEsRare earth elements
NBTCNational Broadcasting and Telecommunication Commission
e-wasteElectronic waste
PCDPollution control department control
EPRExtended Producer Responsibility
GDPGross Domestic Product

Appendix A

The list of provinces in each area of study [11].
AreaProvince
Central (25 provinces)Nonthaburi, Pathum Thani, Samut Prakan, Ang Thong, Chai Nat, Kanchanaburi, Lop buri, Nakorn Pathom, Phetchaburi, Phra Nakhon Si Ayutthaya, Prachuap Khiri Khan, Ratchaburi, Samut Sakorn, Samut Songkhram, Saraburi, Sing Buri, Suphan Buri, Chachoengsao, Chanthaburi, Chonburi, Nakhon Nayok, Prachin Buri, Rayong, Sa Keao, Trat
Northeastern (20 provinces)Amnat Charoen, Bueng Kan, Buri Ram, Chiyaphum, Kalasin, Khon Kaen, Loei, Maha Sarakham, Mukdahan, Nakhon Phanom, Nakhon Ratchasima, Nong Bua Lamphu, Nong Khai, Roi Et, Sakhon Nakhon, Si Sa Ket, Surin, Ubon Ratchathani, Udon Thani, Yasothon
Northern (17 provinces)Chiang Mai, Chiang Rai, Kamphaeng Phet, Lampang, Lamphun, Mae Hong Son, Nakhon Sawan, Nan, Phayao, Phetchabun, Phichit, Phitsanulok, Phrae, Sukhothai, Tak, Uthai Thani, Uttaradit
Southern (14 provinces)Chumpon, Krabi, Nakhon Si Thammarat, Narathiwat, Pattani, Phang Nga, Phatthalung, Phuket, Ranong, Satun, Songkha, Surat Thani, Trang, Yala
Bangkok (1 province)Bangkok

References

  1. The World Bank. Mobile Cellular Subscriptions. Available online: https://data.worldbank.org/indicator/IT.CEL.SETS (accessed on 10 April 2022).
  2. The World Bank. Population, Total. Available online: https://data.worldbank.org/indicator/SP.POP.TOTL (accessed on 10 April 2022).
  3. The GlobalEconomy.com. Mobile Phone Subscribers, Per 100 People—Country Rankings. Available online: https://www.theglobaleconomy.com/rankings/Mobile_phone_subscribers_per_100_people/South-East-Asia (accessed on 10 April 2022).
  4. D’Almeida, F.S.; de Carvalho, R.B.; dos Santos, F.S.; de Souza, R.F.M. On the Hibernating Electronic Waste in Rio de Janeiro Higher Education Community: An Assessment of Population Behavior Analysis and Economic Potential. Sustainability 2021, 13, 9181. [Google Scholar] [CrossRef]
  5. Siddiqua, A.; El Gamal, M.; Kareem Abdul, W.; Mahmoud, L.; Howari, F.M. E-Device Purchase and Disposal Behaviours in the UAE: An Exploratory Study. Sustainability 2022, 14, 4805. [Google Scholar] [CrossRef]
  6. Attia, Y.; Soori, P.K.; Ghaith, F. Analysis of Households’ E-Waste Awareness, Disposal Behavior, and Estimation of Potential Waste Mobile Phones towards an Effective E-Waste Management System in Dubai. Toxics 2021, 9, 236. [Google Scholar] [CrossRef] [PubMed]
  7. Ylä-Mella, J.; Keiski, R.L.; Pongrácz, E. End-of-Use vs. End-of-Life: When Do Consumer Electronics Become Waste? Resources 2022, 11, 18. [Google Scholar] [CrossRef]
  8. Office of The National Broadcasting and Telecommunications Commission. Number of Mobile Phone Imports (Cellular Mobile system) in Thailand from 2009 to 2014. Available online: https://standard1.nbtc.go.th/ (accessed on 11 April 2021). (In Thai)
  9. The Custom Department. Statistics Report. Available online: https://www.customs.go.th/statistic_report.php?ini_content=statistics_report&ini_menu=nmenu_esevice&left_menu=nmenu_esevice_007&lang=en&left_menu=nmenu_esevice_007 (accessed on 11 April 2022).
  10. The National Broadcasting and Telecommunications Commission (NBTC). The Checking System for the Approved Telecommunications and Equipment. Available online: http://apps.nbtc.go.th/type_approval/ (accessed on 24 December 2020).
  11. National Statistical Office. Survey Information and Communication Technology (ICT). Available online: http://www.nso.go.th/sites/2014en/Survey/ICT/Survey%20In%20Household/2021/fullreport_64_q4n.pdf (accessed on 22 June 2022). (In Thai)
  12. Perez-Belis, V.; Bovea, M.D.; Ibanez-Fores, V. An in-depth literature review of the waste electrical and electronic equipment context: Trends and evolution. Waste Manag. Res. 2015, 33, 3–29. [Google Scholar] [CrossRef]
  13. Guo, X.; Yan, K. Estimation of obsolete cellular phones generation: A case study of China. Sci Total Env. 2017, 575, 321–329. [Google Scholar] [CrossRef]
  14. Kim, S.; Oguchi, M.; Yoshida, A.; Terazono, A. Estimating the amount of WEEE generated in South Korea by using the population balance model. Waste Manag. 2013, 33, 474–483. [Google Scholar] [CrossRef]
  15. Alavi, N.; Shirmardi, M.; Babaei, A.; Takdastan, A.; Bagheri, N. Waste electrical and electronic equipment (WEEE) estimation: A case study of Ahvaz City, Iran. J. Air Waste Manag. Assoc. 2015, 65, 298–305. [Google Scholar] [CrossRef] [Green Version]
  16. United Nations Institute for Training and Research. The Global E-Waste Monitor 2020. Available online: https://ewastemonitor.info/wp-content/uploads/2020/11/GEM_2020_def_july1_low.pdf (accessed on 6 November 2022).
  17. Bahaloo-Horeh, N.; Mousavi, S.M.; Baniasadi, M. Use of adapted metal tolerant Aspergillus niger to enhance bioleaching efficiency of valuable metals from spent lithium-ion mobile phone batteries. J. Clean. Prod. 2018, 197, 1546–1557. [Google Scholar] [CrossRef]
  18. Silveira, A.V.; Fuchs, M.S.; Pinheiro, D.K.; Tanabe, E.H.; Bertuol, D.A. Recovery of indium from LCD screens of discarded cell phones. Waste Manag. 2015, 45, 334–342. [Google Scholar] [CrossRef]
  19. Arshadi, M.; Mousavi, S.M. Multi-objective optimization of heavy metals bioleaching from discarded mobile phone PCBs: Simultaneous Cu and Ni recovery using Acidithiobacillus ferrooxidans. Sep. Purif. Technol. 2015, 147, 210–219. [Google Scholar] [CrossRef]
  20. Sahan, M.; Kucuker, M.A.; Demirel, B.; Kuchta, K.; Hursthouse, A. Determination of Metal Content of Waste Mobile Phones and Estimation of Their Recovery Potential in Turkey. Int. J. Env. Res. Public Health 2019, 16, 887. [Google Scholar] [CrossRef] [Green Version]
  21. Chen, B.; He, J.; Xi, Y.; Zeng, X.; Kaban, I.; Zhao, J.; Hao, H. Liquid-liquid hierarchical separation and metal recycling of waste printed circuit boards. J. Hazard. Mater. 2019, 364, 388–395. [Google Scholar] [CrossRef]
  22. Hagelüken, C.; Corti, C.W. Recycling of gold from electronics: Cost-effective use through ‘Design for Recycling’. Gold Bull. 2010, 43, 209–220. [Google Scholar] [CrossRef] [Green Version]
  23. Singh, N.; Duan, H.; Yin, F.; Song, Q.; Li, J. Characterizing the Materials Composition and Recovery Potential from Waste Mobile Phones: A Comparative Evaluation of Cellular and Smart Phones. ACS Sustain. Chem. Eng. 2018, 6, 13016–13024. [Google Scholar] [CrossRef]
  24. Mohamed Sultan, A.A.; Qi Hang, Y.; Wan Mahmood, W.H.; Md Saad, M.S.; Mativenga, P.T. Critical Materials Determination as a Complement to the Product Recycling Desirability Model for Sustainability in Malaysia. Appl. Sci. 2022, 12, 3456. [Google Scholar] [CrossRef]
  25. Hibbert, K.; Ogunseitan, O.A. Risks of toxic ash from artisanal mining of discarded cellphones. J. Hazard. Mater. 2014, 278, 1–7. [Google Scholar] [CrossRef] [Green Version]
  26. Pollution Control Department. Hazardous Waste of Community Situation Report 2021. Available online: https://www.pcd.go.th/publication/25971/ (accessed on 19 June 2022). (In Thai)
  27. Pollution Control Department. Drafts Open for Public Comment. In The Draft of Waste Electronical and Electronic Equipment Management Act (B.E….). Available online: https://www.pcd.go.th/laws/12907 (accessed on 1 July 2021). (In Thai)
  28. Pollution Control Department. Draft of Action Plan for Waste Electronical and Electronic Equipment (WEEE) Management (2022–2026). Available online: https://www.pcd.go.th/wp-content/uploads/2021/07/pcdnew-2021-07-19_06-41-36_736367.pdf (accessed on 15 October 2022). (In Thai)
  29. EnvilianceASIA. Thailand, Draft WEEE Action Plan 2022–2026. Waste Management in Thailand. Available online: https://enviliance.com/regions/southeast-asia/th/th-waste/th-weee (accessed on 15 October 2022).
  30. Pollution Control Department. Publication: Hazardous Waste of Community Situation Report 2017. Available online: https://www.pcd.go.th/publication/3828 (accessed on 10 September 2021). (In Thai)
  31. Pollution Control Department. Publication: Thailand State of Pollution Report. 2019. Available online: https://www.pcd.go.th/publication/8013 (accessed on 28 October 2021). (In Thai)
  32. Pollution Control Department. Publication: Hazardous Waste of Community Situation Report. 2020. Available online: https://www.pcd.go.th/publication/14833/ (accessed on 28 October 2021). (In Thai)
  33. Araujo, M.G.; Magrini, A.; Mahler, C.F.; Bilitewski, B. A model for estimation of potential generation of waste electrical and electronic equipment in Brazil. Waste Manag. 2012, 32, 335–342. [Google Scholar] [CrossRef]
  34. Tan, Q.; Dong, Q.; Liu, L.; Song, Q.; Liang, Y.; Li, J. Potential recycling availability and capacity assessment on typical metals in waste mobile phones: A current research study in China. J. Clean. Prod. 2017, 148, 509–517. [Google Scholar] [CrossRef]
  35. Ruiz Galeano, D.A.; Bautista Rodríguez, S.C. An integrated method of environmental analysis and system dynamics for management of mobile phone waste in Colombia. J. Clean. Prod. 2021, 279, 123768. [Google Scholar] [CrossRef]
  36. Ikhlayel, M. Differences of methods to estimate generation of waste electrical and electronic equipment for developing countries: Jordan as a case study. Resour. Conserv. Recycl. 2016, 108, 134–139. [Google Scholar] [CrossRef]
  37. Kunacheva, C.; Labayen, J.; Visvanathan, C. Electrical and electronic waste inventory and management strategies in Bangkok, Thailand. Int. J. Environ. Waste Manag. 2009, 3, 107–119. [Google Scholar] [CrossRef] [Green Version]
  38. AIS e-waste GREEN NETWORK. Electronic Waste That has been Left, Thai Recycling Operators and A New Beginning Full of Hope. Available online: https://ewastethailand.com/en/electronic-waste-that-has-been-left-en/ (accessed on 5 August 2022).
  39. Borrirukwisitsak, S.; Khwamsawat, K.; Leewattananukul, S. The use of relative potential risk as a prioritization tool for household WEEE management in Thailand. J. Mater. Cycles Waste Manag. 2021, 23, 480–488. [Google Scholar] [CrossRef]
  40. Royal Thai Embassy, Washington D.C. Thailand in Brief. Available online: https://thaiembdc.org/about-thailand/thailand-in-brief/ (accessed on 5 September 2022).
  41. Thailand Board of Investment. Thailand in Brief-Demographic. Available online: https://www.boi.go.th/index.php?page=demographic (accessed on 5 September 2022).
  42. Gurauskiene, I.; Stasiskiene, Z. Application of material flow analysis to estimate the efficiency of e-waste management systems: The case of Lithuania. Waste Manag Res. 2011, 29, 763–777. [Google Scholar] [CrossRef] [PubMed]
  43. Duygan, M.; Meylan, G. Strategic management of WEEE in Switzerland—Combining material flow analysis with structural analysis. Resour. Conserv. Recycl. 2015, 103, 98–109. [Google Scholar] [CrossRef]
  44. Wang, F.; Huisman, J.; Stevels, A.; Baldé, C.P. Enhancing e-waste estimates: Improving data quality by multivariate Input-Output Analysis. Waste Manag. 2013, 33, 2397–2407. [Google Scholar] [CrossRef]
  45. Office of The National Broadcasting and Telecommunications Commission. Thai Telecom Industry Database-Mobile Subscribers. Available online: https://ttid.nbtc.go.th/mobile_sub (accessed on 7 April 2022).
  46. Kawai, K.; Tasaki, T. Revisiting estimates of municipal solid waste generation per capita and their reliability. J. Mater. Cycles Waste Manag. 2016, 18, 1–13. [Google Scholar] [CrossRef] [Green Version]
  47. Makarichi, L.; Techato, K.-A.; Jutidamrongphan, W. Material flow analysis as a support tool for multi-criteria analysis in solid waste management decision-making. Resour. Conserv. Recycl. 2018, 139, 351–365. [Google Scholar] [CrossRef]
  48. National Statistic Office. Demography Population and Housing Branch. Available online: http://statbbi.nso.go.th/staticreport/page/sector/en/01.aspx (accessed on 20 October 2022).
  49. National Statistic Office. Revenue and Household Expenditure Branch. Available online: http://statbbi.nso.go.th/staticreport/page/sector/en/08.aspx (accessed on 20 October 2022).
  50. Oguchi, M.; Murakami, S.; Sakanakura, H.; Kida, A.; Kameya, T. A preliminary categorization of end-of-life electrical and electronic equipment as secondary metal resources. Waste Manag. 2011, 31, 2150–2160. [Google Scholar] [CrossRef]
  51. Oguchi, M.; Sakanakura, H.; Terazono, A. Toxic metals in WEEE: Characterization and substance flow analysis in waste treatment processes. Sci. Total Environ. 2013, 463, 1124–1132. [Google Scholar] [CrossRef]
  52. Bruno, M.; Sotera, L.; Fiore, S. Analysis of the influence of mobile phones’ material composition on the economic profitability of their manual dismantling. J. Environ. Manag. 2022, 309, 114677. [Google Scholar] [CrossRef]
  53. Department of Primary Industries and Mines. Mineral Import of Thailand 2020–2021. Available online: https://www1.dpim.go.th/dt/pper/000001651561227.pdf (accessed on 15 June 2022).
  54. U.S. Geological Survey. Mineral Commodity Summaries 2022; U.S. Geological Survey: Reston, VA, USA, 2022.
  55. Camelino, S.; Rao, J.; Padilla, R.L.; Lucci, R. Initial Studies about Gold Leaching from Printed Circuit Boards (PCB’s) of Waste Cell Phones. Procedia Mater. Sci. 2015, 9, 105–112. [Google Scholar] [CrossRef]
  56. Gupta, N.; Trivedi, A.; Hait, S. Material composition and associated toxicological impact assessment of mobile phones. J. Environ. Chem. Eng. 2021, 9, 104603. [Google Scholar] [CrossRef]
  57. Anshu, P.; Hait, S. Comprehensive characterization of printed circuit boards of various end-of-life electrical and electronic equipment for beneficiation investigation. Waste Manag. 2018, 75, 103–123. [Google Scholar] [CrossRef]
  58. The World Bank. Population, Total-China. Available online: https://data.worldbank.org/indicator/SP.POP.TOTL?locations=CN (accessed on 22 October 2022).
  59. He, P.; Hu, G.; Wang, C.; Hewage, K.; Sadiq, R.; Feng, H. Analyzing present and future availability of critical high-tech minerals in waste cellphones: A case study of India. Waste Manag. 2021, 119, 275–284. [Google Scholar] [CrossRef]
  60. Thavalingam, V.; Karunasena, G. Mobile phone waste management in developing countries: A case of Sri Lanka. Resour. Conserv. Recycl. 2016, 109, 34–43. [Google Scholar] [CrossRef]
  61. Counterpoint. Thailand Smartphone Market to Decline Amidst COVID-19 Pandemic: Present Scenario and Outlook. Available online: https://www.counterpointresearch.com/thailand-smartphone-market-to-decline-amidst-covid-19-pandemic-present-scenario-and-outlook/ (accessed on 9 September 2022).
  62. The World Bank. GDP Growth (Annual%)-Thailand. Available online: https://data.worldbank.org/indicator/NY.GDP.MKTP.KD.ZG?end=2021&locations=TH&start=2016 (accessed on 8 September 2022).
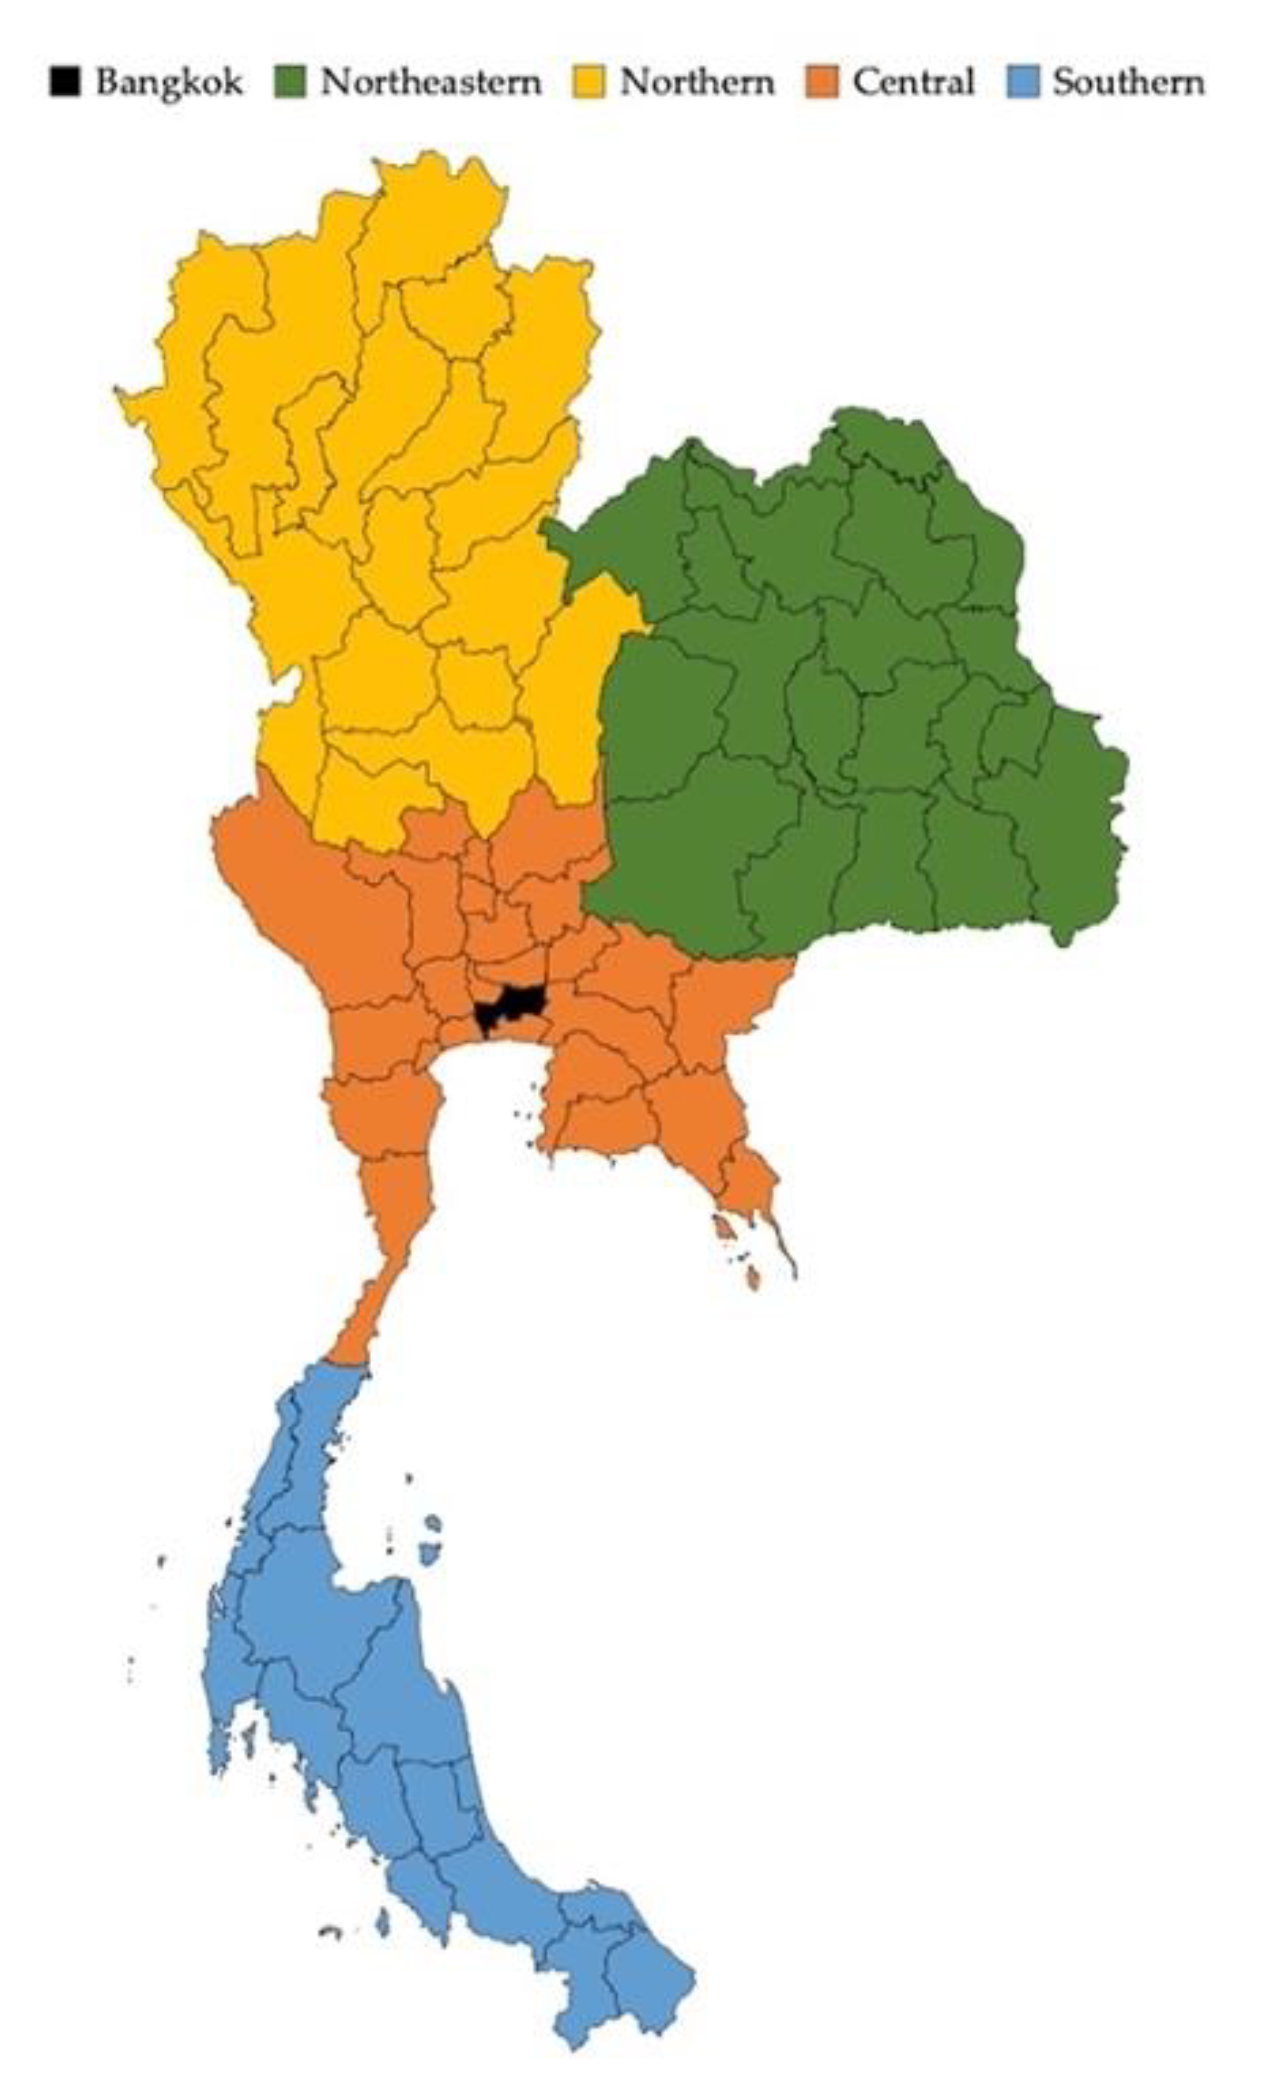
Figure 1. A map showing the five study areas that cover 77 provinces in Thailand.
Sustainability 14 17025 g001
Figure 2. The possible range of DMP generation quantities (tons/year) between 2012 and 2021 in Thailand from different estimation methods.
Sustainability 14 17025 g002
Figure 3. Average DMP generation (tons/year) and generation rate per user (g/user) in Thailand from 2012 to 2021.
Sustainability 14 17025 g003
Figure 4. Estimated amount and distribution of DMP generation in Thailand (2021) by area.
Sustainability 14 17025 g004
Figure 5. Density map of DMP generation in Thailand (2021) by province.
Sustainability 14 17025 g005
Figure 6. Sensitivity analysis of metal contents in PCBs from DMP generation in Thailand in 2021 by mineral group.
Sustainability 14 17025 g006
Table 1. Literature review of the concentration of metals in the PCBs from discarded mobile phones.
MineralElementSymbolMetal Concentration
(mg/kg of PCBs)
Reference
RangeAverage Value
Iron and ferroalloysCobaltCo211–1000591[19,20,21,50]
IronFe6600–150,00034,366[19,20,21,34,50,55,56]
ManganeseMn18321832[19]
MolybdeniteMo7272[19]
NickelNi12,240–54,00024,050[19,20,21,34,55,56]
Base metalsAluminumAl14,069–32,00023,086[19,20,21,50]
AntimonySb760–27791769[19,51]
CopperCu66,500–657,400377,327[19,20,21,34,50,55,56]
TinSn31,554–52,20042,987[20,21,34,50,55,56]
ZincZn2200–41,00014,246[19,20,21,50,55]
Precious metalsSilverAg194–38002272[19,20,21,23,34,50,55,56]
GoldAu65–1800843[19,20,21,23,34,50,55,56,57]
Rare earth elements (REEs)CeriumCe3–8142[19,57]
ScandiumSc3–3017[19,57]
ThoriumTh495495[19]
TitaniumTi6500–14,31910,410[19,34]
VanadiumV8–1612[19,57]
ZirconiumZr19501950[19]
Platinum-group metals (PGMs)PalladiumPd39–300186[20,23,50,55]
PlatinumPt2–2614[20,56]
ToxicMetalloidArsenicAs40–4844[19,57]
MetalsCadmiumCd1–1000335[19,21,51]
ChromiumCr1100–14,0004092[19,20,21,34,51]
LeadPb1900–24,00013,151[19,20,21,34,50,55,56]
Table 2. The amount of DMP generation from each estimation method.
YearApproximation 2Time StepSimple DelayAverage DMPs Generation
L = 2 YearsL = 3 YearsL = 4 Years
201221.4113.8517.8012.8113.9615.97
201324.6516.7220.1617.8012.8118.43
201425.9021.7421.4120.1617.8021.40
201526.2820.4424.6521.4120.1622.59
201628.6911.9625.9024.6521.4122.52
201717.4415.5826.2825.9024.6521.97
201812.799.3328.6926.2825.9020.60
201917.4012.7817.4428.6926.2820.52
202015.3728.9612.7917.4428.6920.65
202119.1814.6217.4012.7917.4416.29
Unit is million units/year.
Table 3. The potential metal contents in the printed circuit boards (PCBs) from discarded mobile phone generation in Thailand, 2021.
MineralElementSymbolAverage Concentration of Metal in PCBs
(kg/ton of PCBs)
Metal Content (tons)
Iron and ferroalloysCobaltCo0.590.24
IronFe34.3714.16
ManganeseMn1.830.75
MolybdeniteMo0.070.03
NickelNi24.059.91
Base metalsAluminumAl23.099.51
AntimonySb1.770.73
CopperCu377.33155.47
TinSn42.9917.71
ZincZn14.255.87
Precious metalsSilverAg2.270.94
GoldAu0.840.35
Rare earth elements (REEs)CeriumCe0.0420.017
ScandiumSc0.0170.007
ThoriumTh0.490.204
TitaniumTi10.414.29
VanadiumV0.0120.005
ZirconiumZr1.950.80
Platinum-group metals (PGMs)PalladiumPd0.190.76
PlatinumPt0.0140.006
ToxicMetalloidArsenicAs0.0440.018
MetalsCadmiumCd0.330.13
ChromiumCr4.091.69
LeadPb13.155.42
Publisher’s Note: MDPI stays neutral with regard to jurisdictional claims in published maps and institutional affiliations.