Technical Note

Monitoring and Prediction of Particulate Matter (PM2.5 and PM10) around the Ipbeja Campus

by
Flavia Matias Oliveira Silva
1,*,
Eduardo Carlos Alexandrina
2,
Ana Cristina Pardal
1,
Maria Teresa Carvalhos
1 and
Elaine Schornobay Lui
3
1
Polytechnic Institute of Beja, 7800-000 Beja, Portugal
2
Department of Mining Engineering, Federal University of Mato Grosso, Várzea Grande 78060-900, MT, Brazil
3
Department of Engineering, Federal Technological University of Paraná, Francisco Beltrão 85884-000, PR, Brazil
*
Author to whom correspondence should be addressed.
Sustainability 2022, 14(24), 16892; https://doi.org/10.3390/su142416892
Submission received: 30 September 2022 / Revised: 2 November 2022 / Accepted: 14 December 2022 / Published: 16 December 2022
(This article belongs to the Special Issue Sustainable Cities and Regions – Statistical Approaches)

Abstract

:
Nowadays, most of the world’s population lives in urban centres, where air quality levels are not strictly checked; citizens are exposed to air quality levels over the limits of the World Health Organization. The interaction between the issuing and atmospheric sources influences the air quality or level. The local climate conditions (temperature, humidity, winds, rainfall) determine a greater or less dispersion of the pollutants present in the atmosphere. In this sense, this work aimed to build a math modelling prediction to control the air quality around the campus of IPBeja, which is in the vicinity of a car traffic zone. The researchers have been analysing the data from the last months, particle matter (PM10 and PM2.5), and meteorological parameters for prediction using NARX. The results show a considerable increase in particles in occasional periods, reaching average values of 135 μg/m3 for PM10 and 52 μg/m3 for PM2.5. Thus, the monitoring and prediction serve as a warning to perceive these changes and be able to relate them to natural phenomena or issuing sources in specific cases.

1. Introduction

The growth of urban agglomerations has created adverse conditions for the quality of life in urban areas in recent decades [1,2]. One of the systems that has most suffered from this degradation is atmospheric air. It has drawn much more public attention over the past couple of years and has become a severe global environmental issue [3,4].
Air pollution is directly related to air quality, which depends on pollutant emissions and weather conditions in a given location. The occurrence of natural disasters (floods, cyclones) and the conditions of atmospheric stability may contribute to the dispersion of pollutants, or, on the other hand, it may support their continued presence in the lower atmospheres [5]. Air pollution poses a great environmental risk to health. Exposure to outdoor fine particulate matter (particulate matter with an aerodynamic diameter < 2.5 μm) is the fifth leading risk factor for death in the world, accounting for 4.2 million deaths and >103 million disability-adjusted life years lost, according to the Global Burden of Disease Report. The World Health Organization attributes 3.8 million additional deaths to indoor air pollution. Air pollution can cause acute harm, usually manifested by respiratory or cardiac symptoms, as well as chronically, potentially affecting every organ in the body. It can cause, complicate, or exacerbate many adverse health conditions [6].
Thurston et al. [7] agree with this consideration and discuss in their work how this is a significant risk factor for chronic respiratory diseases (CRDs) with well-documented adverse health impacts on humans. They primarily studied the effects of air pollution on the respiratory system and the effects of air pollution on human health from an extensive review. Nowadays, the majority of reviews investigate health outcomes of respiratory diseases in children, as well as cardiovascular diseases at all ages. The study by [8] combined health outcomes and air pollutants; PM2.5 was included in the health outcomes of a higher number of reviews, mainly cardiovascular diseases.
In addition, the particles and gases contain toxic chemical compounds which can have harmful health effects and may have carcinogenic potential. The particle matter with the most significant human health effects consists of particles smaller than 10 μm, as they are so small that they can reach the respiratory tract. Moreover, particles of less than 2.5 μm can reach the alveoli. The exacerbating factor is that such fine dust can remain suspended for long periods. Another aggravating factor is that the wind transports them over considerable distances from the source [4,9].
Urban centres usually have a great number of sources: industrial activities, a large vehicle fleet and high levels of traffic. Such sources promote significantly higher anthropogenic pollution in city centre areas and surroundings. As a result, the use of sensors to monitor the particle material for sampling is appropriate [10,11]. Castanho, A.D.A.; Artaxo, P. (2002) [12] in research conducted in Patras, Greece, estimated that vehicle emissions accounted for 12 percent of PM10. Badura, M. et al. (2020) [13] identified the main sources of atmospheric PM2.5 in the metropolitan region of São Paulo as vehicles, re-suspension of soil particles, fuel combustion and industrial emissions.
According to [14], low-cost sensors provide an opportunity to improve the spatial and temporal resolution of air quality measurements. Networks of such devices may complement traditional air quality monitoring and provide some useful information about pollutants and their impact on health. This could be observed with nodes arranged vertically on two buildings. PM2.5 concentrations were two to four times greater near the top parts of the buildings than near the ground. The effect of stratification of PM2.5 levels was observed under conditions of temperature inversion.
According to Elaine Lui [4], in recent years, forecast models of particle matter have been proposed as a helpful tool for the management of air quality in several cities around the world. There are many deterministic models to assess and predict the dispersion of pollutants in urban areas; however, most of them are causal and therefore fail to predict extreme concentrations [15]. Artificial intelligence models, such as neural networks, have already proven to be efficient in several areas and have shown excellent results in the modelling and prediction of time series [16,17,18]. Moursi et al. [19] worked with an extensive PM2.5 dataset from the cities of Beijing and Manchester and presented improved accuracy using the combination of models based on the nonlinear autoregressive exogenous (NARX) approach.
This work explored and adapted the skills of nonlinear self-regressive networks with exogenous input (NARX) in the predicting of particle matter PM10 and PM2.5 measured at the Polytechnic Institute of Beja, located in the city of Beja, in the Alentejo Region, Portugal. This NARX network was successfully applied for the prediction of the PM10 particle material collected in the city of São Carlos (state of São Paulo, Brazil [4] and Agadir, Morocco [20]) and PM10/PM in the city of Punjab, Pakistan [21].
NARX models relate the current value of a time series to past values of the same time series and to the current and past values of other exogenous time series. It can perform predictions of an entire sequence at once; that is, an output neuron predicts a vector with multiple values. It is necessary to use the same length for input and output sequences.
This study is an exploratory work and will be the beginning of this type of work, which has not yet been carried out in this region of Portugal. The use of these tools is an essential upgrade for the future since climate change brings us new challenges every day.

2. Materials and Methods

The experimental equipment quantifies the concentration of particulate matter in the air and monitors the meteorological parameters in the Agrarian School of the Polytechnic Institute of Beja in the Alentejo Region in Portugal (Figure 1). It is housed on the first floor, about five meters high and four meters away from the street, where there is intense vehicle traffic.
Figure 2 shows the inside of the equipment, containing a NOVA SDS011 particle sensor (1), an ESP8266 NodeMCUv3 microcontroller (2), a BME280 temperature, humidity and pressure sensor (3) and a suction tube (4).
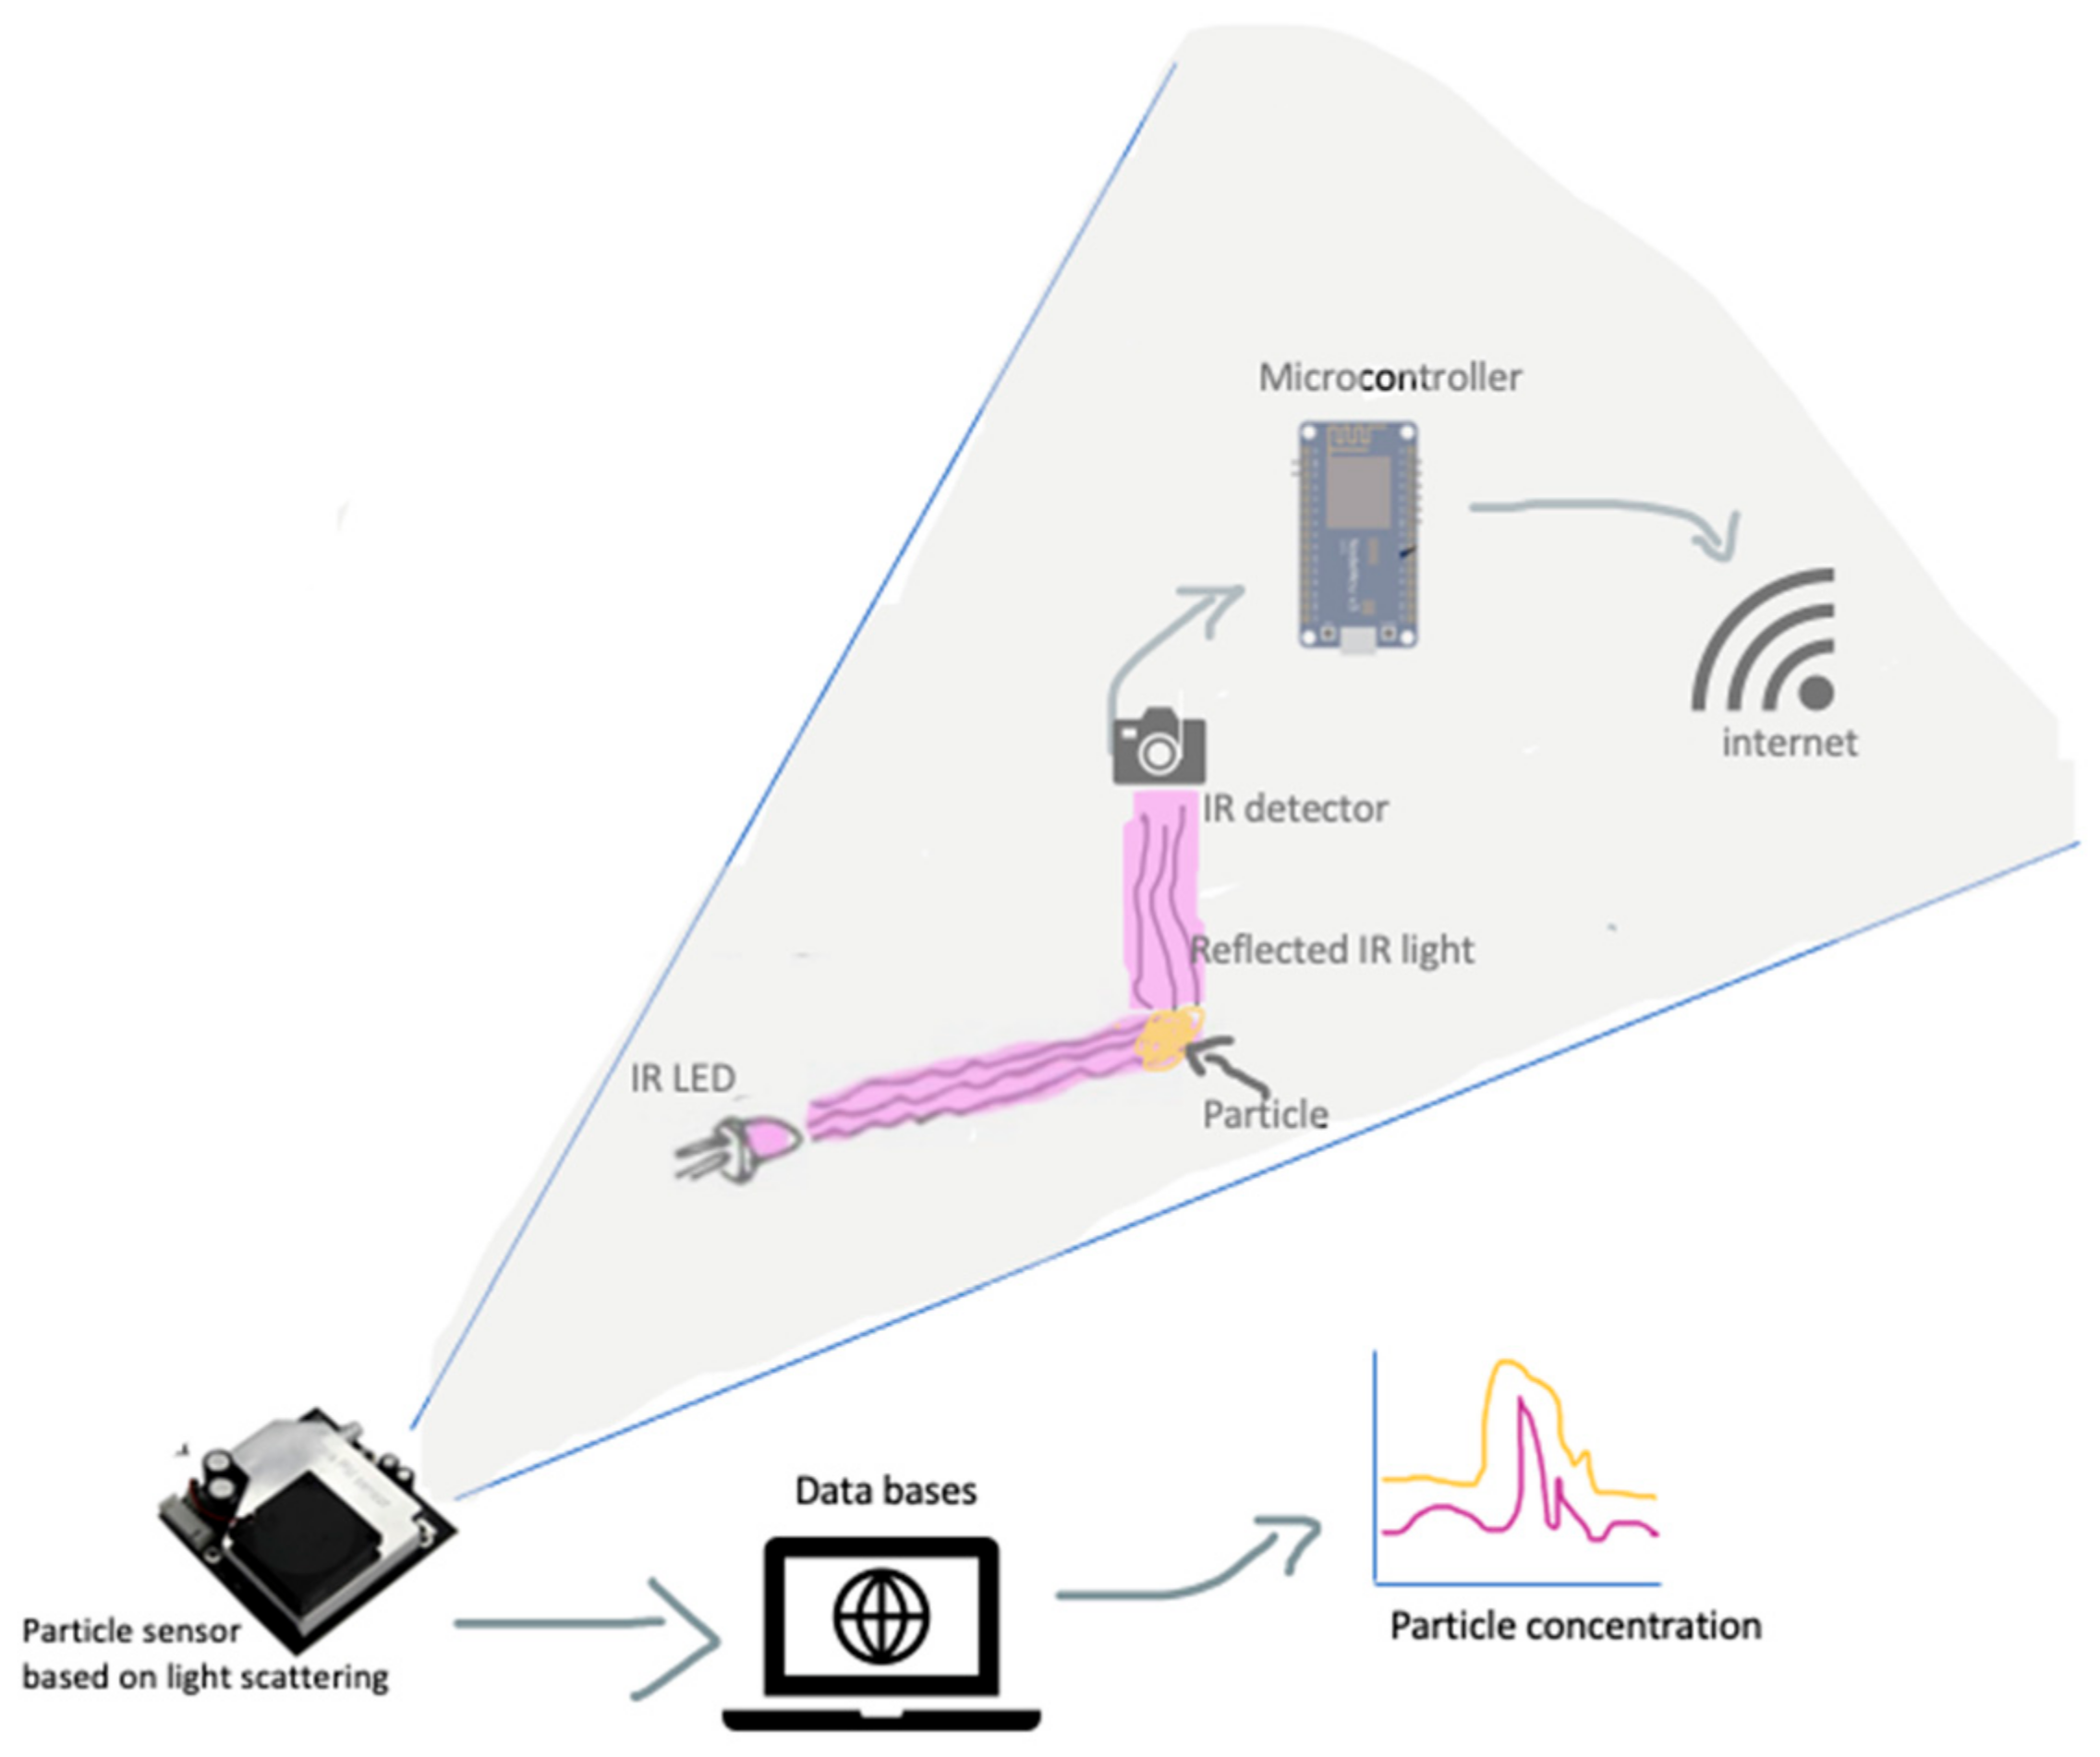
Figure 3 shows the data acquisition scheme, step by step, where the sensor received the reflected IR light from an IR LED. After this, the data are sent to a microcontroller that sends the data to the internet by Wi-Fi, after which it is possible to verify the data and see the particle concentration in graphics.
The particle sensor has a measuring device accuracy of 0–999.9 μg/m3 and a detection threshold of 0.3 μm. The operation conditions are temperature −20–50 degrees Celsius and humidity up to approximately 70 percent. Its lifespan is around 5 years. [22] evaluated the accuracy of the equipment, and as the Nova SDS011 sensor presented coefficients of variation below 10%, the sensor has acceptable accuracy according to the EPA standard. The equipment can take 30 measurements per hour of PM10 and PM2.5, which are then tracked and stored on a website via the internet. Data analysis in this paper focuses on the results of the measurements carried out between February 2022 and July 2022, which in Portugal comprises spring and summer, reaching temperatures of 42 degrees Celsius. This period was chosen because it is the longest period of time without interruption that could be obtained.

NARX Predictive Models

The architecture of the NARX network allows the selection of the number of exogenous inputs and what delay should be used in the training and prediction process. This neural network model has been extensively used for time series prediction. The NARX- type neural network (nonlinear autoregressive exogenous model) was used as described in the work of Schornobay–Lui et al. [4] because, in that work, the NARX network proved to be more efficient than the neural architecture of multi-layer perceptron (MLP). The NARX-type network architecture receives data from the feedback itself with time delay, thus making the result dynamic; that is, values obtained previously influence the later results, and this occurs in the concentration values of particulate matter, further justifying its use in this type of work.
In this work, the mean values of temperature and daily concentration of PM2.5 and PM10 were used as network data, and, as a network output, particulate matter concentration data were used. To build and apply NARX models, MATLAB 2022b (Math-works Inc., Natick, MA, USA, 2022) was used and the Deep Learning Toolbox. Temperature and concentration data were normalised and ranged from 0.1 to 0.9.
The NARX neural network, which was used in this study, was run with the Levenberg-Marquardt training algorithm and the stop criterion was absolute error close to 10−3 after 150 validation error checks.

3. Results and Discussion

The results of the monitoring of particulate matter 10 and 2.5 obtained during the spring and summer in the city of Beja in Alentejo, Portugal, are shown in Figure 4. The results mostly remain within the standards reviewed by the legislation. Beja is the capital of Alentejo, but the region is not very populous and has a large geographical area that helps in the dispersion of pollutants.
On the other hand, some natural phenomena can increase this problem, for example, sand coming from the Sahara Desert, carried by rain and wind. Due to the atmospheric depression “Célia”, the city of Beja, located in the south of Portugal, has shown high levels of particle matter (PM10 and PM2.5) at certain times of the year. Research has been conducted [23] about the dust that is carried from the Sahara Desert in the Iberian Peninsula (IP), and one of the results obtained from this research showed that dust events across the IP were induced by different circulation weather types, affecting air quality. These results are also important as an aid to air quality forecasting since the high concentrations of atmospheric pollution and intrusion events are associated with less frequent circulation weather types. The occurrence of these circulation weather types can therefore be used as a warning signal for the occurrence of extreme events [23].
The results obtained show a considerable increase in particles in the air during the monitoring period, reaching values of 135 μg/m3 for PM10 and 52 μg/m3 for PM2.5. These values are above the maximum limit indicated by Portuguese legislation, according to Decree-Law No 102/2010. In its second amendment (Decree-Law 47/2017), the maximum limit for a period of 24 hours of sampling is 50 μg/m3 (PM10), which cannot be exceeded more than 35 times per year, while for particulate matter PM2.5, the annual limit is 40 μg/m3 [24].
This phenomenon occurs more frequently in this region of Portugal due to climate change, putting the health of the population at risk. Air quality monitoring is of paramount importance to the effects of pollution control on the environment and human health [25].

NARX Predictive Models

The results of the prediction model were produced with MatLab. The data were submitted to training, validation and testing steps by the NARX neural network, with these divisions occurring randomly in the data set.
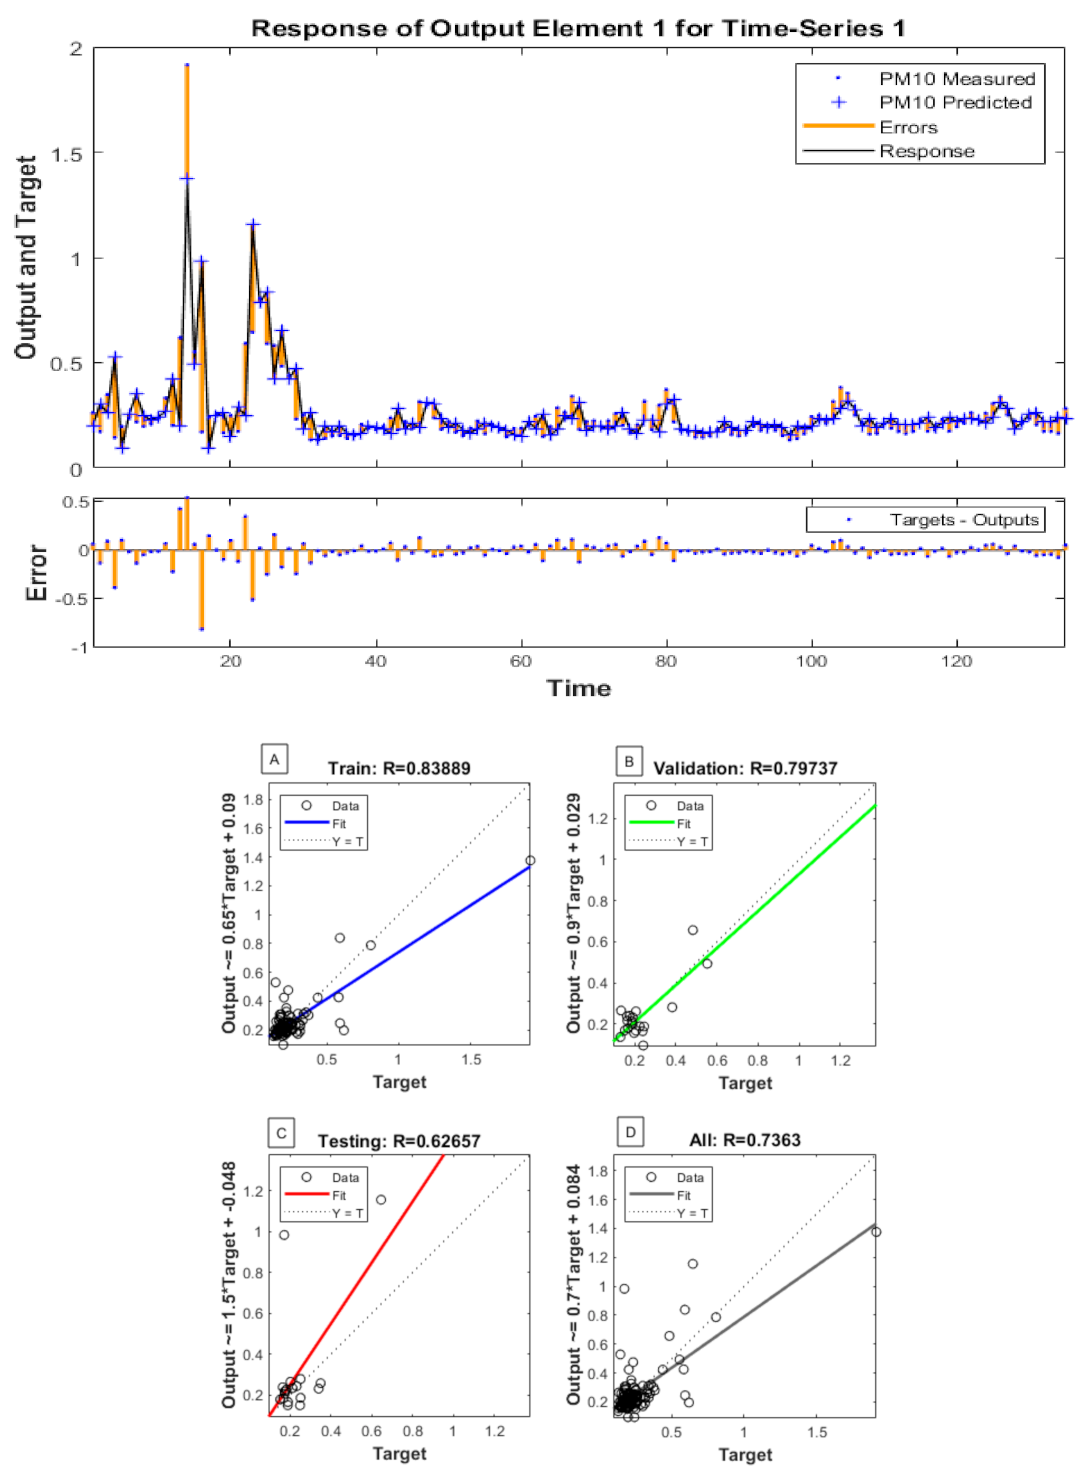
Figure 5 and Figure 6 show the results obtained by predicting PM10 and PM2.5 concentrations using the NARX model. Data adjustment by the prediction model was more efficient for PM10 than for PM2.5 on the NARX network. The input data in the NARX model were normalised and ranged from 0.1 to 0.9. The prediction results of PM10 and PM2.5 concentration covered the extreme values on a smaller scale. Analysing the graphs, it can be observed that the forecast for PM2.5 presented a greater distance between the monitored and the predicted data. This means that the network presented a greater capacity to capture the variations that occurred in PM10, including the data with higher concentration (135 μg/m3) from an atypical event in the region.
Figure 6 shows the regression graphs that compare the measured and predicted values of the two best results, considering the training, validation, and testing stages of the total data set. Comparing the regression graphs, the NARX-PM10 presented slightly better efficiency in the training, validation and test stages when compared with NARX-PM2.5. The NARX-PM10 network presented faster convergence with more minor deviations of forecast validation than the NARX-PM2.5 network. In future work for the region, investigations will be done to improve the understanding of the interactions between PM10 and PM2.5, which could improve the efficiency of prediction models for inhalable particulate matter.
Evaluations with neural network models, which manage to capture trends which are often not possible in the more traditional statistical models, are also interesting for a better understanding over time of variations due to climate change. This approach can be highly valuable and can be easily used as a complementary tool for forecasts, distinguishing between air masses coming from different areas and, therefore, is an advantage of the impact of studies which intend to assess the effects of dust on human health, ecosystems, or rain composition.

4. Conclusions

Regarding the data collected, it was compared to the data feed on the NARX network for PM10 and MP2.5. There was a decrease in the concentration of PM10 over time, and while the concentration of PM2.5 remained variable over time, it was not able to predict a tendency to decrease or increase the levels of this PM2.5 particulate matter.
Overall, the concentration of particulate matter in this place is stable without significant changes because it has a low demographic and a vast expanse of land without many industries or transit agglomerations.
Additionally, a natural phenomenon occurring more and more in Europe is the dust from the Sahara Desert that is swept by the wind into this region. Thus, it was possible to observe the variation in this period of the year resulting from this phenomenon.
The neural network could not effectively identify the behaviour of PM2.5. The network architecture used was applied and described in the work of Schornobay-Lui et al. [4]; specific conditions for the IPBeja region will be considered in future work and over a longer period of time. Nevertheless, the conclusion of this research was that with the data obtained from the monitoring around the IPBeja campus, it was possible to make a prediction using the NARX tool, so the continuity of work in the use of NARX will be promising for future works.
Future studies will be conducted with a database that is more extensive to analyse the influence of other weather variables, such as temperature, in the prediction of particulate matter in this region.
Finally, the contribution of this work is the availability, discussion and search of the understanding of the concentration data of particulate matter for the IPBeja region, with the lack of data on air quality. This is essential for understanding the behaviour and origin of pollution sources over time, especially with the present-day modification of patterns due to climate change.

Author Contributions

Conceptualisation, F.M.O.S., E.S.L. and E.C.A.; methodology, F.M.O.S., E.S.L. and E.C.A., software, E.S.L.; validation, A.C.P. and M.T.C.; formal analysis, F.M.O.S., E.C.A., E.S.L., A.C.P. and M.T.C.; investigation, F.M.O.S., resources, F.M.O.S. and E.S.L.; data curation, F.M.O.S.; writing—original draft preparation, F.M.O.S. and E.C.A.; writing—review and editing, F.M.O.S., E.C.A., E.S.L., A.C.P. and M.T.C.; visualisation, F.M.O.S., E.C.A., E.S.L., A.C.P. and M.T.C.; supervision, F.M.O.S., E.C.A., E.S.L., A.C.P. and M.T.C. All authors have read and agreed to the published version of the manuscript.

Funding

This research received no external funding.

Institutional Review Board Statement

Not applicable.

Informed Consent Statement

Not applicable.

Data Availability Statement

Not applicable.

Acknowledgments

The authors thank the Project MapeAr together with Aspea Portugal for the monitoring sensor.

Conflicts of Interest

The authors declare no conflict of interest.

References

  1. Tan, Y.; Han, S.; Chen, Y.; Wu, Z.; Lee, S. Long-term variation and evaluation of air quality across Hong Kong. J. Environ. Sci. 2023, 127, 284–294. [Google Scholar] [CrossRef] [PubMed]
  2. Kim, K.H.; Kabir, E.; Kabir, S. A review on the human health impact of airborne particulate matter. Environ. Int. 2015, 74, 136–143. [Google Scholar] [CrossRef] [PubMed]
  3. Liu, Z.R.; Hu, B.; Ji, D.S.; Cheng, M.T.; Gao, W.K.; Shi, S.Z.; Xie, Y.Z.; Yang, S.H.; Gao, M.; Fu, H.B.; et al. Characteristics of fine particle explosive growth events in Beijing, China: Seasonal variation, chemical evolution pattern and formation mechanism. Sci. Total Environ. 2019, 687, 1073–1086. [Google Scholar] [CrossRef] [PubMed]
  4. Schornobay-Lui, E.; Alexandrina, E.C.; Aguiar, M.L.; Hanisch, W.S.; Corrêa, E.M.; Corrêa, N.A. Prediction of short and medium term PM10 concentration using artificial neural networks. Manag. Environ. Qual. Int. J. 2019, 30, 414–436. [Google Scholar] [CrossRef]
  5. World Health Organization (WHO). Health Topics: Chronic Respiratory Diseases? Available online: https://www.who.int/health-topics/chronic-respiratory-diseases#tab=tab_1 (accessed on 22 June 2022).
  6. Schraufnagel, D.E.; Balmes, J.R.; Cowl, C.T.; De Matteis, S.; Jung, S.H.; Mortimer, K.; Perez-Padilla, R.; Rice, M.B.; Riojas-Rodriguez, H.; Sood, A.; et al. Air pollution and noncommunicable dis- eases: A review by the forum of international respiratory societies’ environmental committee, part 1: The damaging effects of air pollution. Chest 2019, 155, 40916. [Google Scholar] [CrossRef] [Green Version]
  7. Thurston, G.D.; Kipen, H.; Annesi-Maesano, I.; Balmes, J.; Brook, R.D.; Cromar, K.; de Matteis, S.; Forastiere, F.; Forsberg, B.; Frampton, M.W.; et al. A joint ERS/ATS policy statement: What con- stitutes an adverse health effect of air pollution? An analytical framework. Eur. Respir. J. 2017, 49, 1600419. [Google Scholar] [CrossRef] [Green Version]
  8. Dominski, F.H.; Branco, J.H.L.; Buonano, G.; Stabile, L.; da Silva, M.G.; Andrade, A. Effects of air pollution on health: A mapping review of systematic reviews and meta-analyses. Environ. Res. 2021, 201, 111487. [Google Scholar] [CrossRef]
  9. Watson, J.G.; Chow, J.C. Source characterization of major emission sources in the Imperial and Mexicali valleys along the US/Mexico border. Sci. Total Environ. 2001, 276, 33–47. [Google Scholar] [CrossRef]
  10. Sternbeck, J.; Sjödin, A.; Andréasson, K. Metal emissions from road traffic and the influence of resuspension—Results from two tunnel studies. Atmos. Environ. 2002, 36, 4735–4744. [Google Scholar] [CrossRef]
  11. Pikridas, M.; Tasoglou, A.; Florou, K.; Pandis, S.N. Characterization of the origin of fine particulate matter in a medium size urban area in the Mediterranean. Atmos. Environ. 2013, 80, 264–274. [Google Scholar] [CrossRef]
  12. Castanho, A.D.A.; Artaxo, P. Wintertime and summertime São Paulo aerosol source apportionment study. Atmos. Environ. 2001, 35, 4889–4902. [Google Scholar] [CrossRef]
  13. Badura, M.; Sówka, I.; Szymański, P.; Batog, P. Assessing the usefulness of dense sensor network for PM2.5 monitoring on an academic campus area. Sci. Total Environ. 2020, 722, 137867. [Google Scholar] [CrossRef] [PubMed]
  14. Jakeman, A.J.; Simpson, R.W.; Taylor, J.A. Modeling distributions of air pollutant concentrations–III. The hybrid deterministic-statistical distribution approach. Atmos. Environ. 1988, 22, 163–174. [Google Scholar] [CrossRef]
  15. Adnane, A.; Leghrib, R.; Chaoufi, J.; Chirmata, A. Prediction of PM10 concentrations in the city of Agadir (Morocco) using non-linear autoregressive artificial neural networks with exogenous inputs (NARX). Mater. Today Proc. 2022, 52 Pt 1, 146–151. [Google Scholar] [CrossRef]
  16. Dhafer, A.H.; Nor, F.M.; Alkawsi, G.; Al-Othmani, A.Z.; Shah, N.R.; Alshanbari, H.M.; Khairi, K.F.B.; Baashar, Y. Empirical Analysis for Stock Price Prediction Using NARX Model with Exogenous Technical Indicators. Comput. Intell. Neurosci. 2022, 2022, 9208640. [Google Scholar] [CrossRef]
  17. Yanga, Y.; Kima, K.; Koub, R.; Lib, Y.; Fub, J.; Zhaoa, L.; Liu, H. Prediction of effluent quality in a wastewater treatment plant by dynamic neural network modeling. Process Saf. Environ. Prot. 2022, 158, 515–524. [Google Scholar] [CrossRef]
  18. Xiaoshu, G.; Cheng, C.; Hetao, H.; Shenghu, J. Response prediction using the PC-NARX model for SDOF systems with degradation and parametric uncertainties. Earthq. Eng. Eng. Vib. 2022, 21, 325–340. [Google Scholar] [CrossRef]
  19. Moursi, A.S.A.; El-Fishawy, N.; Djahel, S.; Shouman, M.A. Enhancing PM2.5 Prediction Using NARX-Based Combined CNN and LSTM Hybrid Model. Sensors 2022, 22, 4418. [Google Scholar] [CrossRef]
  20. Bukhari, A.H.; Raja, M.A.Z.; Shoaib, M.; Kiani, A.K. Fractional order Lorenz based physics informed SARFIMA-NARX model to monitor and mitigate megacities air pollution. Chaos Solitons Fractals 2022, 161, 112–375. [Google Scholar] [CrossRef]
  21. Russo, A.; Sousa, P.M.; Durão, R.M.; Ramos, A.M.; Salvador, P.; Linares, C.; Díaz, J.; Trigo, R.M. Saharan dust intrusions in the Iberian Peninsula: Predominant synoptic conditions. Sci. Total Environ. 2020, 717, 137041. [Google Scholar] [CrossRef]
  22. Hapidin, D.A.; Saputra, C.; Maulana, D.S.; Munir, M.M.; Khairurrijal, K. Aerosol Chamber Characterization for Commercial Particulate Matter (PM) Sensor Evaluation. Aerosol Air Qual. Res. 2019, 19, 181–194. [Google Scholar] [CrossRef] [Green Version]
  23. Messeri, G.; Benedetti, R.; Crisci, A.; Gozzini, B.; Rossi, M.; Vallorani, R.; Maracchi, G. A new framework for probabilistic seasonal forecasts based on circulation type classifications and driven by an ensemble global model. Adv. Sci. Res. 2018, 15, 183–190. [Google Scholar] [CrossRef]
  24. Decreto-Lei n.o 47/2017.Diário da República n.o 90/2017, Série I de 2017-05-10. Available online: https://dre.pt/dre/detalhe/decreto-lei/47-2017-106982550 (accessed on 13 December 2022).
  25. Zhao, C.S.; Shao, N.F.; Yang, S.T.; Ren, H.; Ge, Y.R.; Zhang, Z.S.; Feng, P.; Liu, W.L. Quantitative assessment of the effects of human activities on phytoplankton communities in lakes and reservoirs. Sci. Total Environ. 2019, 665, 213–225. [Google Scholar] [CrossRef] [PubMed]
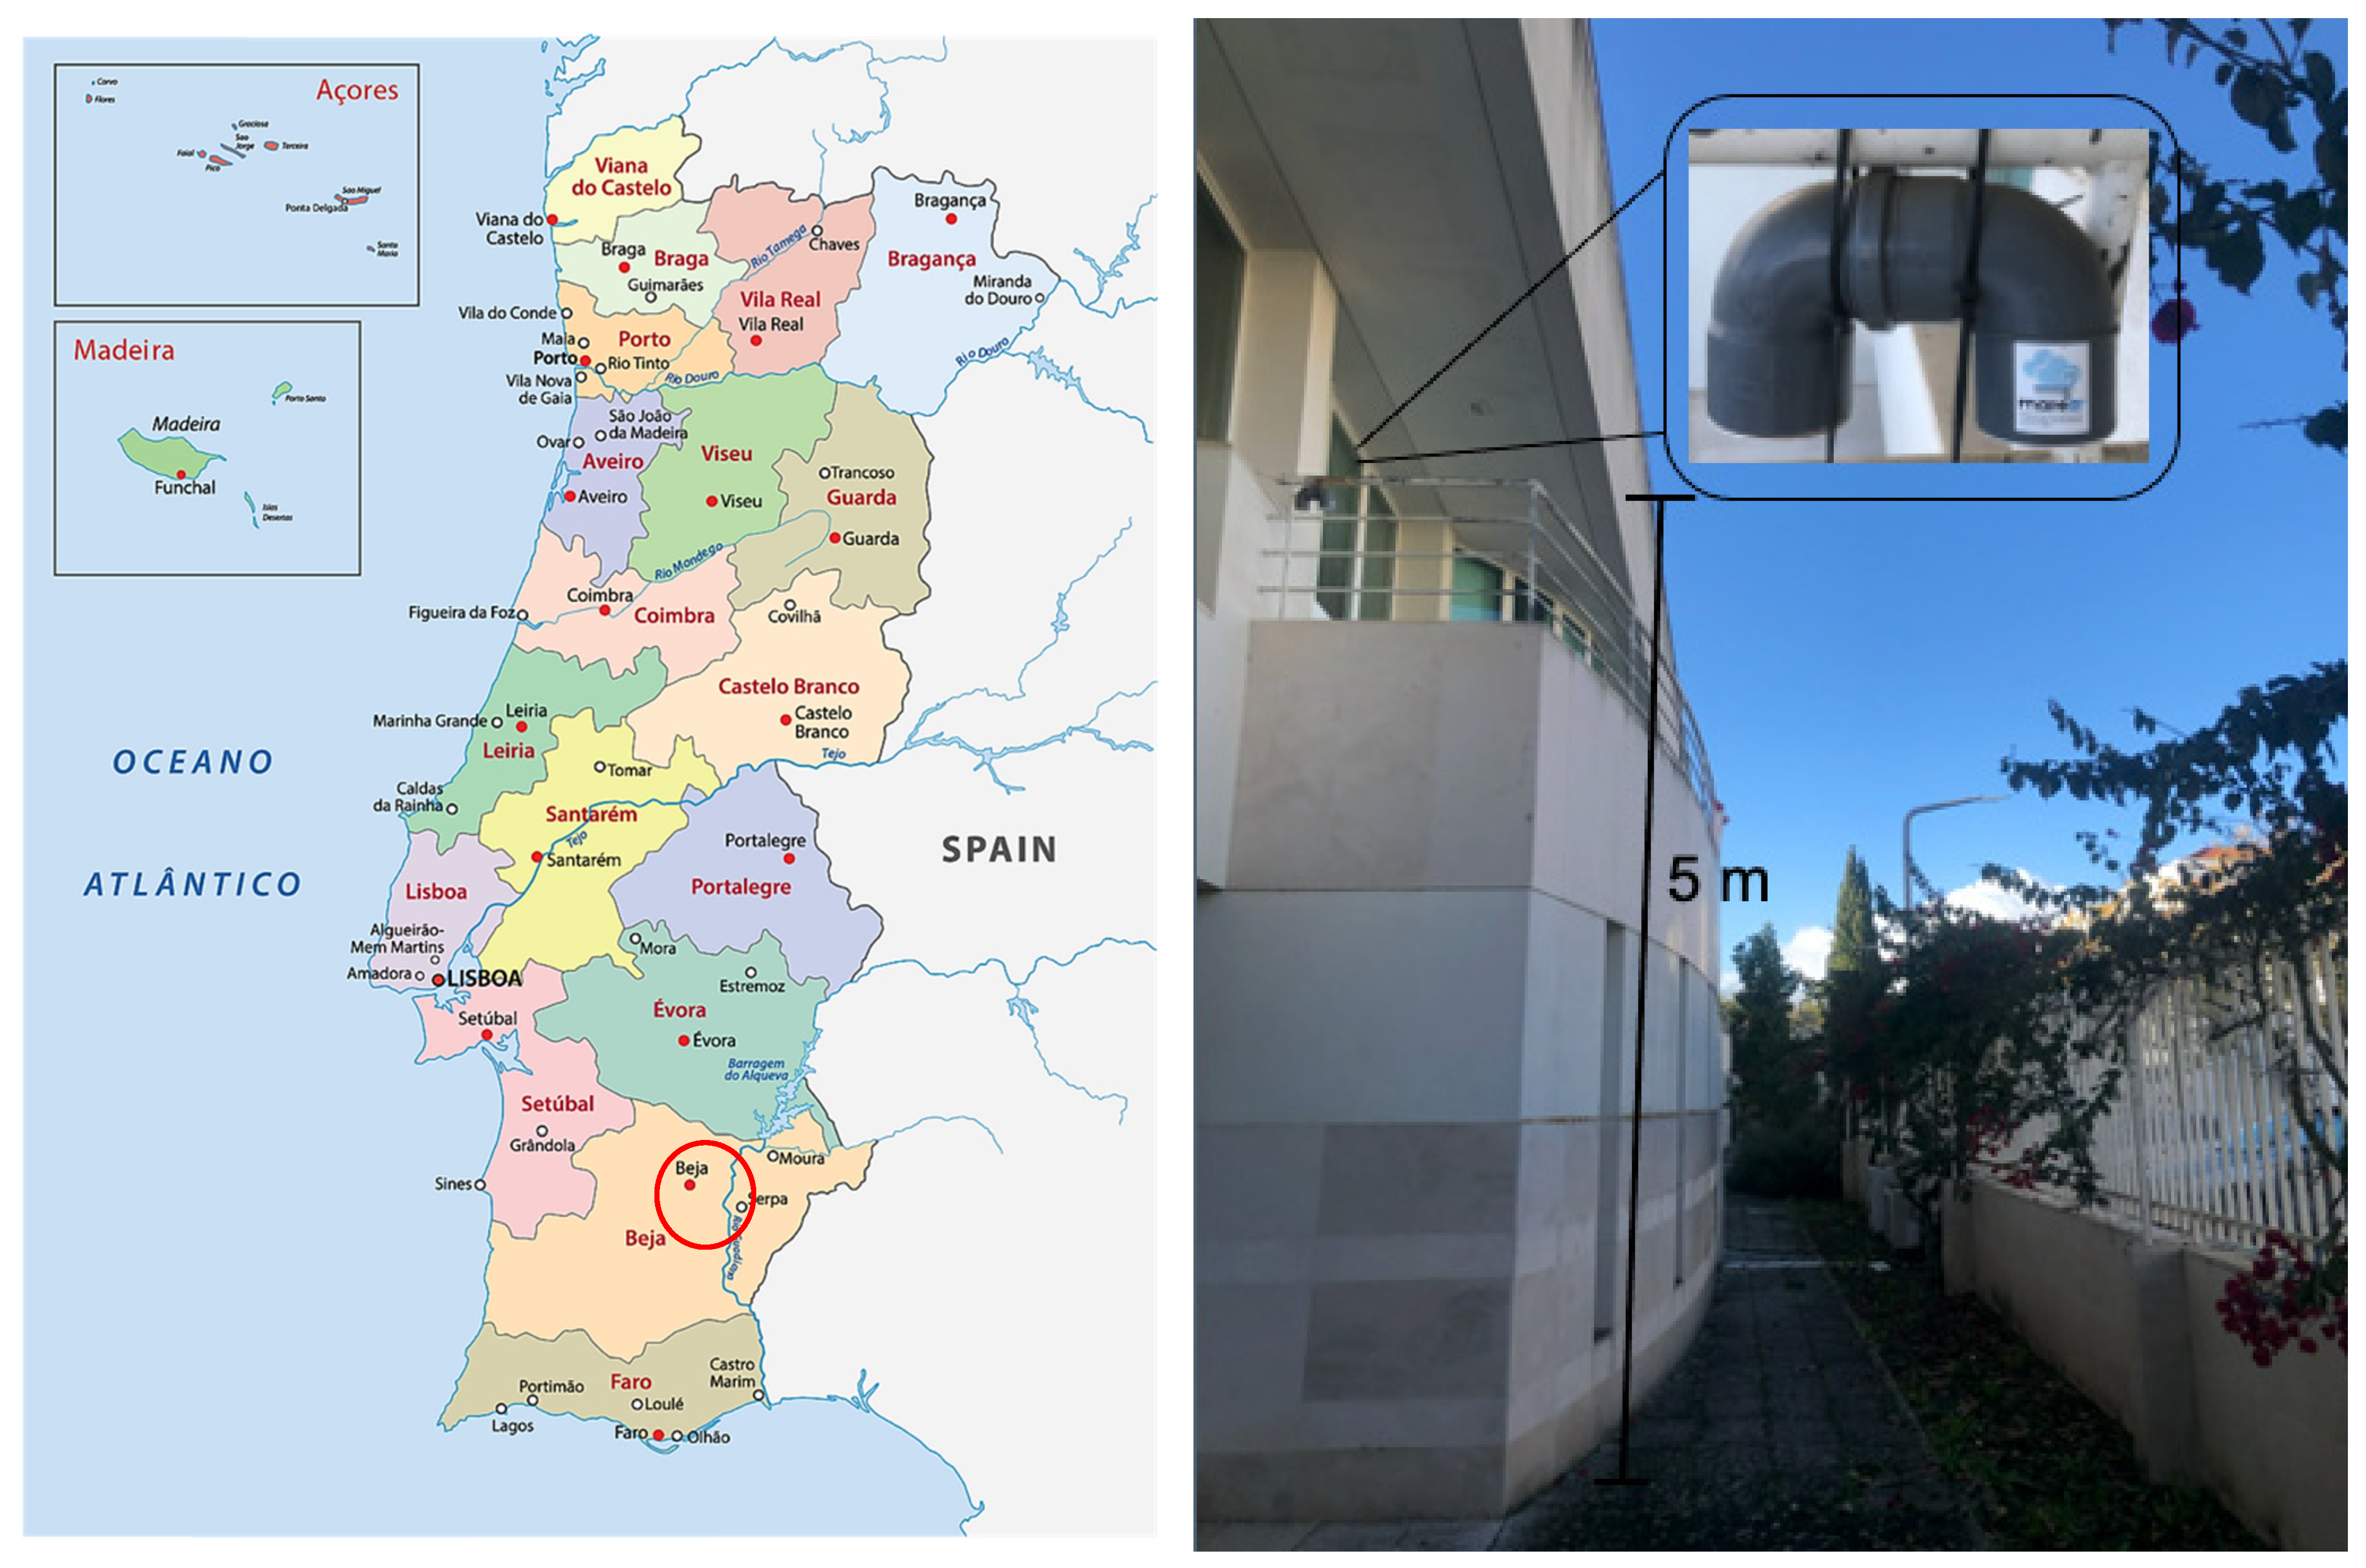
Figure 1. Location of the sensor on the map 247 G + 6 R Beja.
Sustainability 14 16892 g001
Figure 2. Inside of the equipment.
Sustainability 14 16892 g002
Figure 3. Data acquisition scheme.
Sustainability 14 16892 g003
Figure 4. Result of the PM2.5 and PM10 concentration by a sensor.
Sustainability 14 16892 g004
Figure 5. Result of the PM10 concentration prediction of the NARX model and regression charts for (A) training, (B) validation, (C) test and (D) all data considering the NARX PM10 model.
Sustainability 14 16892 g005
Figure 6. Result of the PM2.5 concentration prediction of the NARX model and regression charts for (A) training, (B) validation, (C) testing, and (D) all data considering the NARX PM2.5 model.
Sustainability 14 16892 g006
Publisher’s Note: MDPI stays neutral with regard to jurisdictional claims in published maps and institutional affiliations.