Article

Dynamic Analysis of Industrial Carbon Footprint and Carbon-Carrying Capacity of Zhejiang Province in China

1
College of Business, Quzhou University, 78 North Jiuhua Road, Quzhou 324000, China
2
School of Economics and Management, Northeast Petroleum University, No. 99 Xuefu Street High-Tech Development Zone, Daqing 163318, China
*
Author to whom correspondence should be addressed.
Sustainability 2022, 14(24), 16824; https://doi.org/10.3390/su142416824
Submission received: 9 November 2022 / Revised: 10 December 2022 / Accepted: 12 December 2022 / Published: 15 December 2022
(This article belongs to the Special Issue Low Carbon Energy and Sustainability)

Abstract

:
In studying the industrial carbon emissions in Zhejiang Province from 2015 to 2019, this paper calculates the carbon footprint, carbon-carrying capacity, net carbon footprint, and carbon footprint intensity of Zhejiang Province. The methods are recommended in the 2006 IPCC Guidelines for National Greenhouse Gas Inventories. The results show that (1) raw coal accounts for the highest proportion of carbon footprint in Zhejiang Province; (2) overall carbon-carrying capacity is stable first and then significantly increases, and forest land is the main carbon carrier; (3) the value of net carbon footprint is positive, which shows that the carbon-carrying capacity in the ecological environment is gradually increasing; and (4) the carbon footprint intensity of Zhejiang Province is reduced, and the energy utilization efficiency is improved. It shows that the carbon emission reduction policy of Zhejiang Province has made great achievements, but the per capita carbon footprint is far higher than the world average. According to the above analysis results, this paper puts forward four countermeasures and suggestions.

1. Introduction

At present, the world is facing a continuous increase in greenhouse gas emissions, and the resulting global warming is getting worse. Icebergs are melting at an unprecedented rate, and natural disasters occur frequently, all of which are caused by excessive greenhouse gas emissions into the atmosphere [1]. The issue of climate change has seriously threatened the sustainable development of economies and cities around the world, has affected the lives of many people, and has been a concern for all sectors of society [2]. In order to control greenhouse gas emissions and slow down global warming, carbon emission constraints have been imposed on developed and developing countries around the world through the Kyoto Protocol to the United Nations Framework Convention on Climate Change (UNFCCC) (2005), the Copenhagen Agreement (2009), the Cancun Climate Conference (2010), and the Paris Agreement (2016). The world advocates a low-carbon economy, and energy conservation and emission reduction are a major concern in China. President Xi of the People’s Republic of China announced at the 75th United Nations General Assembly on 22 September 2020, that China is striving to reach peak carbon dioxide emissions by 2030 and to achieve carbon neutrality by 2060 [3,4].
However, China is facing huge pressure in terms of energy conservation and emission reduction. China’s carbon emissions will be 10.523 billion tons in 2021, accounting for nearly 45% of the world’s carbon emissions [5,6]. Industrial carbon emissions account for nearly 70% of total carbon emissions [7,8], which is the focus of China’s energy conservation and emission reduction. As an important factor in the implementation of China’s dual carbon goals, Zhejiang Province leads the trend of China’s energy conservation and carbon reduction and high-quality economic development [9]. The practices of energy conservation and carbon reduction in Zhejiang Province are particularly relevant. Industrial energy conservation and carbon reduction is undoubtedly an important basis for the high-quality development of Zhejiang Province and the realization of dual carbon goals. The number of industrial enterprises above the designated size in Zhejiang Province reached 54,299 by February 2022 [10], which undoubtedly brings strong challenges to the reduction in carbon dioxide emissions in Zhejiang Province.
Therefore, this paper intends to analyze the sources of carbon emission and the dynamic changes in the carbon footprint of Zhejiang Province in China; study the changes in the structure, sources, and time dimensions of carbon emissions in Zhejiang Province; and calculate the carbon-carrying capacity and its distribution in Zhejiang Province. Through a comparative analysis of the carbon footprint and carbon-carrying capacity, the paper puts forward countermeasures for industrial energy conservation and carbon reduction in Zhejiang Province, which is an important reference for the development of the low-carbon economy and the construction of the demonstration area for ecological prosperity. The carbon footprint and carbon-carrying capacity analyzed in this paper are as follows. Carbon footprint refers to the total amount of greenhouse gases emitted by a region at a certain time [11]. Carbon-carrying capacity refers to the maximum value of carbon emissions that can be absorbed by all productive land within a certain region. Carbon-carrying capacity mainly analyzes the carbon absorption rate of green vegetation, which is the carbon absorption rate of forests, grasslands, and crops.
Taking Zhejiang Province as the research area, this paper analyzes the balance and relationship between the industrial carbon footprint and carbon-carrying capacity in Zhejiang Province in the past five years. This paper is mainly based on the calculation results of industrial carbon footprint, carbon-carrying capacity, net carbon footprint, and carbon footprint intensity of Zhejiang Province in 2015–2019. It also analyzes the dynamic change using time series data to more clearly show the trend of change in the carbon footprint strength of Zhejiang Province. Focusing on the industrial carbon footprint of Zhejiang Province, this paper analyzes the specific causes of the carbon deficit in Zhejiang Province, which is helpful to understand the resource and environmental carrying capacity, optimize the resource development and utilization structure, and implement the construction plan according to local conditions. This is of great significance to the sustainable development of Zhejiang Province. This study provides a reference for the future development of relevant policies such as those relating to greenhouse gas emissions in Zhejiang Province. It also provides reference suggestions on energy conservation and carbon reduction for Zhejiang Province, as well as tools for tracing the carbon footprint and carbon-carrying capacity of other regions and provinces.
The remainder of this study is arranged into five sections. Section 2 presents a literature review. Section 3 details the methodology, introducing the basic process of calculating the industrial carbon footprint of Zhejiang Province using the IPCC method and the calculation method of carbon-carrying capacity and carbon footprint strength. Section 4 presents the specific analysis process of industrial carbon footprint and carbon-carrying capacity in Zhejiang Province. Section 5 puts forward the analysis of results regarding industrial energy conservation and carbon reduction in Zhejiang Province and relevant suggestions. Section 6 presents the study’s conclusions.

2. Literature Review

With increased awareness of environmental protection, finding out how to effectively reduce carbon emissions and promote sustainable human development has become a common concern for all countries in the world. Therefore, the analysis of carbon footprint and carbon-carrying capacity has become a research hotspot worldwide. The ecological footprint theory was first proposed by William Rees (1992), a Canadian ecological economist, whose student Mathis Wackernagel improved it. Under the impact of the global scarce carbon emission space, it has become a global focus [12]. Mathews et al. established an economic input–output life cycle assessment model (EIO-LCA) in combination with the input–output model to assess the carbon footprint of industrial sectors, enterprises, households, etc. [13]. Brown et al. analyzed the carbon footprint of 100 large cities in the United States in 2005 and found that the energy utilization rate of large cities was higher than that of other cities [14]. Aichele calculated the carbon footprint of Kyoto and compared it with countries around the world [15]. Brown et al. took 100 major metropolitan areas in the United States as examples to analyze the carbon emissions of energy consumption in the transportation sector and the construction industry [16]. Hertwich et al. analyzed the carbon footprint of 73 countries and 14 gathering regions in the world [17]. Xiaolan Chen et al. calculated the carbon footprint of China’s financial industry in 2012 and 2017 based on life cycle theory and the input–output analysis method and found that technological innovation of financial products and the upgrading of capital supervision played an essential role in promoting the improvement of ecological efficiency [18].
According to the above literature, scholars paid more attentions to carbon footprint or carbon- carrying capacity singly, while few attentions to the dynamic equilibrium between carbon footprint and carbon-carrying capacity in industrial industry. Additionally, they are inclined to present new methods for carbon footprint or carbon-carrying capacity. Some new techniques to reduce the gap between caron footprint and carbon-carrying capacity should be emphasized initially. the current accounting methods for carbon footprints mainly include the Life Cycle Assessment (LCA), Measurement, Input–Output Assessment (IOA), Hybrid Life Cycle Assessment (HLCA), Intergovernmental Panel on Climate Change (IPCC), calculator method, etc. The IPCC method refers to the guidelines prepared by the United Nations Climate Change Commission to calculate greenhouse gas emissions in detail. It is currently an internationally recognized and commonly used carbon footprint assessment method [19,20]. Compared with other accounting methods of carbon footprints, the IPCC method is more practical, and the calculation results are more convincing, which can provide support for carbon emission control.
Rongqin Zhao et al. estimated the carbon emissions of fossil energy and rural biomass energy in China’s provinces and regions and established the corresponding relationship between different industrial spaces and carbon emissions of energy consumption [21]. Caihong Ma made a quantitative analysis of China’s energy consumption carbon footprint, carbon-carrying capacity, and carbon deficit. She compared China’s energy consumption carbon footprint with that of the United States, Germany, India, and other countries, and found that China’s total energy consumption carbon footprint was not optimistic, but the per capita value was far lower than that of developed countries such as the United States and Germany [22,23]. Ling Xiao [24], Xiuping Zhang [25], Yongqiang Cao [26], Guanfei Meng [27], and Shuaikang Liu [28], respectively, studied the carbon footprint of Shandong Province, Shanxi Province, Hebei Province, Xi’an City, and Guiyang City. In addition, scholars have used different methods to study the influencing factors of carbon emissions from energy consumption in different provinces and cities in China. The research field on carbon footprints is extensive, involving petrochemical, building materials, electromechanical, logistics, tourism [29], agriculture, industry, etc.
Although many achievements have been made in the research on carbon footprints all over the world, there are also many shortcomings, which are shown in the fact that the existing research focuses more on carbon emission and less on the design of carbon fixation. Most research consists of static analysis, but few use dynamic analysis. At the same time, there is no clear identification of carbon emission level. Although there are many studies on carbon footprint and carbon emissions, and accounting methods are gradually becoming enriched, most of the current research on such issues is targeted at a region or an industry. It is mainly at a macro level, and comparative research is conducted from a national perspective for certain industries, such as tourism, agriculture, and logistics. In view of this, from a micro perspective, this paper selects Zhejiang Province, the most representative province of high-quality development in China, to conduct a dynamic and in-depth analysis of its carbon footprint and carbon-carrying capacity using practical IPCC methods. It deeply analyzes the main causes of the carbon deficit in Zhejiang Province and puts forward some operational guiding ideas according to the suggestions on energy conservation and carbon reduction.

3. Research Methodology

The IPCC emission factor refers to the guidelines for national greenhouse gas inventories prepared by the United Nations Climate Change Commission [30,31]. The advantage is that almost all sources of greenhouse gas emission are considered in detail and comprehensively, and specific emission principles and calculation methods are provided. In this paper, the IPCC method is used to calculate the carbon footprint of Zhejiang Province in China, analyze the dynamic change in the carbon footprint of Zhejiang Province from 2015 to 2019, and calculate the annual change in the carbon-carrying capacity of Zhejiang Province.

3.1. Calculation Method of Carbon Emission

Carbon footprint is calculated according to the relevant principles in the IPCC 2006 Guidelines [32]. Carbon emission is estimated mainly from energy consumption and industrial production. Energy consumption mainly refers to fossil energy consumption, that is, the carbon footprint of coal, natural gas, oil, and other fossil energies. Industrial production is mainly based on the carbon footprint generated by cement production. The calculation process is as follows
CF = CFE + CFI
C F E = i n E i × α i × β i × 44 12
C F I = S y × D
wherein CF represents the regional carbon footprint (10,000 t), CFE represents the carbon footprint of fossil energy (10,000 t), Ei represents the consumption of the ith energy (10,000 t), αi is the conversion factor of the ith energy, and βi represents the carbon dioxide emission coefficient of the ith energy. The specific values of these coefficients are shown in Table 1.
This paper calculates the energy consumption and corresponding carbon emission coefficient, which were proposed by the Intergovernmental Panel on Climate Change (IPCC) of the United Nations in 2006. That is, the CO2 emission coefficient is calculated by using the “Sectoral Approach 2” developed by IPCC. The specific formula is as follows
CO2 emission coefficient = Low calorific value × Carbon content factor × Carbon oxidation factor × (44/12)
The term 44/12 refers to the conversion coefficient of the carbon atom and carbon dioxide. CFI refers to the carbon footprint in the cement production process (10,000 t). Sy refers to the cement output (10,000 t). D refers to the CO2 coefficient generated during the cement decomposition. According to existing research results, the value of D is 0.427 t CO2/t cement.

3.2. Calculation Method of Carbon-Carrying Capacity

Net ecosystem productivity (NEP) reflects the carbon fixation capacity of vegetation, that is, the total amount of carbon absorbed by 1 hm2 of vegetation in one year. The NEP index is used to reflect the carbon absorption of different types of vegetation. The carbon absorption of forest land, grassland, and farmland has been calculated [33]. According to research by Hongyu Xie et al. [34], the values of forest land, grassland, and farmland are 3.809592 t/hm2, 0.948229 t/hm2, and 8.994616632 t/hm2, respectively. The correction coefficient of farmland is 0.05 in this paper.
This paper calculates the carbon fixation capacity of forest land, grassland, and crops, and the formula is as follows:
C = C f + C p + C g
where C represents the total regional carbon-carrying capacity (10,000 t), Cf represents the carbon-carrying capacity of forest land (10,000 t), Cp represents the carbon-carrying capacity of crops (10,000 t), and Cg represents the carbon-carrying capacity of grassland (10,000 t).
The formula to calculate the carbon-carrying capacity of forest land is
C f = M × M N E P × 44 12
wherein, Cf refers to the carbon-carrying capacity of forest land (10,000 tons), M refers to the area of forest land (hm2), and MNEP refers to the annual carbon fixation amount of 1 hm2 forest land. According to the estimation results of Qingbiao Wu et al., the value of MNEP is 2.84 (t/hm2) [35].
The formula to calculate carbon-carrying capacity of crops is
C p = λ × C c × 44 12 × P i Y i
wherein Cp represents the carbon-carrying capacity of crops (10,000 tons). According to the research results of Xiuping Zhang et al., λ refers to the correction coefficient, with a value of 0.05. Cc refers to the conversion coefficient of biomass and carbon fixation, with a value of 0.5 [25,36]. Pi is the yield (t) of the ith crop, and Yi is the economic coefficient of the ith crop. Eleven main crops in Zhejiang Province were selected, and their economic coefficients are shown in Table 2.

3.3. Calculation Method of Carbon Footprint Intensity

The carbon footprint intensity analyzed in this paper mainly includes the carbon intensity of GDP and carbon intensity per capita. The carbon footprint intensity of GDP is called the carbon intensity of GDP for short [37], and it is the ratio of the carbon footprint to GDP in a region. The greater the carbon footprint intensity, the more uncoordinated the environment and economic development. It also shows that GDP growth is at the cost of large energy consumption. The carbon intensity of GDP can also be used to explain the efficiency of energy utilization. The calculation formula is:
Fq = F/G
where Fq represents the carbon footprint intensity (tons/10,000 CNY), F represents the regional carbon footprint (10,000 tons), and G represents the regional GDP (CNY 10,000).
The carbon footprint intensity per capita is abbreviated as carbon intensity per capita [38]. It is the regional carbon footprint divided by the number of permanent residents in the region. The carbon footprint per capita represents the carbon footprint generated by the average person. The formula is
Fr = F/P
where Fr represents the carbon footprint (tons) per capita, F represents the regional carbon footprint (10,000 tons), and P represents the total resident population of the region.

4. Analysis of Carbon Footprint and Carbon-Carrying Capacity

4.1. Carbon Footprint Analysis

Based on the above formula to calculate carbon emission, the carbon emissions of energy consumption and industrial production in Zhejiang Province in 2015–2019 are shown in Table 3. The carbon footprint increased from 398.4417 million tons in 2015 to 403.6591 million tons in 2019, with a total increase of 101.31%. Although the carbon footprint of Zhejiang Province decreased in 2016, it increased first and then decreased generally. The highest carbon emissions were 409.5592 million tons in 2017. Additionally, the lowest carbon emissions were 396.9137 million tons in 2016. This is mainly because carbon emission is similar to the trend of changes in energy consumption and industrial production intensity. The rapid economic development of Zhejiang Province in 2015–2019 made the energy consumption and industrial production of the province increase first and then decrease. It can be seen from Table 3 that the main source of carbon emissions in Zhejiang Province in 2015–2019 was raw coal energy consumption, accounting for more than 47%. The second largest source was cement production, accounting for more than 12%. The third largest source was diesel energy consumption, accounting for more than 8%.

4.2. Carbon-Carrying Capacity Analysis

According to the area of the forest land of Zhejiang Province and the above formula to calculate carbon-carrying capacity of the forest land, the carbon-carrying capacity of forest land in Zhejiang Province in 2015–2019 can be calculated as shown in Table 4.
According to the output of the main crops in Zhejiang Province and the above calculation formula of crop carbon-carrying capacity, the carbon-carrying capacity of crops in Zhejiang Province in 2015–2019 can be calculated as shown in Table 5.
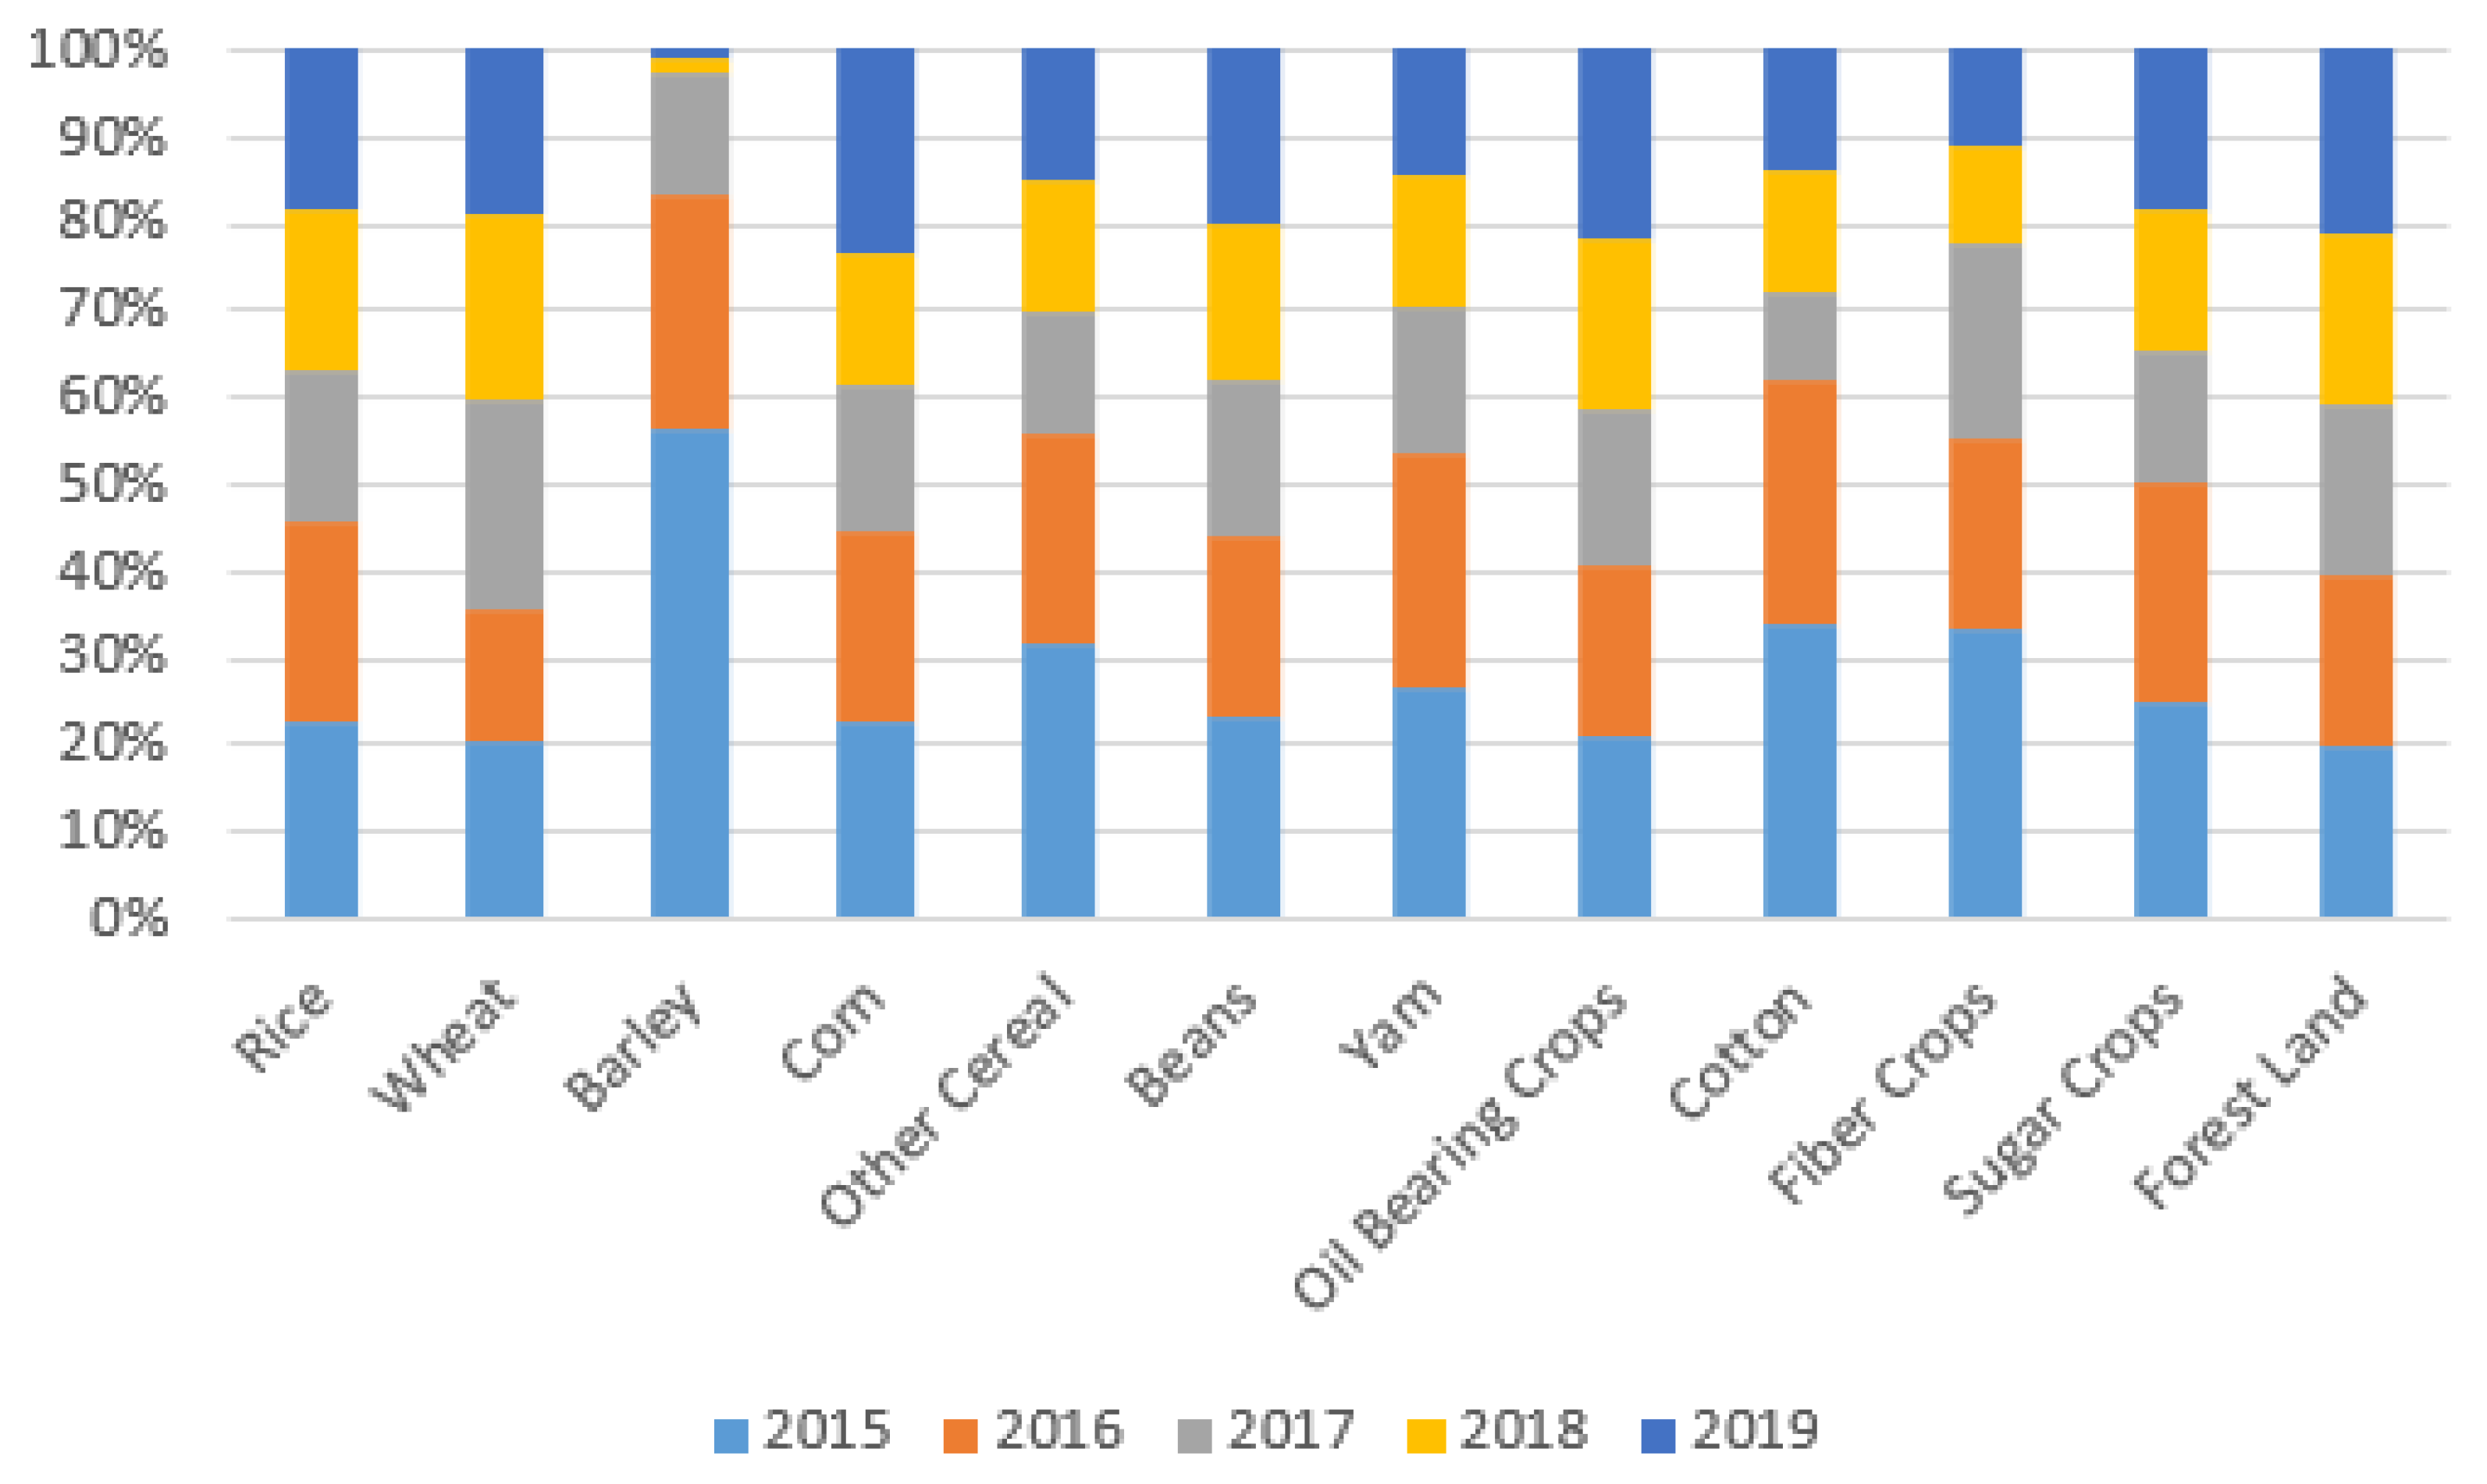
The statistical data of Zhejiang Province show that the grassland area is 5000 mu from 2015 to 2019, which can be ignored compared with the forest land and cultivated area of crops. Therefore, the carbon-carrying capacity of Zhejiang Province mainly analyzes the forest land and crops. The carbon-carrying capacity of Zhejiang Province in 2015–2019 was approximately balanced at first and then increased significantly, as shown in Figure 1. The carbon-carrying capacity increased from 60.5318 million tons in 2015 to 64.8513 million tons in 2019, an increase of 107.14%. Specifically, the carbon-carrying capacity of forest land increased from 58.7992 million tons in 2015 to 63.4544 million tons in 2019, an increase of 107.92%, while the carbon-carrying capacity of crops decreased from 1.7326 million tons in 2015 to 1.3969 million tons in 2019, a decrease of 80.62%.
It can be seen that the improvement in the carbon-carrying capacity of Zhejiang Province is mainly due to the increase in the carbon-carrying capacity of forest land. From the total carbon-carrying capacity each year, the carbon-carrying capacity of forest land is above 97%, which is inseparable from the higher forest coverage in Zhejiang Province. In contrast, the carbon-carrying capacity of crops is smaller, below 3%.

4.3. Net Carbon Footprint Analysis

Net carbon footprint is the difference between the carbon footprint and the carbon-carrying capacity of a region [39]. When the carbon footprint is greater than the carbon-carrying capacity, the net carbon footprint is positive, i.e., a carbon deficit of the region [40], indicating that the ecological environment is under great pressure. On the contrary, when the carbon footprint is less than the carbon-carrying capacity, the net carbon footprint is negative, i.e., the carbon surplus of the region [41], indicating that the carbon emission is within the safe range.
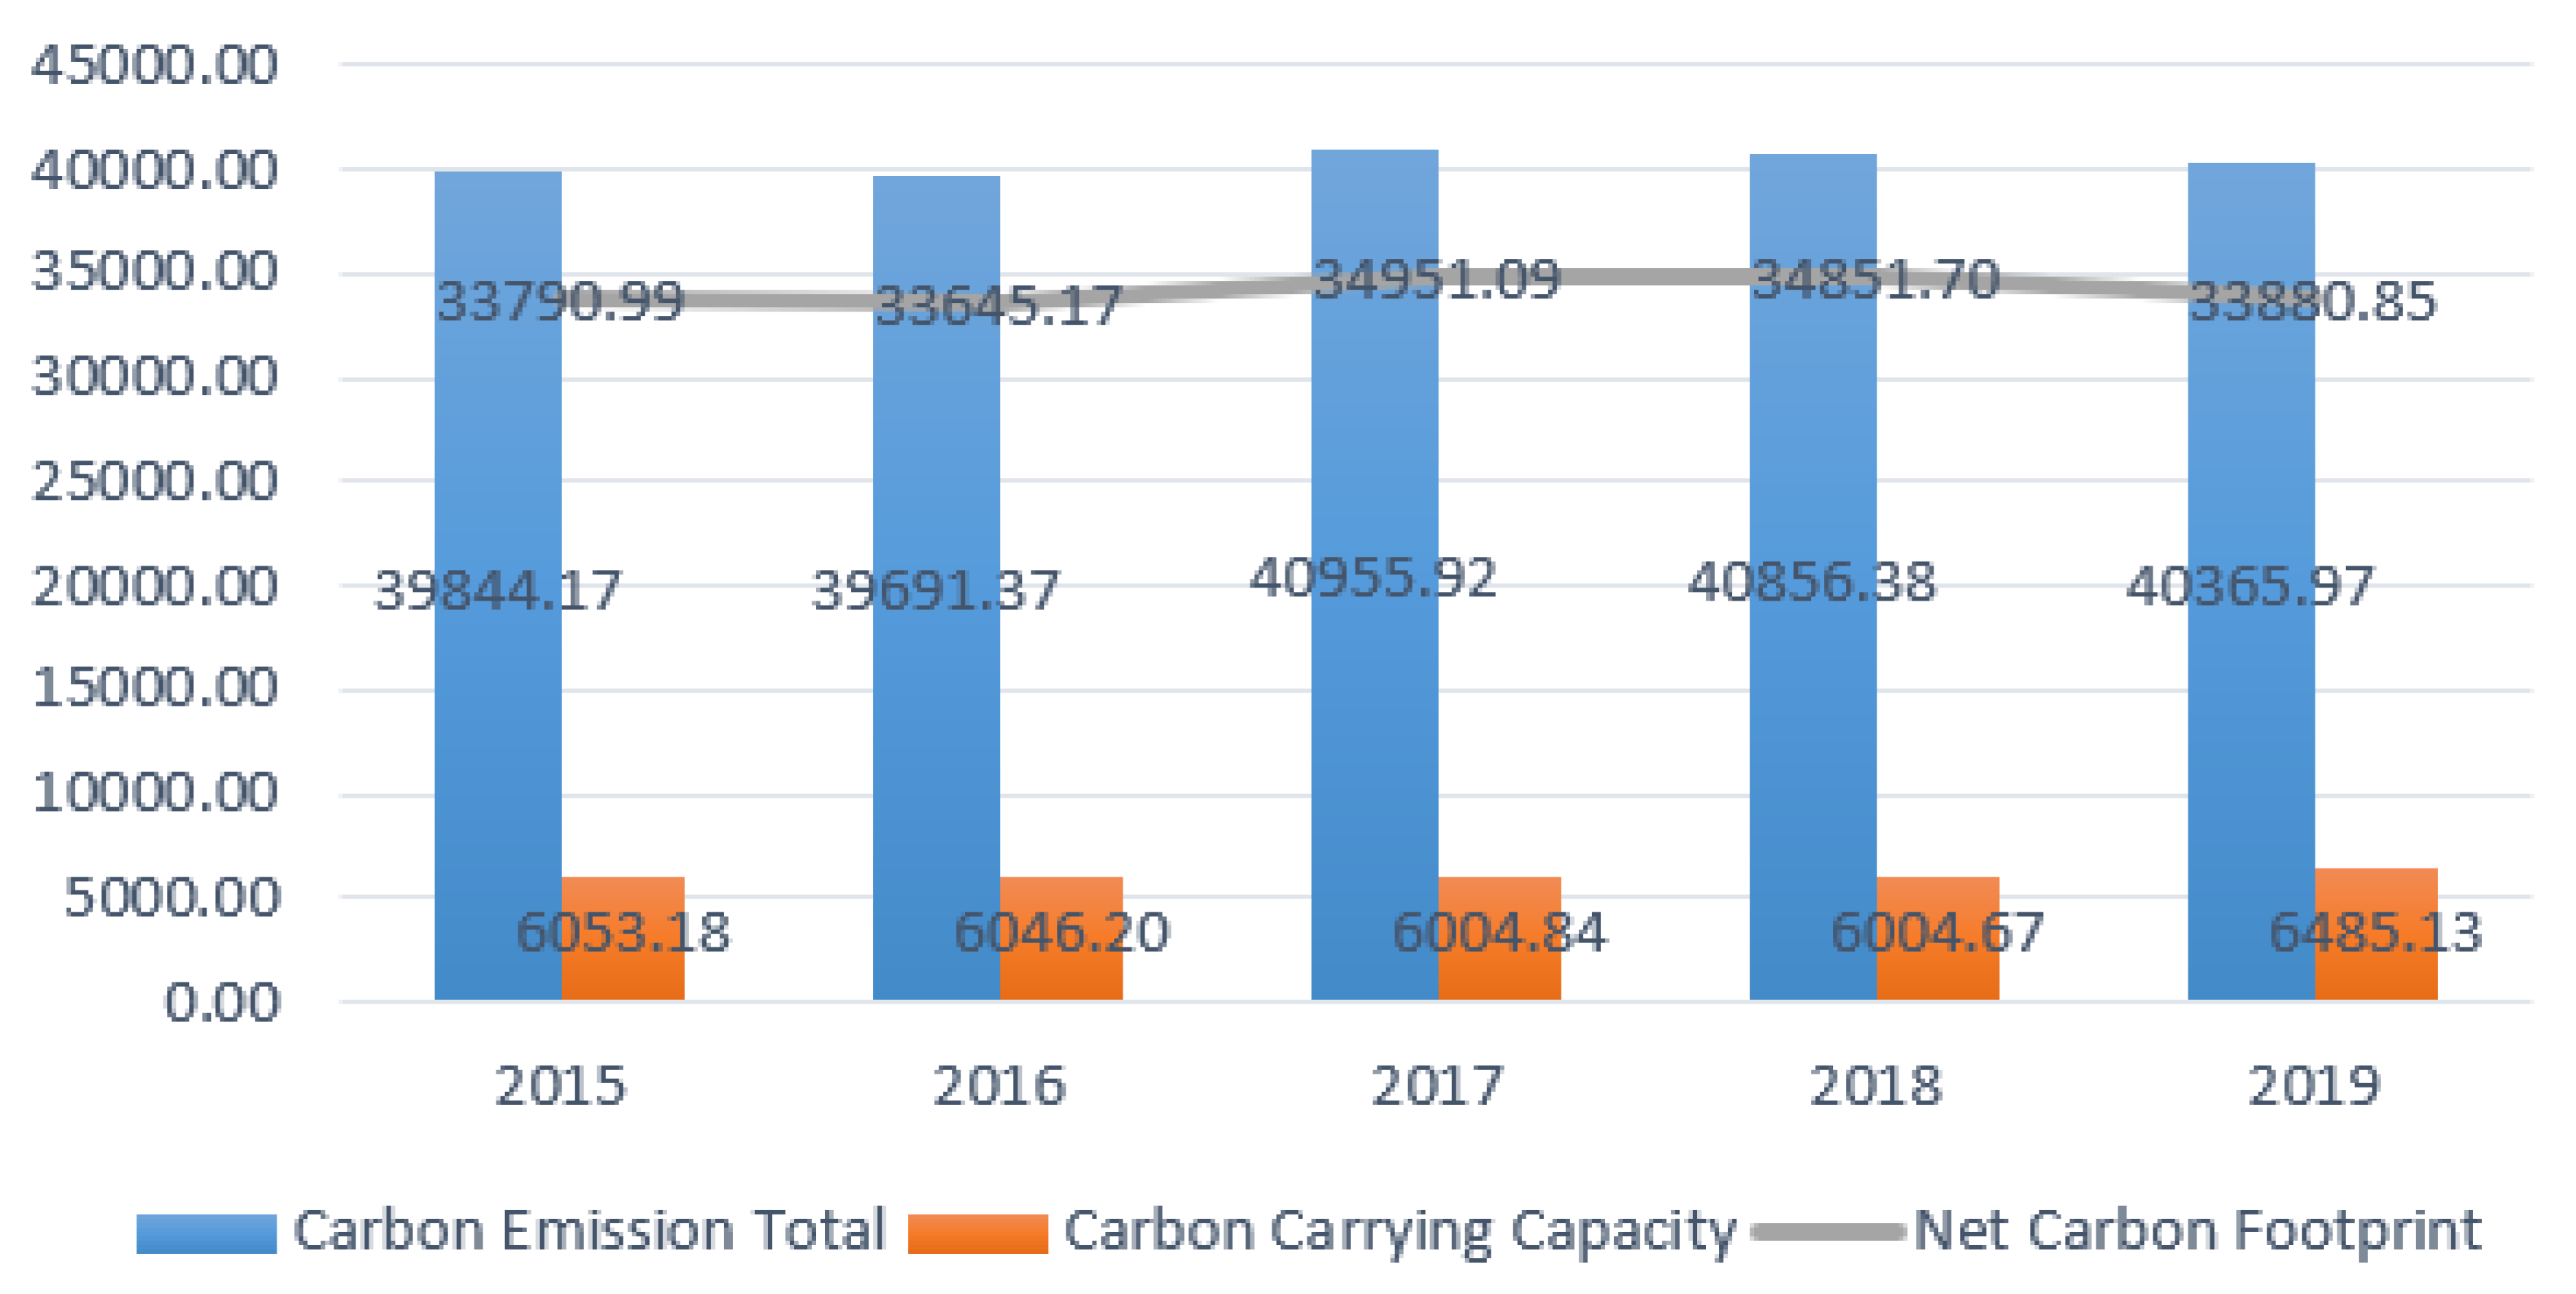
Based on the above analysis data of carbon footprint (Section 4.1) and analysis data of carbon-carrying capacity (Section 4.2), the net carbon footprint of Zhejiang Province in 2015–2019 was obtained. As shown in Figure 2, the net carbon footprint is positive, indicating that Zhejiang Province has been in a carbon deficit, and its carbon emission exceeds the absorption capacity of the carbon sink. However, the net carbon footprint of Zhejiang Province showed a downward trend from 2015 to 2016 and from 2017 to 2019. Combined with the data in Table 4, this shows that the carbon-carrying capacity in the ecological environment of Zhejiang Province is gradually increasing.

4.4. Carbon Footprint Intensity Analysis

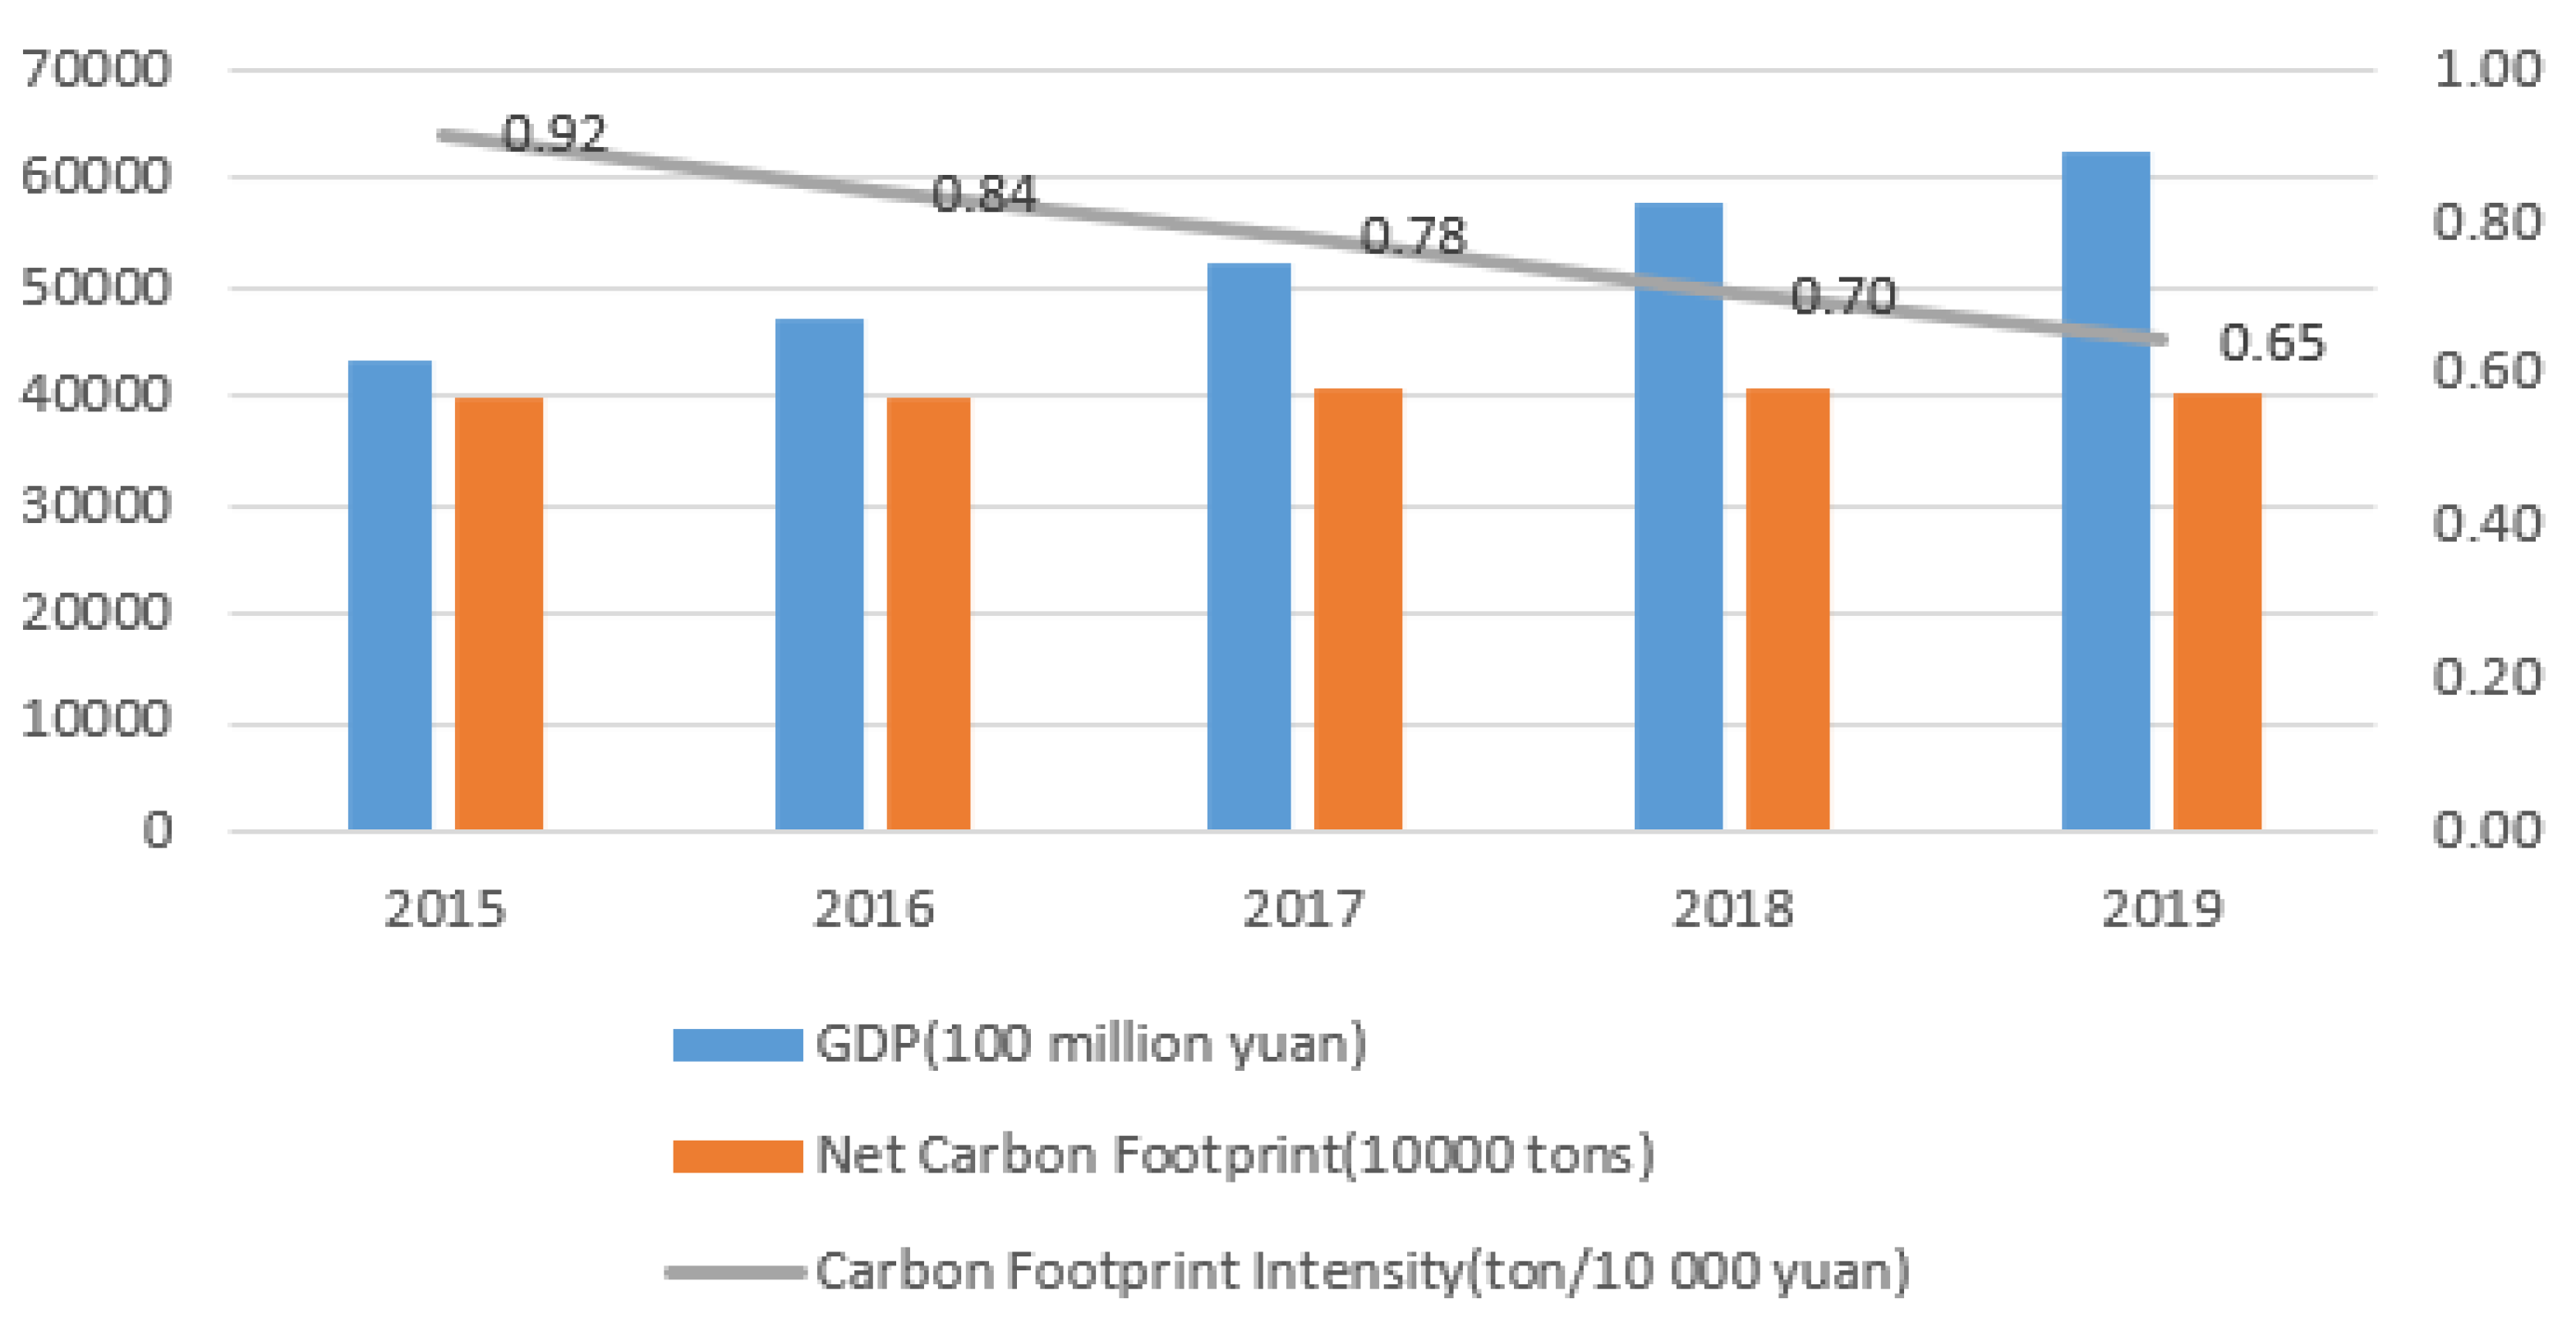
According to the calculation formula of carbon footprint intensity in 3.3, and the GDP data of Zhejiang Province in 2015–2019 shown in Table 6, we can calculate the carbon footprint intensity of Zhejiang Province (t/10,000 CNY). As shown in Figure 3, the carbon footprint intensity shows a general downward trend, from 0.92 t/10,000 CNY in 2015 to 0.65 t/10,000 CNY in 2019, indicating that the carbon emissions corresponding to the unit output of Zhejiang Province is reduced, and the energy utilization efficiency increasing. The improvement in energy utilization efficiency also provides support for Zhejiang Province to control carbon emissions and achieve the goal of a carbon peak.
According to the calculation formula of the carbon footprint per capita in 3.3 and the number of permanent residents in Zhejiang Province in 2015–2019 as shown in Table 7, the carbon footprint intensity per capita of Zhejiang Province (tons/person) can be calculated. As shown in Figure 4, the carbon footprint per capita shows a downward trend, from 6.66 tons/person in 2015 to 6.33 tons/person in 2019. The global carbon footprint per capita in 2019 is 4.3 tons/person, China’s carbon footprint per capita is far higher than the world average. The carbon footprint per capita of Zhejiang Province has a large downward space.

5. Analysis of Results and Countermeasures

5.1. Result Analysis

(1)
Net Carbon Footprint Showing a Downward Trend
According to the above analysis, the net carbon footprint of Zhejiang Province shows a downward trend, but all factors are in a state of carbon deficit. The main reason is that the total carbon emission is high and the carbon-carrying capacity is low. The energy consumption and industrial production of Zhejiang Province have produced a large carbon footprint. Although the total energy consumption in Zhejiang Province decreased from 350.2483 million tons in 2015 to 346.442 million tons in 2019, there is still much room for reduction. For example, we should vigorously develop new energy technologies, strengthen the development and utilization of wind, light, tidal, and other new energies, to save the use of coal, oil, natural gas, and other traditional energies.
As one of the three major building materials, the cement output in Zhejiang Province increased from 48.1934 million tons in 2015 to 57.2177 million tons in 2019, which is closely related to the development of the construction industry and economic development in Zhejiang Province. As a substitute for cement, “coagulate” (invented by Henghu Sun, professor at Tsinghua University) provides a new idea for reducing cement production. As shown in Table 4, the area of forest land in Zhejiang Province was relatively stable from 2015 to 2018 and increased significantly in 2019. This is because the State Council’s third national land survey in 2019 used satellite remote sensing, the Internet, cloud computing, and other technologies to make the collected land data more accurate based on the latest orthophoto map. According to statistics, the forest coverage rate of Zhejiang Province in 2020 was 59.43%, ranked fifth in China. Compared with Fujian Province, which ranked first (with a forest coverage rate of 66.80%), there is still much room for improvement.
As shown in Table 4, the carbon-carrying capacity of crops in Zhejiang Province has declined year by year, which is closely related to the annual reduction in total crop output. Zhejiang Province is located in the economically developed area in the east of China, and the urbanization process is speeding up, and it thus provides a large amount of cultivated land. Due to the increasing demand for vegetables and flowers, the agricultural structure of Zhejiang Province has changed, and some cultivated land has changed to growing vegetables and flowers. That is the main reason for the decrease in crop output in Zhejiang Province year by year.
(2)
Carbon Footprint Intensity of GDP Showing a Downward Trend
As shown in Figure 3, the carbon dioxide emission per CNY 10,000 of GDP in Zhejiang Province shows a downward trend, indicating that the effect of emission reduction and energy efficiency improved in Zhejiang Province. In general, the intensity of the carbon footprint with respect GDP in Zhejiang Province is lower than the national average. However, there is still a certain gap compared with the world average. This also presents higher requirements for Zhejiang Province’s technological progress, economic growth, changes in industrial structure, agricultural industrialization, and urbanization. The intensity of the carbon footprint with respect to GDP is a relative indicator, and its downward trend is the result of the joint action of the higher GDP growth rate and the annual reduction in total carbon emissions in Zhejiang Province.
Digital economy and industrial production have made important contributions to the economic growth of Zhejiang Province, which is an important factor in the decline of the intensity of the carbon footprint with respect to GDP in Zhejiang Province. Zhejiang Province has always attached great importance to energy conservation and emission reduction and advocated green and low-carbon development. These have enabled Zhejiang Province to maintain high economic growth while reducing its total carbon emission each year.
(3)
Carbon Footprint Per Capita Showing a Downward Trend
As shown in Figure 4, the carbon footprint per capita of Zhejiang Province shows a downward trend, decreasing to 6.33 tons/person in 2019. The global level is 4.48 t/person [42], and the per capita carbon footprint of Zhejiang Province is 1.41 times the global level. Nearly half (47%) of the carbon footprint is generated by the consumption of raw coal energy in Zhejiang Province. At the same time, the proportion of urban areas in carbon footprint analysis is relatively high [42]. The carbon emissions are related to the production of goods and services consumed by them. Its urban areas, accounting for only 2% of the world, account for about 80% of global greenhouse gas emissions [43,44]. BP world energy data show that China’s carbon dioxide emissions in 2020 will be 9.894 billion tons, and the national per capita carbon emissions will be 7 tons/person. The per capita carbon footprint of Zhejiang Province is lower than the overall national level, which is only 0.67 t/person less. The situation is not optimistic, and efforts should be made to save energy and reduce carbon. According to the map of global per capita carbon emission information produced on the Virtual Capitalist website, the per capita carbon footprints of Canada and the United States are 15.2 tons and 14.4 tons per year, respectively, more than three times higher than the global average, while the per capita carbon footprints of Zhejiang Province are lower than those of Canada and the United States but still higher than the global level. The permanent population of Zhejiang Province is still growing. If the carbon footprint per capita is reduced to the world average, we must increase efforts to control the total carbon emissions.
Zhejiang Province has not yet established a green low-carbon circular economy system; a clean low-carbon, safe, and efficient energy system; or a long-term carbon neutral mechanism. Further exploration and extensive application of low-carbon, zero-carbon and negative-carbon technologies need to be strengthened. The proportion of non-fossil energy consumption still has a large downward space. Clean production and low-carbon transformation of the high-carbon industry need to be improved. Therefore, Zhejiang Province strictly controls energy consumption intensity, carbon dioxide emission intensity, and total energy consumption and strengthens the development and utilization of new energy and green energy.

5.2. Countermeasures and Suggestions

(1)
Improve Energy Efficiency and Promote the Green Energy Revolution
In order to reduce the proportion of coal energy consumption in the industrial energy consumption structure, Zhejiang Province has concentrated on the development and utilization of renewable energy. Energy efficiency and the green energy revolution depend on technological improvement and innovation. There are energy-saving technologies to be improved in traditional industries and high-carbon industries in Zhejiang Province, because these industries result in low energy efficiency and high carbon emissions.
Zhejiang Province can vigorously support and promote energy-saving technology research and development projects and improve the traditional process to achieve energy conservation and emission reduction. In order to promote the realization of the national “double carbon” goal, the energy industry of Zhejiang Province has new opportunities for accurate green and low-carbon transformation. These include improving the efficiency and effect of new energy, advanced nuclear energy, new energy storage, hydrogen energy, and other emerging energy types; accelerating the iterative pace of emerging energy; targeting industries using to emerging energy. In doing so, Zhejiang Province will make precise efforts and give certain policy support, guidance, and supervision. Other strategies include integrating big data, cloud computing, blockchain, artificial intelligence, and other technologies into the emerging energy industry and cultivating emerging industries based on emerging energy. For example, emerging industries can be cultivated based on non-fossil energy represented by photovoltaic wind power.
(2)
Improve Industrial Production Efficiency and Promote Green Industrial Development
As early as 2012, Zhejiang Province took the lead in carrying out “machine replacement” to guide and motivate the usage of machines used in Zhejiang manufacturing plants to replace simple, repetitive, high-intensity, and high-risk posts and to improve product quality and production efficiency. This also involved further integrating industrial production with information technology and expanding the breadth and depth of industrial production based on information technology to improve the efficiency of industrial production.
At the same time, we will formulate laws and regulations for low-carbon economy and technology, refine the standards for industrial production in various industries, and regularly test the comprehensive utilization of industrial solid wastes and the recycling of renewable resources, so as to promote the development of a green low-carbon cycle and green industrial development. The government can increase the proportion of investment into environmental protection, increase the supply of green technology and equipment products, promote the recycling of industrial resources, curb the blind development of high energy consumption and high carbon projects, and curb excessive and repeated construction to protect the ecological environment.
(3)
Protect and Develop Forest Resources, and Advocate Green Ideas
We firmly believe that green water and green mountains are golden mountains and silver mountains. We will resolutely curb the over-quota logging of forest resources, encourage afforestation and mountain closure, and expand the forest coverage in Zhejiang Province, so as to improve the carbon-carrying capacity of forest land. The government will provide certain economic support or long-term loan policies for afforestation and forest cultivation to stimulate the enthusiasm and initiative of individuals and enterprises in afforestation and forest cultivation. Another strategy is to save the use of wood and encourage research, development, and utilization with respect to wood substitutes. Forest cultivation fees shall be collected and used exclusively for afforestation and forest cultivation. The public should also be encouraged to participate in the supervision of such projects, advocate the concept of green production and green life, and realize the harmonious unity of economic development and ecological protection.
(4)
Promote the Development of Green Industries and Cultivate Green Innovative Talents
Experience has proved that high-quality green innovative talents can significantly improve carbon emission efficiency. Therefore, green innovative talents should be trained and introduced, and policies for the introduction of green innovative talents should be formulated. Enterprises, universities, scientific research institutions, and service institutions work together to cultivate green innovation talents and form a social atmosphere of respecting talents and advocating green innovation. Enterprises should be encouraged to write green innovation incentives into enterprise rules and regulations and encourage green innovation talents to try and make mistakes. The government should support and encourage enterprises in increasing investment into research and development in green innovation technologies. We will carry out green technology innovation through industry–university research collaboration, strengthen the training of green technology innovation talents and the research and development of key common technologies for green development, build a patent pool for green innovation technologies, and promote the sharing of intellectual property resources for green technology innovation technologies.
(5)
Comprehensively promote carbon accounts and help enterprises tap carbon-reduction potential
In view of the imbalance between the carbon footprint and the carbon-carrying capacity of Zhejiang Province, building and promoting an enterprise carbon account system has been proposed. On 11 November 2022, at the 27th Conference of the Parties (COP27) to the United Nations Framework Convention on Climate Change, the carbon account finance of Quzhou in Zhejiang Province was presented as a local practice case for climate change policies and actions. It was also recognized by experts. The enterprise carbon account comprehensively records, scientifically calculates, and fairly evaluates the carbon footprint of various enterprises. The enterprise carbon account has become a data governance tool to define the correct boundary for low-carbon contribution, carbon reduction responsibility, and carbon emission among social subjects. The intelligent terminal data-acquisition system of an enterprise carbon account can accurately monitor the carbon emission data of enterprise production, issue timely high-emission warnings, take measures to reduce carbon over time, and continuously reduce the carbon footprint of enterprises. The carbon footprint accounting system for industrial products can be added to the carbon account version 1.0 to establish a carbon footprint tracking path for industrial products. Additionally, it can reduce the carbon footprint of industrial products, apply carbon labels as much as possible, gradually integrate with the world carbon emission standards for industrial products, and lay a foundation for sustainable export of industrial products in Zhejiang Province. Governmental departments can provide necessary financial subsidies for enterprises to build a carbon account system and help enterprises find a balance point for energy conservation and carbon reduction.
(6)
Fully implement carbon credit reporting and play the role of carbon finance in energy conservation and carbon reduction
Strategies by which the government of Zhejiang Province can achieve intelligent carbon governance, and by which enterprises can achieve intelligent carbon reduction and provide intelligent financial support, include deepening the “5e” closed-loop system of carbon account finance and optimizing the carbon emission e-ledger, carbon credit e-report, carbon policy e-release, carbon finance e-supermarket, and carbon efficiency e-assessment by means of AI, blockchain, online monitoring, and other technologies. Through the “5e” closed-loop system, financial systems can achieve the transformation of the granularity of green finance standards from industry to enterprise, and from qualitative to quantitative, through the quantification of carbon. Through the carbon emission e-account book and carbon credit e-report, we will increase the credit of enterprises in terms of carbon and provide corresponding green financial loans, so as to provide financial support for enterprises to reduce their carbon footprint and achieve the dynamic balance between Zhejiang’s carbon footprint and carbon-carrying capacity as soon as possible.
(7)
Formulate carbon emission reduction policies to provide support for energy conservation and carbon reduction
Zhejiang’s provincial government and local governments can also formulate relevant policies in terms of increasing financial support for energy conservation and emission reduction. These include strengthening the implementation of governmental green procurement, improving the carbon financial system, speeding up the development of green bonds, promoting enterprises in high-risk areas to obtain environmental pollution liability insurance, and implementing preferential tax policies for environmental protection. At the same time, the mechanism of the carbon market’s operation should be further improved, mainly to carry out trading of energy use rights, trading of emission rights, trading of green power certificate, promoting power demand-side management, promoting energy contract management, opening the market for environmental governance, strengthening energy efficiency labeling management system, implementing a green product certification system, etc.
6. Conclusions

Through the analysis of the carbon footprint of Zhejiang’s industry, we can draw the following conclusions. The carbon dioxide emissions of Zhejiang’s industry generally show a trend of increasing first and then decreasing from 2015 to 2019. Raw coal energy consumption (accounting for more than 47% of the total emissions) and cement production (accounting for more than 12% of the total emissions) were the main sources of emissions, with their carbon footprint playing a leading role, while clean and high-quality energy such as natural gas accounted for a small proportion. However, with the promotion of clean energy utilization, its growth rate is fast. The intensity of the carbon footprint of industrial production in Zhejiang Province showed a general downward trend, from 0.92 tons/10,000 CNY in 2015 to 0.65 tons/10,000 CNY in 2019, indicating that the carbon emissions corresponding to the unit output of Zhejiang Province were reduced, and the energy utilization efficiency was increasing. From 2015 to 2019, the carbon-carrying capacity of Zhejiang Province was basically flat at first and then significantly increased, mainly due to the increase in the carbon-carrying capacity of forest land, which was more than 97%. From 2015 to 2019, the net carbon footprint of Zhejiang Province was positive, indicating that Zhejiang Province had been in a carbon deficit, and its carbon emissions exceeded the absorption capacity of carbon sinks. This resulted in greater pressure on the natural environment caused by industrial production in Zhejiang Province.
However, from 2017 to 2019, the net carbon footprint of Zhejiang Province showed a downward trend, indicating that the carbon-carrying capacity in the ecological environment of Zhejiang Province was gradually increasing. Based on the analysis of the carbon footprint and carbon-carrying capacity of industrial production in Zhejiang Province, the following management strategies are put forward: improving the efficiency of energy use and promoting the green energy revolution, improving industrial production efficiency, promoting industrial green development, protecting and developing forest resources, advocating green ideas, promoting the development of green industries, and cultivating green innovative talents.
Through the presentation and application of the special digital technology and targeted policy recommendations adopted by Zhejiang Province, we can start from the reality of the industrial carbon footprint and carbon-carrying capacity of Zhejiang Province and also lead other domestic regions. We can form a carbon footprint that actively reduces products’ production and application, from both the production and the consumer end, and gradually promote the balance between the carbon footprint and carbon-carrying capacity. By changing the concept of production and operation to form a green production mode and launching a digital energy conservation and carbon reduction system, manufacturers can realize the concept of energy conservation and carbon reduction for all employees and the whole process, maximize the potential of energy conservation and carbon reduction, obtain more green financial loan support, participate in afforestation and ecological environment restoration, and achieve sustainable green and low-carbon transformation. Consumers have gradually formed the lifestyle concept of green travel and low-carbon life, innovated the green lifestyle, and chosen enterprise products with carbon footprint labels and low emissions, forcing enterprise manufacturers to carry out green and low-carbon transformation. The green production mode on the production side and the green lifestyle on the consumer side are helping to reduce the carbon footprint all around.
Through comparison with other countries, it was found that the per capita carbon footprint of China and Zhejiang Province is lower than that of developed countries such as the United States and Japan. As a leading industrial province in China, the per capita carbon footprint of industrial carbon emissions in Zhejiang Province is also far lower than that of these developed countries. However, in order to achieve China’s dual carbon goal, Zhejiang Province should improve the limitations of its structure when actively developing industry and economy; develop industrial standards related to energy conservation and emission reduction; increase investment in research and development in new energy technologies; actively develop new and clean energies such as wind energy, nuclear energy, and biomass energy; and achieve the sustainable development of energy development and utilization.

Author Contributions

Investigation, X.L.; Data curation, H.L. All authors have read and agreed to the published version of the manuscript.

Funding

This research was funded by Later support from National Social Science Foundation, grant number 21FGLB022, Soft Science Project of Science department of Zhejiang Province, P.R. China, grant number 2022C35015, Philosophy and Social Science Foundation of Heilongjiang Province, P.R. China, grant number 20GLE394 and 21JYB152, Liberal Arts Base Fund project of Northeast Petroleum University, Heilongjiang Province, P.R. China, grant number WKJD202002.

Institutional Review Board Statement

Not applicable.

Informed Consent Statement

Not applicable.

Data Availability Statement

The data that support the findings of this study are available upon request to the corresponding author.

Conflicts of Interest

The authors declare no conflict of interest.

References

  1. Labaran, Y.H.; Mathur, V.S.; Muhammad, S.U.; Musa, A.A. Carbon footprint management: A review of construction industry. Clean. Eng. Technol. 2022, 9, 100531. [Google Scholar] [CrossRef]
  2. Ye, C.; Hu, M.; Lu, L.; Dong, Q.; Gu, M. Spatio-Temporal Evolution and Influencing Factors of Carbon Footprint Depth of Capital Cities in the Middle Yangtze River. Res. Environ. Sci. 2022, 3, 1–16. [Google Scholar]
  3. President Xi Jinping’s Statement. 75th United Nations General Assembly. Available online: https://m.gmw.cn/baijia/2022-05/23/35756458.html (accessed on 23 May 2022).
  4. Guan, D.; Meng, J.; Reiner, D.M.; Zhang, N.; Shan, Y.; Mi, Z.; Shao, S.; Liu, Z.; Zhang, Q.; Davis, S.J. Structural decline in China’s CO2 emissions through transitions in industry and energy systems. Nat. Geosci. 2018, 11, 551–555. [Google Scholar] [CrossRef] [Green Version]
  5. British Petroleum (BP). Statistical Review of World Energy. 2021. Available online: https://www.chyxx.com/industry/1122080.html (accessed on 16 August 2022).
  6. China Economic Industry Research Institute. Available online: www.huaon.com (accessed on 18 March 2021).
  7. China Galaxy Securities. Available online: www.chinastock.com.cn (accessed on 2 August 2022).
  8. Zhao, W. Thoughts and Suggestions on the Green Development of Industry during the “Fourteenth Five Year Plan”. The First CCID Industrial Economic Forum in China, 18 March 2021. [Google Scholar]
  9. Zhuang, G.; Ding, F. Strengthening the Goal Synergy of Carbon Peaking, Carbon Neutralization and Common Prosperity. Theory Weekly of Zhejiang Daily, 14 March 2022. [Google Scholar]
  10. Statistics Bureau of Zhejiang Province. Available online: http://tjj.zj.gov.cn (accessed on 6 April 2022).
  11. Ma, C. Comparative Analysis of China’s Energy Carbon Footprint and Vegetation Carbon Bearing Capacity. Ecol. Econ. 2012, 254, 53–55. [Google Scholar]
  12. Chen, C.; Lin, Z. Debate and Development of Ecological Footprint Model. J. Ecol. 2008, 12, 6252–6263. [Google Scholar]
  13. Matthews, H.S.; Hendrickson, C.; Wdber, C. The importance of carbon footprint estimation boundaries. Environ. Sci. Technol. 2008, 42, 5839–5842. [Google Scholar] [CrossRef] [Green Version]
  14. Marilyn, A.; Browm, F.S.; Sayzynski, A. The geography of metropolitan carbon footprints. Policy Soc. 2009, 27, 285–304. [Google Scholar]
  15. Aichele, R.; Felbermayr, G. Kyoto and the carbon footprint of nations. J. Environ. Econ. Manag. 2012, 63, 336–354. [Google Scholar] [CrossRef] [Green Version]
  16. Jeffrey, R.B.; Eric, A.; Brian, M.; Taylor, D. The traffic conception and the development course of expressway in the 20th century America to deal with mobility. Urban Transp. 2010, 1, 81–94. [Google Scholar]
  17. Hertwich, E.G.; Peters, G.P. Carbon footprint of nations: A global, trade-linked analysis. Environ. Sci. Technol. 2009, 43, 6414–6420. [Google Scholar] [CrossRef] [Green Version]
  18. Chen, X.; Wang, K.; Wan, G.; Liu, Y.; Liu, W.; Shen, W.; Shi, J. Evaluation and empirical research on eco-efficiency of financial industry based on carbon footprint in China. Sustainability 2022, 14, 13677. [Google Scholar] [CrossRef]
  19. IPCC National Greenhouse Gas Inventories Programme. 2006 IPCC Guideline for National Greenhouse Gas Inventories; Institute for Global Environmental Strategies: Hayama, Japan, 2006. [Google Scholar]
  20. Yan, J. Research and Application of Carbon Footprint in Parts Production Process Based on Extenics. Master’s Thesis, Zhejiang University of Technology, Hangzhou, China, 2019. [Google Scholar]
  21. Zhao, R.; Huang, X.; Zhong, T. Analysis on Carbon Emission Intensity and Carbon Footprint of Different Industrial Spaces in China. J. Geogr. 2010, 65, 1048–1057. [Google Scholar]
  22. Nie, H.; Kemp, R.; Fan, Y. Investigating the adoption of energy-saving measures in residential sector: The contribution to carbon neutrality of China and Europe. Resour. Conserv. Recycl. 2022, 190, 106791. [Google Scholar] [CrossRef]
  23. Luo, D.; Xu, G.; Luo, J.; Cui, X.; Shang, S.; Qian, H. Integrated carbon footprint and economic performance of five types of dominant cropping systems in China’s semiarid zone. Sustainability 2022, 14, 11654. [Google Scholar] [CrossRef]
  24. Xiao, L.; Zhao, X.; Xu, H. Dynamic study on carbon footprint and carbon carrying capacity in Shandong province. J. Ecol. Rural Environ. 2013, 29, 152–157. [Google Scholar]
  25. Zhang, X.; Zheng, G. Study on the dynamic changes of carbon footprint and carbon carrying capacity in Shanxi province. J. Shanxi Agric. Univ. 2016, 36, 128. [Google Scholar]
  26. Cao, Y.; Zhu, M.; Zheng, S. Analysis on the spatio-temporal evolution of carbon footprint and carbon carrying capacity in Hebei province. Agric. Resour. Reg. China 2017, 38, 55–63. [Google Scholar]
  27. Meng, G. Study on Dynamic Change and Driving Factors of Xi’an Carbon Footprint. Ph.D. Thesis, Xi’an University of Technology, Xi’an, China, 2019. [Google Scholar]
  28. Liu, S. Study on the Carbon Footprint and Carbon Carrying Capacity of Guiyang City. Mark. Res. 2020, 2, 20–21. [Google Scholar]
  29. Hu, Y. Where have carbon emissions gone? evidence of inbound tourism in China. Sustainability 2022, 14, 11654. [Google Scholar] [CrossRef]
  30. Team, C.W.; Pachauri, R.K.; Meyer, L.A. Climate change 2014: Synthesis report. Contribution of Working Groups Ⅰ, Ⅱ and Ⅲ to the Fifth Assessment Report of the Intergovernmental Panel on Climate Change. J. Romance Studies 2014, 4, 85–88. [Google Scholar]
  31. Xi, J.; Gong, H.; Zhang, Y.; Dai, X.; Chen, L. The evaluation of GHG emissions from Shanghai municipal wastewater treatment plants based on IPCC and operational data integrated methods (ODIM). Sci. Total Environ. 2021, 797, 148967. [Google Scholar] [CrossRef] [PubMed]
  32. Intergovernmental Panel on Climate Change. 2006 IPCC Guidelines for National Greenhouse Gas Inventories [EB/OL]. Available online: http://www.ipccnggip.iges.or.jp/public/2006g1/chinese/index.html (accessed on 15 June 2018).
  33. Fu, W.; Luo, M.; Chen, J.; Udimal, T.B. Carbon footprint and carbon carrying capacity of vegetation in ecologically fragile areas: A case study of Yunnan. Phys. Chem. Earth 2020, 120, 102904. [Google Scholar] [CrossRef]
  34. Xie, H.; Chen, X.; Lin, K.; Hu, A. Ecological Footprint of Fossil Energy and Electric Power Based on Carbon Cycle. J. Ecol. 2008, 28, 1729–1735. [Google Scholar]
  35. Wang, X. Research on Carbon Pool of Chinese Forest Ecosystem and Carbon Trace Gases Released by Forest Fire. Ph.D. Thesis, Ecological Environment Research Center of Chinese Academy of Sciences, Beijing, China, 1996. [Google Scholar]
  36. Pandey, D.; Agrawal, M.; Pandey, J.S. Carbon footprint: Current methods of estimation. Environ. Monitor. Assess. 2011, 178, 135–160. [Google Scholar] [CrossRef] [PubMed]
  37. Abbasi, K.R.; Kirikkaleli, D.; Altuntaş, M. Carbon dioxide intensity of GDP and environmental degradation in an emerging country. Environ. Sci. Pollut. Res. 2022, 29, 84451–84459. [Google Scholar] [CrossRef]
  38. Yu, S.; Hu, X.; Fan, J.; Cheng, J. Convergence of carbon emissions intensity across Chinese industrial sectors. J. Clean. Prod. 2018, 194, 179–192. [Google Scholar] [CrossRef]
  39. Teodoru, C.R.; Bastien, J.; Bonneville, M.C.; del Giorgio, P.A.; Demarty, M.; Garneau, M.; Hélie, J.-F.; Pelletier, L.; Prairie, Y.T.; Roulet, N.T.; et al. The net carbon footprint of a newly created boreal hydroelectric reservoir. Glob. Biogeochem. Cycles 2012, 26, 1–14. [Google Scholar] [CrossRef] [Green Version]
  40. Li, J.; Bergin, E.A.; Blake, G.A.; Ciesla, F.J.; Hirschmann, M.M. Earth’s carbon deficit caused by early loss through irreversible sublimation. Sci. Adv. 2021, 7, eabd3632. [Google Scholar] [CrossRef]
  41. Persson, T.A.; Azar, C. The cost of meeting the Kyoto Protocol: Dealing with the carbon surplus in Russia and the Ukraine. Manag. Environ. Qual. Int. J. 2003, 14, 488–507. [Google Scholar] [CrossRef]
  42. Sun, X.; Mi, Z.; Sudmant, A.; Coffman, D.; Yang, P.; Wood, R. Using crowdsourced data to estimate the carbon footprints of global cities. Adv. Appl. Energy 2022, 8, 100111. [Google Scholar] [CrossRef]
  43. Lombardi, M.; Laiola, E.; Tricase, C.; Rana, R. Assessing the urban carbon footprint: An overview. Environ. Impact Assess. Rev. 2017, 66, 43–52. [Google Scholar] [CrossRef]
  44. Nutkiewica, A.; Choi, B.; Jain, R.K. Exploring the influence of urban context on building energy retrofit performance: A hybrid simulation and data-driven approach. Adv. Appl. Energy 2021, 3, 100038. [Google Scholar] [CrossRef]
Figure 1. Carbon-Carrying Capacity of Forest Land and Crops in Zhejiang Province.
Sustainability 14 16824 g001
Figure 2. Trend Chart of Net Carbon Footprint of Zhejiang Province.
Sustainability 14 16824 g002
Figure 3. Carbon Footprint Intensity of Zhejiang Province.
Sustainability 14 16824 g003
Figure 4. Carbon Footprint Per Capita of Zhejiang Province.
Sustainability 14 16824 g004
Table 1. Coal Conversion Coefficient and Carbon Dioxide Emission Coefficient of Main Energy Sources.
EnergyConversion FactorCarbon Dioxide Emission Coefficient (kgCO2/kg)
Raw Coal0.7143 kg ce/kg1.98
Coke0.9714 kg ce/kg3.04
Natural Gas1.1 kg ce/cu.m2.18
Gasoline1.4714 kg ce/kg2.98
Kerosene1.4714 kg ce/kg3.10
Diesel1.4571 kg ce/kg3.16
Fuel Oil1.4286 kg ce/kg3.24
Liquefied Petroleum Gas1.7143 kg ce/kg3.16
Other Petroleum Products (10,000 tons)1.2 kg ce/kg2.81
Source: China Energy Statistical Yearbook 2018.
Table 2. Economic Coefficient of Main Crops.
Main CropsEconomic Coefficient
Rice0.47
Wheat0.35
Barley0.34
Corn0.35
Other Cereal0.40
Beans0.18
Yam0.75
Oil Bearing Crops0.39
Cotton0.35
Fiber Crops0.34
Sugar Crops0.84
Table 3. Energy Consumption and Industrial Production Carbon Emissions of Zhejiang Province (Unit: ten thousand tons).
Energy20152016201720182019
Raw Coal1262.70972.94945.48953.98891.88
Coke18,980.1119,335.2019,822.0119,744.4519,010.08
Natural Gas1870.442020.322403.283090.303362.48
Gasoline3306.343494.313766.393780.553460.46
Kerosene517.80581.11674.21746.46804.48
Diesel4458.804060.703830.753508.443363.45
Fuel Oil1510.151764.861843.691407.481406.14
Liquefied Petroleum Gas1944.341970.661855.931614.211442.81
Other Petroleum Products1174.16881.141018.48780.48902.41
Cement4819.344610.124795.715230.015721.77
Total39,844.1739,691.3740,955.9240,856.3840,365.97
Table 4. Area and Carbon-carrying capacity of Forest Land in Zhejiang Province.
20152016201720182019
Area (10,000 hectares)564.65564.25563.78563.33609.36
Carbon-carrying capacity (10,000 tons)5879.925875.695870.835866.116345.44
Table 5. Output and Carbon-carrying capacity of Main Crops in Zhejiang Province (Unit: ten thousand tons).
20152016201720182019
Rice577.2593.75444.91477.40462.06
Wheat35.1325.3941.9235.7932.38
Barley7.703.601.970.170.15
Corn31.0730.4523.0420.6432.32
Other Cereal3.582.751.591.741.66
Beans35.8132.7527.3828.2230.58
Yam61.6363.4739.3235.1733.00
Oil Bearing Crops31.3529.0926.9029.4331.93
Cotton1.991.650.600.810.81
Fiber Crops0.030.020.020.010.01
Sugar Crops62.1662.0837.5040.5944.68
Carbon-carrying capacity173.26170.51134.01138.57139.69
Table 6. GDP of Zhejiang Province (Unit: CNY 100 million).
20152016201720182019
GDP43,507.7247,254.0452,403.1358,002.8462,462.00
Source: Statistical Yearbook of Zhejiang Province.
Table 7. Number of Permanent Residents in Zhejiang Province at the End of 2015–2019 (Unit: 10,000 persons).
20152016201720182019
Number of Permanent Residents at the End of Year59856072617062736375
Source: Statistical Yearbook of Zhejiang Province.
Publisher’s Note: MDPI stays neutral with regard to jurisdictional claims in published maps and institutional affiliations.