Article

Impacts of Certain Meteorological Factors on Atmospheric NO2 Concentrations during COVID-19 Lockdown in 2020 in Wuhan, China

1
College of Geography and Environmental Sciences, Northwest Normal University, Lanzhou 730070, China
2
Faculty of Atmospheric Remote Sensing, Shaanxi Normal University, Xi’an 710062, China
3
Meteorology of Zhangjiachuan Hui Autonomous County, Tianshui 741000, China
*
Author to whom correspondence should be addressed.
Sustainability 2022, 14(24), 16720; https://doi.org/10.3390/su142416720
Submission received: 22 November 2022 / Revised: 7 December 2022 / Accepted: 12 December 2022 / Published: 13 December 2022
(This article belongs to the Special Issue Air Quality Change in Association with COVID-19 Pandemic)

Abstract

:
The concentration of nitrogen dioxide (NO2) in the air is one of the important indexes for evaluating air quality. At the beginning of 2020, a COVID-19 outbreak suddenly hit Wuhan, China. To effectively control the epidemic, Wuhan was put under a 76-day lockdown, during which we collected tropospheric column amounts in the atmosphere and NO2 concentrations measured at ground monitoring stations, and we reviewed the ground NO2 concentrations in 2019 and the tropospheric NO2 concentrations between 2012 and 2019. Using the random forest (RF) model, we predicted the impact of the tropospheric NO2 concentration during the lockdown period without the occurrence of the COVID-19 epidemic and analyzed the impact of multiple certain meteorological factors on tropospheric and ground NO2 concentrations. The results showed that the tropospheric and ground NO2 concentrations were reduced by 11.04~53.36% and 21.96~65.04%, respectively. The main factors affecting the tropospheric NO2 concentration were wind velocity, land surface temperature, surface lifted index, precipitable water volume and tropospheric relative humanity. The main factors affecting the ground NO2 concentration were tropospheric relative humanity, surface lifted index, land surface temperature and tropospheric temperature. The development of different emission reduction and control measures under different meteorological conditions and the formulation of more refined policies will play positive roles in improving the efficiency of air pollution control.

1. Introduction

Nitrogen dioxide (NO2) is an important trace gas in the atmosphere. It is an important precursor pollutant of particle material, ozone (O3) and acidic rain formation in the atmosphere and is related to a series of environmental problems [1,2,3]. The Gothenburg Protocol in 1999 defined the upper limit of emission of nitrogen oxide (NOx) and other air pollutants allowable by 2010. In recent years, China has made substantial progress and obtained remarkable achievements in controlling NOx as represented by a decreasing tendency in the NO2 content in the air [4,5].
At the beginning of 2020, Wuhan, China, was hit by a COVID-19 epidemic with an acute onset and high mortality [6]. To effectively control the epidemic and maximally reduce interpersonal contact and transmission, the Central Government made a decision of locking down Wuhan for a total of 76 days from 23 January to 8 April 2020. Wuhan is a big city in China with a population of 8.5 million. Epidemic lockdown provides a scene for using observational measures to predict the atmospheric composition in the future and makes it possible to determine human contributions to the control of atmospheric pollutants by comparing the content of atmospheric pollutants before and after lockdown. Because of the epidemic lockdown, many people have to work at home and minimize their outdoor activities. As a result, anthropogenic emissions are reduced markedly, and therefore it is easier to observe the relationship between air quality in the atmosphere and meteorological conditions. A combination of these observational results with specific scientific models can help in understanding the response of the Earth system to the reduction in anthropogenic emissions, which can to some extent predict the effectiveness of different emission-control measures.
Since the onset of the COVID-19 epidemic, researchers have calculated changes in the concentrations of atmospheric pollutants before and after the COVID-19 epidemic by using different methods. Baldasano et al. [7] analyzed the observational results from air quality monitoring networks and reported NO2 changes during the COVID-19 epidemic in Madrid and Barcelona. They found that the NO2 concentration decreased by 62% and 50% in these two cities, respectively, with traffic contributing 55% (Madrid) and 56% (Barcelona). It was confirmed that traffic from internal combustion engine motor vehicles is the most important source of urban pollution emissions. Collivignarelli et al. [8] compared the daily data of pollutants during the lockdown period and those during the same period of the previous three years in Paris, Milan and London and found that the NO2 concentration was decreased significantly mainly due to traffic reasons, which can also be partly attributed to the reduction in heating and the closure of workplaces. Hashim et al. [9] investigated the influences of emission reductions on air pollution, mainly on transport and industry, due to reduced anthropogenic activities during the COVID-19 blockade in Iraq and found that the NO2, PM2.5 and PM10 concentrations decreased by 6%, 8% and 15% respectively, and O3 increased by 13% during the first episode of lockdown, and during the second episode of lockdown, NO2 and PM2.5 decreased by 20% and 2.5%, while O3 and PM10 increased by 525% and 56% respectively. These studies confirm that COVID-19 does lead to a decrease in atmospheric pollutant levels and that the effects of COVID-19 on atmospheric pollutants mainly occur through impacts on traffic and industry. However, none of these studies fully considered the trend of changes in the already existing pollutants in the areas of interest when they calculated the amplitude of the decrease in the pollutants. The random forest (RF) model is widely used in land surface inversion and air pollutant simulation due to its advantages of easy implementation, low computational cost and high model interpretability. In this study, we used RF to simulate the possible pollutant concentration in the end stage of lockdown in Wuhan and obtained a more precise picture of the change of pollutants. Laughnera et al. [10] studied changes in some important parameters concerning the human activities in different departments during different stages of lockdown and found that ground traffic activities were the most important factor affecting NOx emission during the COVID-19 epidemic. Other than anthropogenic factors, temperature, relative humidity, wind velocity and other natural factors also have huge impacts on NO2. It was confirmed that meteorological factors also play an important role in the variation in atmospheric pollutants during COVID-19 lockdown. We analyzed the relationship between the meteorological factors and the NO2 concentration during the lockdown in Wuhan and observed the impact of meteorological factors on NO2 in real-world settings.
In this study, we chose Wuhan as the area of interest (Figure 1). Wuhan is situated in the east of Hubei Province of China at the intersection of the Yangtze River and Hanshui River and geographically at 29°58′~31°22′ N and 113°41′~115°05′ E. The mean annual temperature of Wuhan is 15.8~17.5 °C, and annual rain precipitation is 1150~1450 mm, which is mainly concentrated in June, July and August, accounting for about 40% of the annual precipitation.

2. Data and Methods

2.1. NO2 Data Obtained from Ozone Monitoring Instrument (OMI)

OMI NO2 data were obtained from the Aura satellite of the US National Aeronautics and Space Administration (NASA) (https://disc.gsfc.nasa.gov/ (accessed on 13 July 2021)). OMI is an ultraviolet spectrometer that can measure backscattered radiation of 270~500 nm with a spectral resolution of about 0.5 nm and a spatial resolution of 13 km × 24 km. In this study, we used OMI/Aura NO2 tropospheric column L3 global grid 0.25 × 0.25 V3 data product, which is a level 3 grid product with its quality pixel level data merged and equally divided into 0.25 × 0.25 degree global grids. This product has undergone data screening and only preserves data with a cloud fraction <30%. For this reason, no additional screening is necessary [11].

2.2. NO2 Data Obtained from Ground Monitoring Stations

The present study used the mean daily value of hourly real-time monitoring data of urban air quality released by the National Environmental Monitoring Centre of China (CNEMC) (http://www.cnemc.cn/ (accessed on 13 July 2021)).

2.3. Meteorological Data

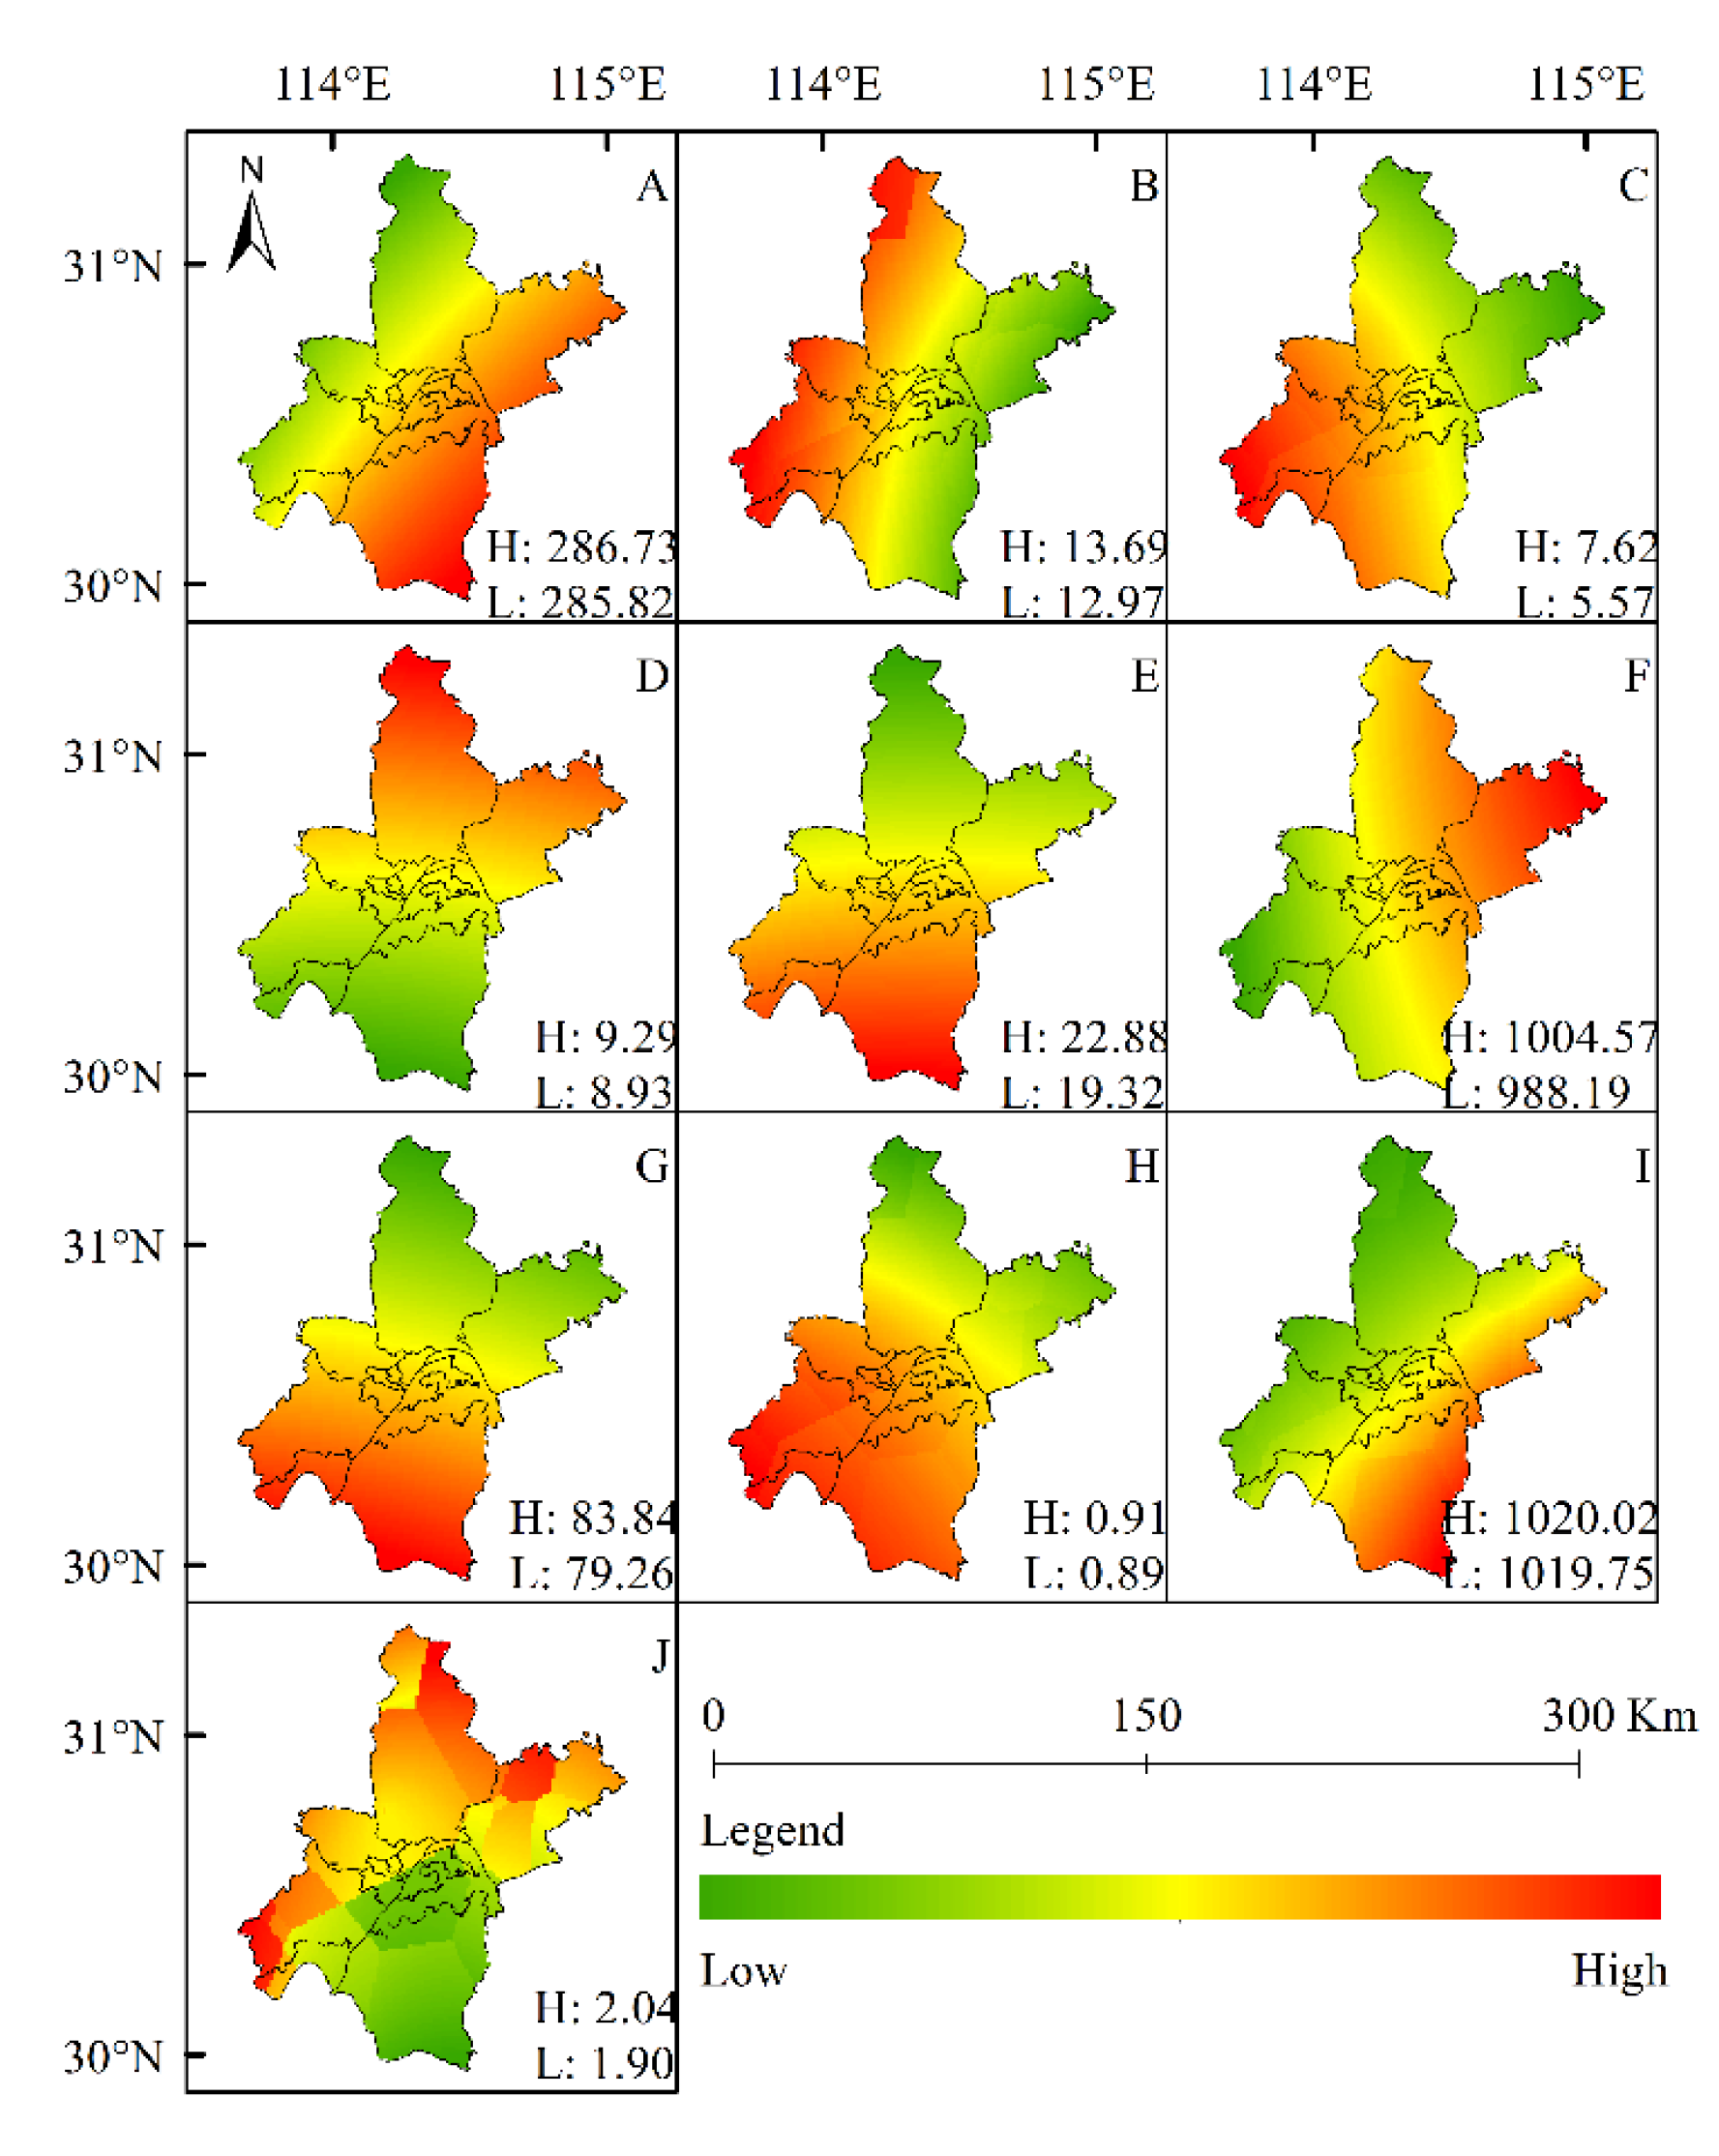
The present study used the re-analysis data presented by the US National Centers for Environmental Prediction (NCEP)/National Center for Atmospheric Research (NCAR) (https://psl.noaa.gov/data/gridded/data.ncep.reanalysis.html (accessed on 13 July 2021)), including the lifted index (LI) (°C), tropospheric temperature (K), atmospheric pressure (Pa), precipitable water volume (PWV) (kg/m2) and relative humidity (RH) (%), of which LI and RH were ground data, and temperature, atmospheric pressure and RH were tropospheric data. The meteorological station data were from the US National Climate Data Center (NCDC), measured and recorded at an hourly interval. In this study, we used the mean value calculated based on the data obtained from all meteorological centers at each time point, including ground temperature, dew point temperature, sea-level pressure, wind velocity and ground RH; sea-level pressure refers to the difference value between the monitoring station pressure and the sea-level pressure. The meteorological conditions during the lockdown in the study area are plotted in Figure 2.

2.4. The RFR Model

Random forest is a statistical theory developed by Breiman in 2001 based on the idea of establishing a certain number of decision trees and then combining these decision trees to form a random tree. The existence of the multilayer stochastic process makes it possible for RF to randomly generate hundreds or even thousands of decision trees and guarantees that the decision trees generated each time are different because of randomness in simulating the multiple nonlinear relations and establishing a complex RF model [12]. Compared with other “black box” machine learning algorithms, RF features easy implementation, low computational cost and high model interpretability. In addition, the RF algorithm can effectively prevent the phenomenon of variable collinearity and avoid the overfitting problem [13].
Using the Random Forest Regressor (RFR) in the Python 3.7.4 Jupyter Notebook Module and Scikit_Learn Module, we established an RFR model by using max_depth and n_estimators as two important parameters, and we used goodness of fit (R2) to evaluate the model in the process of establishing the model. Max_depth is the number of downward branches in establishing the decision trees, which is referred to as the depth of the regression tree. Selection of an appropriate max depth can reduce the R2 value of the RF model through the traversal setting of max_depth from 1 to n, conducting n tests and importing the R2 of each test. For n_estimators, we established the model by using the above-obtained optimal variable max_depth and exporting the corresponding relationship between the model R2 and the number of decision trees. The decision-making number after stabilization of the model error rate was used as the n_estimator value of the RF model. As there exists the phenomenon of overfitting in the RFR model, the R2 value of the optimal model parameters selected should be between 0.95 and 0.98.
Using the RFR model, the tropospheric NO2 concentration during the period from 23 January to 8 April 2020 with no epidemic lockdown was predicted and compared with the actual value to know the impact of the COVID-19 epidemic on NO2. We used the distribution diagram depicting the distribution of tropospheric NO2 column concentration during the previous n years and that in n + 1 year as the target value to establish the RFR model and the relationship between previous n years and n + 1 year to realize the prediction on n + 2 years (prediction model). Considering that NO2 was elevated in the area of interest in 2018 due to unknown reasons, we excluded 2018 from the data engineering, which may amplify the error in the final prediction result.
The ground meteorological factors vs. the tropospheric NO2 concentration and tropospheric meteorological factors vs. the ground NO2 concentration were used to establish models. Based on the NO2 concentrations and meteorological factors obtained from the ground pollutant monitoring stations, the mean values of the tropospheric data within the 13 × 24 km of the monitoring station as the center were used to establish the ground NO2 concentration model. After the model was adjusted by parameter refinement, the analog value of the daily NO2 concentration obtained from each monitoring station was obtained. The first four natural factors impacting the importance of tropospheric and ground parameter sorting lists were used to draw partial dependence plots to obtain the impact of each meteorological factor on the ground and tropospheric NO2.

2.5. Model Verification

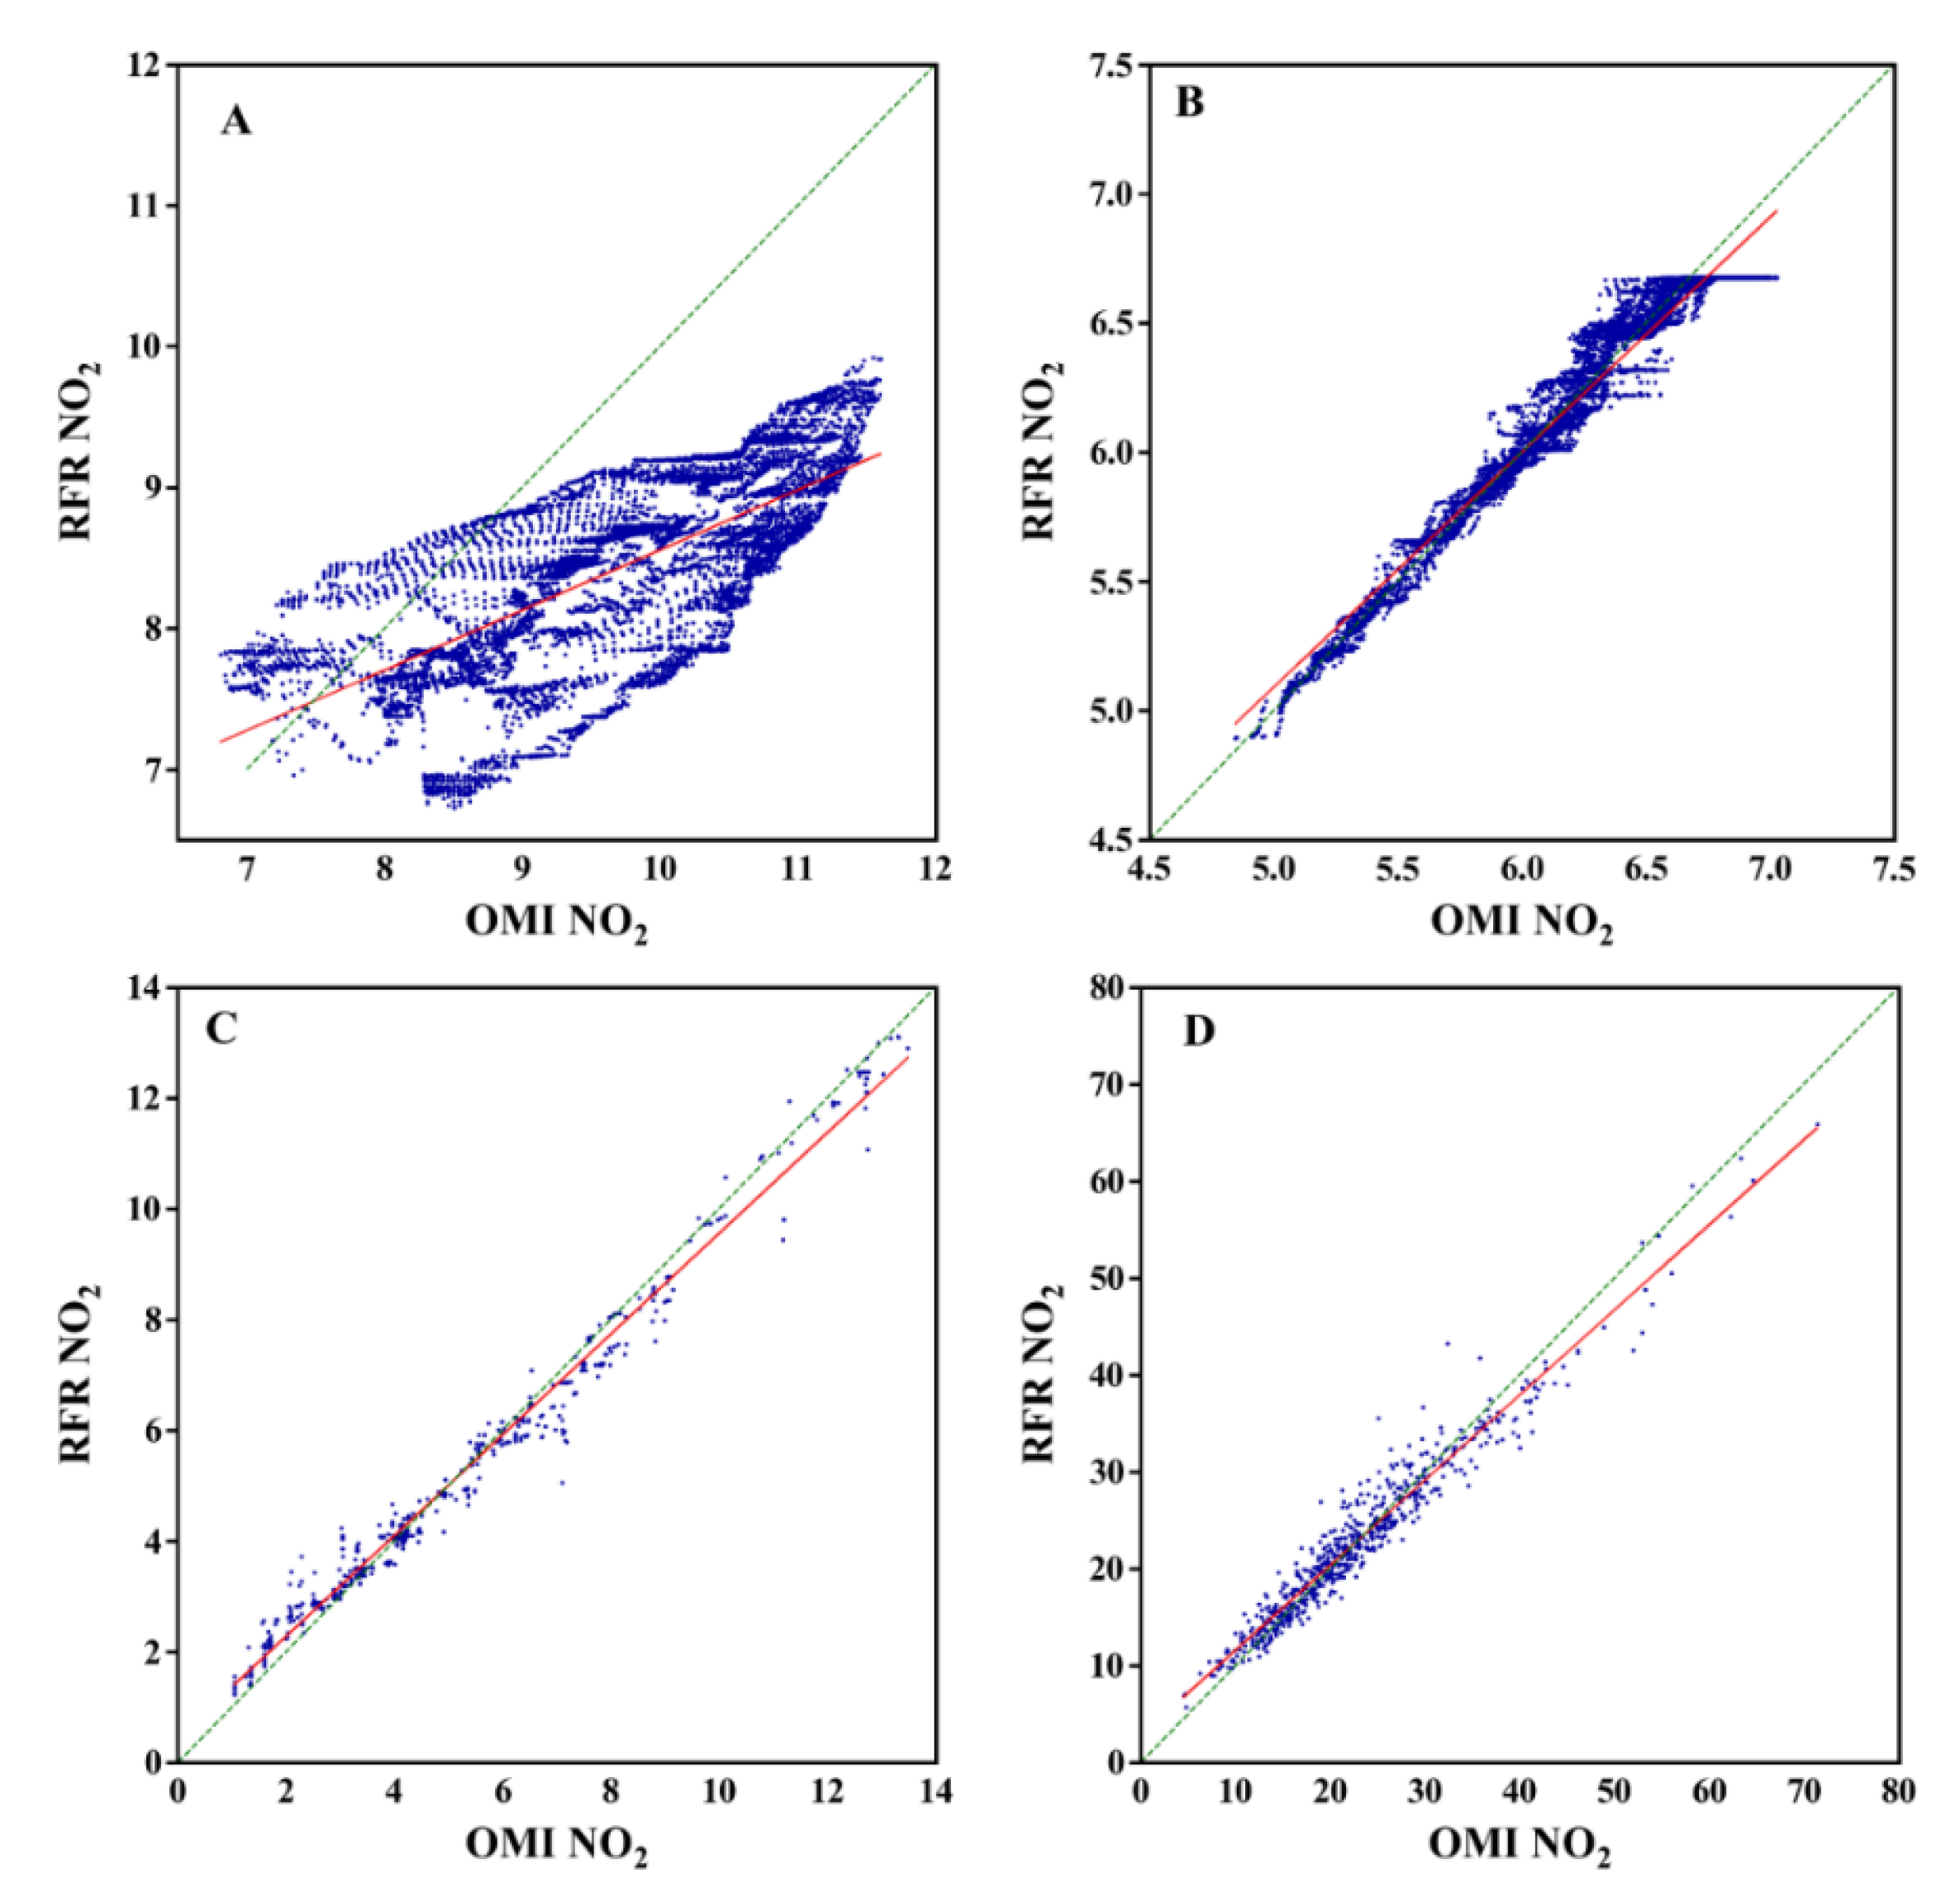
As shown in Figure 3, the large error slope of the model was 0.426. The simulated slope of the distribution of the ground NO2 concentration vs. tropospheric NO2 concentration in 2020 corresponding to the meteorological factors was 0.91, and the slope of ground data simulated based on the meteorological factors was 0.88.
As shown by the distribution graph, the simulated error of NO2 concentration distribution in 2019 was between −18.74 and 23.58%, and the mean error in the NO2 distribution graph calculated according to the raster graph was 0.3% and the RMSE was 1.48. Although this prediction was not accurate enough against the extreme value, it is reliable against the overall value.
The result of the simulation using the meteorological factors vs. the tropospheric and ground NO2 concentrations showed that the simulation effect was good in both tropospheric and ground parameters. The maximum error was 5.21% in the tropospheric NO2 distribution simulation, and the minimum error was neglectable, with a mean error of 1.22% and an RMSE of 0.11. The maximum error was 40.19% in ground vs. tropospheric simulation, and the minimum error was 8.01%, with a mean RMSE of 0.43. The maximum error was 35.32 in the ground simulation, and the minimum error was neglectable, with a mean error of 7.83% and an RMSE of 2.33.

3. Results and Discussion

3.1. Mean Annual Distribution of the Tropospheric NO2 Column Concentrations during 2012~2020

As shown in Figure 4, the annual distribution of the tropospheric NO2 column concentrations was characterized by high values in the central town radiating to the surrounding areas. The NO2 concentration in the area of interest was the highest in 2012, 2013 and 2018 during the 9 years from 201 to 2020, especially in 2018, when the NO column concentration rose suddenly, with the maximum value exceeding 20 × 1015 molec/cm2. The value was stable between 2015 and 2017, and relatively low between 2019 and 2020, with the lowest level in 2020 during the 9-year period because of the epidemic lockdown. Air pollutant emissions dropped significantly from 2015 because China tightened controls on air pollutant emissions in 2014. A large rebound in 2018 was due to increased summer heat and winter cold and adjustments to pollutant emission policies.

3.2. Changes in Tropospheric and Ground NO2 Column Concentrations during Lockdown

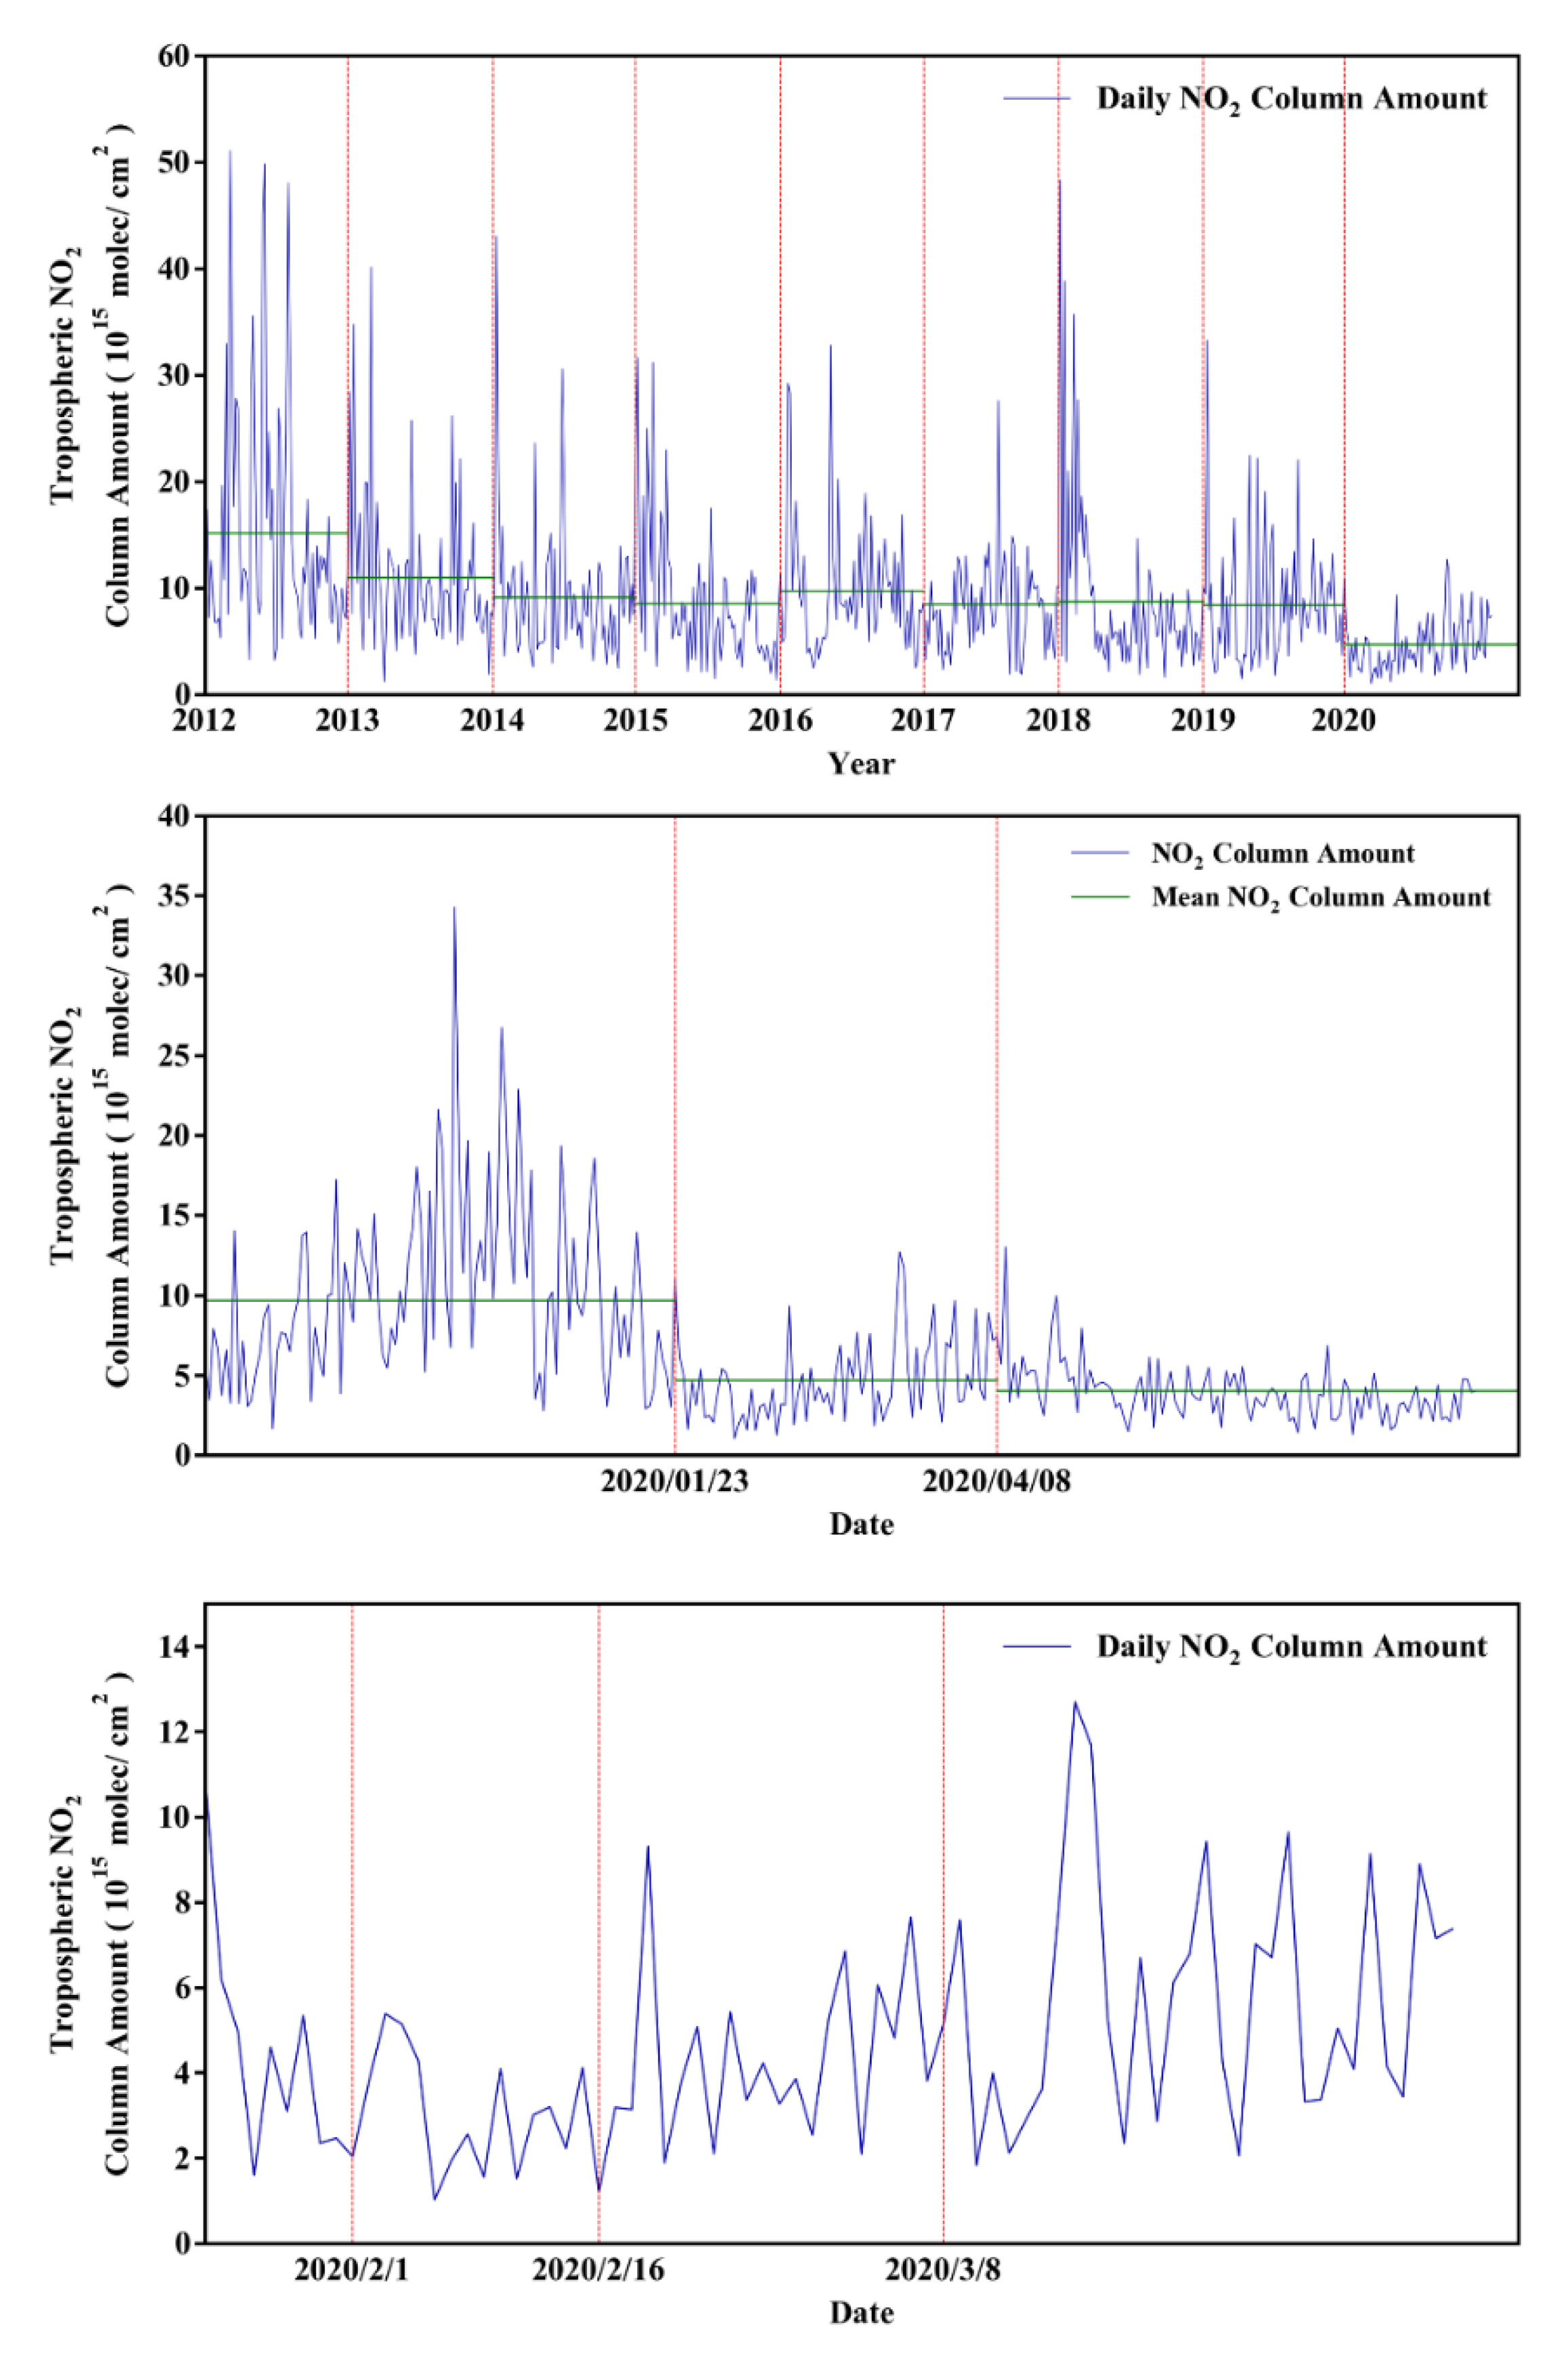
Figure 5 indicates the comparison of the daily NO2 column concentrations between the period from 2012 to 2019 and 2020. The result showed a persistent decrease in the tropospheric NO2 column concentration after 2012, and this decreasing trend remained stable during the period from 2015 to 2019. Although the NO2 column concentration continued to decrease from 2014 to 2019, the extent of the decrease was not significant. In 2020, the NO2 column concentration decreased significantly by 3.76 × 10¹⁵ molec/cm2 (about 45%) as compared with that during the same period in 2019. The NO2 column concentration during the 76-day lockdown was 5.39 × 10¹⁵ molec/cm2 (54%), which was lower than that 100 days before lockdown, and this figure continued decreasing by 0.77 × 10¹⁵ molec/cm2 (16%) 100 days after lockdown.
According to the phase division of the Wuhan epidemic by the Journal of the American Medical Association (JAMA), the epidemic lockdown in Wuhan began during the third phase of the epidemic outbreak from 23 January to 1 February 2020. The fourth phase was from 2 February to 16 February 2020, and the fifth phase was from February 17 to March 8, 2020 [6]. During the third phase of the epidemic, the NO2 column concentration decreased markedly from 10.95 × 10¹⁵ molec/cm2 23 January to the lowest level of 1.59 × 10¹⁵ molec/cm2 on 26 Jan, and this lowest level remained there throughout the fourth phase, the highest being 3.48 × 10¹⁵ molec/cm2 on 3 February and lowest being 1.02 × 10¹⁵ molec/cm2 on 6 February. The figure partially rebounded during the fifth phase, the highest being 9.30 × 10¹⁵ molec/cm2 on February 19 and the lowest being 1.89 × 10¹⁵ molec/cm2 on 20 February. After the fifth phase, there was a marked rise in the NO2 column concentration.
The above data show that NO2 change was stable during the period from 23 January to 16 February, and NO2 began rising from the fifth phase, and there was a relatively large increase on 8 March.
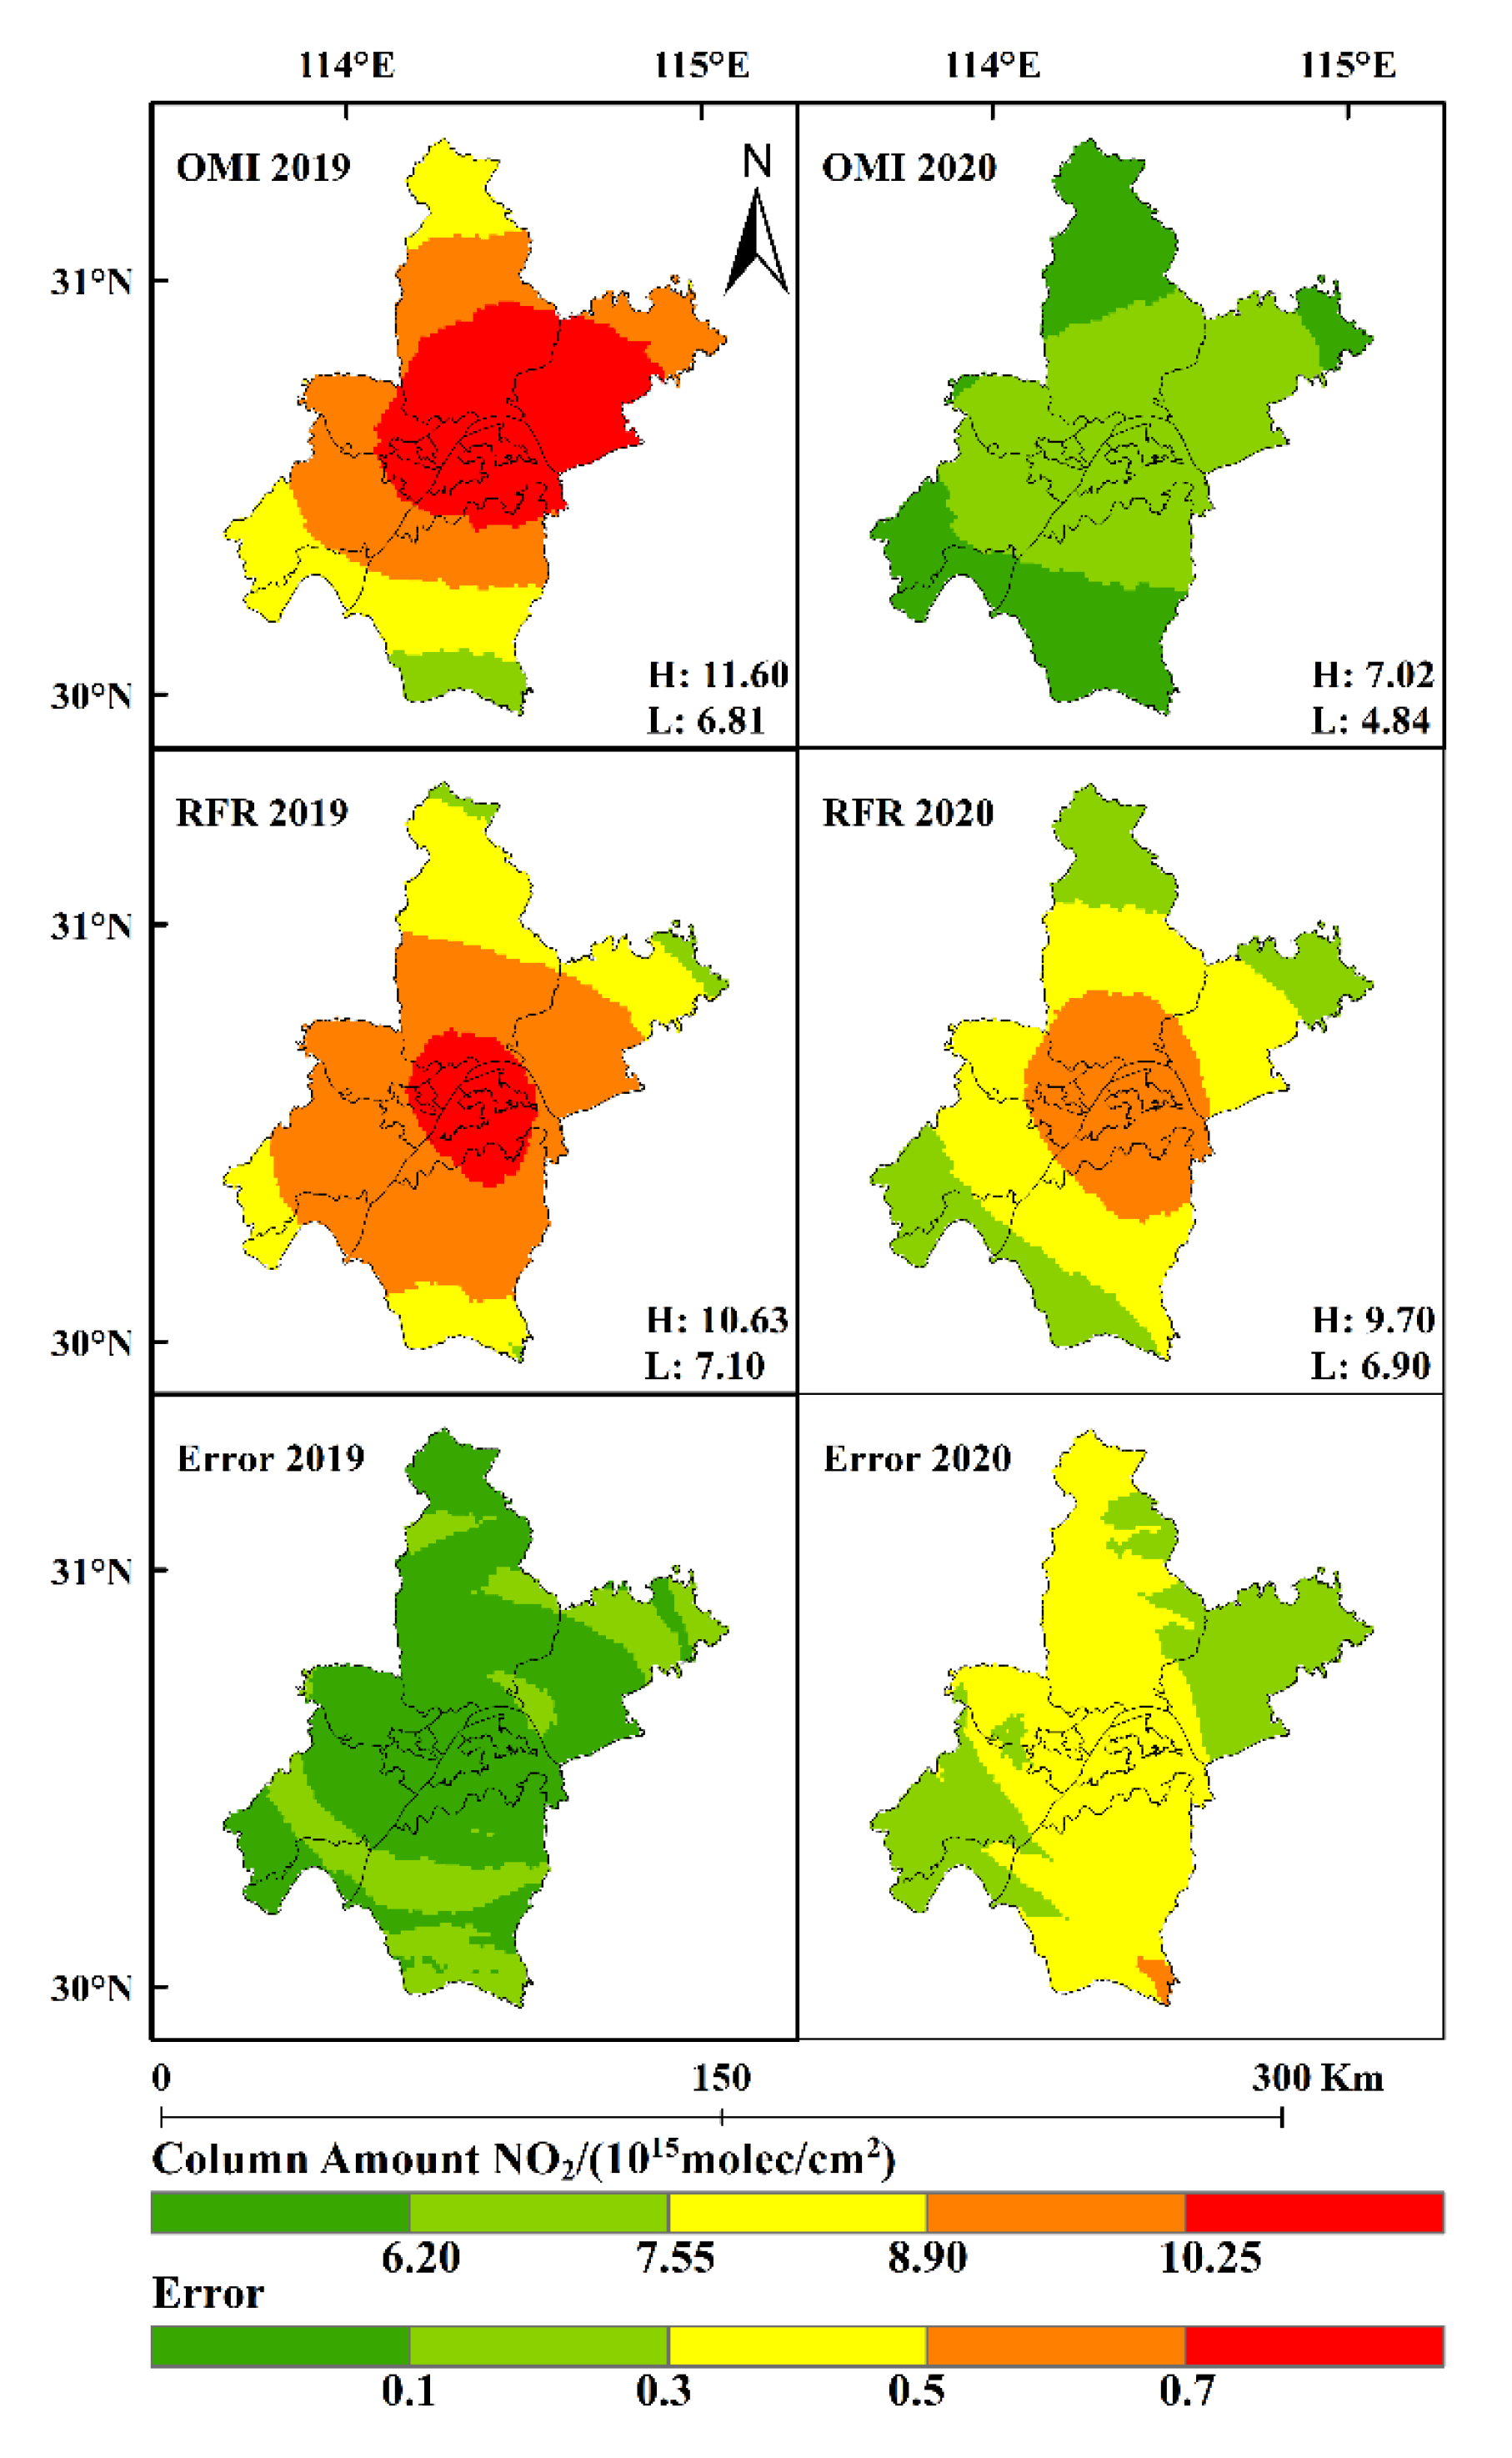
As shown by RF prediction in Figure 6, the high center of the prediction values is consistent with that in 2019, and the actual OMI value distribution is also similar to that in 2019. The calculation of the raster graph showed that the column concentration calculated by actual OMI was 32.20% lower than that predicted by RF. With the model error itself taken into consideration, the amplitude of the NO2 column decrease due to the epidemic lockdown was between 11.04 and 53.36%. Considering the annual decrease in the NO2 column concentration in the area of interest, the calculation of the amplitude of the decrease in NO2 used the mean value of several years, and the result of NO2 may be overestimated. Using the RF model to predict the result obtained under the non-COVID setting may be able to better reflect the impact of the COVID-19 epidemic on the NO2 concentration in 2020.
The maximum, minimum and mean values obtained from the ground monitoring stations during the 76-day lockdown, 100 days before the lockdown in 2020, and during the same period in 2019 were compared. Of the nine ground monitoring stations, 1325 A~1333 A were the monitoring points of the main urban area, and 1334 A was the farmland monitoring point as the control point.
In the same period in 2019, the lowest mean NO2 concentration 35.66 ± 16.37 µg/m3 appeared at 1325 A, and the highest mean value 54.77 ± 18.96 µg/m3 appeared at 1328 A of the eight ground monitoring points in the main urban areas, and the mean value in the control point was 24.64 ± 14.97 µg/m3 (Table 1), indicating that the mean NO2 concentration in the main urban areas where human activities were more crowded was higher than that at the farmland control point. While the NO2 concentration at 1325 A point was 11.01 µg/m3 higher than that at the farmland control point, the NO2 concentrations at the other points were all at least 20 µg/m3 higher than that at the control point; in particular, at the 1328 A point, the NO2 concentration was 30.13 µg/m3 higher than that at the control point. A similar situation was observed 100 days before the lockdown, i.e., the NO2 concentration obtained from the ground monitoring stations in the main urban areas was significantly higher than that at the farmland control point 1334 A.
The NO2 concentration obtained from the ground monitoring stations in the main urban areas was significantly higher than that at the farmland control point during the lockdown in 2020. However, all mean values obtained from all monitoring points were significantly lower than those during the same period in 2019 and 100 days before the lockdown in 2020. The difference gap between the data obtained from the ground monitoring stations and those obtained from the farmland control point was reduced significantly by 21.96~65.04% as compared with that during the same period in 2019, and by 38.26~67.54% as compared with that 100 days before the lockdown, indicating that the lockdown truly decreased the NO2 concentration in the atmosphere. The ground NO2 concentration decreased by about 21.96~65.04% due to the lockdown, which is similar to the result reported by a previous study [14].

3.3. Impact of Natural Factors on Ground and Tropospheric NO2 Concentrations
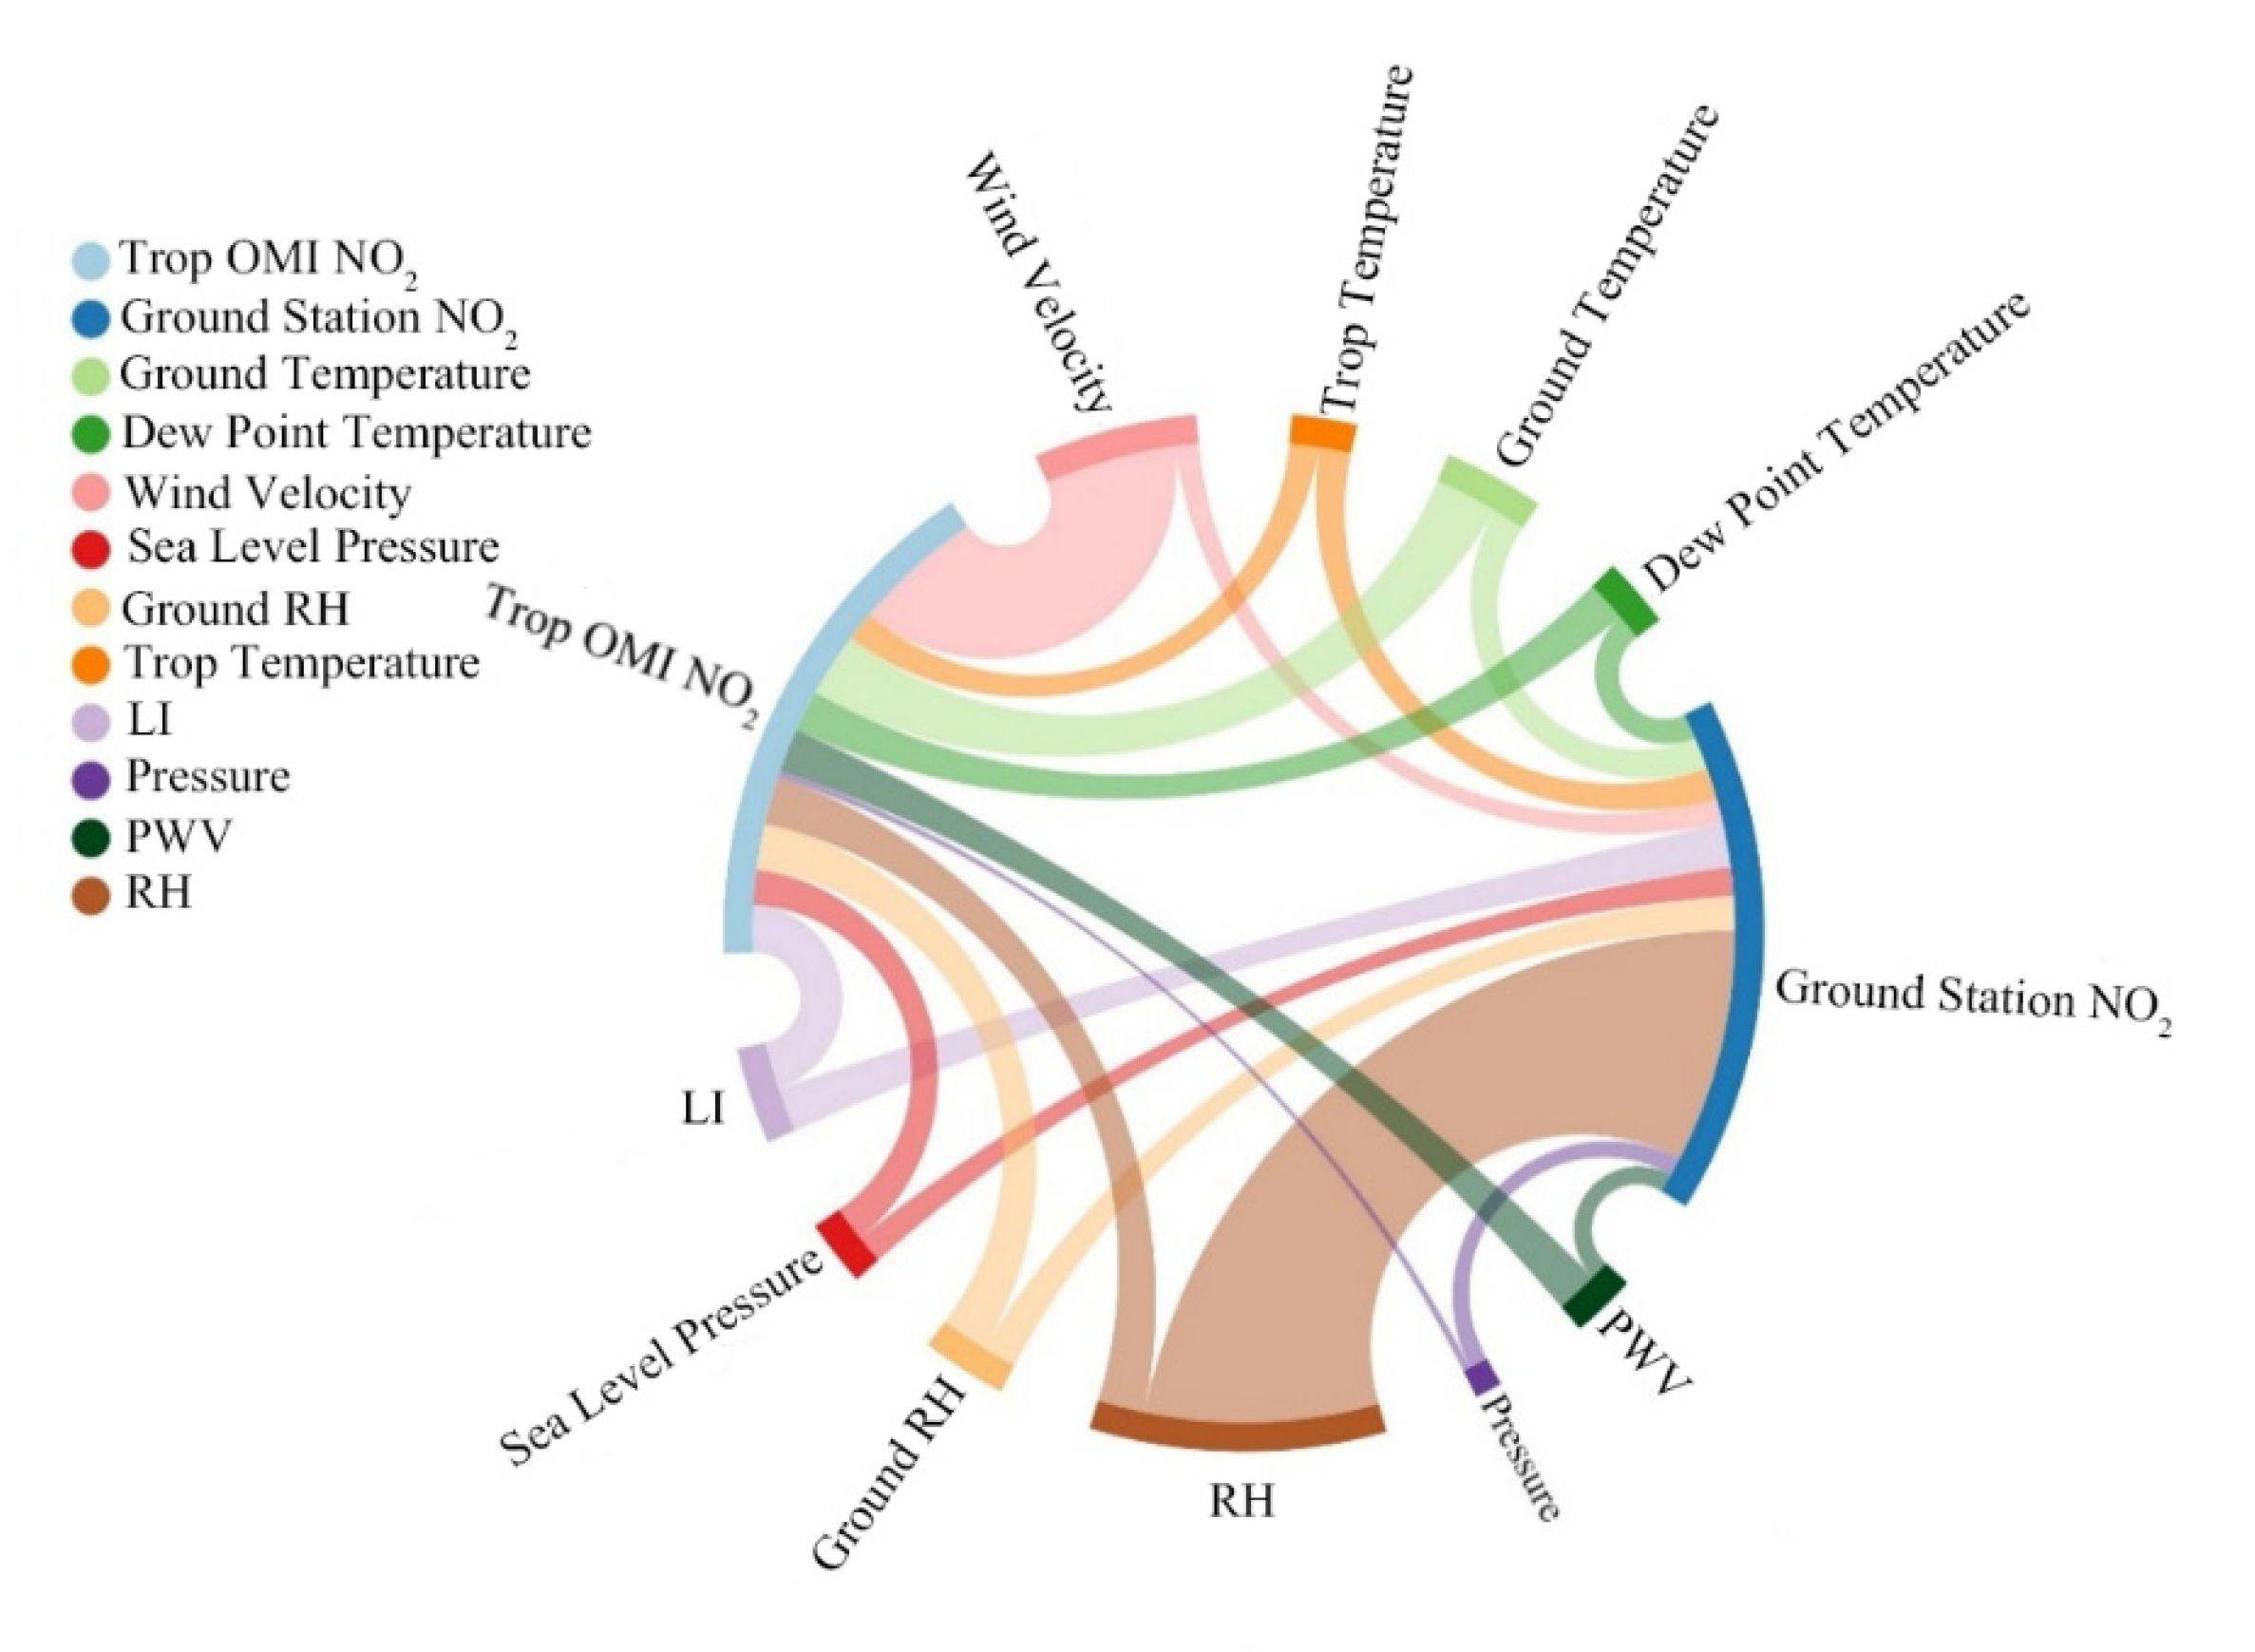
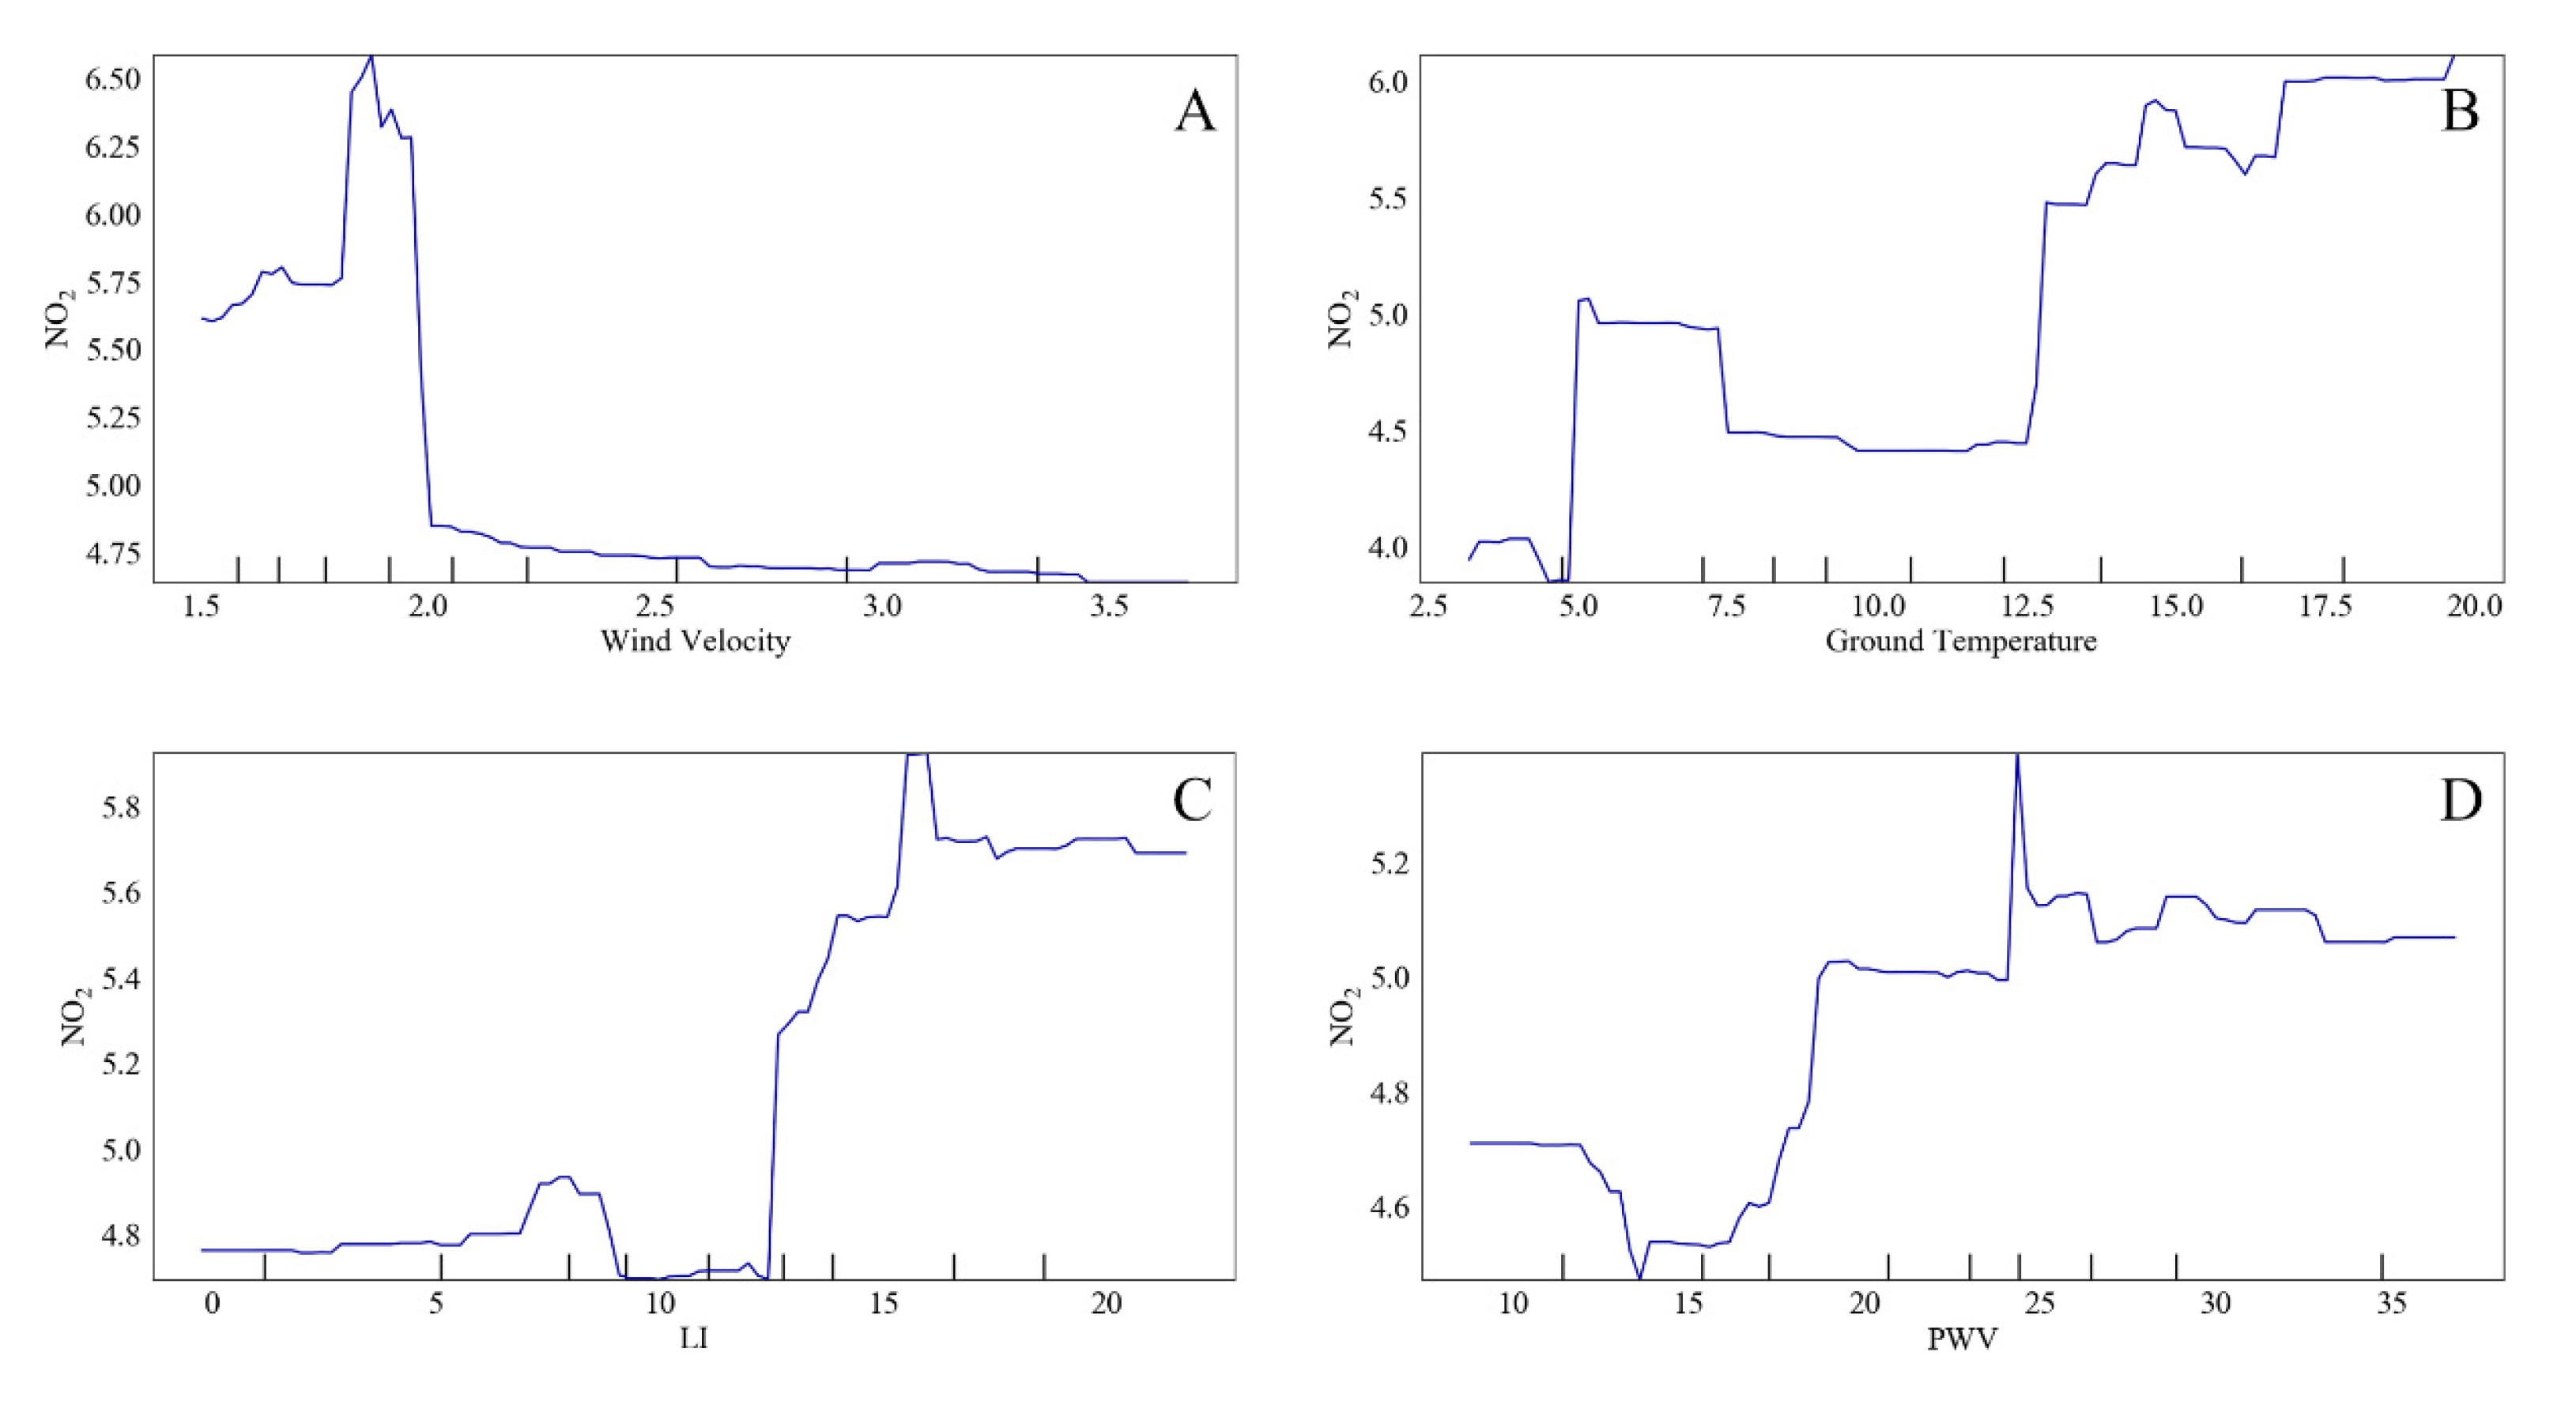
According to the model established, the impact of important parameters of each meteorological factor on the ground and tropospheric NO2 concentrations was obtained (Figure 7), from which the first four important parameters were selected to draw meteorological partial dependence plots (Figure 8 and Figure 9). With respect to the tropospheric NO2, the order of important parameters is as follows: wind velocity, ground temperature, LI, PWV, ground RH, tropospheric RH, sea-level pressure, dew point temperature and tropospheric pressure. Important ground parameters included tropospheric RH, LI, ground temperature, tropospheric temperature, ground RH, sea-level pressure, dew point temperature, wind velocity, PWV and tropospheric pressure.
Figure 7. Order of the important natural factor parameters influencing ground and tropospheric NO2.
Sustainability 14 16720 g007
Figure 8. Partial dependence plots of tropospheric NO2 and some meteorological factors: (A) wind velocity; (B) ground temperature; (C) LI; (D) PWV.
Sustainability 14 16720 g008
Figure 9. Partial dependence plots of ground NO2 and some meteorological factors (A) RH; (B) LI; (C) tropospheric temperature; (D) ground temperature.
Sustainability 14 16720 g009
f x =                     0.07 X 1 + 0.67 X 2 0.17 X 3 0.18 X 4   X 1 1.81       0.24 X 1 + 0.05 X 2 0.80 X 3 0.68 X 4   1.81 < X 1 1.87 0.28 X 1 + 1.24 X 2 + 0.59 X 3 + 0.07 X 4   1.87 < X 1 2.01 0.18 X 1 + 0.42 X 2 + 0.74 X 3 + 0.30 X 4   2.01 < X 1
f x : tropospheric NO2 column concentrations; X 1 : wind velocity; X 2 : ground temperature; X 3 : LI; X 4 : PWV.
For the tropospheric NO2 column concentration, the effect of ground temperature is greatest when wind velocity ≤ 1.81 m/s, the effect of LI is greatest when the wind velocity is in the interval of 1.81 m/s and 1.87 m/s, the effect of surface air temperature is greatest when the wind velocity is in the interval of 1.87 m/s and 2.01 m/s, and the effect of LI is greatest when the wind speed is greater than 2.01 m/s.
f x =           0.32 X 1 0.46 X 2 + 0.47 X 3 0.62 X 4   X 1 93.71 % 0.26 X 1 + 0.96 X 2 1.88 X 3 + 3.80 X 4   93.71 % < X 1 94.60 % 0.06 X 1 0.18 X 2 + 0.68 X 3 + 0.31 X 4   94.60 % < X 1
f x : NO2 concentration obtained from the ground monitoring stations; X 1 : RH; X 2 : LI; X 3 : tropospheric temperature; X 4 : ground temperature.
For the NO2 concentration obtained from the ground monitoring stations, the effect of ground temperature is greatest when RH ≤ 93.71%, the effect of tropospheric temperature is greatest when the RH is in the interval of 93.71% and 94.60%, and the effect of tropospheric temperature is greatest when the wind speed is greater than 94.60%.

3.3.1. Wind Velocity

Prevailing winds, which may transport moisture or aerosol particles from distant sources, show a significant negative correlation between total urban concentrations and wind speed data [15]. This is because higher wind speeds increase the transport effect, which explains the clearing of local air [15].
Wind velocity at 1.81~2.01 m/s had the greatest impact on the tropospheric NO2 column concentration; wind velocity at 1.81~1.87 m/s mainly played a promoting effect, wind velocity at 1.87~2.01 m/s mainly played an inhibitory effect, and wind velocity >2.01 m/s played a stabilizing effect. The main finding of previous studies on the impact of wind on the NO2 column concentration is that wind could reduce the NO2 column concentration. The impact of wind on NO2 was mainly reflected in two aspects: on the one hand, wind causes the entry of external clean air, thus reducing the pollutant concentrations, and on the other hand, it transports the pollutants out of the area of interest, thus reducing the pollutant concentrations [15,16,17]. However, our partial dependence plots show that the impact of wind velocity on the NO2 column concentration is not merely the inhibitory effect. This may be because wind velocity on NO2 in the ground setting may play a promoting effect and simultaneously an inhibitory effect. When wind velocity is at a relatively low rate, it mainly blows NO2 pollution in the point source into a surface shape, and when wind velocity is at a relatively high rate, it mainly migrates NO2 out of the area.

3.3.2. Temperature

It was found in our study that ground temperature at 5.0 °C and 12.5 °C played an obviously promoting effect on the tropospheric NO2 column concentration; ground temperature at 7.5 °C played a certain inhibitory effect; ground temperature at 7.5~12.4 °C played a stabilizing effect; and when ground temperature exceeded 12.5 °C, the NO2 column concentration began fluctuating and tended to stabilize at about 17.1 °C. The effects of temperature on NO2 were mainly represented by NO2 increasing with the increase in temperature and increased emission of NO2 from the soil. In addition, temperature also affected the molecular thermodynamic movement of NO2, thus affecting diffusion and chemical reactions of NO2 in the atmosphere, especially the photochemical reaction that leads to the conversion of NO2 to O3 [18,19]. With the increase in temperature, decomposition and generation of NO2 occur simultaneously. Our results showed that the rate of NO2 decomposition was greater than the emission rate of NO2 from the soil and the rate of NO2 synthesis.
The promoting effect of ground temperature on NO2 was the most obvious at 4.5~8.2 °C, and the promoting effect of tropospheric temperature on NO2 was the most obvious at 277~281 K. When converting the tropospheric temperature K into °C, we found that the value was basically consistent with the ground temperature (3.85~7.85 °C). Knowing that ground temperature decreases with the increase in altitude, the tropospheric temperature should be significantly lower than the ground temperature under the condition of soil emission taking the dominant place. However, our result showed that the tropospheric temperature was not significantly different from the ground temperature, suggesting that it is NO2 that plays a dominant role in the atmosphere. In other words, when the temperature was 4.85~7.85 °C in the area of interest during the 76-day lockdown, NO2 reactions in the atmosphere played a leading role, among which NO2 generation is the main reaction, which promoted the increase in the ground NO2 concentration.

3.3.3. Lifted Index

The inhibitory effect of LI on ground NO2 was most obvious at about 14 °C; the promoting effect of LI on tropospheric NO2 was most obvious at 12.5~15 °C; and NO2 tended to be stable at <9 °C and >16 °C. LI is often used to indicate the degree of instability of the atmosphere and it can be roughly considered that the higher the LI, the higher the probability of convective weather occurrence [20]. Our result showed that LI had opposite effects on the ground and tropospheric NO2 concentrations in intervals with similar LIs, and the reason is that when LI is larger than 0, the larger the LI, the more stable the air parcel, the higher the conversion inhibitory effect, and the lower the possibility of convective weather occurrence. Therefore, inhibiting atmosphere migration on the horizontal level and making atmosphere migration mainly in a vertical direction is beneficial to ground-released NO2 migrating upward. As a result, the NO2 concentration in the whole air column is higher than that when the air block is unstable. It can be simply expressed that the higher the LI, the higher the temperature difference between the top troposphere atmosphere and the ground atmosphere, and the faster the rate of NO2 transport from the ground to higher altitudes. Therefore, the effects of LI on NO2 on the surface and in the tropospheric atmosphere are opposite.

3.3.4. Precipitable Water Volume

It was found in our study that PWV around 12% and 25% had an obvious promoting effect on tropospheric NO2; PWV around 12~13% and larger than 25% had an obvious inhibitory effect; and PWV remained stable at <12% and >25%. Water in the atmosphere can absorb NO2 [21]. However, we found that the NO2 concentration in the area of interest rose with the increase in PWV. The reason for this discrepancy may be that the amount of water in the atmosphere is not large enough to absorb sufficient NO2 to cause a decrease in its concentration. In other words, the amount of NO2 absorbed by water in the atmosphere is lower than the amount of NO2 generated.

3.3.5. Relative Humidity

The inhibitory effect of RH on ground NO2 was most obvious when RH was 93.71~94.60%, and the effect remained stable when RH was higher or lower than 93.71~94.60%, indicating that only when the water content in the atmosphere reaches a relatively high value can it exert a significant inhibitory effect on NO2, which also corroborates the relationship between the tropospheric PWV and NO2. The effect of RH on atmospheric NO2 is mainly due to the absorption and leaching of NO2 by water [21,22]. The increase in water vapor leads to an increase in the reaction between NO2 and OH in addition to the absorption and showering effects, which leads to a decrease in NO2 [15].

4. Conclusions

Considering the already existing decreasing trend of the NO2 concentration, the tropospheric NO2 column concentration in the area of interest during the lockdown in Wuhan in 2020 decreased by 11.04~53.36%. The ground NO2 concentration during the 2020 lockdown decreased by a mean of 21.96~65.04% as compared with that during the same period in 2019 and by 38.26~67.54% as compared with that before the lockdown.
The main meteorological factors affecting tropospheric NO2 column concentration include wind velocity, ground temperature, LI, PWV and tropospheric RH. Factors affecting the ground NO2 concentration include tropospheric RH, LI, ground temperature and tropospheric RH.
Policy refinement by formulating different emission reduction and control measures according to different meteorological conditions will play positive roles in improving the efficiency of air pollution control and minimizing the socioeconomic impact of air pollution.

Author Contributions

All authors contributed to the study conception and design. Conceptualization and methodology: T.J. Software, validation, formal analysis, and writing—original draft: T.G. Writing—review and editing, data curation, visualization: B.L., B.A., R.H., J.F., Z.L. and J.D. All authors commented on previous versions of the manuscript. All authors have read and agreed to the published version of the manuscript.

Funding

This work was supported by the National Natural Science Foundation of China (2016YFC0500907) and the Natural Science Foundation of Gansu Province (CN) (17YF1FA120) at the Key Laboratory of Resource Environment and Sustainable Development of Oasis Gansu Province.

Institutional Review Board Statement

We declare that we do not have human participants, human data or human issues.

Informed Consent Statement

Not applicable.

Data Availability Statement

The data and Python code that support the findings of this study are openly accessible on request.

Conflicts of Interest

The authors have no relevant financial or non-financial interests to disclose.

References

  1. Carmona-Cabezas, R.; Gómez-Gómez, J.; de Ravé, E.G.; Jiménez-Hornero, F.J. Checking complex networks indicators in search of singular episodes of the photochemical smog. Chemosphere 2019, 241, 125085. [Google Scholar] [CrossRef] [PubMed]
  2. Fan, H.; Zhao, C.; Yang, Y. A comprehensive analysis of the spatio-temporal variation of urban air pollution in China during 2014–2018. Atmos. Environ. 2019, 220, 117066. [Google Scholar] [CrossRef]
  3. Fathabadi, A.; Seyedian, S.M.; Malekian, A. Comparison of Bayesian, k-Nearest Neighbor and Gaussian process regression methods for quantifying uncertainty of suspended sediment concentration prediction. Sci. Total Environ. 2021, 818, 151760. [Google Scholar] [CrossRef] [PubMed]
  4. Meng, K.; Xu, X.; Cheng, X.; Xu, X.; Qu, X.; Zhu, W.; Ma, C.; Yang, Y.; Zhao, Y. Spatio-temporal variations in SO2 and NO2 emissions caused by heating over the Beijing-Tianjin-Hebei Region constrained by an adaptive nudging method with OMI data. Sci. Total. Environ. 2018, 642, 543–552. [Google Scholar] [CrossRef] [PubMed]
  5. Shen, Y.; Jiang, F.; Feng, S.; Zheng, Y.; Cai, Z.; Lyu, X. Impact of weather and emission changes on NO2 concentrations in China during 2014–2019. Environ. Pollut. 2020, 269, 116163. [Google Scholar] [CrossRef]
  6. Pan, A.; Liu, L.; Wang, C.; Guo, H.; Hao, X.; Wang, Q.; Huang, J.; He, N.; Yu, H.; Lin, X.; et al. Association of public health interventions with the epidemiology of the COVID-19 outbreak in Wuhan, China. JAMA 2020, 323, 1915–1923. [Google Scholar] [CrossRef] [Green Version]
  7. Baldasano, J.M. COVID-19 lockdown effects on air quality by NO2 in the cities of Barcelona and Madrid (Spain). Sci. Total. Environ. 2020, 741, 140353. [Google Scholar] [CrossRef]
  8. Collivignarelli, M.C.; Abbà, A.; Bertanza, G.; Pedrazzani, R.; Ricciardi, P.; Miino, M.C. Lockdown for CoViD-2019 in Milan: What are the effects on air quality? Sci. Total. Environ. 2020, 732, 139280. [Google Scholar] [CrossRef]
  9. Hashim, B.M.; Al-Naseri, S.K.; Al-Maliki, A.; Al-Ansari, N. Impact of COVID-19 lockdown on NO2, O3, PM2.5 and PM10 concentrations and assessing air quality changes in Baghdad, Iraq. Sci. Total Environ. 2021, 754, 141978. [Google Scholar] [CrossRef]
  10. Laughner, J.L.; Neu, J.L.; Schimel, D.; Wennberg, P.O.; Barsanti, K.; Bowman, K.W.; Chatterjee, A.; Croes, B.E.; Fitzmaurice, H.L.; Henze, D.K.; et al. Societal shifts due to COVID-19 reveal large-scale complexities and feedbacks between atmospheric chemistry and climate change. Proc. Natl. Acad. Sci. USA 2021, 118, 2109481118. [Google Scholar] [CrossRef]
  11. Krotkov, N.A. OMI/Aura NO2 Cloud-Screened Total and Tropospheric Column Daily L3 Global 0.25deg Lat/Lon Grid; NASA Goddard Space Flight Center: Greenbelt, MD, USA, 2013. [Google Scholar] [CrossRef]
  12. Breiman, L. Random forests. Mach. Learn. 2001, 45, 5–32. [Google Scholar] [CrossRef] [Green Version]
  13. Probst, P.; Wright, M.N.; Boulesteix, A. Hyperparameters and tuning strategies for random forest. WIREs Data Min. Knowl. Discov. 2019, 9, e1301. [Google Scholar] [CrossRef] [Green Version]
  14. Ding, J.; van der A, R.J.; Eskes, H.J.; Mijling, B.; Stavrakou, T.; van Geffen, J.H.G.M.; Veefkind, J.P. NOx Emissions Reduction and Rebound in China Due to the COVID-19 Crisis. Geophys. Res. Lett. 2020, 47, e2020GL089912. [Google Scholar] [CrossRef]
  15. Elminir, H.K. Dependence of urban air pollutants on meteorology. Sci. Total. Environ. 2005, 350, 225–237. [Google Scholar] [CrossRef] [PubMed]
  16. Kalbarczyk, R.; Kalbarczyk, E. Influence of meteorological conditions on the concentration of NO2 and NOx in northwest Poland in relation to wind direction. Ann. Wars. Univ. Life Sci.—SGGW. Land Reclam. 2007, 38, 81–94. [Google Scholar] [CrossRef]
  17. Abdul-Wahab, S.; Chan, K.; Ahmadi, L.; Elkamel, A. Impact of geophysical and meteorological conditions on the dispersion of NO2 in Canada. Air Qual. Atmos. Health 2013, 7, 113–129. [Google Scholar] [CrossRef]
  18. Nkundabose, J.P. Establishing Relationship between Meteorological Parameters and Criteria Air Pollutants Concentration in Delhi. Int. J. Sci. Res. Methodol. Hum. 2020, 15, 30–44. [Google Scholar]
  19. Ma, T.; Duan, F.; He, K.; Qin, Y.; Tong, D.; Geng, G.; Liu, X.; Li, H.; Yang, S.; Ye, S.; et al. Air pollution characteristics and their relationship with emissions and meteorology in the Yangtze River Delta region during 2014–2016. J. Environ. Sci. 2019, 83, 8–20. [Google Scholar] [CrossRef]
  20. van Zomeren, J.; van Delden, A. Vertically integrated moisture flux convergence as a predictor of thunderstorms. Atmos. Res. 2007, 83, 435–445. [Google Scholar] [CrossRef]
  21. Li, L.; Qian, J.; Ou, C.-Q.; Zhou, Y.-X.; Guo, C.; Guo, Y. Spatial and temporal analysis of Air Pollution Index and its timescale-dependent relationship with meteorological factors in Guangzhou, China, 2001–2011. Environ. Pollut. 2014, 190, 75–81. [Google Scholar] [CrossRef]
  22. Zhang, H.; Wang, Y.; Hu, J.; Ying, Q.; Hu, X.-M. Relationships between meteorological parameters and criteria air pollutants in three megacities in China. Environ. Res. 2015, 140, 242–254. [Google Scholar] [CrossRef] [PubMed]
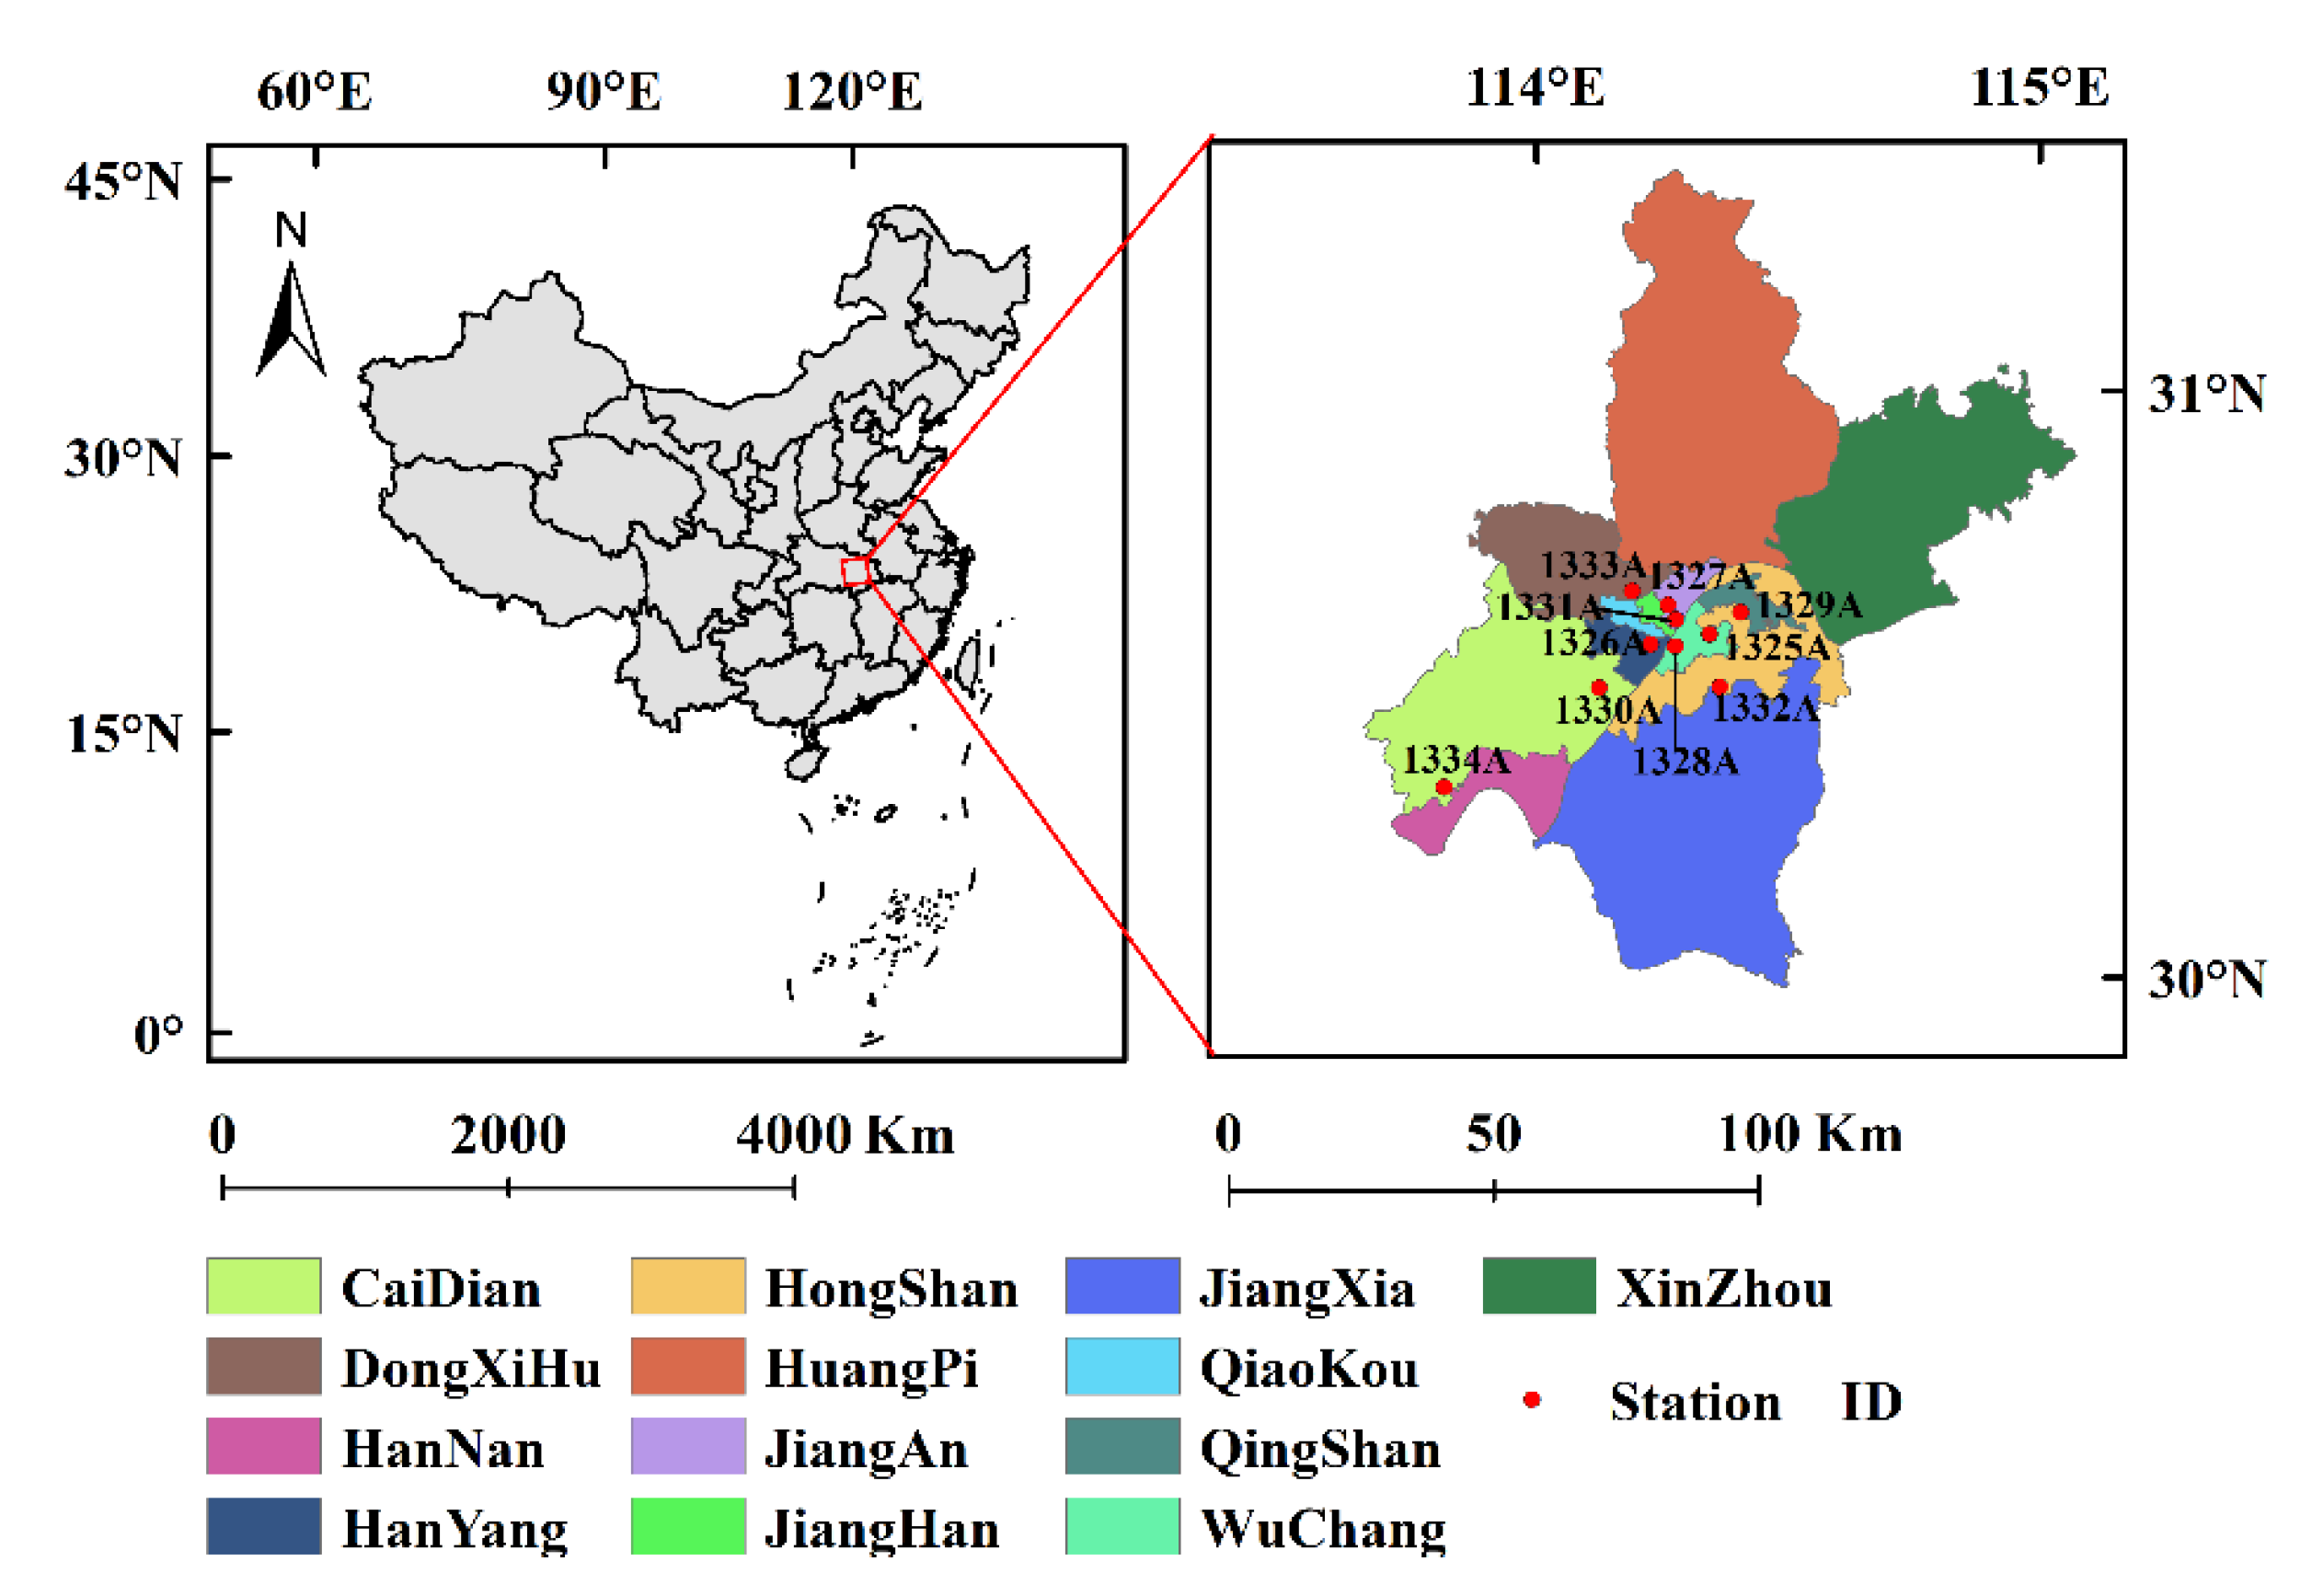
Figure 1. Brief description of the area of interest and distribution of the air quality monitoring points.
Sustainability 14 16720 g001
Figure 2. Meteorological conditions during the closure control period: (A) tropospheric temperature (k); (B) ground temperature (°C); (C) dew point temperature; (D) LI (°C); (E) PWV (kg/m2); (F) atmospheric pressure (hPa); (G) RH (%); (H) ground RH(%); (I) sea-level pressure (hPa); (J) wind velocity (m/s).
Sustainability 14 16720 g002
Figure 3. Scatter diagrams for model accuracy verification: (A) comparison of the RF prediction result and the actual value in 2019; (B) comparison of the simulation value of NO2 concentration distribution using meteorological factors and the actual value in 2020; (C) comparison of the simulation value of ground NO2 concentration using meteorological factors and the actual value in 2020; (D) comparison of the simulation value of the tropospheric NO2 concentration corresponding to the meteorological factors and the actual value in 2020.
Sustainability 14 16720 g003
Figure 4. Distribution of the annual mean tropospheric NO2 concentration determined by Ozone Monitoring Instrument during 2012~2020.
Sustainability 14 16720 g004
Figure 5. Daily mean change line chart of TROP OMI NO2.
Sustainability 14 16720 g005
Figure 6. Comparison of the value predicted by RF during lockdown and the tropospheric NO2 concentration determined by Ozone Monitoring Instrument during the same period in 2019.
Sustainability 14 16720 g006
Table 1. NO2 concentrations during lockdown in 2020, during the same period in 2019, and 100 days before lockdown (unit: µg/m3).
1325 A1326 A1327 A1328 A1329 A1330 A1331 A1333 A1334 A
2019mean35.6650.9648.3554.7748.3142.9952.3449.2324.64
Std11.0126.3223.7130.1323.6718.3527.6924.5911.46
Beforemean45.8759.1358.4260.4456.8556.752.354.930.79
Std15.0828.3427.6329.6526.0625.9221.5124.1114.97
2020mean19.3419.9426.1724.5924.8124.1824.0219.8810.74
Std8.69.1915.4213.8514.0613.4313.289.145.87
Aftermean23.64 32.82 29.03 34.99 35.90 37.11 43.95 27.21 14.35
Std8.98 12.30 9.85 12.13 13.37 12.99 17.17 11.70 7.15
Publisher’s Note: MDPI stays neutral with regard to jurisdictional claims in published maps and institutional affiliations.