Article

Mobility Patterns of Scholar Communities in Southwestern European Countries

1
Centro de Ciências e Tecnologias Nucleares (C2TN), Instituto Superior Técnico, Universidade de Lisboa, 2695-066 Bobadela, Portugal
2
Faculdade de Engenharia, Universidade Lusófona de Humanidades e Tecnologias de Lisboa, 1749-024 Lisboa, Portugal
3
CESAM—Centre for Environmental and Marine Studies, Department of Environment and Planning, University of Aveiro, 3810-193 Aveiro, Portugal
4
H&TRC—Centro de Investigação em Saúde e Tecnologia, ESTeSL—Escola Superior de Tecnologia da Saúde, Instituto Politécnico de Lisboa, 1990-096 Lisboa, Portugal
5
Parque de Ciência E Tecnologia da Universidade do Porto, 4200-135 Porto, Portugal
6
Energy Engineering Department, Universidad de Sevilla, 41004 Sevilla, Spain
7
Engineering Science Department, University of Oxford, Oxford OX1 3PJ, UK
8
Centro de Investigaciones Energéticas, Medioambientales y Tecnológicas (CIEMAT), 28040 Madrid, Spain
9
Research and Development Officer, University of Gibraltar, Gibraltar GX11 1AA, Gibraltar
10
LaSIE, University of La Rochelle, 17000 La Rochelle, France
11
Associação Bandeira Azul da Europa (ABAE), 1350-355 Lisboa, Portugal
*
Author to whom correspondence should be addressed.
Sustainability 2022, 14(24), 16704; https://doi.org/10.3390/su142416704
Submission received: 26 October 2022 / Revised: 2 December 2022 / Accepted: 6 December 2022 / Published: 13 December 2022

Abstract

:
The present study aimed to provide an in-depth assessment of the commuting patterns of scholar communities of southwestern European countries and to identify measures to improve their sustainable performance regarding mobility. The adopted methodology characterised the mobility pattern of students as a sustainability indicator and the availability of related infrastructures and local public transport network. Data were gathered by qualitative (behavioural questionnaires) and quantitative (technical audits) approaches, based on measurable indicators (key performance indicators and scores (ranging between 0–5)). Overall, French schools showed the best sustainable performance regarding mobility (2.0) and Gibraltar had the lowest (1.2). The existence of bike parking and electric car charging points were the main weaknesses founds (with their related mean scores being 0.6 and 0.2, respectively). The score associated with annual CO2 emissions due to students’ mobility had the best performance, where all countries managed to obtain an average of 3.1. The global score, which assessed the sustainable performance of scholar communities regarding mobility, had a mean value of 1.5 for all studied countries, which highlights the potential for improvement of the studied schools, mainly targeting the public transport network optimisation and the enhancement of scholar infrastructures concerning bicycle parking and electric cars.

1. Introduction

Commuting plays an important role in our daily lives and it may impact several aspects of it, not only personally (from wellbeing to travel times and costs, safety, and health) [1] but also globally (from energy consumption to greenhouse gas emissions and environmental degradation) [2].
Moreover, urban air pollution is known to be an emergent environmental problem with an impact on our health [3], and scientific evidence has shown that the increase in urban traffic is the main contributor to the degradation of local air quality, where cars play a primary role as a source of pollutants in on-road and roadside environments [4].
Different modes can be used for commuting, such as by using soft mobility strategies (like walking and cycling), public transport, and by private car. Several factors can condition an individual’s personal choice for commuting. For instance, the topography and the level of physical effort required can influence the choice of a specific activity mode [5].
The time spent commuting is also known to contribute significantly to the total daily dose of pollutants inhaled by inhabitants in urban areas [6,7]. For instance, it was found that commuting travel contributed to 17% of the average daily dose of carbon monoxide (CO) [8] and to 12% of black carbon (BC) [9]. Some studies have shown that citizens that choose soft mobility solutions are less exposed than those that travel in motorised vehicles [10,11] but, depending on the location of the bicycle pathways, the bicycle mode can promote higher inhaled doses of pollutants than other modes due to the combination of longer travel periods with enhanced physical activity (which promotes higher inhalation rates) [7].
Among the general population, the scholar community is of particular interest since students are more susceptible to adverse effects of air pollution due to their short stature, higher rate of respiration, and developing lungs [12].
Considering the technological advancements in the automobile industry, the increase in the access of the population to motorised transportation, along with socioeconomic variability and urban barriers (such as the distance from home to school or family decisions), a change in mobility behaviours in commuting to school has been observed [13]. It is known that the Active School Transport (AST), by walking or cycling, has been decreasing among the school community and, nowadays, students typically resort to motorised vehicles as a mode of transportation [14]. Several factors have been highlighted as being crucial to the complex process of decision-making regarding which transport mode to travel to school with, namely economic, environmental, geographical, and social factors [15]. For instance, the improvement of neighbourhood facilities (such as walking/cycling facilities and aesthetics) and its social environment (such as pedestrian/traffic safety along with crime rate), which varies accordingly with the neighbourhood income, has been found to be supportive of active transportation and of active recreation [16].
Studies also have highlighted the influence of the use of motorised transport for commuting on the health of citizens. A study involving 38 countries from six continents highlighted that the use of motorised transportation resulted in worse levels of overall physical activity, active transportation, and sedentary behaviours in the study population, which represented 60% of the world’s population [17] and highlighted a “physical inactivity crisis” [18]. Therefore, public health is compromised, with negative impacts on the physiological [19,20] and emotional [21] patterns of the citizens. On the other hand, motorised commuting travel is also known to have an effect on ecosystems, due to the increase in exhaust and greenhouse gas emissions [22].
Therefore, it is urgent to identify the best intervention strategies for promoting a change in commuting habits. Different interventions have been implemented towards a new approach to school transportation worldwide. In Kansas (USA), the Earn-A-Bike program increased the time spent on a bike by 68% [23]. In Canada, mentorship programs allowed the participants to cycle an additional 1.35 days per week to work and school [24]. In Sweden, gamification was used to integrate learning into a health promotion program, presenting it as a successful method for promoting AST and engaging teachers [25]. In California (USA), Safe Routes to School (SRTS) programs provided funding for infrastructure improvements that encouraged children to use active transportation [26].
At the European level, it is estimated that Europeans spend an average of almost 2 h per day on the move by car, on foot, on public transport, and/or on bicycle, where 65% of them use their car in travel to school or work [27]. Moreover, it was estimated that 58% of Europeans were dissatisfied with the fluidity of traffic during rush hour, and 61% considered investments in transport infrastructures insufficient [27]. Other factors were also considered to be of fundamental relevance to the Europeans, namely comfort and speed. Additionally, cost, congestion, availability, and connectivity were considered relevant factors to promote improvement in Europeans’ behaviour [28].
The present study aimed to understand the current state of the mobility behaviour of commuting of a scholar community, targeting children and young people of European schools from Portugal (PT), Spain (SP), France (FR), and Gibraltar (GI), and to identify the best strategies to improve their reality to mobility patterns more environmentally friendly, targeting AST. For this, key performance indicators and scores (that could translate the reality of the scholar communities regarding their mobility and associated schools’ infrastructures) were designed and used to compare schools and countries and to identify opportunities for improvement. This information is crucial to understand the potential change of individual behaviours to promote a low-carbon society. The present study was developed in the framework of a European project—Interreg SUDOE ClimACT (www.climact.net, accessed on 24 October 2022)—which targeted promoting the implementation of a low-carbon economy in schools.
This study is organised as follows: Section 2 explains the methodological framework and describes the used methodology, including the data collection and the assessment tools (key performance indicators and scores); Section 3 presents and discusses the quantitative results of the variability of transport mode choices and evaluates the performance of each school, based in above tools, which allowed performing a comparative analysis between schools and countries. Additionally, in Section 3 the results are also compared with data from the European general population regarding mobility patterns. Section 4 provides a set of considerations regarding the study and its results, including limitations. Finally, Section 5 provides the main conclusions of the study, including a set of measures to improve the mobility of the scholar community towards a more sustainable reality.

2. Methodology

2.1. Case Study—The ClimACT Framework

The implementation of a Low-Carbon Economy (LCE), by incorporation of complementary approaches such as energy efficiency, smart growth initiatives, transportation control measures, energy efficiency, product procurement, and resource conservation is conducive to important environmental, economic, and social benefits. It reduces private and external costs and contributes to the accomplishment, not only of energy-related targets but also of the 3rd priority objective defined by the 7th Environment Action Program—to safeguard the citizens of the European Union from environment-related pressures and risk to health and well-being.
The Interreg Sudoe ClimACT project [29,30] was created to act regarding current environmental challenges and to support the transition to an LCE of 39 pilot schools (Figure 1) from the southwestern European region (namely, Portugal—PT, Spain—SP, France—FR, and Gibraltar—GI), covering all educational levels (from elementary to university). Those 39 schools were the study sites of the present study. It is crucial for schools to reduce energy and environment-related expenditures, without affecting educational operations, by applying procurement and behavioural-related measures.
Overall, a total of 39 schools from the four countries participated in the present study. There were nine Portuguese schools: six were located in Lisbon’s district (five in the municipality of Loures and one in the municipality of Lisbon) and three in Oporto’s district (two in the municipality of Matosinhos and one in the municipality of Vila Nova de Gaia). Thirteen schools were located in Spain of which eight were in Seville, one in Málaga, two in Madrid, and two in Alcalá de Henares. The nine French schools were all located in La Rochelle. Similarly, eight schools in the United Kingdom were located in Gibraltar.
Table S1 (in the Supplementary Materials) provides an overview of the pilot schools’ characteristics, such as the location, number of students, total area (including the outdoor area, namely courtyards, gardens, and grass area), and education level (elementary-, basic-, middle-, high school, and university).
The schooling range was from elementary school to university: 15 elementary schools, 6 basic schools, 14 middle schools, 12 high schools, and 3 universities. The total number of students per country was: (1) Portugal—5620 students, (2) Spain—7980 students, (3) France—5151 students, and (4) Gibraltar—4102 students.

2.2. Study Methodology

The mobility in the scholar population and surroundings was evaluated in two phases: (1) a technical audit at schools’ facilities to assess physical conditions for transports onsite by using a standardised checklist; (2) an online questionnaire within the scholar population (students) focusing on mobility habits regarding commuting behaviour between home and school. Both used tools (the online behavioural questionnaire and the standardised checklist of the technical audit) are available in the Supplementary Materials (Subsections B and C, respectively).
The technical audit and the application of the online questionnaire were performed in the academic year 2016/2017. The technical audit was performed in each school by the project team of each country, with the collaboration of the school staff or the contact person of the project. The audits consisted of a field visit to the school to fill out a checklist about building infrastructure and facilities. The checklist included the verification of the availability of parking spaces for low-carbon transport modes—electric cars and bicycles—and to assess the public transport networks nearby the school. The technical audit was assessed for 32 schools (representing a participation rate of 82% of the schools), in which for the Gibraltar schools it was only possible to gather partial data for one school (S39).
Regarding the online questionnaire, the scholar community was invited to provide their preferences regarding the transport modes used for commuting, which allowed them to assess their associated CO2 emissions. The online questionnaire was mainly composed of multiple-choice questions. The participants had to indicate the frequency of their use of transport modes by choosing the options “never”, “sometimes”, “almost always”, and “always”. Other questions were short open answers or “yes/no”. For primary schools, the online questionnaire was answered with the support of teachers and parents. During the data acquisition and treatment process, the anonymity of the participants was guaranteed. A total of 5024 completed questionnaires were gathered, with the following distribution per country: Portugal (40.4%), Spain (29.4%), France (22.4%) and Gibraltar (7.8%). Specific information regarding the success rate per school of the questionnaires’ implementation is displayed in Table S1. The questionnaire was applied successfully in 34 schools (participation rate of 87% of the schools), where the schools S18, S32, S35, S38, and S39 did not participate in the questionnaire.
Overall, the complete methodology (both technical audit and questionnaire) was applied with success in 30 schools, which represents 77% of the participating schools. However, for Gibraltar, it was not possible to gather data from both technical audit and questionnaire but, to provide information for the country, KPIs and scores (defined below) were assessed, considering the partial data from each school. For further analysis of the results, it is important to highlight that the study sample of schools is not evenly distributed per country, regarding the number of schools, the number of students, or the educational levels of schools, which may influence the data and its interpretation.

2.3. Definition of Key Performance Indicators and Scores for Scholar Mobility

The overall ClimACT strategy was based on a multi-criteria assessment methodology divided into seven environmental areas: energy, water, wastes, green spaces, green procurement, indoor air quality, and transport (mobility). These areas were assessed by using key performance indicators (KPIs), developed by the technical project team, using data obtained through technical audits, behavioural questionnaires, and monitoring campaigns [29,30]. KPIs are useful tools to understand the schools’ performance and are useful for performing comparisons between schools. The present study focuses only on the mobility dimension, for which four different KPIs were assessed, and are described in Table 1. Step-by-step calculation of the different KPIs is fully described elsewhere [29].
A global score for the mobility performance of a specific school was defined based on four scores (that were calculated considering the different KPIs), which are described in Table 2. The global score ranges from 0 (worst performance) to 5 (best performance) and it allows us to compare all the studied schools. The scores (S1, S2, S3, and S4) were defined considering the expectation of improvement of the KPIs (less and more favourable scenarios) and, similarly to the global score, ranged from 0 to 5.

3. Results and Discussion

3.1. Transport Mode Use

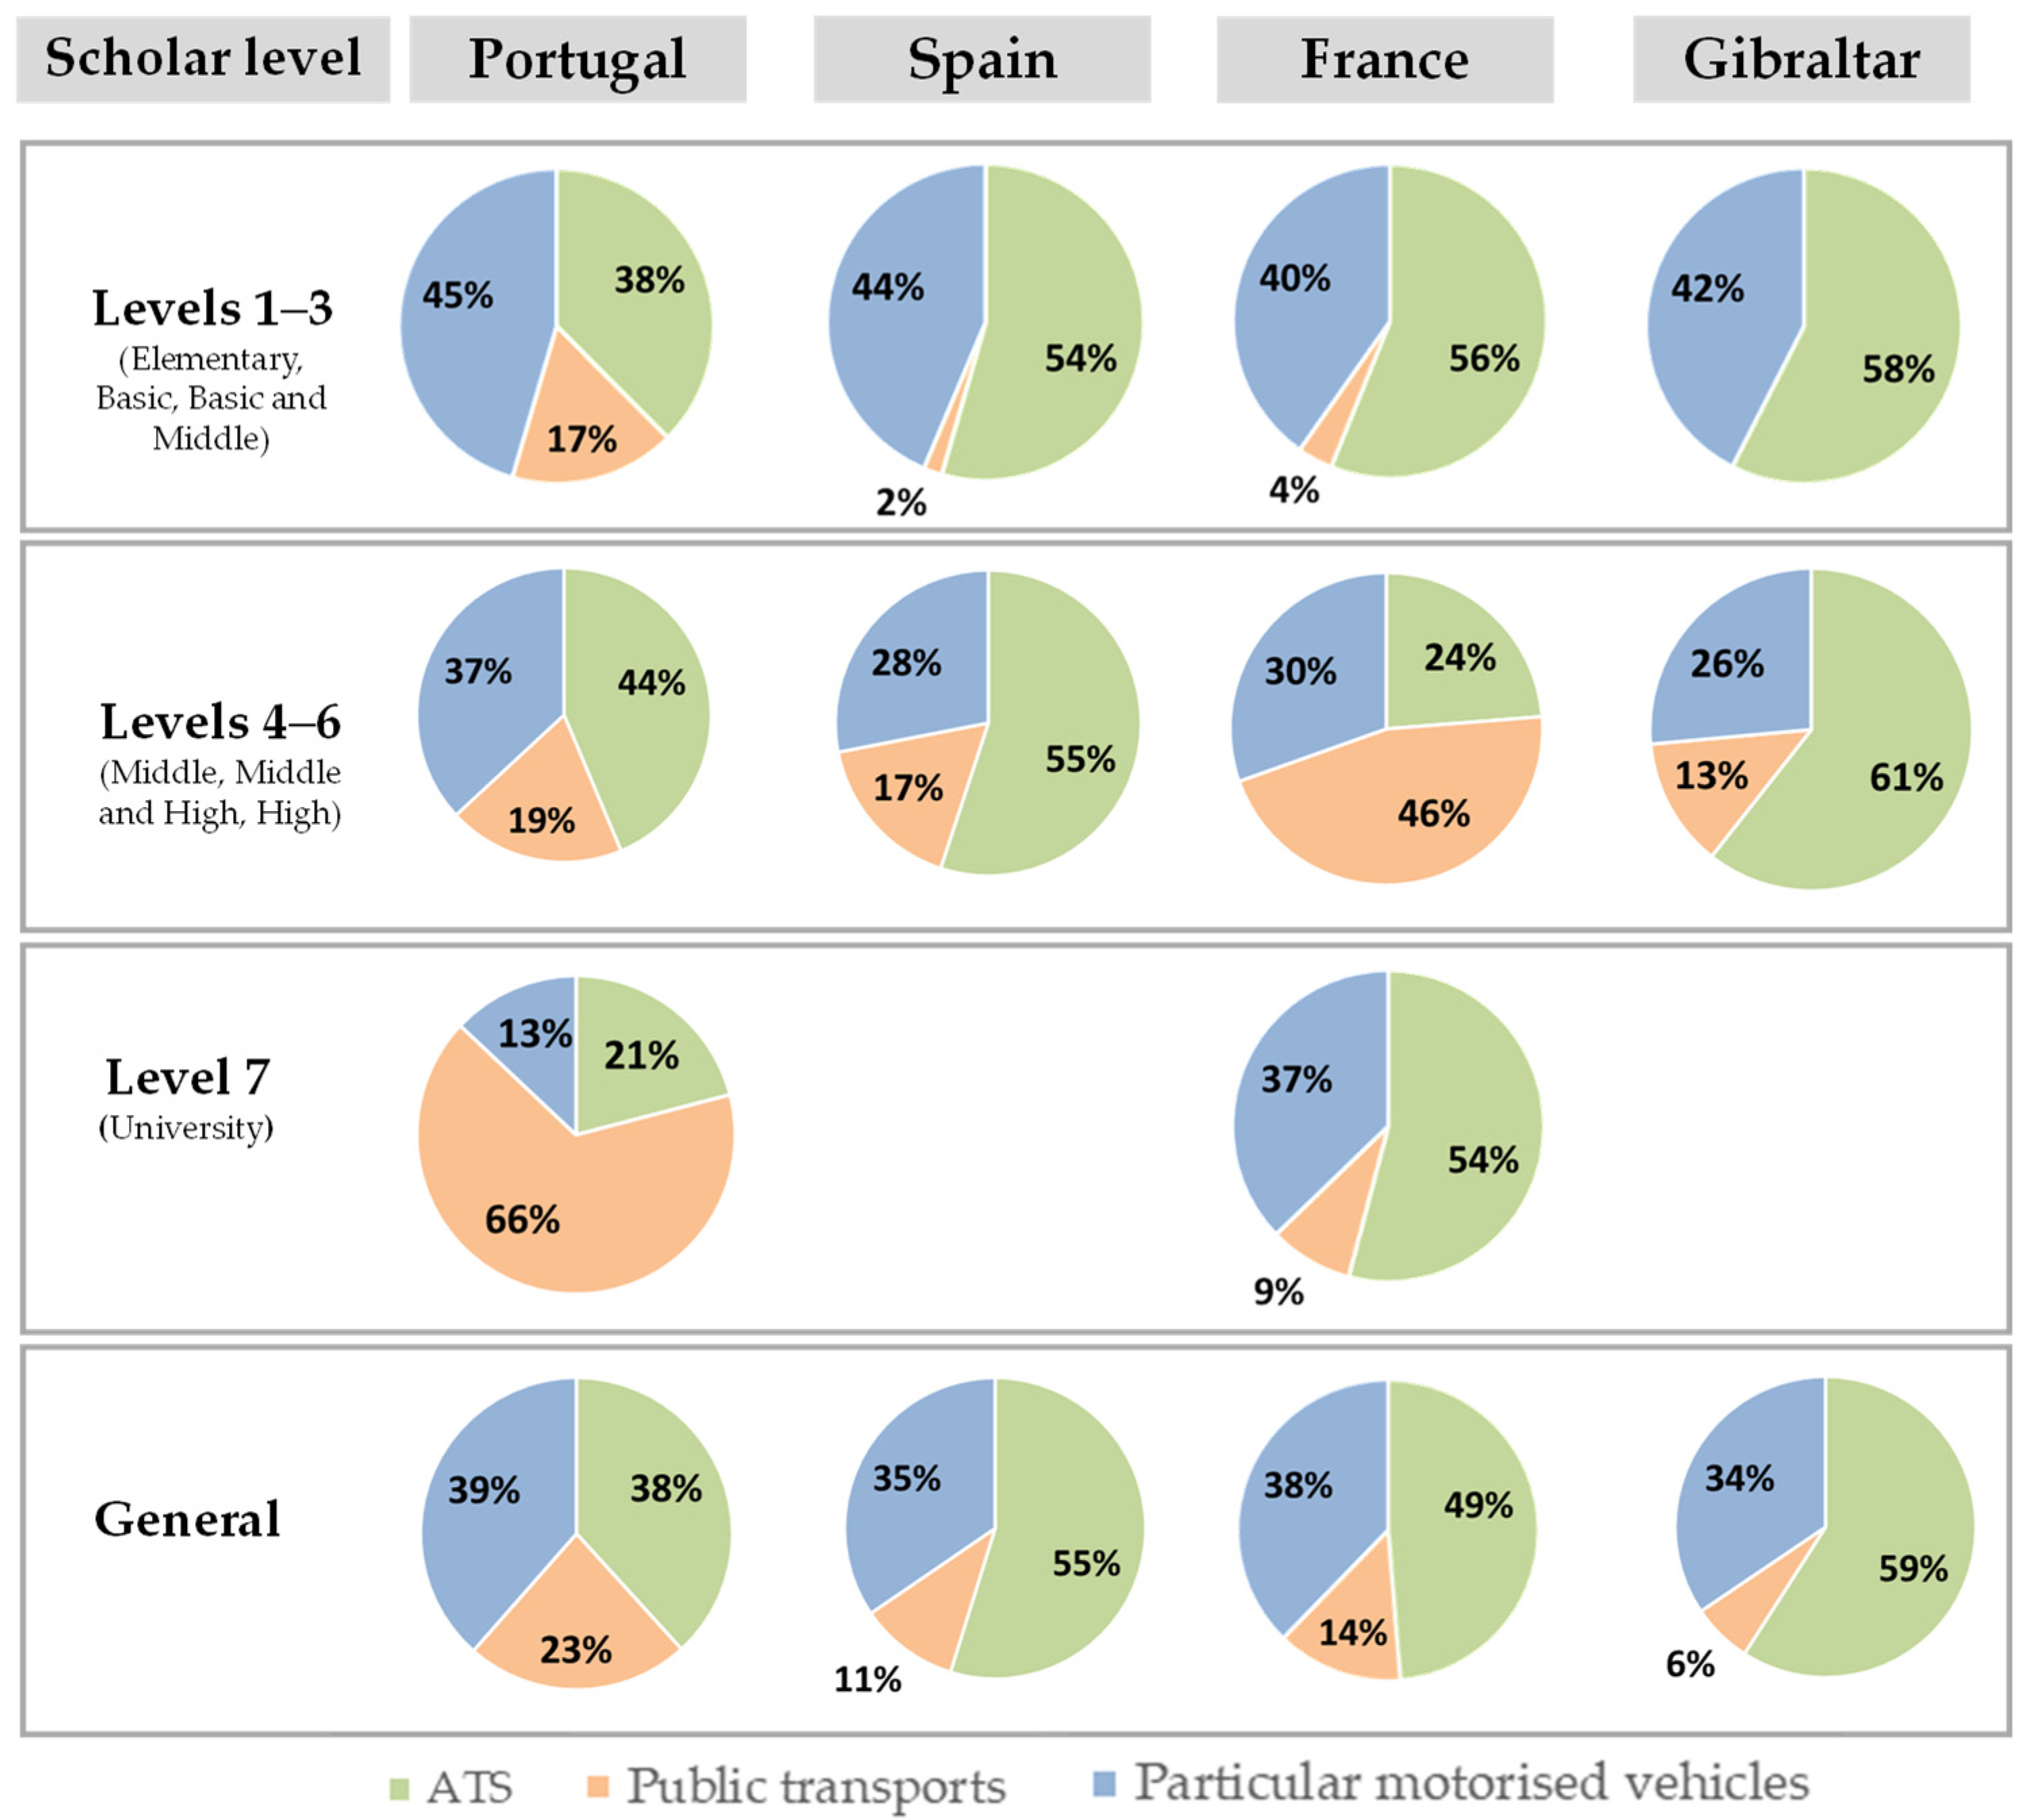
3.1.1. By Education Level
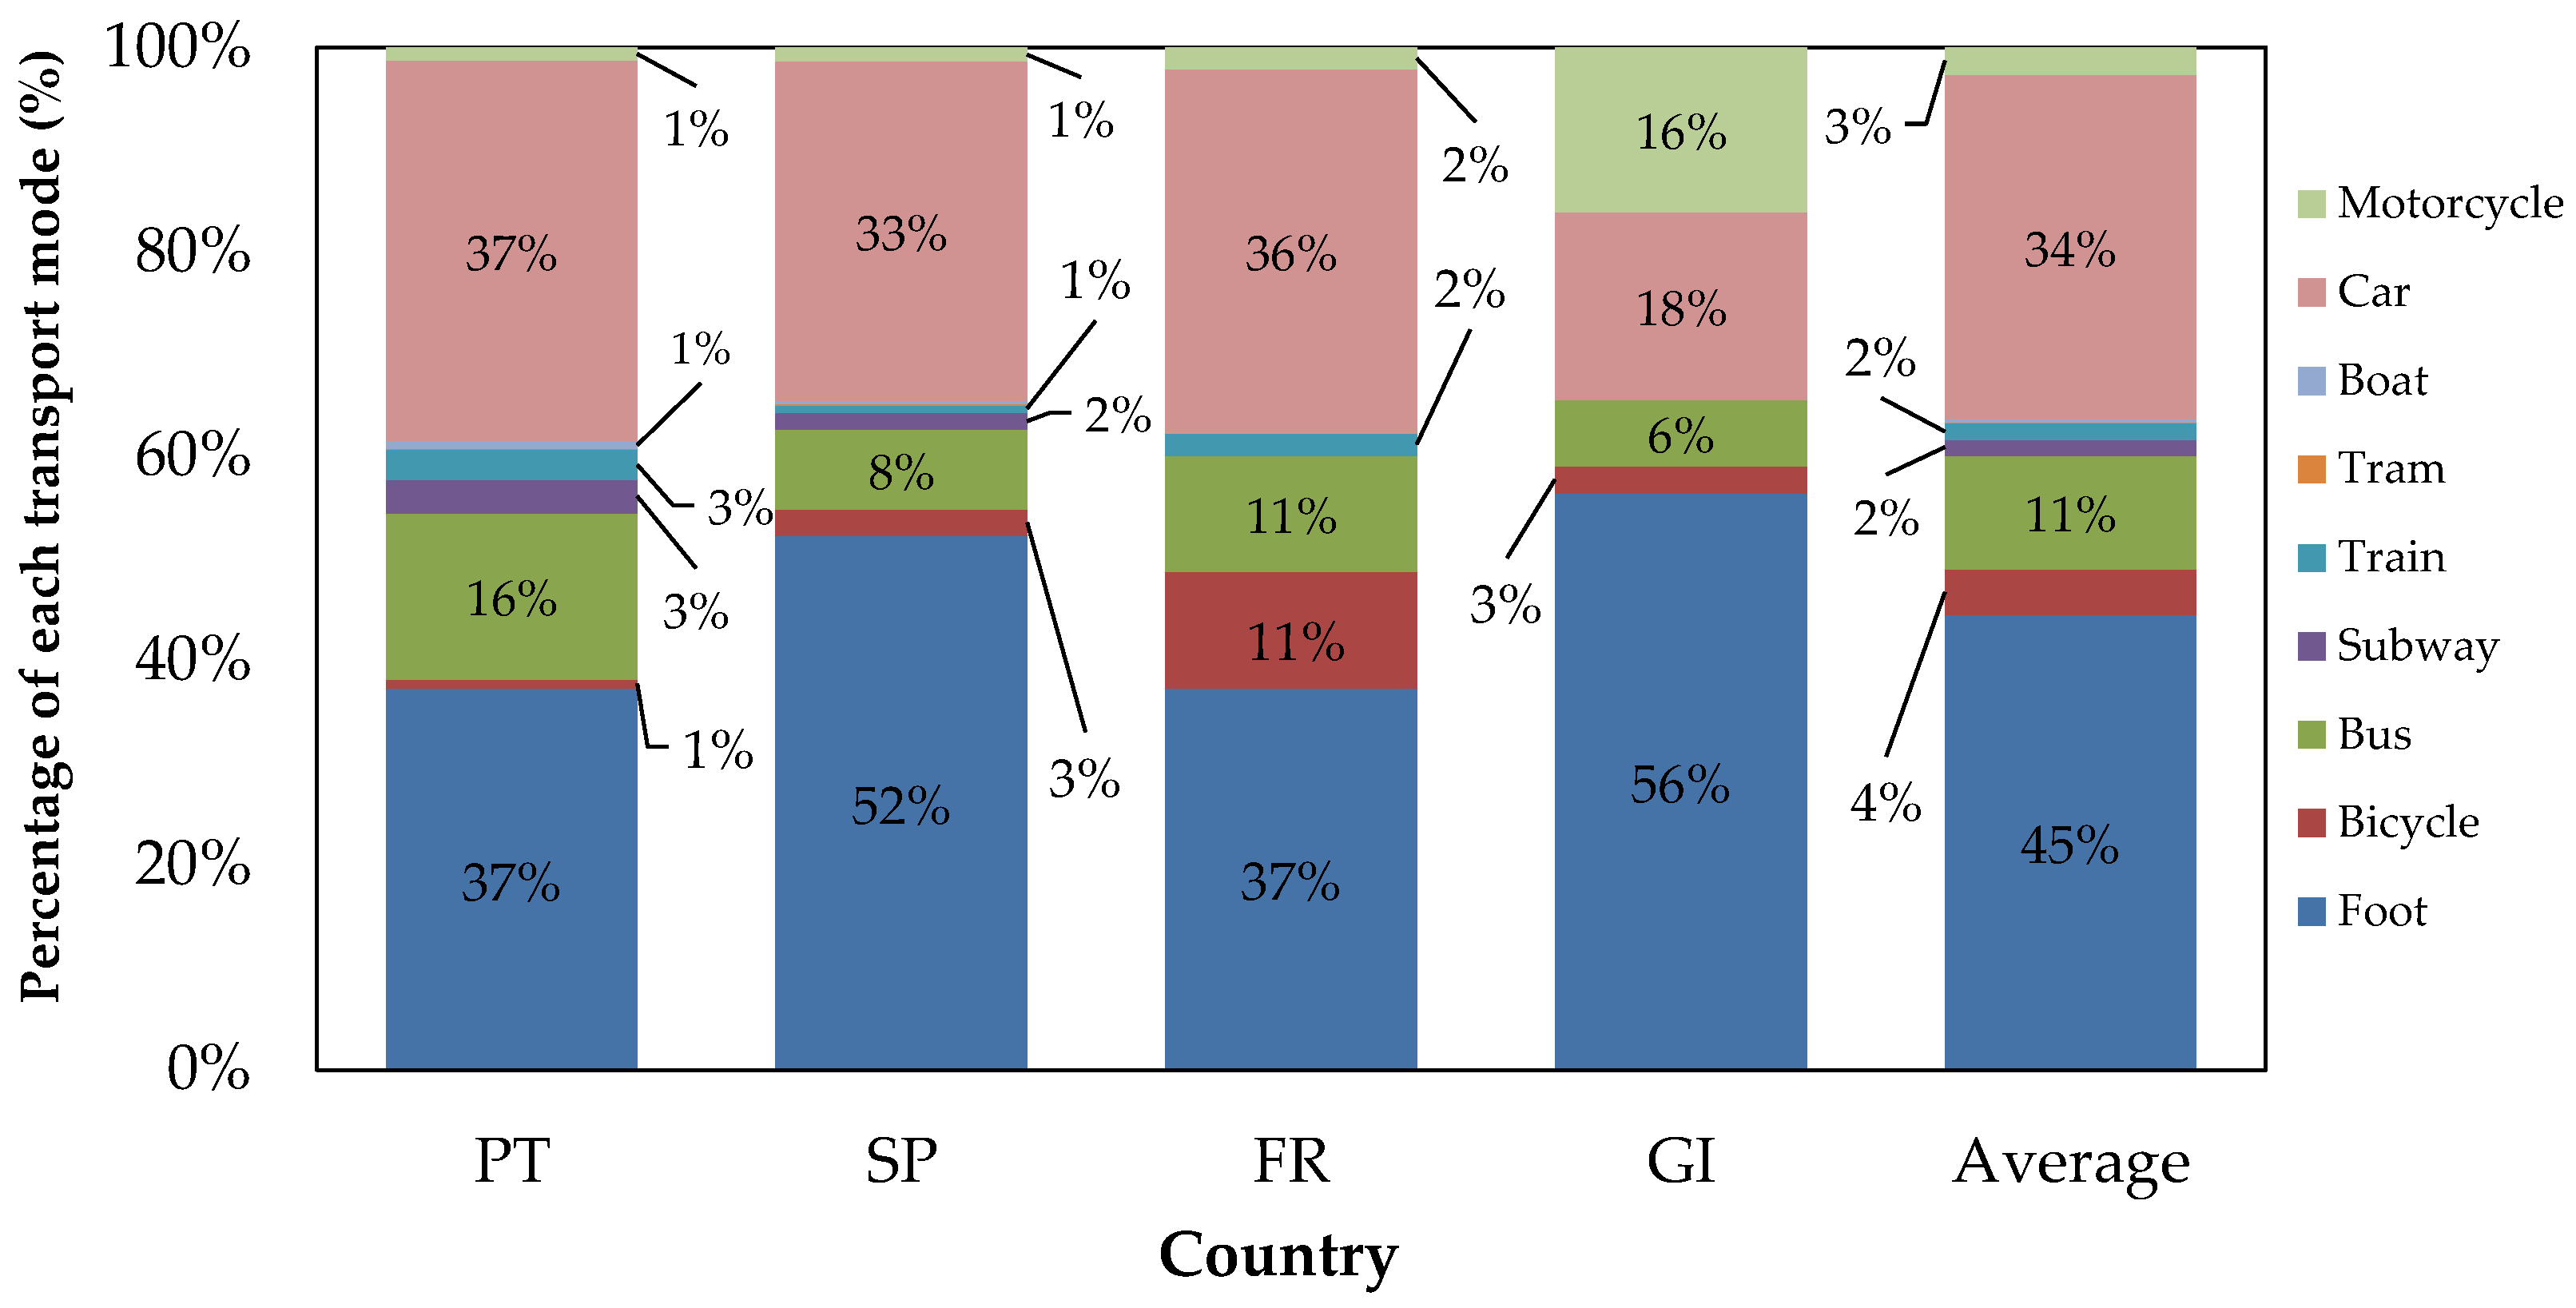
Figure 2 presents the transport modes used in commuting (home to school) accordingly to the different educational levels in the four studied countries.
Considering that the scholar level may have a great influence on the choice of transport modes, the results will be shown firstly by scholar level.
The top three preferences of students from elementary schools in Portugal included commuting by car (with an average of 51% and a maximum of 72% found in S8), by foot (with an average of 31% and a maximum of 40% found in S2), and, finally, by bus (with an average of 15% with a maximum of 24% in S2).
In elementary schools from Spain, the scenario was more favourable for travelling by foot in the five studied schools (S10, S11, S12, S13, and S20), with an overall average of 53%. The second preference for mobility was the use of the car (with 42%), where it stands out in S10 with 60% of car use. Other transport choices were used with a similar frequency (average of 1% of adherence). A study conducted in ten cities in Spain regarding the mode of commuting to school used by preschool students showed similar results found in our study, where the main choice of commuting was “walking with my child” (with 48%), followed by commuting by car (41%) [31]. Another study assessed a percentage of 68% of the students of primary schools that used active commuting to school in Huesca (Spain) [32], which was higher than the value of 55% found in the present study (which accounts 2% for the use of bicycle).
In France, the preferences were different, with the use of bicycles for daily commuting being more frequent. However, walking still remained the most used transport mode in France (with an average of 45% and a maximum of 60% found in S26), followed by the use of cars (with an average of 39% and a maximum of 44% found in S29), and, thirdly, by the use of the bicycle (FR elementary schools presented an average of 11%, with a maximum of 17% in S29). Gibraltar was where the scholar community of elementary schools showed more adherence to walking (with an average of 55%), followed by the use of motorcycles and cars (as passengers), with the same value (namely, an average of 23%).
These results may indicate the role that social parameters may have regarding the choice of transport mode of students, as already highlighted by several studies [33,34,35]. In elementary schools, the range of ages varies between 6 and 10 years old, which may be an influencing factor in parental decisions, due to the fear of external dangers, such as traffic safety and stranger danger [34]. Moreover, besides gender not being a point of analysis in this study, it is known that gender is a predictor for children’s independent mobility (IM), which increases when children grow older and, typically, boys have a higher IM when compared to girls [36].
The basic educational level is represented only by one Gibraltar school, where it is evident that the mobility of the students is by walking (56%), followed by the use of motorcycle (25%), and by car (15%).
Schools that have basic and middle joint levels (identified as level 2 in Figure 2) are located only in Portugal. Comparing their results with elementary Portuguese schools, it is possible to identify an increase of around 10% regarding the choice of walking as their transport mode with the upgrade in educational level. This fact can be related to the age of the students, along with the distance from home to school. An exception is school S9, where 71% indicated travel by car as their main transport mode and only 12% by walking.
When evaluating all the studied schools of all scholar levels, it is found that the transition of education level (namely from elementary to basic and middle levels) resulted in a slight decrease in the option “foot” (5%) and an increase of 12% on the use of the bus (16%). The age of the students and the access to a good transport network may be the factors for this improvement [37,38].
Only one middle school that participated in our study was from Gibraltar. This can be considered a limitation regarding the general comparison with other countries, due to the specific and unique characteristics of Gibraltar, such as its small area (approximately 6.8 km2).
Students from the middle level have shown a preference for walking (58%), followed by the use of car (18%) and bus (13%). The transition from the basic and middle schools to the middle schools showed an upgrade in students going to school by walking (+16%), in contrast with the decrease in the use of cars (−19%) and a slight decrease in the use of bus (−3%). A possible factor for this variability can be less dependence of the students on their mobility, previously associated with the accompaniment of an adult, moving more independently [32]. Comparing the behaviour between students from middle schools and from middle and high schools, a 9% increase in car use was observed. However, important changes are noticed when evaluating high schools. For instance, commuting by walking decreases by 6%, which may be due to a longer distance from home to school.
Overall, the mobility of students from the studied high schools (two from Portugal and two from France) was characterised, firstly, by the use of the car (31%), then by bus (29%), and, thirdly, by walking (28%). Students of Portuguese high schools did their commuting mainly by foot (43%), followed by car (36%), and, thirdly, by bus (18%). In French schools, the students mainly used bus (39%), followed by car (26%), and, thirdly, by foot (14%).
At the university level, some changes were identified, with a particular increase in the use of public transport as a main choice for the commuting (an overall value of 37%, the highest when comparing to lower educational levels). The second transport mode used was walking (29%), followed by car (24%). This fact may be due to the increase in the distance from home to university, the students being older and more independent, and a more efficient and accessible public transportation network being available.
For this educational level, only two universities were evaluated, one from Portugal and the other from France. In the Portuguese university, 66% of the students used public transport for their commute to school (mainly by train—25%, followed by subway—23%, and then by bus—16%). Walking was the commuting mode elected by 21% of the Portuguese students, followed by car, with 12%. French students presented a different reality, with active commuting representing 54% (37% by walking and 18% by bicycle), followed by the use of car (with 37%), and then by the use of public transport with only 9% (mainly bus—7%). The differences between countries may be due to the location of the schools within the city and available infrastructures and public transport networks. A study conducted in a university in the north of Portugal, where the two studied campuses were not located in the city centre (around 3 km from it), found that students mainly used the car (42%), followed by walking and the bus (both with 28%) to commute to the scholar facilities [39].

3.1.2. By Country

Figure 3 presents the variability of the preferences of transport modes in the scholar communities per country.
The preferred mode of commuting is walking, with a general average of 45%, where GI and SP have major averages of 56% and 52%, respectively. The use of the car is the second preferable transport mode (average 34%), followed by the bus (11%), the bicycle (4%), the motorcycle (3%), the train (2%), and the subway (2%). In Portugal, Spain, and France, travel by foot, car, or bus are the top three preferences. In Gibraltar, a higher preference for walking and less use of cars and buses is visible. It is unique in that it has a higher preference for the use of motorcycles (16%).
It is important to highlight that the use of bicycles has a higher percentage in France (11%) than the other countries. This reflects the French urban municipal plans that strengthened local infrastructures, such as bicycle paths, as can be shown by KPIT1, described in the next section, which evaluates the available parking spaces for bicycles per student. Portugal was the country where the use of bicycles was lower (with a percentage of adherence of 1%). As stated before, the use of bicycles as an active transport mode is dependent on geographic and socioeconomic patterns [13]. Tough routes in terms of topography, with different altitudes, may make this choice unfeasible for users. Socioeconomic factors can also condition a choice, where families with lower socioeconomic levels, which is a reality of some of these schools, do not have access to bicycles. In some countries, such as Portugal, learning to ride a bike was not part of the educational curriculum, though nowadays gradually being included. Furthermore, an important aspect of this issue is the availability of the local infrastructures—bicycle paths, which are unevenly distributed across the countries under study.
Figure 4 shows the preference of the students of different scholar levels, per country, distributed per categories of ATS, public transportation, and private motorised vehicles. In a general scenario, besides the variability of the choices analysed previously, the studied community from the four countries mainly use Active School Transports (AST)—walking or bicycle—with an average of 49%, representing 13% more than the use of private transport—car and motorcycle (which accounted for 36%). The use of public transport (bus, subway, train, tram, boat) had the lowest percentage, with an average of 14%. A study conducted in Slovenia (targeting a specific scholar community, namely students with ages between 12 and 15 years old, and attending grades 6, 7, 8, and 9) found a slightly lower percentage of students reporting active commuting modes to and from school, namely, 43% [40].
These results highlight the importance of performing studies for mobility pattern characterisation to identify possible justifying factors that contribute to the development and implementation of interventions to promote scholar community mobility by choosing, whenever possible, ATS or public transport. Concerning this matter, special attention should be given to the variables that influence the independent mobility of children, namely their socioeconomic background and their parents’ educational level, as shown by several studies [34,41].

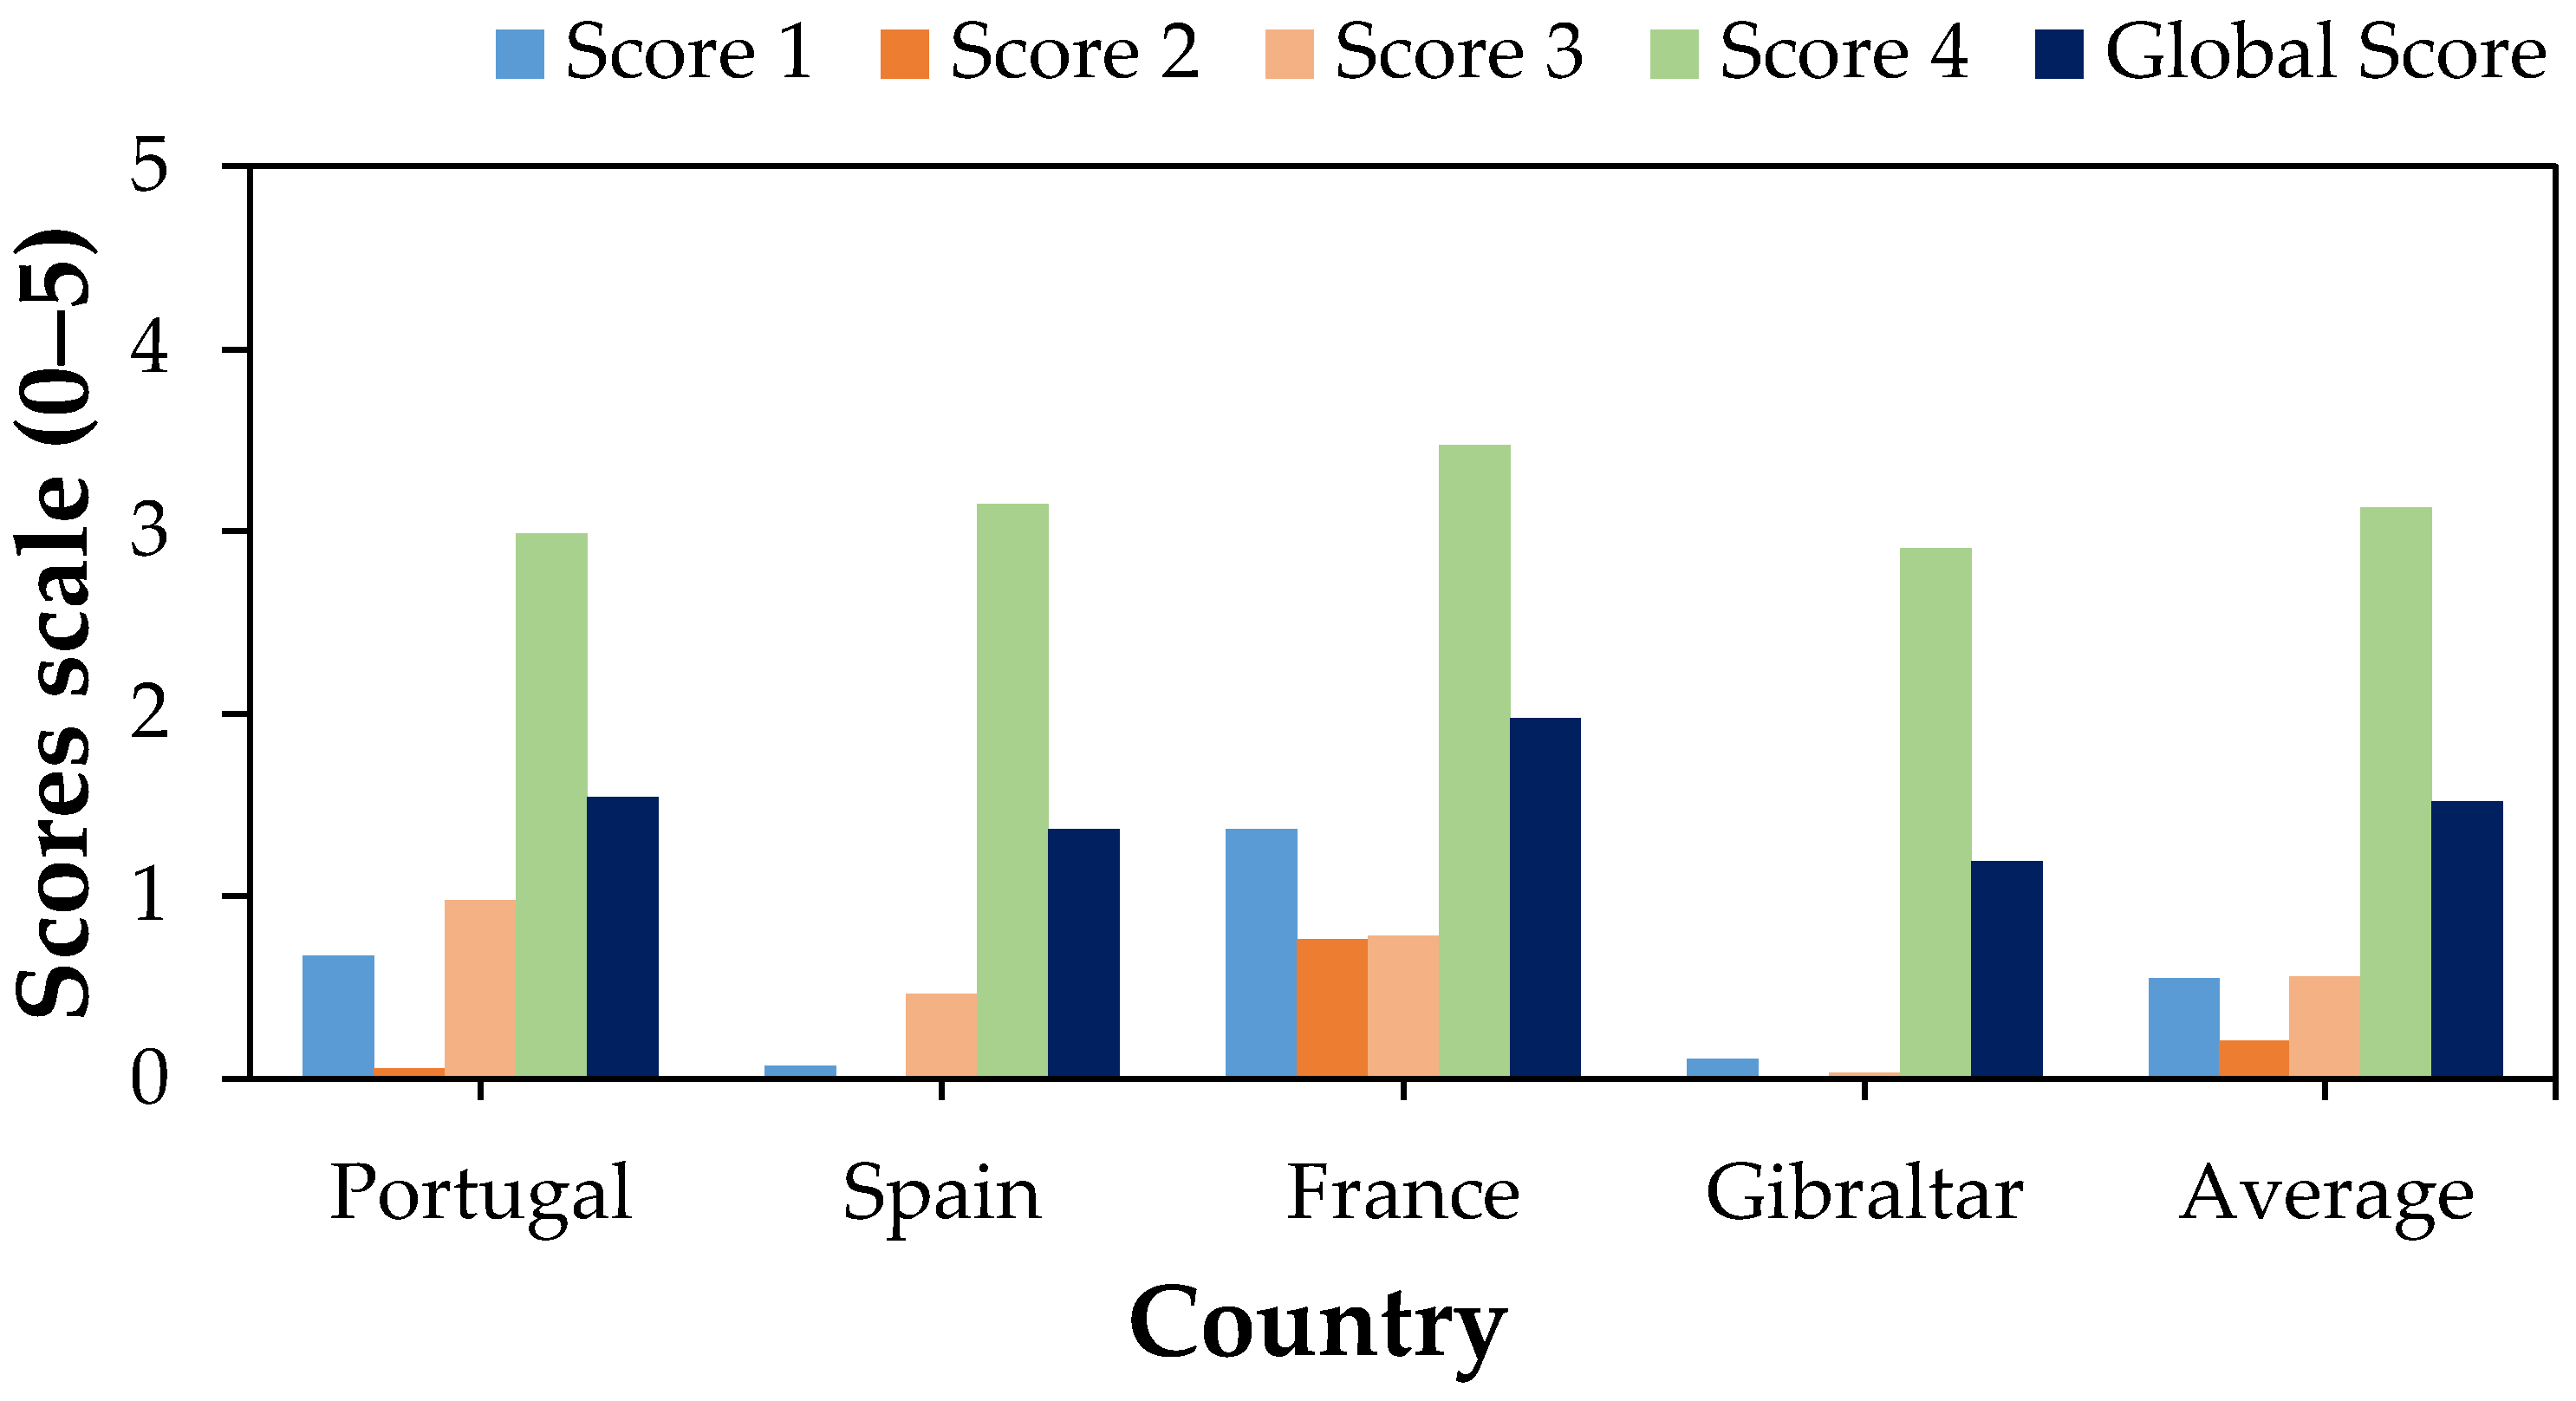
3.2. Key Performance Indicators

Table 3 presents the mobility KPIs for each country and their average values. When comparing the different KPIs between them, KPIT1 (parking spaces for bicycles per student—up to a 100 m radius) and KPIT2 (parking spaces for electric cars per school—up to a 100 m radius) showed the lowest results. This fact highlights that schools do not have infrastructures that favour soft and sustainable mobility, namely bicycle parks (KPIT1) and electric car charging stations (KPIT2).
Analysing each KPI individually, KPIT1 presented a mean level near zero, considering all the countries. This number reflects a common fragility of all the studied countries, namely the absence of facilities that favour the use of bicycles in commuting. A slight variability between countries is found; however, all of them present KPI values below 0.06. As expected, as shown in the previous section, France was the country with the best results, with four schools equipped with bicycle parking spaces, where S25 stands out with 248 spaces, followed by S23 and S24 with 248 and 50 spaces, respectively. Portugal is the country with second-best results, with three schools with parking spaces, where two of them have more than 30 parking spaces (S7 and S9). Spain has seven schools where the number of parking spaces varies between 1–8 spaces, and Gibraltar, with only one analysed school, has 6 spaces.
KPIT2 also showed bad results, with an average of approximately zero, similar to KPIT1. In two countries, Spain and Gibraltar, none of the schools had parking spaces for electric cars. In Portugal, only one school had two parking spaces (S6), a much lower number when compared to France, where two schools had such infrastructure, S25 standing out with 13 parking spaces. The existence of adequate infrastructure at schools is the main step to encouraging people to change their habits in commuting. It is important to highlight that regional income levels influence electric vehicle density [42,43], with income, level of education, and the number of charging stations per capita also being shown to influence citizen engagement regarding the adoption of electric vehicles [44].
The public transport network was assessed by KPIT3 (public transport passing daily per hour in the 1000 m radius of the school). Very low performance of public transport circulation nearby schools was found, with an average value of 14 (ranging from 1 in Gibraltar to 25 in Portugal). Portuguese schools are shown to have higher accessibility to public transport than other countries, with an average of 25 public transport modes passing daily per hour (within up to a 1000 m radius of the school). France and Spain followed Portugal with mean KPIT3 of 20 and 12 public transport modes passing daily per hour, respectively. Gibraltar has a KPIT3 of 1, calculated based on the unique school (S39) that performed the technical audit.
KPIT4, which represents the annual CO2 emissions per student (KgCO2 eq/student), is of high importance since it provides information regarding the carbon footprint impact that the mobility pattern of each studied school has. The overall KPIT4 mean (among the four studied countries) was 104 KgCO2 eq/student, with Gibraltar presenting the best performance with the lowest annual CO2 emissions per student (25 KgCO2 eq/student). Portugal presented the worst performance with a mean KPIT4 value of 192 KgCO2 eq/student, ranging from 52 KgCO2 eq/student (school S1) to 469 KgCO2 eq/student (school S6), the highest value found among all the studied schools. School S6 is a university, which may explain the worst performance regarding KPIT4 since, typically, the students do not live nearby (often outside the city itself), which raises the need to use more than one transport mode, and sustainable options may be scarce or reduced.
Spain, despite having a slightly higher KPIT4 average (104 KgCO2 eq/student) than France (96 KgCO2 eq/student), only has a school (S17) exceeding the 200 KgCO2 eq/student. Considering all the studied French schools, the schools S25 (303 KgCO2 eq/student), S24 (290 KgCO2 eq/student), and S23 (190 KgCO2 eq/student) stand out with the higher emissions of CO2 per student. However, the rest of the French schools showed a low emission contribution in general, namely, below 18 KgCO2 eq/student.
In Gibraltar, the four schools with data available to analyse the KPIT4 show a variability between 18–56 KgCO2 eq/student, with an average of 25 KgCO2 eq/student. These results corroborate the findings of high adherence to commuting by walking (56%), along with lower adherence to the use of cars (18%), when compared to other countries.
Figure 5 provides the evaluation of the mean mobility scores, including the global score, for each studied country (considering all of the 36 national schools involved in the study). As stated previously, the scores vary between 0–5, whereas 0 means the worst performance and 5 the best performance.
Score 1, related to parking places for bicycles and calculated based on KPIT1, presented a mean value of 0.6 for all the studied countries (ranging from 0.1 for Spain to 1.4 for France). Score 2, related to the availability of charging stations for electric cars and calculated based on KPIT2, presented a mean value of 0.2 for all countries (ranging from 0 for Spain and Gibraltar to 0.8 for France). Both scores highlight the low performance of the studied schools regarding the availability of infrastructure for soft and sustainable transport solutions. France had the highest levels for both Scores 1 and 2, followed by Portugal and then Gibraltar and Spain, which presented the lowest scores (below 0.2 for Score 1 and below 0.1 for Score 2).
Score 3, related to public transport and calculated based on KPIT3, presented a mean value of 0.6 for all the countries (ranging from 0.03 for Gibraltar to 0.98 for Portugal). The low values of Score 3 for all the countries highlight the low accessibility of the school community to public transport per hour in a radius of 1000 m. Score 4, which considers the annual CO2 emissions and is calculated based on KPIT4, had a mean value of 3.1 for all the countries (ranging from 2.9 for Gibraltar to 3.5 for France).
The global score, assessing the mobility performance of the studied schools, presented a mean value of 1.5 for all the countries (ranging from 1.2 for Gibraltar to 2.0 for France). The mobility performance of the countries, in descending order, is France (2.0), Portugal (1.5), Spain (1.4), and Gibraltar (1.2). Considering that the best performance is reflected by a score of 5, it can be highlighted that all countries have an opportunity to improve their performance, tackling the reasons that promote their global score (that reflected the assessed sub-scores and, consequently, KPIs).

3.3. Comparison of Mobility Behaviour with European Data

The study of the mobility of Europeans has been gaining prominence, essentially in the development of recent European policies and measures to achieve carbon neutrality. More sustainable cities are demanded, where the mobility sector is a key area of intervention. With this aim, the European Commission promoted several survey studies to understand the reality of the European citizens in the European Union (EU), such as the Eurobarometer about Urban Mobility and Transport that provided the outcomes of a European survey that was performed in 2019 [28].
The present study allowed us to provide an assessment of the commuting patterns of the scholar community in 36 schools in the southwestern European region. The results of the present study were compared with the results for the population of three studied countries (Gibraltar was not included) and the general European population, which were found by the European survey [28]. This survey reached approximately 28,000 interviews at the EU level, and approximately 1000 interviews in SP, PT, and FR each. Interviewed citizens answered nine questions divided into three main groups: (1) daily mobility, (2) long-distance mobility, and (3) sustainability. It is important to highlight that our study focused on the scholar community, whereas the European survey target the general population.
Regarding the main transport mode used in a typical day, cars gathered the highest mean percentage with the EU average being 62%. Considering the three countries of our study, France presented the highest percentage of 66% regarding the choice of car as the main transport mode in daily life, whereas Portugal presented a similar percentage to the EU average (62%) and Spain presented a lower percentage (59%).
Walking was the second most-preferred transport mode (with the EU average being 42%). The Spanish population presented the highest percentage (59%), followed by France (45%), and then by Portugal (35%), which was below the EU average. These results are slightly different from the ones found in the present study, which was expected since our study focused on the scholar community. In our study, walking was the main transport mode for Spain (51%) and France (40%), followed by car (33% for both Spain and France). For Portugal, walking and car gathered both a percentage of 37%. Either way, the trend between countries found in the European survey for walking (Spain: 59% > France: 45% > Portugal: 35%) is similar to the one found in the present study (Spain: 51% > France: 40% > Portugal: 37%), despite the study populations being different.
The third most used transport mode in the EU was public transport, with an EU average of 27%. Similar percentages between countries were found with Spain having 33% of the population using this transport mode, followed by Portugal (31), and then by France (27). Compared with our study, a lower percentage of the use of public transport was found, with Portugal having 23%, followed by France (14%) and then by Spain (11%). This may be explained since our study population is the scholar community that typically lives near their school, and does not require public transport for short distances (naturally, scholar level also has an influence on this factor since lower-level schools are located typically in the neighbourhood, whereas universities are located in central areas of the cities).
To improve mobility in Europe, it is crucial to understand the main reasons for the selection of the transport mode for daily commuting. In the EU survey, 16 reasons were given as choices, but only the options with more than 13% of answers were analysed. The answers are “comfort”, “speed, to reduce the time it takes to make the trip”, “there is no alternative”, “reliability”, “pleasure”, “price”, “privacy”, and “service”. For the general EU citizens, the three main reasons to choose the transport mode were “comfort” (42%), “speed, to reduce the time it takes to make the trip” (41%), and “there is no other alternative” (34%). These top three were followed by, in descending order of preference, “reliability” (27%), “pleasure” (22%), “price” (18%), “privacy” (16%), and “security” (13%). Portugal followed the EU trend of the top three with 48%, 26%, and 24%, respectively. Spain also had the same first three reasons as the EU average but with a different order of preference: firstly, “speed, to reduce the time it takes to make the trip” (43%), followed by “comfort” (40%), and, thirdly “there is no other alternative” (31%). Both countries have the following preferences of “pleasure” and “price”. The reasons of French citizens are slightly different, with the two main reasons being “speed, to reduce the time it takes to make the trip” (42%) and “there is no alternative” (41%), followed by “privacy” (28%), “comfort” (26%), and “pleasure” (24%). Results show that French, Spanish, and Portuguese citizens have a similar pattern regarding the factors that influence their choice of transport mode. However, for the Portuguese and the Spanish, the price came up in an earlier position in comparison with the French. This may reflect the inequalities of economic power at the European level.
Respondents were also asked how they were willing to change their habits and pay more in transport for the significant improvement of the environment. Concerning the question “Would you be ready to switch a significant part of your daily mobility to more environmentally friendly modes of transport?”, the majority of EU citizens agreed that “yes, probably” they are ready, with 38% of answers, and in SP and FR, with 42% and 31%, respectively. Not following this trend are the Portuguese who are not so empathetic with this issue: 41% answered “no, probably not”, and only 25% answered “yes, probably”.
The final question of the EU survey was regarding sustainability, namely “How much more would you be willing to pay for your daily personal transport cost, if this was significantly better for the environment?”. Similar to the question about the reasons for choosing the modes of transport, the results of this question allow us to highlight the importance of socioeconomic inequalities between EU member states and their economic power. Countries with less economic power do not feel comfortable or have no intention to invest more in their transport costs, even if they understand that the improvement and contribution could contribute to improving environmental conditions. The EU average was 19% for the answer “Yes, I’m willing to pay up to 5% more”, with only Portuguese citizens showing a lower percentage (12%), whereas Spanish and French citizens answered percentages above the EU average (22% and 23 %, respectively).
The EU survey provides insights into personal attitudes regarding the environment and mobility, which is important to understand the commuting pattern of the population and the factors affecting it. As a sum-up, the EU survey highlighted that to improve the mobility sector is of utmost importance to develop strategies, on micro and macro scales, focused on: (1) transport network to reduce commuting travel time, (2) improvement of the conditions of the transport to ensure the passenger’s comfort, and (3) creation of incentive policies to change travel habits considering the economic power of the local population.

4. Considerations

This study allowed us to identify the mobility patterns of the scholar community in four southern European countries, with discrimination of different scholar levels. Additionally, by using a set of key performance indicators targeting the mobility sector and designed for schools, it was possible to compare schools and countries considering their mobility performance. This allows us to identify which are the main measures that will contribute to the improvement of the mobility performance of each school and that will contribute to the decrease in the burden of carbon emissions associated with a scholar community, promoting a low-carbon economy in this type of environment.
Evaluating the global scores that provide an overview of the mobility sector that characterises a scholar community, it was found that efforts should be made to improve them (the best global score was 2 out of 5 for France). The strategy to increase these global scores is to improve sub-scores that are related mainly to the 3 KPIs, namely KPIT1, KPIT2 and KPIT3. Strategies to improve those KPIs include increasing parking places for bicycles at schools, along with increasing the availability of charging stations for electric cars and increasing the availability of public transport per hour in a radius of 1000 m of the schools.
However, some limitations of the study should be highlighted, namely the non-equal number of schools per educational level and per country, which can influence the overall results obtained. Moreover, all studied schools are from countries of the southwest European region and, despite having some similar characteristics, they differ in terms of socioeconomic parameters which can also influence the results [15]. Therefore, future research should study countries’ scholar communities with the same educational levels (sample composition) and it will be crucial to gather information regarding personal, social, and economic aspects to identify the predictors of mobility patterns of the different scholar communities through statistical models (such as utility maximisation models [45]).
Moreover, it will also be important to gather information regarding the perception of the students/parents regarding their current commuting choices, and also about which could be the changes that could be implemented for them to choose more active commuting modes or other new concepts of mobility. For instance, car sharing could be a potentially more sustainable solution that could be explored to improve the mobility of scholar communities [46]. By understanding the perspectives, perceptions, and opinions of the users, it will be easier for policymakers and transport service operators to maximise the level of cooperation with the users and their engagement with new mobility solutions [47].
This information would be relevant for policymakers and also local municipalities to define improvements regarding their infrastructures (walk and bicycle pathways, bicycle parking, and facilities for electric car use, from parking to charging stations) to maximise the change of behaviours of the scholar community toward active commuting or the use of public transportation, which will help to promote a low-carbon economy in scholar communities, at least, in what concerns the mobility sector.
Finally, it should be highlighted that the differences between the results of the Eurobarometer and the results of the present study allow us to understand that specific communities, such as the scholar community, may have different mobility patterns when compared to an average population. Therefore, when planning strategies to promote sustainable solutions for population mobility, it is important to consider the specific mobility patterns of the different sub-populations in order to obtain engagement and receptivity from the whole population.

5. Conclusions

The present study allowed us to understand the status of the studied scholar community, located in southwestern European countries (namely, Portugal, Spain, France, and Gibraltar (UK)), regarding their mobility patterns and factors that may influence them.
Accordingly, students commute preferably by active transportation (49%). Gibraltar is where this preference is highlighted with 59% of adherence, followed by Spain (55%), France (49%), and Portugal (38%). Besides, most of the students move by active transportation, and a considerable percentage of others go to school by private motorised transport (36%). This reality is almost evenly distributed, between 34%–39%, where Portugal is the country where this reality is higher (39%) and Gibraltar has the lowest results (34%). Public transport use represented 15% of the student choice, Gibraltar with the lowest use (6%), in contrast with Portugal, with 23%.
The average mobility score among the 36 pilot schools was 1.5, highlighting the opportunity to improve the mobility sector in the studied schools (since the maximum score, which reflects the best performance, is 5). The main weaknesses identified are the availability of charging spaces for electric cars and bicycle parking spaces. Besides knowing that electric vehicles are only used by teachers and school staff, with some exceptions for higher education institutions (overage students with driving licenses), the existence of these spaces can also encourage students towards more sustainable behaviours in the future. The availability of a poor public transport network nearby the schools (regarding the number of public transport modes passing per hour) reflected by Score 3 (0.6) is also a weakness that may influence the current mobility patterns of the students, being a barrier to their behavioural changes.
Key performance indicators highlighted the extreme importance of designing local policies and strategies to improve local infrastructures since they are considered an essential factor to enhance the behaviour of the school community towards more sustainable commuting modes. Consequently, this action will impact the carbon emissions associated with a school community and improve their environmental performance.
The present study contributed to understanding the mobility patterns of scholar communities which are different from the general population. Moreover, the use of key performance indicators and specific scores allowed us to compare different scholar communities and identify influencing factors to promote target measures to make mobility a driver for the transition to a low-carbon economy in scholar environments. The findings of this study contribute to the body of knowledge about the environmental impact of the educational sector’s mobility in the southwestern region of Europe based on individual choices and technical assessment, providing insights into how school management bodies and local governments can promote sustainability in commuting and school infrastructures.

Supplementary Materials

The following supporting information can be downloaded at: https://www.mdpi.com/article/10.3390/su142416704/s1, Table S1: Characteristics of the studied schools from Portugal, Spain, France, and Gibraltar; The Behavioural Questionnaire Applied to Scholar Community; The Checklist of the Technical Audit.

Author Contributions

Conceptualisation, J.L. (Joana Lage), R.C., J.L. (Jesus Lizana) and S.M.A.; methodology, J.L. (Joana Lage), N.C., V.M., R.C., J.L. (Jesus Lizana), P.B., A.R.G., M.G. and S.M.A.; formal analysis, J.L. (Joana Lage), and N.C.; investigation, J.L. (Joana Lage), A.d., V.M., J.L.A., K.G., R.C., J.L. (Jesus Lizana), Y.L., A.R.G., A.F., P.B., M.G. and S.M.A.; data curation, J.L. (Joana Lage), A.d., J.L. (Jesus Lizana), P.B., A.F., K.G. and A.R.G., writing—original draft preparation, J.L. (Joana Lage); writing—review and editing, J.L. (Joana Lage), and N.C.; visualisation, J.L. (Joana Lage); supervision, J.L. (Joana Lage) and S.M.A.; project administration, J.L. (Joana Lage) and S.M.A.; funding acquisition, R.C., P.B., N.C., Y.L., A.F. and S.M.A. All authors have read and agreed to the published version of the manuscript.

Funding

This research was funded by Interreg SUDOE funding programme of the European Regional Development Fund, through ClimACT Project (SOE1/P3/P0429). J. Lage acknowledges the support of the FCT—Fundação para a Ciência e Tecnologia, I.P. (Portugal) for the contract CEEC-IND/02366/2020 and N. Canha also acknowledges the support of FCT, through the contract 2021.00088.CEECIND. The FCT support is also gratefully acknowledged by C2TN/IST authors (UIDB/04349/2020 + UIDP/04349/2020) and by CESAM author (UIDB/50017/2020+UIDP/50017/2020). Authors also acknowledges the support of H2020 Project ECF4CLIM (Grant agreement ID: 101036505).

Institutional Review Board Statement

All representatives of schools gave their informed consent for inclusion before they participated in the study. Behavioural data of participants from the studied scholar communities were collected by using non-interventional methods (surveys, questionnaires, etc.) assuring anonymity. The study was conducted in accordance with the protocol of data collection and according to the Ethics Management Plan included in the Quality Management Plan of the (ET93.3.1) of the ClimACT Project (SOE1/P3/P0429).

Informed Consent Statement

Informed consent was obtained from representatives of schools involved in data collection and audits, and also from all subjects of the scholar community involved in the online surveys.

Data Availability Statement

The data that support the findings of this study are available upon request to the corresponding author.

Acknowledgments

Authors acknowledge all the educational institutions that were actively involved in the present research.

Conflicts of Interest

The authors declare no conflict of interest. The funders had no role in the design of the study; in the collection, analyses, or interpretation of data; in the writing of the manuscript, or in the decision to publish the results.

References

  1. Chatterjee, K.; Chng, S.; Clark, B.; Davis, A.; De Vos, J.; Ettema, D.; Handy, S.; Martin, A.; Reardon, L. Commuting and wellbeing: A critical overview of the literature with implications for policy and future research. Transp. Rev. 2020, 40, 5–34. [Google Scholar] [CrossRef]
  2. Bastos, J.; Marques, P.; Batterman, S.A.; Freire, F. Environmental impacts of commuting modes in Lisbon: A life-cycle assessment addressing particulate matter impacts on health. Int. J. Sustain. Transp. 2019, 13, 652–663. [Google Scholar] [CrossRef] [PubMed]
  3. Jin, L.; Apte, J.S.; Miller, S.L.; Tao, S.; Wang, S.; Jiang, G.; Li, X. Global endeavors to address the health effects of urban air pollution. Environ. Sci. Technol. 2022, 56, 6793–6798. [Google Scholar] [CrossRef] [PubMed]
  4. Reche, C.; Tobias, A.; Viana, M. Vehicular traffic in urban areas: Health burden and influence of sustainable urban planning and mobility. Atmosphere 2022, 13, 598. [Google Scholar] [CrossRef]
  5. Peyroux, C.E.; Bussen, L.S.; Costello, S.B.; Dirks, K.N. Traffic pollution while commuting—Does commute mode matter? Weather. Clim. 2015, 35, 2. [Google Scholar] [CrossRef]
  6. Martins, V.; Correia, C.; Cunha-Lopes, I.; Faria, T.; Diapouli, E.; Manousakas, M.I.; Eleftheriadis, K.; Almeida, S.M. Chemical characterisation of particulate matter in urban transport modes. J. Environ. Sci. 2021, 100, 51–61. [Google Scholar] [CrossRef]
  7. Correia, C.; Martins, V.; Cunha-Lopes, I.; Faria, T.; Diapouli, E.; Eleftheriadis, K.; Almeida, S.M.M. Particle exposure and inhaled dose while commuting in Lisbon. Environ. Pollut. 2020, 257, 113547. [Google Scholar] [CrossRef]
  8. Lim, S.; Salmond, J.A.; Dirks, K.N. Influence of differing microenvironments on personal carbon monoxide exposure in Auckland, New Zealand. Open Atmos. Sci. J. 2015, 9, 1–8. [Google Scholar] [CrossRef]
  9. Dons, E.; Int Panis, L.; Van Poppel, M.; Theunis, J.; Wets, G. Personal exposure to Black Carbon in transport microenvironments. Atmos. Environ. 2012, 55, 392–398. [Google Scholar] [CrossRef]
  10. Boogaard, H.; Borgman, F.; Kamminga, J.; Hoek, G. Exposure to ultrafine and fine particles and noise during cycling and driving in 11 Dutch cities. Atmos. Environ. 2009, 43, 4234–4242. [Google Scholar] [CrossRef]
  11. Grange, S.K.; Dirks, K.N.; Costello, S.B.; Salmond, J.A. Cycleways and footpaths: What separation is needed for equivalent air pollution dose between travel modes? Transp. Res. Part D Transp. Environ. 2014, 32, 111–119. [Google Scholar] [CrossRef]
  12. Keast, L.; Bramwell, L.; Maji, K.J.; Rankin, J.; Namdeo, A. Air quality outside schools in Newcastle upon Tyne, UK: An investigation into NO2 and PM concentrations and PM respiratory deposition. Atmosphere 2022, 13, 172. [Google Scholar] [CrossRef]
  13. Villa-González, E.; Barranco-Ruiz, Y.; Evenson, K.R.; Chillón, P. Systematic review of interventions for promoting active school transport. Prev. Med. 2018, 111, 115–134. [Google Scholar] [CrossRef] [PubMed]
  14. Haug, E.; Smith, O.R.F.; Bucksch, J.; Brindley, C.; Pavelka, J.; Hamrik, Z.; Inchley, J.; Roberts, C.; Mathisen, F.K.S.; Sigmundová, D. 12-year trends in active school transport across four european countries—Findings from the health behaviour in school-aged children (HBSC) study. Int. J. Environ. Res. Public Health 2021, 18, 2118. [Google Scholar] [CrossRef] [PubMed]
  15. Rojas Lopez, M.C.; Wong, Y.D. Children’s active trips to school: A review and analysis. Int. J. Urban Sustain. Dev. 2017, 9, 79–95. [Google Scholar] [CrossRef]
  16. Sallis, J.F.; Slymen, D.J.; Conway, T.L.; Frank, L.D.; Saelens, B.E.; Cain, K.; Chapman, J.E. Income disparities in perceived neighborhood built and social environment attributes. Health Place 2011, 17, 1274–1283. [Google Scholar] [CrossRef]
  17. Tremblay, M.S.; Barnes, J.D.; González, S.A.; Katzmarzyk, P.T.; Onywera, V.O.; Reilly, J.J.; Tomkinson, G.R. Global Matrix 2.0: Report card grades on the physical activity of children and youth comparing 38 countries. J. Phys. Act. Health 2016, 13, 343–366. [Google Scholar] [CrossRef] [Green Version]
  18. Larouche, R.; Saunders, T.J.; John Faulkner, G.E.; Colley, R.; Tremblay, M. Associations between active school transport and physical activity, body composition, and cardiovascular fitness: A systematic review of 68 studies. J. Phys. Act. Health 2014, 11, 206–227. [Google Scholar] [CrossRef]
  19. Ross, A.; Rodríguez, A.; Searle, M. Associations between the Physical, sociocultural, and safety environments and active transportation to school. Am. J. Health Educ. 2017, 48, 198–209. [Google Scholar] [CrossRef]
  20. Andersen, L.B.; Wedderkopp, N.; Kristensen, P.; Moller, N.C.; Froberg, K.; Cooper, A.R. Cycling to school and cardiovascular risk factors: A longitudinal study. J. Phys. Act. Health 2011, 8, 1025–1033. [Google Scholar] [CrossRef]
  21. Larouche, R.; Mammen, G.; Rowe, D.A.; Faulkner, G. Effectiveness of active school transport interventions: A systematic review and update. BMC Public Health 2018, 18, 206. [Google Scholar] [CrossRef] [PubMed] [Green Version]
  22. Brand, C.; Dons, E.; Anaya-Boig, E.; Avila-Palencia, I.; Clark, A.; de Nazelle, A.; Gascon, M.; Gaupp-Berghausen, M.; Gerike, R.; Götschi, T.; et al. The climate change mitigation effects of daily active travel in cities. Transp. Res. Part D Transp. Environ. 2021, 93, 102764. [Google Scholar] [CrossRef]
  23. Carlson, J.A.A.; Steel, C.; Bejarano, C.; Grimes, A.; Shook, R.P.P.; Reddy, A.; Green, M.; Morefield, T.; Steele, L.; Campbell, K.; et al. Impacts of an earn-a-bike cycling education program on children’s time spent cycling. J. Transp. Health 2020, 16, 100826. [Google Scholar] [CrossRef]
  24. Kearns, M.; Ledsham, T.; Savan, B.; Scott, J. Increasing cycling for transportation through mentorship programs. Transp. Res. Part A Policy Pract. 2019, 128, 34–45. [Google Scholar] [CrossRef]
  25. Rutberg, S.; Lindqvist, A.-K. Active school transportation is an investment in school health. Health. Behav. Policy Rev. 2018, 5, 88–97. [Google Scholar] [CrossRef]
  26. Brachman, M.L.L.; Church, R.L.L. Optimizing safe routes to school. Socioecon. Plann. Sci. 2019, 67, 26–33. [Google Scholar] [CrossRef]
  27. European Mobilities Observatory. The Expectations of Europeans in Terms of Mobility. Available online: https://www.ipsos.com/en/european-mobilities-observatory (accessed on 23 November 2022).
  28. European Commission. Special Eurobarometer 495: Mobility and Transport—Wave EB92.l-Kantar; Directorate-General for Communication: Brussels, Belgium, 2020.
  29. Lizana, J.; Manteigas, V.; Chacartegui, R.; Lage, J.; Becerra, J.A.; Blondeau, P.; Rato, R.; Silva, F.; Gamarra, A.R.; Herrera, I.; et al. A methodology to empower citizens towards a low-carbon economy. The potential of schools and sustainability indicators. J. Environ. Manag. 2021, 284, 112043. [Google Scholar] [CrossRef] [PubMed]
  30. Gamarra, A.R.; Lago, C.; Herrera-Orozco, I.; Lechón, Y.; Almeida, S.M.; Lage, J.; Silva, F. Low-Carbon economy in schools: Environmental footprint and associated externalities of five schools in Southwestern Europe. Energies 2021, 14, 6238. [Google Scholar] [CrossRef]
  31. Herrador-Colmenero, M.; Cadenas-Sanchez, C.; Labayen, I.; Muntaner-Mas, A.; Moliner-Urdiales, D.; Lozano-Berges, G.; Benito, P.J.; Rodríguez-Pérez, M.A.; Delgado-Alfonso, Á.; Sanchís-Moysi, J.; et al. Patterns of active commuting to school in spanish preschool children and its associations with socio-economic factors: The PREFIT project. Int. J. Environ. Res. Public Health 2021, 18, 11180. [Google Scholar] [CrossRef]
  32. Corral-Abós, A.; Aibar, A.; Estrada-Tenorio, S.; Julián, J.A.; Ibor, E.; Zaragoza, J. Implications of school type for active commuting to school in primary education students. Travel Behav. Soc. 2021, 24, 143–151. [Google Scholar] [CrossRef]
  33. Chatman, D.G.; Broaddus, A.; Spevack, A. Are movers irrational? On travel patterns, housing characteristics, social interactions, and happiness before and after a move. Travel Behav. Soc. 2019, 16, 262–271. [Google Scholar] [CrossRef]
  34. Ghekiere, A.; Deforche, B.; Carver, A.; Mertens, L.; de Geus, B.; Clarys, P.; Cardon, G.; De Bourdeaudhuij, I.; Van Cauwenberg, J. Insights into children’s independent mobility for transportation cycling—Which socio-ecological factors matter? J. Sci. Med. Sport 2017, 20, 267–272. [Google Scholar] [CrossRef] [PubMed]
  35. Camarero, L.A.; Oliva, J. Exploring the social face of urban mobility: Daily mobility as part of the social structure in Spain. Int. J. Urban Reg. Res. 2008, 32, 344–362. [Google Scholar] [CrossRef]
  36. Shaw, B.; Bicket, M.; Elliott, B.; Fagan-Watson, B.; Mocca, E.; Hillman, M.; Fagan-Watson, B. Children’s Independent Mobility: An International Comparison and Recommendations for Action; London Policy Studies Institute: London, UK, 2015; ISBN 9780853740148. [Google Scholar]
  37. Litman, T. Evaluating Accessibility for Transport Planning—Measuring People’s Ability to Reach Desired Services and Activities; Victoria Transport Policy Institute: Victoria, BC, Canada, 2022. [Google Scholar]
  38. Šinko, S.; Prah, K.; Kramberger, T. Spatial modelling of modal shift due to COVID-19. Sustainability 2021, 13, 7116. [Google Scholar] [CrossRef]
  39. Ribeiro, P.J.G.; Fonseca, F. Students’ home-university commuting patterns: A shift towards more sustainable modes of transport. Case Stud. Transp. Policy 2022, 10, 954–964. [Google Scholar] [CrossRef]
  40. Jurak, G.; Soric, M.; Sember, V.; Djuric, S.; Starc, G.; Kovac, M.; Leskosek, B. Associations of mode and distance of commuting to school with cardiorespiratory fitness in Slovenian schoolchildren: A nationwide cross-sectional study. BMC Public Health 2021, 21, 291. [Google Scholar] [CrossRef]
  41. Stone, M.R.; Faulkner, G.E.; Mitra, R.; Buliung, R.N. The freedom to explore: Examining the influence of independent mobility on weekday, weekend and after-school physical activity behaviour in children living in urban and inner-suburban neighbourhoods of varying socioeconomic status. Int. J. Behav. Nutr. Phys. Act. 2014, 11, 5. [Google Scholar] [CrossRef] [Green Version]
  42. Caulfield, B.; Furszyfer, D.; Stefaniec, A.; Foley, A. Measuring the equity impacts of government subsidies for electric vehicles. Energy 2022, 248, 123588. [Google Scholar] [CrossRef]
  43. Christidis, P.; Focas, C. Factors Affecting the uptake of hybrid and electric vehicles in the European Union. Energies 2019, 12, 3414. [Google Scholar] [CrossRef] [Green Version]
  44. Javid, R.J.; Nejat, A. A comprehensive model of regional electric vehicle adoption and penetration. Transp. Policy 2017, 54, 30–42. [Google Scholar] [CrossRef]
  45. Gkiotsalitis, K.; Stathopoulos, A. A utility-maximization model for retrieving users’ willingness to travel for participating in activities from big-data. Transp. Res. Part C Emerg. Technol. 2015, 58, 265–277. [Google Scholar] [CrossRef]
  46. Turoń, K. Social barriers and transportation social exclusion issues in creating sustainable car-sharing systems. Entrep. Sustain. Issues 2021, 9, 10–22. [Google Scholar] [CrossRef] [PubMed]
  47. Turoń, K. From the classic business model to open innovation and data sharing—The concept of an open car-sharing business model. J. Open Innov. Technol. Mark. Complex. 2022, 8, 36. [Google Scholar] [CrossRef]
Figure 1. Geographic location of the studied schools in the southwestern European region.
Sustainability 14 16704 g001
Figure 2. Use of transport modes in the different studied schools with indication of the scholar level and country.
Sustainability 14 16704 g002
Figure 3. Mobility pattern of the scholar community in the studied countries.
Sustainability 14 16704 g003
Figure 4. Mobility preferences of the scholar community per ATS, public transport, and private motorised vehicles.
Sustainability 14 16704 g004
Figure 5. Mobility scores and global score per country and the overall average.
Sustainability 14 16704 g005
Table 1. Key performance indicators for mobility analysis.
Key Performance IndicatorEquation
KPIT1
Parking spaces for bicycles per student (up to 100 m radius of the school)
KPI T 1 = Number   of   parking   places   for   bicycle Number   of   the   total   students   of   the   school
KPIT2
Parking spaces for electric cars per school (up to 100 m radius of the school)
KPI T 2 = Number   of   charging   stations   for   eletric   cars Number   of   the   total   students   of   the   school
KPIT3
Public transports passing daily per hour (up to 1000 m radius of the school)
KPI T 3 = Number of public transports per hour within a 1000 m radius
KPIT4
Annual CO2 emissions per student (KgCO2 eq/student)
KPI T 4 = i   CO 2   i   emissions   from   daily   commute   to   school Number   of   students   of   the   school
where i = transport mode (motorbike; car; boat; tram; train; subway; bus; bicycle; on foot) and
CO 2   i   Emissions = annual emissions associated to the transport mode i , defined by
CO 2   i   Emissions   = i ( FE i × PE i ) ×   daily   average   distance   × 22 × 10
where FE i = CO2 equivalent emission factor per transport mode i , and
PE i = number of persons equivalent per transport mode i , considering the total number of answers of the behavioural questionnaires and the total number of students.
PEi = ( # never   × 0 + # sometimes × 1 3 + # almost   always   × 2 3 + # always × 1 ) × Number   of   students Number   of   students
Table 2. Description of the mobility scores and global score and their calculation procedures.
IDScore DescriptionScore
Calculation
Less Favourable ScenarioMore Favourable ScenarioWeighting
(For Global Score)
S1Parking places for bicycles S 1 = 5   KPI T 1 1.05 × max   ( KPI T 1 ) Without parking placesHighest KPIT2 found plus 5%1
S2Charging stations for electric cars S 2 = 5   KPI T 2 1.05 × max   ( KPI T 2 ) Without charging stationsHighest KPIT1 found plus 5%1
S3Public transport S 3 = 5   KPI T 3 1.05 × max   ( KPI T 3 ) Without public transportHighest KPIT3 found plus 5%1
S4Annual CO2 emissions S 4 = 5 5   KPI T 4 KPI T 4   with   all   students   by   car 100% of the students go by car100% of the students go on foot or by bicycle2
Global   Score = S 1 + S 2 + S 3 + 2 S 4 5
Table 3. Mobility KPIs per country.
KPICountry
IDDescription/UnitPTSPFRGIAverage
KPIT1Parking spaces bicycles/student0.026 ± 0.057
[0.000–0.181]
0.003 ± 0.003
[0.000–0.010]
0.052 ± 0.052
[0.000–0.145]
0.004 ± 0.008
[0.000–0.021]
0.021 ± 0.020
KPIT2Parking spaces electric cars/student0.000 ± 0.000
[0.000–0.001]
0.000 ± 0.000
[0.000–0.000]
0.001 ± 0.002
[0.000–0.008]
0.000 ± 0.000
[0.000–0.000]
0.000 ± 0.001
KPIT3Public transport/hour25 ± 35
[1–120]
12 ± 16
[2–61]
20 ± 11
[7–47]
1 ± 2
[0–4]
14 ± 9
KPIT4KgCO2 eq./student192 ± 130
[52–469]
104 ± 67
[0–230]
96 ± 119
[12–303]
25 ± 18
[0–56]
104 ± 59
Publisher’s Note: MDPI stays neutral with regard to jurisdictional claims in published maps and institutional affiliations.

