Article

Spatial-Temporal Pattern and Driving Factors of Carbon Emission Intensity of Main Crops in Henan Province

School of Economics and Trade, Henan University of Technology, Zhengzhou 450001, China
*
Author to whom correspondence should be addressed.
Sustainability 2022, 14(24), 16569; https://doi.org/10.3390/su142416569
Submission received: 31 October 2022 / Revised: 1 December 2022 / Accepted: 5 December 2022 / Published: 10 December 2022

Abstract

:
Agriculture is the national economy’s primary industry, and its carbon emissions (CE) are one of the most significant factors influencing the environment. As a large agrarian province, reducing the carbon emission intensity (CEI) of agricultural is of great practical significance to the sustainable development of agriculture in Henan province. In this paper, the CEI of rice, maize, and wheat from 2001 to 2020 in 18 prefecture-level cities in Henan province was calculated, and its spatial-temporal evolution patterns were analyzed. The Spatial Dubin model was used to study the impact mechanism and spatial spillover effect of the main crops’ CEI. As a result, the following was determined: (1) The CEI of main crops in 18 cities of Henan province showed an inverted “V” shape, whereas the geographical distribution showed an oblique “T” shape mainly in the north and west. (2) The CEI of main crops was significantly different under different factors. Technical efficiency, agricultural openness, urbanization level, agriculture production agglomeration, and agriculture fiscal expenditure negatively impact the main crops’ CEI. The structure of the food industry and the cost of water for agriculture and forestry positively affect the CEI of main crops. (3) The spatial spillover effects of agricultural openness, production technology efficiency, environmental protection, and fiscal expenditure spread to the surrounding areas through factor flow, technology spillover, and policy spread. The efficiency of production technology and fiscal expenditure on environmental protection have a demonstrative effect, and the degree of agricultural openness has a siphon effect. Based on the research results, we should strengthen agriculture technology extension and investment and gradually improve technical efficiency. Agriculture should be financially supported by the government. We will actively promote the optimization of the structure of the grain industry by promoting orderly urbanization, strengthening the sharing of factors among regions, and reducing the CEI of main crops.

1. Introduction

Global warming is one of the most serious environmental problems in the world today. This problem not only affects the sustainable development of the social economy but also seriously affects the survival and development of human beings. Although the secondary and tertiary industries have always been the main source of greenhouse gases, the CE generated by their production sectors cannot be underestimated. This is due to the widespread and common nature of agricultural activities. According to the UN’s Food and Agriculture Organization (FAO), CE from food and agriculture systems reached 17 billion tons in 2019. China accounts for about 14% of the world’s agricultural CE.
Among the country’s main crop production bases and modern farming bases, Henan province is responsible for approximately 10.04 percent of agricultural CE and 8.89 percent of main crops acreage annually. In the past 10 years, the output of main crops has accounted for 9.53 percent of the CE, ranking second in the world. As part of sustainable food production, we must reduce the use of agrochemical inputs, establish green farmland, and promote green prevention, while also ensuring food security, controlling products, and regulating technologies. To achieve a “Double carbon” target, scientific cultivation and production of grains are critical.
This paper analyzes the spatial and temporal characteristics and the impact mechanisms of the main crops in Henan province, thus contributing not only to the reduction of CE from differential main crops in this region, but also fostering the development of modern agriculture there.
Currently, scholars both domestically and internationally focus on the following aspects: First, agricultural CE measurement. —In agriculture, CE mainly come from farming, animal husbandry, soil respiration, and artificial agriculture [1,2]; there are six types of carbon sources in the process of cultivation and production: chemical, namely chemical fertilizer, pesticide, agriculture film, farming diesel oil, agriculture plowing, and irrigation [3,4,5,6,7,8]. West, T.O. et al. examined fertilizers, pesticides, irrigation, and seed cultivation to estimate the total CE from agriculture in the United States [9]. Johnson used land use, rice farming, livestock farming, and the open burning of straw to develop a detailed system of indicators for measuring total agricultural CE in the United States [10]. Some scholars have calculated Henan’s agricultural CE from the farm inputs used in the cultivation process. However, the categories chosen are different. They calculate agricultural CE based only on fertilizers, farming plowing, tractor machinery and irrigation [11], or use fertilizers, pesticides, mulch, agricultural machinery, and plowing to measure agricultural carbon emissions [12,13]. There are different indicators and measurement methods, as well as different results.
Second, the CEI of agriculture. —Agricultural carbon productivity is the ratio of farm output to CE, which intuitively reflects the CEI to some extent [14]. Alternatively, the CEI is the ratio of CE to food production per unit of output [15]. Previous studies have analyzed agricultural carbon productivity [14,15,16,17] from the perspectives of spatial differentiation, farmer specialization, regional agglomeration, and crop production.
Third, the driving factor of agricultural CE. —Studies were conducted from five perspectives: economy [18,19,20,21], technology [22,23,24], population [24,25,26], structure [21,27], and policy [20,28,29]. Furthermore, the LMDI decomposition model [18,19,25,26], GMM empirical study [22], mediating effect and regulating effect model [27,28], and Kaya identity [30,31,32] were used to analyze the influencing factors of agricultural CE, or use the spatial panel model to analyze the driving factors and regional differences of agricultural CE from time and space dimensions [20,21,23,24,29,33]. Numerous studies have covered the decomposition and spatial-temporal effects of CE factors of agriculture in general, which provides a reference for the analysis of spatial-temporal effects and the study of the driving factors of CE in prefecture-level cities.
According to the current estimates, the majority of agricultural CE is estimated at the provincial or national level, but for the prefecture-level cities, the study is relatively small, and the definition of agricultural carbon sources is different. However, in the context of Chinese advocacy for food security, there is a Simon Kuznets curve effect (environmental Simon Kuznets curve, EKC) [19] between food production and CE. That is to say, in the short term, if we increase food production, it will inevitably lead to an increase in CE. Therefore, to eliminate the difference in CE due to different grain yields, Francesco et al. and Dumortier and Elobeid looked at the CEI of staple crops, defined as the emission of greenhouse gases, such as CE, per unit of grain yield over a while [34,35]. Accordingly, the CEI is more in line with the concept of the low-carbon transformation of food production and sustainable development of food production. However, these results provide an appropriate reference for the study of the CEI of main crops in Henan province and the analysis of influencing factors.
To make up for the deficiency of current research, this paper uses chemical fertilizer, pesticide, agricultural film, agricultural diesel oil, agricultural plowing, and irrigation energy consumption as six kinds of carbon sources. This paper constructs the measurement system of the carbon emissions of main grain crops in Henan province, analyzes the spatial and temporal evolution pattern of CE and CEI, and adopts the dynamic spatial panel model to analyze the influence mechanism of CEI of main crops. Therefore, the marginal contribution of this paper has two main points: first is research perspective innovation—select prefecture-level cities as the object of study, as it is more focused; and the second is the innovation of research methods, including the possible spatial effects into the research framework, using the spatial dynamic panel model, so that the measurement results are more in line with the objective reality.

2. Materials and Methods

2.1. CEI Measurement Model

Taking into account the availability of data, this paper mainly calculates the CE and CEI of rice, maize, and wheat from 2001 to 2020 in 18 cities of Henan province. Since there were no statistics on crop irrigated areas in 2001–2007, the CE and CEI from crop irrigation were calculated from 2008 onward.
The formulas of CE and CEI of main crops were constructed as follows:
C E i , t T = λ = 1 C E t , λ i = λ = 1 ( δ t , λ i T t , λ i )
C E I i , t = C E i , t T / Y i , t
In the formula, C E i , t T is the CE of the main grain in the t year of i city, Y i , t is the total output of the main crops in the t year of i city, C E t , λ i is the emission of the λ -type carbon source of the main crops in the t year of i city, δ t , λ i is the carbon emission coefficient of class λ emission source in the t year of main crops in i city, and T t , λ i is the use(or production) of class λ emission source in the t year of main crops in i city. C E I i , t is the CEI of the main crops in the t year of i city, calculated by dividing the CE of the main crops by the total output of the main crops. For the short term, the increase in the yields of main crops will cause a continued increase in the accumulated amount of CE, more in line with the promotion of low-carbon transformation of food production, to ensure a sustainable development of food production. The carbon emission coefficients and sources of various carbon sources are shown in Table 1.

2.2. Spatial Econometric Models

2.2.1. Moran Index

The Moran Index is often employed by academics to measure geographic autocorrelation. The Moran Index consists of a Global Moran Index and a Partial Moran Index. The Global Moran Index is often used to analyze overall spatial clustering, and the Local Moran Index is designed to focus on the spatial clustering around a region. This paper uses the Global Moran Index to further explore the spatial-temporal characteristics of carbon emission intensity of staple crops in Henan province.
The Global Moran Index is calculated as follows:
G M I = n S i = 1 n j = 1 n w i , j ( x i x ¯ ) ( x j x ¯ ) i = 1 n ( x i x ¯ ) 2
S = i = 1 n j = 1 n w i j
Z I = G M I E ( G M I ) V ( G M I ) , E ( G M I ) = 1 n 1 , V ( G M I ) = E ( G M I 2 ) E ( G M I ) 2
In the formula, w i , j is a spatial weight, and the Moran Index has a range of [−1, 1]; if the Global Moran Index is greater than zero, then it is a positive correlation; if it is less than zero, then it is a negative correlation; and if it is equal to zero, then there is no correlation. If the Local Moran Index is close to 1, then it has the same attribute aggregation, and close to −1, then it has a different attribute aggregation.

2.2.2. Spatial Panel Model

The spatial panel model of Henan province was established to study the regional difference in the influence of each factor on the CEI of the three main crops, and the influence mechanism of each factor on the CEI of the three main crops was deeply analyzed. The general form of building a spatial panel model is as follows:
{ Q i t = α + ξ Q i , t 1 + θ w i Q i t + β i j = 1 k X i , j , t + σ i w i j = 1 k X i , j , t + η t + μ i + ε i t ε i t = δ m i ε i + ψ i t
In the formula, X i , j , t is the J factor in a module in I area, w i is the i row of the spatial weight matrix; W is the carbon weight matrix; η t is the time effect, ( μ i + ε i t ) is the compound interference term; m i is the i row of the M matrix of the spatial weight of the interference term; when,   ξ 0 , the equation is a dynamic spatial panel model; when,   δ = 0 , this is the spatial Dubin model (SDM); when δ = 0 and     σ = 0 , this model is a spatial autoregressive model (SAR); when ξ = 0 and σ = 0 , this model is a spatial autocorrelation model (SAC); and when ξ = θ = 0 and σ = 0 , this model is a spatial error model (SEM). The carbon emission characteristics of the investigated samples were described.

2.2.3. Variable Selection and Data Sources

1.
Variable Selection
Studies have shown that production technology is the key factor affecting the CEI of staple grains [12,23]. Therefore, the technical efficiency (PE) of main crops is adopted, and the EBM model proposed by Tone (2010) is used to calculate the total sown area, direct cost, and employment quantity of rice, maize, and wheat as three input indexes. Taking the total output of the three as the output index, the total technical efficiency of main grain production is calculated [38]. This model makes up for the shortcoming of the traditional radial (CCR) model and the non-radial (SBM) model, it loosens the assumption of the same proportion change of factor input in the traditional method, and it makes the calculation result more accurate. The efficiency of production technology can be improved by the “Horizontal effect” of system reform, and the measures of precision fertilization and organic fertilizer substitution can be taken to promote factor saving, factor allocation, and technology spillover efficiency, helping reduce the CEI from staple foods.
The accumulation level of main crops production plays a crucial role in reducing CEI from staple crops [39]. The scale economy effect of the production agglomeration level of main crops not only can effectively promote the development level of the regional economy and optimize the structure of the grain industry, but it can also improve the spillover effect of the rapid development of the grain industry, promote the wide application and popularization of advanced farming technology, improve the efficiency of resource allocation, and promote the CEI reduction of staple grains. Therefore, the location entropy method was used to calculate the agglomeration level (PC) of major grain crops = (the total output value of rice, maize, and wheat in each city/the total output value of grain in each sub-city area)/(the total output value of rice, maize, and wheat in Henan province/the total output value of grain in Henan province). The grain industry structure (GIS) was determined by the proportion of the output value of rice, maize, and wheat to the total output value of grain. Using agricultural openness (AO) as a measure of the level of the economy, taking (municipal agriculture value added/gross national product) * the total amount of imports and exports of each municipality as the actual total amount of agricultural imports and exports of each municipality, calculate the proportion of the actual total amount of agricultural imports and exports in agriculture added value.
Urbanization has an impact on the CEI of staple grains [25], so the level of urbanization (UL) is used: calculated as the proportion of the urban population to the total population in each city. As the urbanization rate of the population and the urbanization rate of the economy increase, the land and human resources for the production of staple food will be greatly reduced, resulting in a large amount of investment in agricultural machinery and auxiliary means of production in the short term, causing a rise in CEI. However, when urbanization reaches a more mature stage, it will drive the continuous flow of rural population and resources to the cities in the long term. This will promote the scale operation and standardized production of the farming industry to reduce CEI.
In addition, policies have an impact on the CEI of staple foods [20]. In this paper, the proportion of agricultural expenditure (AE) and the proportion of total expenditure on environmental protection (EPE) were chosen as representative policies, and the proportion of agricultural expenditure was calculated by the proportion of the expenditure on agriculture, forestry, and water affairs to the total expenditure of each city, while the proportion of the total expenditure on environmental protection is calculated by the proportion of the expenditure on energy conservation and environmental protection in the total expenditure of each municipality. As the government continues to step up its support for agriculture, it is offering tax breaks or direct subsidies to companies that produce agricultural machinery or tools. These subsidies are designed to guide the transition to green production. However, this may be less efficient, discouraging the replacement of agricultural machinery and irrigation equipment. In addition, older agricultural machinery equipment increases energy consumption to some extent, a goal that is not conducive to reducing the CEI of main crops. Specific variables and definitions are shown in Table 2.
After selecting the factors that affect the CEI, the general form of the dynamic panel model of the CEI of main crops can be expressed as follows:
C E I i t = α + ξ C E I i , t 1 + θ w i C E I i t + ψ w i C E I i , t 1 + β 1 A O i t + β 2 P E i t + β 3 U L i t + β 4 P C i t + β 5 G I S i t + β 6 A E i t + β 7 E P E i t + σ i w i A O i t + σ 2 w i P E i t + σ 3 w i U L i t + σ 4 w i P C i t + σ 5 w i G I S i t + σ 6 w i A E i t + σ 7 w i E P E i t + η t + μ i + ε i t
2.
Data Sources
The sampling time interval is 2001–2020. Among the variables involved, data on the sown area, yield, total population, urban population, rural population, crop irrigation area, total agricultural output value, number of primary industry employees, added value of agriculture, forestry, animal husbandry and fishery, added value of agriculture, gross national product (GNP), total grain output value of each municipality, total grain output value of Henan province, total fiscal expenditure of each municipality, expenditure on agriculture, forestry and water affairs, energy conservation, and environmental protection in each municipality were obtained from the Henan Province Statistical Yearbook. The total import and export volume of each municipality comes from the annual statistical bulletins of each municipality on national economic and social development; the direct costs of rice, corn, and wheat; the number of workers employed; fuel power costs; pesticide costs per mu; fertilizer costs per mu; total irrigation costs; and irrigation water costs from the “National compilation of cost and income of agricultural products”.

3. Results and Discussion

After calculating the CE and CEI from rice, maize, and wheat cultivation in 18 prefecture-level cities in Henan province, we constructed a spatial and temporal distribution map, as shown in Figure 1.

3.1. Temporal Characteristics of Total and Intensity Carbon Emissions from Main Grain Crops

3.1.1. Temporal Characteristics of CE from Main Crops

The total CE of main crops in Henan province fluctuated in an Inverted “V” shape pattern, first rising and then falling. From 2001 to 2020, the total CE from main crops in Henan province increased from 2,993,047.993 tons to 5,432,352.832 tons, with an average annual growth rate of 4.289%. From 2001 to 2017, the total CE from main crops in Henan province experienced an upward trend. This trend reached a peak in 2017, rising from 2,993,047.993 tons in 2001 to 7,821,591.335 tons in 2017, with an average annual growth rate of 10.083%. From 2017 to 2020, the total CE from main crops in Henan province showed a downward trend, from 7,821,591.335 tons in 2017 to 5,432,352.832 tons in 2020, with an anticipated annual growth rate of −10.182%.

3.1.2. Temporal Characteristics of CEI of Main Crops

Overall, 10 cities in Henan province saw a reduction in CEI from 2001 to 2020. However, Henan’s overall CEI rose slightly from 1.525 t/t in 2001 to 1.545 t/t in 2020, an increase of 1.311%.
In the year 2001, 13 regions in Henan province had carbon emission intensity above 0.075 t/t. There are two main reasons for this. First, it may be that some of these areas, such as Sanmenxiashi, are located in mountains and hills, while Nanyangshi is located in a basin. Although the area of cultivation is vast, it is difficult to cultivate. Second, since China acceded to the WTO in 2001, China has established an export support system for agricultural products. The north has been seriously affected by drought and flood disasters. Henan province, as one of the grain-producing areas in China, has seen an increase in foreign demand for grain crops, which, in turn, has prompted farmers to increase their grain output, as well as their usage of various agricultural inputs, ultimately resulting in a higher CEI.
In 2007 and 2013, the CEI of the main crops in the cities of Henan province overall was still relatively high, probably because we put forward a series of policies in 2005 to improve farmers’ enthusiasm for planting grains in order to ensure food security in our country. As a main crop-producing province, Henan province actively responds to the national policy of developing low-carbon agriculture, or organic agriculture. However, as a result of the lack of policy propaganda, as well as the fact that farmers cultivate a large amount of wasteland to grow grain and save the cost of cultivating grain, the CEI of main crops in some regions is still relatively high.
In 2020, 61.111% of the main crops in Henan province had a CEI below 0.091 t/t, and some prefecture-level cities had a largely downward trend compared with 2001. This may be due to President Xi’s joint statement on climate change in 2015. In addition, by 2017, the national emissions trading system was launched, and provinces responded. China’s People’s Government of Shandong Province issued a circular on the work plan for low-carbon development in Shandong province (2017–2020), and in 2017, Henan province formulated a fifteen-year plan to speed up the construction of modern agriculture, to reduce the CEI of main crops by increasing mechanization and promoting green agricultural technology. Cities have also adopted corresponding measures. For example, Xinyangshi has implemented the feedback from the fifth central ecological and environmental protection inspection group, strengthened the construction of demonstration zones, and increased the promotion and application of formula fertilizers, to increase the demonstration research and application of Green Prevention and control technology and to increase the promotion of large-scale and modern plant protection machinery, such as remote control UAVs for plant protection, long-distance sprayers for universities, and self-propelled spray-rod sprayers, etc., steadily increasing spraying, pest control, and pesticide use, significantly reducing pesticide use, and driving down CEI of main crops.

3.2. Spatial Characteristics of CE and CEI of Main Crops

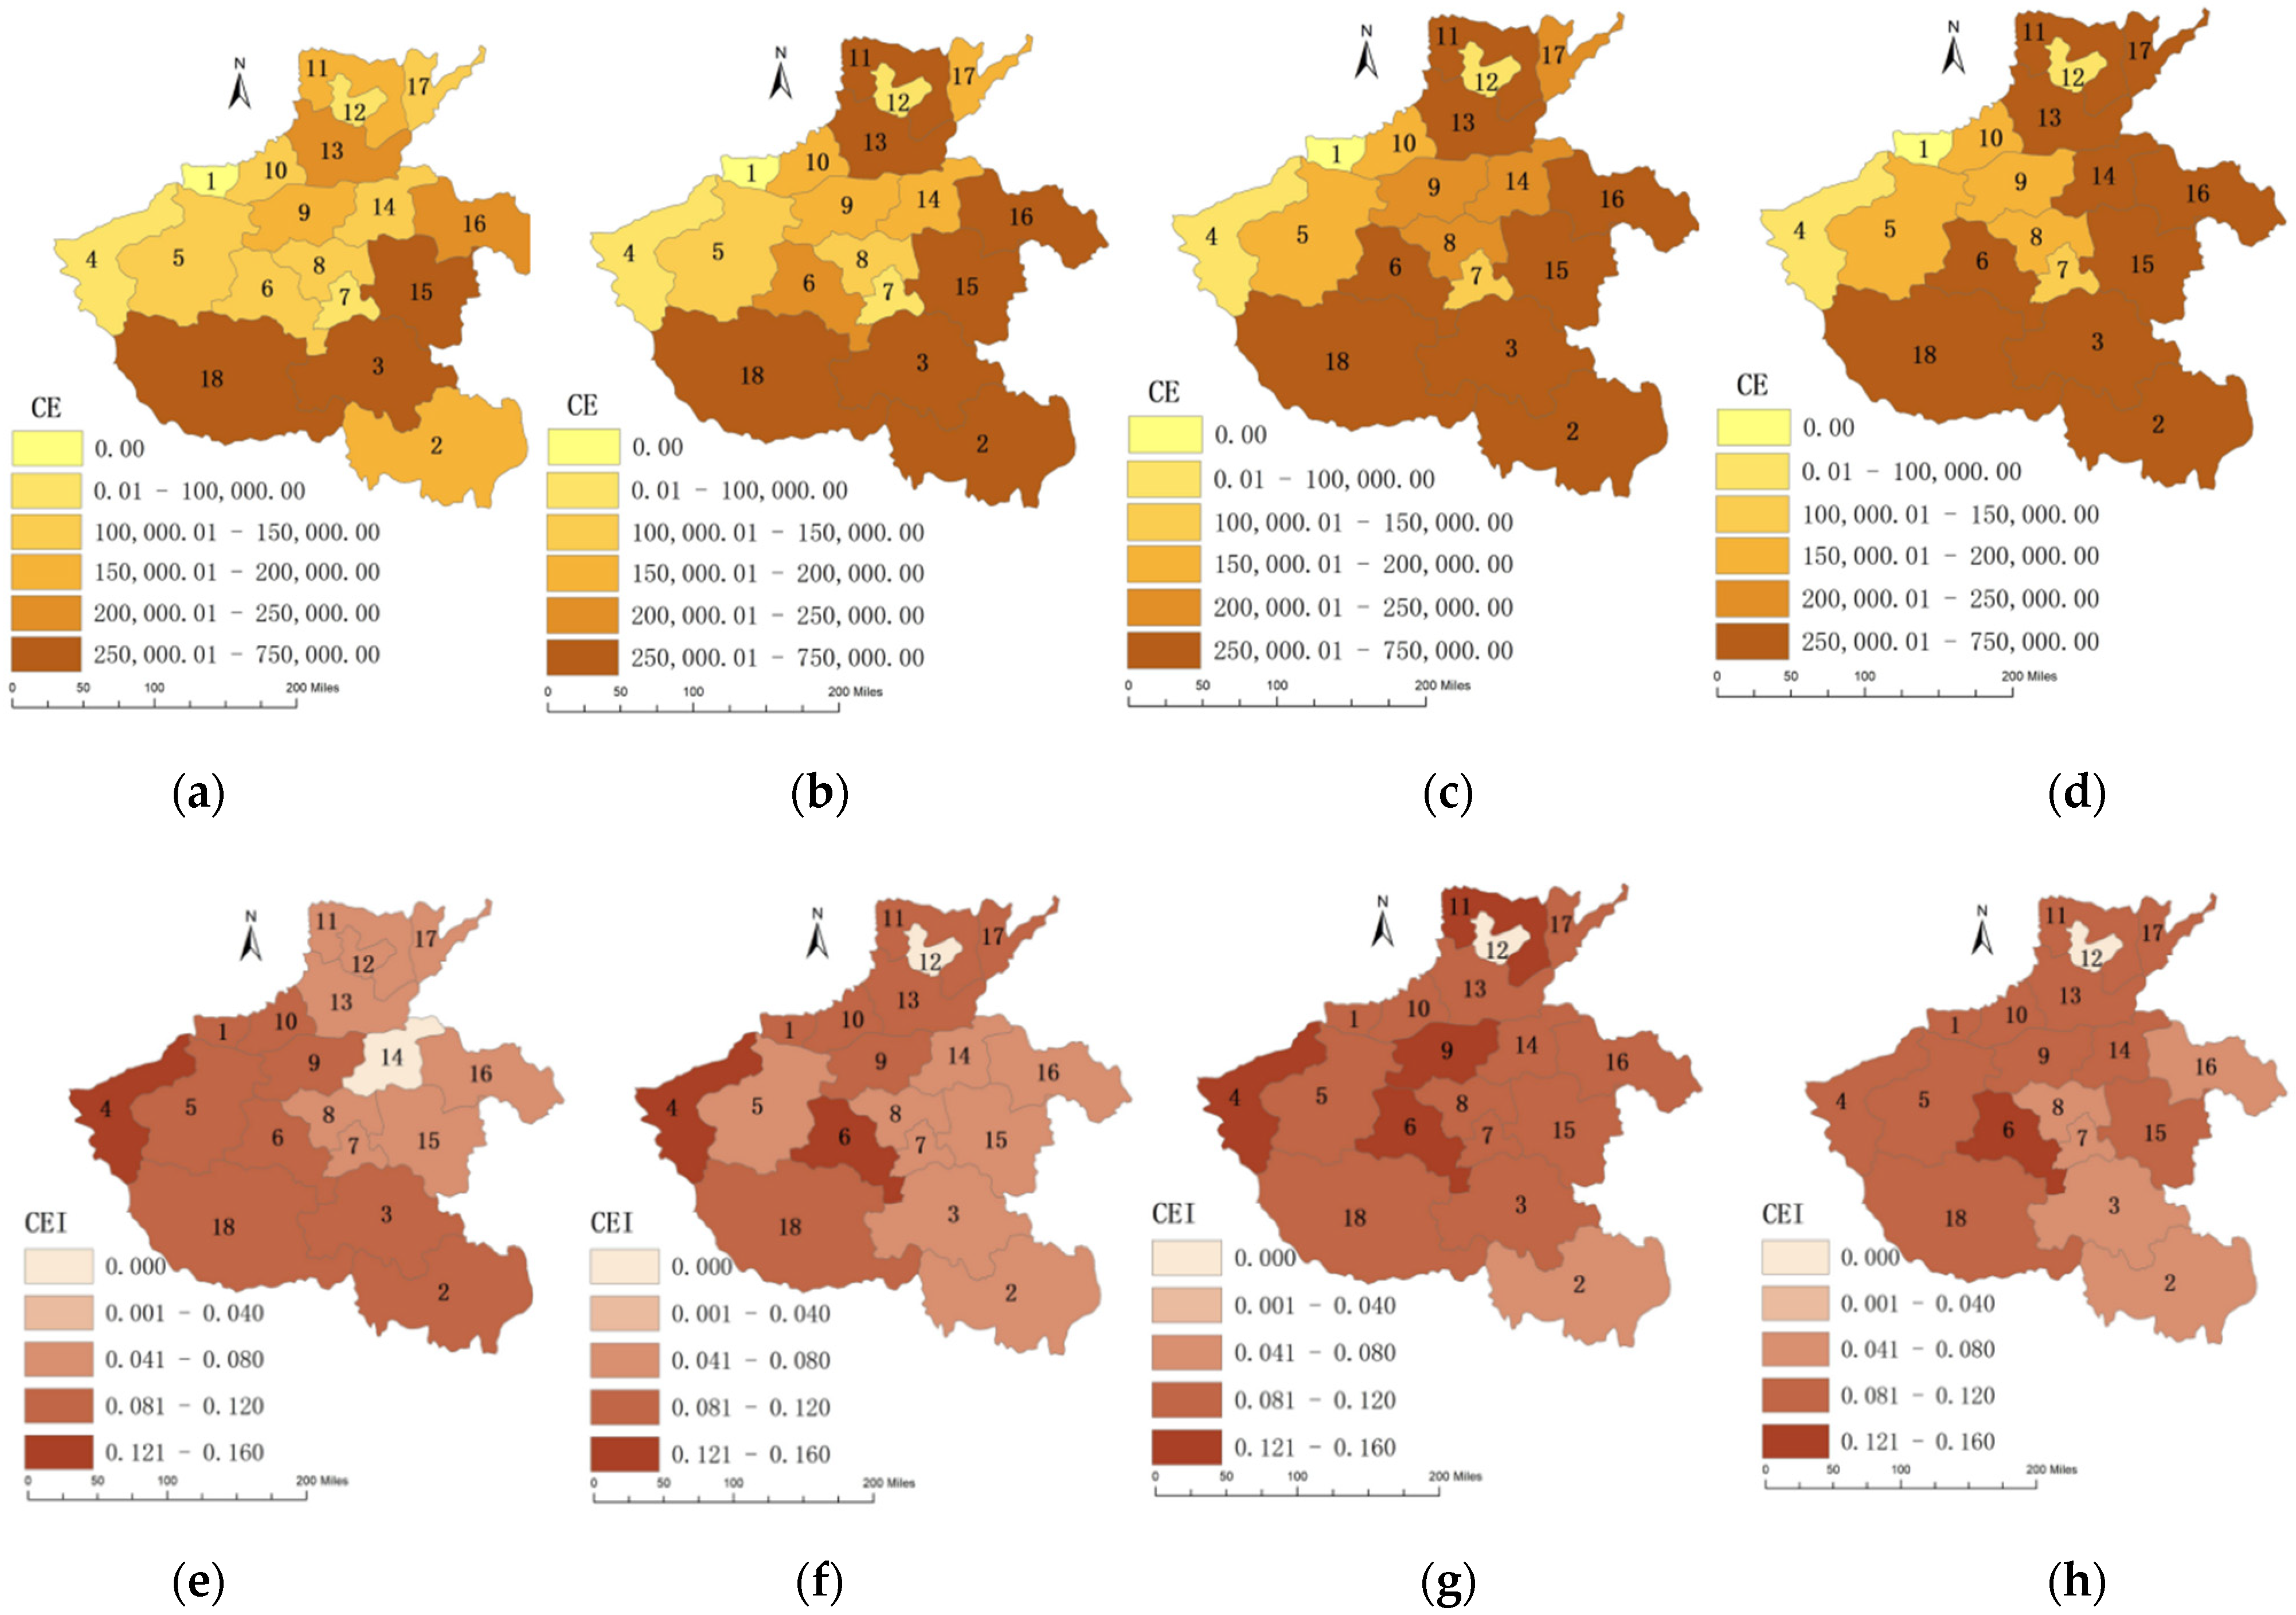
3.2.1. Spatial Characteristics of CE from Main Crops

From 2001 to 2020, CE from main crops in Henan province decreased from Southern and Eastern Henan province to Central, Northern, and Western Henan, showing a counterclockwise trend of regional growth. Hebishi’s Northern Henan province has the lowest total CE from growing main crops. However, Nanyangshi, Zhumadianshi, and Zhoukoushi in the Southern Henan province have the highest total CE.
In particular, the total amount of CE grown on main crops in some prefecture-level cities in Western, Central, and Northern Henan is low. However, the total CE in Eastern and Southern Henan are higher. This is mainly because the state has always stressed food security, requiring provincial governments to pay attention to overall grain output, in order to maintain stable growth. On the other hand, these areas are large markets for growing food. As a necessity, small changes in food prices will lead to large changes in production. Operators will adopt a variety of ways to increase grain production, thereby increasing the income per unit of grain sown area. Ultimately, both governments and operators will strive to increase agricultural inputs in order to generate benefits that will keep CE from main crops at a high level.

3.2.2. Spatial Characteristics of CEI of Main Crops

As one of China’s main crops production areas, the eastern part of Henan is known as the national high-quality wheat production base. Because it is located on a plain and has favorable natural conditions and land-cultivation conditions, the CEI of the main crops there has been the lowest. In 2020, Henan South had a larger downward trend compared with 2001, with a decline of 14.73%. This is mainly because these regions have successively established many high-standard farmland demonstration zones “With standard construction, modern equipment, intelligent application, large-scale operation, and standardized management”, the use of green and low-carbon production technology to achieve increased food income and CEI reduction. Shangqiushi, for example, is a pioneer in green pesticide development, promoting the development of standardized bases of “Three products and one standard”, with 6.95 million mu of high-standard farmland; promoting experiments and demonstration applications of biodegradable agricultural films; and implementing actions to save water in agriculture and reduce the use of pesticides and fertilizers, this reduced carbon intensity by 21.010% compared with 2013. Zhumadianshi, known as the Central Plain’s “Granary”, is a “National model city for comprehensive standardization of agriculture”. It has formulated a “Guide for the construction of comprehensive standardization of agriculture demonstration project”. Currently, 8.38 million mu of high-standard farmland has been built. In 2021, we will continue to build 28 high-standard farmland projects totaling 1.07 million mu, which will help enhance the agricultural production capacity and promote the high-quality development of modern agriculture.
In particular, before 2001, the CEI of main crops in Henan province showed an oblique “T” type, with Southern and Western Henan as the primary directions. Sanmenxiashi, Nanyangshi, and Xinyangshi show a higher CEI than Puyangshi, Anyangshi, Xinxiangshi, and Shangqiushi. Between 2002 and 2007, the CEI of the main crops in Henan province was “L” type mainly in the north and west of Henan province and gradually decreased to the east and south of Henan province. The CEI of Zhengzhou, Nanyangshi, Pingdingshanshi, Sanmenxiashi, and Kaifeng is significantly higher than that of Eastern and Southern Henan. From 2008 to 2013, the CEI of the main crops in Henan province exhibited an oblique “O” shape in the northeast and southwest directions, while only Xinyangshi and Hebishi had the lowest CEI. From 2014 to 2020, the CEI of the three main crops in Henan province showed an oblique “T” pattern, mainly in the north and west of Henan province, and gradually spread to the south of Henan province.
In general, the CE from main crops are higher in some regions. On the other hand, the CEI of the main crops in these regions is low. This is mainly because farmers increase the use of various carbon sources in main crops in order to increase food production and increase food income, resulting in higher CE. However, the CEI is the amount of carbon emitted per unit of food production. A low CEI indicates that various carbon sources are used more efficiently, that there is no huge waste of resources, and that the level of production technology efficiency is superior. Therefore, it is more meaningful to study the CEI of the main crops.

3.3. Analysis of Influencing Factors and Spatial Effect of CEI of Main Crops

3.3.1. Analysis of Influencing Factors on CEI of Main Crops

It is necessary to test the spatial correlation of CEI of main crops before using the geo-econometric model for empirical analysis. Using the Global Moran Index, this paper examines the spatial correlation of the CEI of main crops in Henan province from 2001 to 2020. The results are shown in Table 3. The spatial correlation of the CEI of the main crops under the carbon emission matrix is significant. Therefore, this paper analyzes the geographic panel model under the carbon emission matrix. Drawing on the research of Elhorst [40], Wald and LR tests were used to judge the choice of specific models (SAR, SAC, SEM, and SDM), and the Hausman test was used to determine the final choice of fixed-effect model or random-effect model. With the help of STATA software, the fixed-effect SDM model was selected to analyze the influencing factors of CEI of the main crops in Henan province. The results are shown in Table 4. Under the carbon emission matrix, the scalar autoregressive coefficients were significant (1% and 5% confidence levels), the geographical autoregressive coefficients were significant (1% and 5% confidence levels), and the dynamic SDM model of the CEI of main crops has a significant geographic autoregressive effect; and the influencing factors and the spillover effect of CEI of main crops are discussed under carbon emission matrix.
It was found that production technology efficiency had a significant negative impact on the CEI of the main crops (−0.2354). This shows that the improvement of production technology efficiency is one of the main factors to lowering the CEI of main crops. In addition, the application of Advanced Production Technology and management mode has improved the efficiency of the use of various input factors in the production of main crops, which reduces the number of agricultural inputs (fertilizers, pesticides, mulch, diesel, water, electricity, etc.) and yields more, reducing the CEI of main crops per unit produced. Zhengzhou and Sanmenxiashi, for instance, have built a bridge between farmers, science and technology departments, and agriculture experts and scholars. This is in order to serve the “Three Agrarians”: adopting scientific and technological measures to grow grain, improving the efficiency of production technology, helping farmers to increase their income and become rich, and revitalizing the countryside, decreasing the CEI of Zhengzhou’s and Sanmenxiashi’s main crops by 2.29% and 11.73%, respectively, compared with 2019.
Agricultural openness has a negative effect on the CEI of main crops, but it is significant at a 5% confidence level. In the short term, economic development will improve the open level. Kuznets’s theorem suggests that there is an inverted “U” type relationship between economic development and environmental conditions, with development and economy creating pollution before treatment. The CE of main crops have reached “the turning point” in Henan Province, and their trend is downward as opening levels increase, but this is not yet evident. For example, Zhumadianshi, the country’s only international agricultural processing industrial park approved by the Ministry of Agriculture and rural areas, is conveniently located and has an extensive transportation network. It is the national agricultural products trade and logistics center. The city’s main crops is going to be internationalized and networked. However, the CEI of the main crops in the city has not been reduced because of the high level of opening up, but it is still high.
The effect of agri-production agglomeration level on the CEI of main crops was negative (−5.4758). Through the expansion of production scale and the agglomeration of industrial geographical space, the main grain crops can save input factors and improve production efficiency, thus promoting labor market sharing, production input factors, and standardized technology, thus producing a technology spillover, which is beneficial to reducing CEI of main crops. The construction of high-standard farmland for weak gluten wheat has already been realized in Xinyangshi, Henan province, where its cultivation area has reached 700,000 mu (600,000 hectares), accounting for 43.75% of the wheat sown area; with an average yield of 500.33 kg per mu, this has reduced the city’s CEI by 33.02% compared to 2001.
The influence of grain industrial structure on the CEI of main crops was positive (6.1852). With the improvement of the grain industrial structure in Henan province, the proportion of planting output value of main crops to total agricultural output value will increase. There will be a heightened concentration of agricultural production on these three main crops. However, farmers are not fully aware of the application of production technology innovation in the whole process of growing main crops, resulting in the unreasonable allocation and use of resources, which leads to an increase in the CEI of main crops. Rice, maize, and wheat, as the three main crops, are the dominant crops in the farming industry. In this situation, green and low-carbon production technologies are not as critical in concentrating the production of the three main crops, so the structural change of the grain industry will result in a significant increase in the CEI of main crops. For example, Anyangshi and Xinxiangshi in Northern Henan are tilting toward wheat cultivation. Currently, 1.3 million mu of high-quality wheat has been planted in Anyangshi, accounting for 21.74% of the total arable land area. In Xinxiangshi, 1.5 million mu of high-quality wheat has been planted, which accounted for 20.89% of the total sown area. At the same time, in order to increase the production and income of main crops, farmers have increased their input of various agricultural inputs. Farmers have increased the CEI of the region by 6.03% and 8.59% compared with 2001.
The effect of urbanization level on the CEI of main crops is negative, but it is not significant. With the development of urbanization, the populations of rural areas are gradually being transferred to urban areas on a large scale. It has led to the gradual scaling up of agricultural cultivation and the use of a variety of agricultural inputs in an efficient and intensive manner. This results in the reduction of CEI in the production of main crops. However, the urbanization rate of Shangqiushi, Zhoukoushi, Zhumadianshi, and Xinyangshi, which are located in the east and south of Henan Province, is still at a relatively low level. Therefore, the overall impact is not significant.
The impact of agriculture fiscal expenditure on CEI of main crops was negative (−0.0303), but the impact was not significant. The increase in agriculture financial expenditure means that agriculture production has been supported by more funds, which can significantly improve the production infrastructure and equipment, improve the efficiency of natural resource utilization, and expand the scale of farming operations, and then lead to the reduction of CEI of main crops. In Henan province, agricultural financial expenditures mainly cover agriculture, industry, and environmental protection, but the budget for the main crops is relatively small. Accordingly, agriculture fiscal expenditure does not have a significant impact on CEI of main crops.
The impact of environmental protection expenditure on the CEI of main crops is favorable. The increase in environmental protection expenditure is to reduce the CEI of main crops by increasing the investment in low-carbon technology research and development and the institutional cost of CEI. However, the regression results show that the impact of environmental protection expenditure on CEI of main crops is positive and not significant, which contradicts the conclusions of relevant scholars [28,29]. It may be that more of the city-level environmental protection expenditure is spent on environmental protection management, ecological monitoring, monitoring and pollution control by enterprises, natural forest protection projects, landscape beautification, etc., with scant or no money allocated to low-carbon technologies in agriculture, and the impact of government spending on the CEI of the three main crops is positive and not significant.

3.3.2. Spatial Spillover Effect Analysis of CEI of Main Crops

When each factor affects the CEI of the main crops in different regions, it will be transmitted to the adjacent regions through spatial spillover mechanisms, such as factor flow, technology spillover, and policy diffusion, producing the demonstration effect and siphon effect [41]. To more accurately demonstrate the mechanism of action and the extent of the actual impact of each factor on the CEI of main crops under the carbon emission matrix, this paper refers to the practice of Lesage et al. (2009) [42]; the results of regression estimation in Table 4 are unbiased treated by partial differential method and further decomposed into direct effect, spatial spillover effect, and total effect. There are two parts to the direct effects: first, the impact of various factors on the CEI of main crops in the region, and second, how each factor in the region affects the CEI of the main crops in the neighboring region, also known as the “intraregional spillover effect” or feedback effect. The spatial spillover effect is the indirect effect, which refers to the direction and degree of influence of various factors in neighboring regions on the CEI of main crops in this region. The immediate and spatial spillover effects of each factor on the CEI of main crops were calculated, and the results are shown in Table 5. When it comes to the decomposition of spatial effects, the efficiency of production technology and the fiscal expenditure on environmental protection have demonstrative effects. In addition, the degree of agricultural openness has a siphon effect.
The higher efficiency of production technology means that, through more specialized socialization of production service-type organizations, improvements are made to the degree of organization; to provide farmers with some links of agricultural-production specialized machinery operations, for example, mechanization of farming and harvesting, control of diseases and insect pests, sharing of information on agricultural resources, reduction of search costs for farmers, etc., in order to have a demonstration effect; and promote the gathering of production factors in the surrounding areas, and, in turn, the CEI of main crops in these regions will be reduced. Increasing expenditure on environmental protection means continuously optimizing the allocation of agricultural resources; continuously promoting the optimization, greening, and upgrading of agriculture; and achieving high-quality agriculture development and reducing the CEI of main crops in nearby areas. The higher the level of agricultural openness, the greater the advantages in terms of capital, labor, technology, and institutions; and the ability to provide new technologies and standardized socialization services for the agricultural production sector and to improve the efficiency of resource use, thus attracting the transfer of high-quality resources to the surrounding areas, will eventually increase the CEI of main crops in the surrounding areas. The efficiency of production technology and fiscal expenditure on environmental protection have demonstrative effects, and the degree of agricultural openness has a siphon effect.

4. Conclusions and Suggestions

4.1. Conclusions

Firstly, from the temporal and spatial evolution pattern of the CE of main crops, the total CE of main crops in Henan province showed an inverted “V” fluctuation, and the total CE of main crops in Southern and Eastern Henan province increased significantly. The spatial pattern of CEI is an inclined “T” shape. The total CE of South and East Henan are higher, and the CEI values of West, North and Middle Henan are higher. Hebishi’s overall CE and CEI are relatively low.
Secondly, different factors influence the CEI of main crops differently. This is in part because of the different production technologies of crops, the level of urban economic development, relevant policies, and resource endowments. The improvement of agricultural openness has a significant negative effect on the CEI of main crops. However, it is substantial at the level of 5%, and the efficiency of production technology has a pronounced negative effect on the CEI of main crops. Increasing the resource utilization ratio can reduce the CEI of main crops to a significant extent; the level of agriculture production agglomeration has a negative effect on the CEI of main crops. Agriculture fiscal expenditure has a negative impact on the CEI of main crops. However, environmental protection expenditure has a positive, but not substantial, impact. This indicates that fewer funds have been spent on agriculture by municipal environmental protection, and that the desired results were not reached.
Thirdly, the efficiency of production technology, the openness of agriculture, and the fiscal expenditure on environmental protection can enable factors to flow from one region to another, technology to spill over, and policy learning and other mechanisms to be transmitted to the surrounding areas, thus producing the demonstration effect and siphon effect. The efficiency of production technology and fiscal expenditure on environmental protection have a positive spatial spillover effect, while the openness of agriculture has a negative spatial spillover effect.

4.2. Suggestions

Combined with the theoretical and empirical results of this paper, the following will improve the relevant policy recommendations:
(1)
To strengthen the extension and investment of agriculture technology and gradually improve technical efficiency. At the same time, we will adopt greener, low-carbon agricultural production technologies; enhance the service system for innovation in agricultural science and technology; promote the use of efficient, energy-saving, and emission-reduction farming machinery; and promote the appropriate scale of operation. By strengthening the cultivation of high-quality, high-yield, disease-resistant, and drought-resistant varieties and reducing the overuse of synthetic materials such as fertilizers, pesticides, and plastic film, we are able to improve the resource allocation efficiency of staple crops, gradually reducing the CEI from main crops. We can follow the example of Zhengzhou and Sanmenxiashi and implement the current advanced agricultural science and technology into agricultural production practice in a timely manner. We can organize scientific and technological personnel to teach agricultural science and technology methods in rural areas and realize the scientific cultivation of crops.
(2)
The government should continue to expand financial support for agriculture. When the government increases the financial expenditure on agriculture, it needs to lean toward the cultivation of main crops, and the corresponding supporting policies should be more detailed. It focuses on the purchase of special agricultural machinery and the guidance of whole-course cultivation techniques, the construction of storage facilities, and the market and information services of the marketing links in the three main crops planting links. Environmental-protection-related agricultural-subsidy policies could also be introduced, for example, by providing incentives for producers to effectively prevent or mitigate agricultural pollution. Rice, maize, and wheat are the three main crops in our country, and Henan province is the plain area and one of the main crop-producing areas. We will increase support for low-carbon technologies for main crops.
(3)
We will actively promote the optimization of the structure of the grain industry. All regions should fully combine local conditions such as soil characteristics, location economy, and various resources endowments in accordance with the policy of agricultural supply-side structural reform, to determine and popularize suitable crop varieties and practical technical regulations for high-quality and high-yield cultivation; actively popularize high-yield, high-quality, and high-efficiency crop varieties; and realize the optimization and reorganization of agricultural resources. At the same time, we will be market-oriented, create regional brands for crops, develop regional characteristics for main crops, and provide better conditions for low-carbon production.
(4)
We will promote urbanization in an orderly manner and strengthen the sharing of elements among regions. We should give full play to the role of urbanization in boosting the non-agricultural employment of rural households and make use of the development of urbanization to foster technological innovation, knowledge progress, and human capital accumulation. It lays the foundation for the development of agricultural science and technology and the training of technical personnel. Nevertheless, it is imperative to avoid blindly pursuing urbanization-level improvement without considering actual economic development policy and local conditions, which could have negative effects. Meanwhile, we should take advantage of the resource-endowment advantages of each region; promote capital, labor, technology, digital, and other elements of resource flow; and then achieve low-carbon main crops through the spatial spillover effect of production technology efficiency. We need to perform basic work for achieving carbon neutrality and peak CE by 2030 and 2060.

Author Contributions

Conceptualization, Z.L., T.C. and Z.S.; methodology, Z.L. and T.C.; software, Z.L. and T.C.; validation, Z.S.; formal analysis, Z.L.; data curation, T.C.; writing—original draft preparation, Z.L. and T.C., writing—review and editing, Z.L., T.C. and Z.S.; visualization, Z.L.; supervision, Z.S.; project administration, Z.L. All authors have read and agreed to the published version of the manuscript.

Funding

The research was financially supported by the National Social Science Foundation of China (No. 20CJY054 and No. 21BJL001).

Institutional Review Board Statement

Not applicable.

Informed Consent Statement

Not applicable.

Data Availability Statement

The datasets used and analyzed during the current study are available from the corresponding author on reasonable request.

Conflicts of Interest

The authors declare no conflict of interest.

References

  1. Cao, Z.H.; Qin, S.; Hao, J.M. Spatio-temporal evolution and agglomeration characteristics of agricultural production carbon sink in Henan Province. Chin. J. Eco-Agric. 2018, 26, 1283–1290. [Google Scholar]
  2. Min, J.S.; Hu, H. Estimation of agricultural greenhouse gas emissions in China. Chin. J. Popul. Resour. Environ. 2022, 22, 21–27. [Google Scholar]
  3. Duan, H.P.; Zhang, Y.; Zhao, J.B.; Blan, X.M. Carbon footprint analysis of farmland ecosystem in China. J. Soil Water Conserv. 2011, 25, 203–208. [Google Scholar]
  4. Li, M.Q.; Liu, S.L.; Wu, X.; Sun, Y.X.; Hou, X.Y.; Zhao, S. Spatial-temporal variation of farmland ecosystem carbon footprint and its influencing factors in Yunnan province. J. Ecol. 2018, 38, 8822–8834. [Google Scholar]
  5. Ran, J.C.; Ma, H.L.; Su, Y. Estimation of agricultural carbon emissions and study of carbon emission reduction potential in the five northwest provinces. J. Acta Jiangxi Agric. Univ. 2017, 39, 623–632. [Google Scholar]
  6. Sun, X.X.; Zhang, H.B.; Yu, Y.P. Temporal and spatial variation and equity of carbon source/sink in farmland ecosystems in coastal area of Jiangsu province. Chin. J. Agric. Resour. Reg. Plan. 2021, 42, 56–64. [Google Scholar]
  7. Wang, L.; Zhao, J.; Qin, L.; Guo, N.; An, J.; Jiang, Y.J. Spatial-temporal variation of carbon sources and sinks in Linyi agro-ecosystems and its influencing factors. J. Soil Water Conserv. 2015, 29, 183–187+237. [Google Scholar]
  8. Yang, H.R.; Song, G.; Yang, G.; Zhang, X.; Zhou, C.F. Carbon sources (sinks) and changes in carbon footprints of farmland ecosystems in Weifang. J. Hunan Agric. Univ. Sci. 2015, 41, 82–88. [Google Scholar]
  9. West, T.O.; Marland, G. A Synthesis of Carbon Sequestration, Carbon Emissions, and Net Carbon Flux in Agricultural: Comparing Tillage Practices in the United States. J. Agric. Ecosyst. Environ. 2002, 91, 217–232. [Google Scholar] [CrossRef]
  10. Johnson, J.M.F.; Franzluebbers, A.J.; Weyers, S.l. Agricultural opportunities to mitigate greenhouse gas emissions. J. Environ. Pollut. 2007, 150, 107–124. [Google Scholar] [CrossRef]
  11. Zhao, R.Q.; Liu, Y.; Ding, M.L.; Jiao, S.X. Study on carbon source/sink of farmland ecosystem in Henan province. Henan Agric. Sci. 2010, 7, 40–44. [Google Scholar]
  12. Zhu, Y.B.; Ma, X.Z.; Shi, Y.J. Analysis of efficiency of agricultural input and output and emission reduction potential in Henan province at country level. Chin. J. Ecol. Agric. 2022, 1–11. Available online: http://kns.cnki.net/kcms/detail/13.1432.S.20220601.1459.003.html (accessed on 14 June 2022).
  13. Zhang, P.Y.; He, J.J.; Pang, B.; Qin, M.Z.; Lu, Q.C. Spatial-temporal variation of carbon footprint of farmland ecosystems: A case study of Henan province. J. Appl. Ecol. 2017, 28, 3050–3060. [Google Scholar]
  14. Wu, G.Y.; Sun, X.J.; Yu, F.B.; Yang, L.S. Spatial correlation pattern and influencing factors of carbon productivity in China’s cropping industry. Chin. J. Popul. Resour. Environ. 2020, 30, 46–57. [Google Scholar]
  15. Li, Z.; Li, J.D. The influence mechanism and spatial effect of carbon emission intensity in the agricultural sustainable supply: Evidence from China’s grain production. J. Environ. Sci. Pollut. Res. 2022, 442–460. [Google Scholar] [CrossRef]
  16. Song, B.; Mu, Y.Y. A study on the impact of farmer specialization on low-carbon agriculture: Evidence from vegetable farmers in Beijing. J. Nat. Resour. 2016, 31, 468–476. [Google Scholar]
  17. Zhang, Z.X.; Mu, Y.Y. Can industrial agglomeration increase agricultural carbon productivity? Chin. J. Popul. Resour. Environ. 2019, 29, 57–65. [Google Scholar]
  18. Meng, J.; Fan, T.T. Analysis of factors influencing the dynamic change of agricultural carbon emissions in Heilongjiang. J. Eco-Econ. 2020, 36, 34–39. [Google Scholar]
  19. Ding, B.G.; Zhao, Y.; Luo, Z.H. Study on the EKC test and influencing factors of agricultural carbon emissions in the Yangtze River economic belt. Chin. J. Agric. Mach. Chem. 2019, 40, 223–228. [Google Scholar]
  20. Tian, Y.; Yin, M.H. Recalculation of agricultural carbon emissions in China: Basic status, dynamic evolution and spatial spillover effect. J. China’s Rural. Econ. 2022, 104–127. Available online: https://kns.cnki.net/kcms/detail/detail.aspx?dbcode=cjfq&dbname=CJFDLAST2022&filename=ZNJJ202203007 (accessed on 14 June 2022).
  21. Wang, Y.; Zhang, Y.Q.; Tian, Y.; Wang, R. Influencing actors and spatial spillover of agricultural carbon emissions in major grain-producing areas in China. J. South. Agric. 2019, 50, 1632–1639. [Google Scholar]
  22. Hu, Z.Y. Technological progress, technological efficiency and agricultural carbon emissions in China. J. E. China Econ. Manag. 2018, 32, 100–105. [Google Scholar]
  23. Chen, Y.E.; Chen, W. Research on the relationship between agricultural mechanization, industrial upgrading and agricultural carbon emissions—Empirical analysis based on dynamic panel data model. J. Agric.-Tech. Econ. 2018, 122–133. [Google Scholar] [CrossRef]
  24. Zhou, Y.F.; Li, B.; Zhang, R.Q. Study on spatial-temporal evolution and influencing factors of agricultural carbon emissions at country scale in Hebei province. Chin. J. Eco-Agric. 2022, 30, 570–581. [Google Scholar]
  25. Dai, X.W.; Yang, Y.X. Estimation, driving effects and spatial-temporal characteristics of carbon emissions from crop production in China’s provinces from 2007 to 2016. J. Sichuan Agric. Univ. 2020, 38, 241–250. [Google Scholar]
  26. Wang, R.M.; Ma, H.L.; Wang, J. Spatial-temporal variation and influencing factors of agricultural carbon emissions from the perspective of water-soil matching—Take The Yangtze River economic belt as an example. J. Resour. Sci. 2019, 41, 1450–1461. [Google Scholar]
  27. Liu, Q.; Xiao, H.F. How does the scale of farmland management affect agricultural carbon emissions? The mediating effect of factor input and the moderating effect of cultural quality. J. Rural Econ. 2020, 10–17. Available online: https://kns.cnki.net/kcms/detail/detail.aspx?dbcode=CJFD&dbname=CJFDLAST2020&filename=NCJJ202005003&uniplatform=NZKPT&v=kTggxa8WFE_FRtVlMeIIsZmGkXtNr4e9UpOnr_0IkUVRBoOebuWnpLQGy2yJwT9f (accessed on 14 June 2022).
  28. Hu, C.; Wei, W.Y.; Hu, W. Research on the relationship among agricultural policy, technological innovation and agricultural carbon emission. J. Issues Agric. Econ. 2018, 66–75. [Google Scholar] [CrossRef]
  29. Han, J.Y.; Qu, J.S.; Xu, L.; Li, H.J.; Liu, L.N. Spatial effect of agricultural finance on agricultural carbon emission intensity: Empirical analysis based on spatial Dubin model. J. Ecol. Rural Environ. 2021, 37, 1404–1412. [Google Scholar]
  30. Hu, W.L.; Zhang, J.X.; Wang, H.L. Characteristics and influencing factors of agricultural carbon emissions in China. J. Stat. Decis. Mak. 2020, 36, 56–62. [Google Scholar]
  31. Li, B.; Zhang, J.B. Temporal and spatial characteristics of agricultural carbon emissions in China and decomposition of influencing factors. Chin. J. Popul. Resour. Environ. 2011, 21, 80–86. [Google Scholar]
  32. Guo, X.; Zhang, L.M.; Hu, G.R.; Song, M.W. Analysis of driving factors of carbon emissions from crop production in central China. J. Resour. Env. Yangtze River Basin 2016, 25, 695–701. [Google Scholar]
  33. Wu, G.Y.; Liu, J.D.; Chen, Y. Spatial characteristics and spillover effects of agricultural carbon emission intensity in China. Environ. Sci. Technol. 2021, 44, 211–219. [Google Scholar]
  34. Francesco, N.T.; Mirella, S.; Rossi, S.; Ferrara, A. Analysis of global emissions, carbon intensity and efficiency of food production. J. Energ. Ambiente Innov. 2012, 87–93. Available online: https://www.researchgate.net/publication/266395060_. (accessed on 14 June 2022).
  35. Dumortier, J.; Elobeid, A. Effects of a carbon tax in the United States on agricultural markets and carbon emissions from land-use change. Land Use Policy 2021, 103, 105–320. [Google Scholar] [CrossRef]
  36. Tian, Y.; Zhang, J.B.; Chen, C.B. Spatial heterogeneity and impact mechanism of low-carbon agriculture development in China. J. China Univ. Geosci. Soc. Sci. Ed. 2016, 16, 33–44+156. [Google Scholar]
  37. Wang, X.; Ma, S.T.; Pu, C.; Zhao, X.; Wang, Y.Q.; Zhang, H.L. Study on the trend and influencing factors of agricultural carbon emissions in southwest China. Chin. J. Popul. Resour. Environ. 2017, 27 (Suppl. 2), 231–234. [Google Scholar]
  38. Tonk, K.; Tsutsui, M. An epsion-based measure of efficiency in DEA-A third pole of technical efficiency. Eur. J. Oper. Res. 2010, 207, 1554–1563. [Google Scholar]
  39. Zhang, Y.; Li, H.; Zhao, Z.H. Study on the impact of grain crop change on inter-provincial agricultural carbon emissions in China. J. Agric. Resour. Reg. China 2022, 1–12. Available online: http://kns.cnki.net/kcms/detail/11.3513.S.20220831.1438.012.html (accessed on 25 November 2022).
  40. Elhorst, J.P.; Lacombe, D.J.; Piras, G. On model specification and parameter space definitions in higher order spatial econometric models. Reg. Sci. Urban Econ. 2012, 42, 211–220. [Google Scholar] [CrossRef]
  41. Zhang, X.X.; Zheng, S.; Yu, L.H. Measurement of the green efficiency of marine carbon sequestration fisheries in China and its spatial spillover effect. China’s Rural Econ. 2020, 91–110. Available online: https://kns.cnki.net/kcms/detail/detail.aspx?dbcode=CJFD&dbname=CJFDLAST2020&filename=ZNJJ202010006&uniplatform=NZKPT&v=-u9gCMfJuVrnn-yulK13FuOTCUM4m2p5o8Ak1_KZzv_KyScytSpONso-6HB070iN (accessed on 25 November 2022).
  42. Lesage, J.P.; Pace, R.K. Introduction to Spatial Econometries; Chapman and Hall/CRC Press: Boca Raton, FL, USA, 2009; pp. 155–165. [Google Scholar]
Figure 1. (a) CE of main crops in 2001, (b) CE of main crops in 2007, (c) CE of main crops in 2013, (d) CE of main crops in 2020, (e) CEI of main crops in 2001, (f) CEI of main crops in 2007, (g) CEI of main crops in 2013, and (h) CEI of main crops in 2020. 1: jiyuanshi, 2: xinyangshi, 3: zhumadianshi, 4: sanmenxiashi, 5: luoyangshi, 6: pingdingshanshi, 7: luoheshi, 8: xuchangshi, 9: zhengzhoushi, 10: jiaozuoshi, 11: anyangshi, 12: hebishi, 13: xinxiangshi, 14: kaifengshi, 15: zhoukoushi, 16: shangqiushi, 17: puyangshi, and 18: nanyangshi.
Sustainability 14 16569 g001
Table 1. Carbon emission factors and reference sources for various agricultural inputs or sources.
Carbon Sources for Main CropsCarbon Emission CoefficientReference Sources
Fertilizer0.897 kg/kgTian, Y. et al. [36]
Pesticides4.9341 kg/kgWang, X. et al. [37]
Mulch for agriculture5.180 kg/kgInstitute of Agricultural Resources and Nanjing Agricultural University
Diesel fuel for agriculture0.593 kg/kgIPCC (UN Intergovernmental Panel on Climate Change)
Agricultural plowing3.126 kg/hm2IABCAU (Institute of Agronomy and eco-environment, China Agricultural University)
Irrigation uses energy19.8575 kg/hm2Wu, G.Y. et al. [14]
Data source: Based on the relevant data collated.
Table 2. Various types of variables and definitions.
Variable NameVariable SymbolVariable Definition
Technical efficiency of main grain crop productionPEThe total output of rice, maize, and wheat was calculated by EBM model, and the total sown area, direct cost, and employment quantity were taken as three input indexes
Concentration level of staple crop productionPCThe total output value of rice, maize, and wheat of each city/total output value of grain of each sub-city area)/(total output value of rice, maize and wheat of Henan province/total output value of grain of Henan province
Structure of grain industryGISThe actual total amount of agricultural import and export in each municipality accounts for the proportion of agricultural added value
(The actual total amount of agricultural import and export of each municipality = (agricultural value added/gross national product of each municipality) ∗ total amount of agricultural import and export of each municipality)
The openness of agricultureAOThe total output value of rice, corn, and wheat accounts for the proportion of the total output value of grain
Level of UrbanizationULThe population of cities and towns as a proportion of the total population
Proportion of fiscal expenditure on agricultureAEThe expenditure of agriculture, forestry, and water affairs accounts for the proportion of the total financial expenditure of each city
Proportion of total fiscal expenditure on environmental protectionEPEEach city energy conservation environmental protection expenditure accounts for each city finance total expenditure proportion
Table 3. Global Moran Index of CEI for main crops.
YearCarbon Matrix
20010.047 ***
20020.046 ***
20030.047 ***
20040.047 ***
20050.046 ***
20060.047 ***
20070.047 ***
20080.047 ***
20090.047 ***
20100.047 ***
20110.047 ***
20120.047 ***
20130.047 ***
20140.047 ***
20150.047 ***
20160.047 ***
20170.047 ***
20180.047 ***
20190.047 ***
20200.047 ***
Note: “***” indicate significance levels of 1%.
Table 4. Dynamic SDM regressive results of main factors affecting CEI of main crops.
VariableCarbon Matrix
EstimateZ Value
C E I ( 1 ) 0.9597 ***53.90
P E −0.2354 ***−5.43
A O −0.089 **−2.28
U L −0.1028−0.83
P C −5.4758 ***−3.79
G I S 6.1852 ***3.93
A E −0.0303−0.76
E P E 0.10871.06
W * P E 0.9432 ***2.82
W * A O −0.7985 ***−3.58
S p a t i a l −0.4087 ***−3.14
R 2 0.310
L o g l i k e h o o d −970.2440
Note: “**” and “***” indicate significance levels of 5% and 1%, respectively.
Table 5. Spatial effect decomposition of CEI of main crops.
VariableDirect EffectSpatial Spillover EffectTotal Effect
EstimateZ ValueEstimateZ ValueEstimateZ Value
C E I ( 1 ) 0.9436 ***52.480.5020 ***5.511.4456 ***14.51
P E −0.2645 ***−7.240.7739 ***2.800.5094 *1.79
A O −0.0682−1.60−0.5602 ***−2.91−0.6284 ***−3.11
U L −0.1152−0.870.67401.370.55881.07
P C −5.9440 ***−3.635.73290.91−0.2111−0.03
G I S 6.6490 ***3.72−4.7028−0.691.94620.27
A E −0.0158−0.41−0.4051−1.56−0.4209−1.62
E P E 0.05930.611.1441 *1.721.2034 *1.77
Note: “*” and “***” indicate significance levels of 10% and 1%, respectively.
Publisher’s Note: MDPI stays neutral with regard to jurisdictional claims in published maps and institutional affiliations.

