Abstract
Several research and development efforts have been made to ensure food security in developing countries. Dissemination of improved agricultural technologies was used as the main avenue through which some increases in food supply have been achieved. However, food insecurity remains a major challenge. This paper argues and provides empirical evidence that reducing food loss and waste can be an effective food and energy security, and natural resource, and environmental conservation strategy. Following the life cycle framework, the annual amount of wheat-based food lost or wasted from farm-to-fork in Morocco was estimated at 4 million tons (equivalent to 36% of total supply) valued at US$1.0 billion. Among all nodes, the magnitudes of farm management-related losses, wastage during consumption, and storage losses rank first to third accounting for about 17.4%, 7.92%, and 7.06%, respectively of total wheat supply in the country. Were these losses and wastes entirely prevented, Morocco would have been able to feed 29.3 million more people, or save 1.79 million hectares of land, 2.66 billion m3 of water, and 64.28 million GJ of energy, and prevented the emission from landfills of at least 16.61 million kg of methane annually. Besides the ongoing efforts to disseminate agricultural technologies, the Moroccan government needs to develop short- and medium-term national strategies to reduce food losses and wastage particularly targeting the storage and consumption nodes. Replacing bread subsidy with food vouchers targeting only the needy and creation of public awareness about the magnitudes and consequences of food loss and wastage alone may go long way in reducing them.
1. Introduction
Food loss is a measurable reduction in foodstuffs, which can be either quantitative or qualitative [1]. Quantitative food loss involves loss of physical substance, which results in a reduction in the weight and bulk of food. It is therefore possible to use scales or volumetric units to measure it. On the other hand, qualitative losses involve changes in the consumptive, nutritional and reproductive value of products. While visual assessments can be used for evaluation of qualitative changes in food, especially in terms of its fitness for consumption, assessment of qualitative changes involving nutritional and reproductive values require chemical and biological testing.
Food loss and wastage can happen at the different nodes of the value chain (Figure 1). For wheat, losses can start on the field during the growing period due to poor management, after physiological maturity in the form of shattering and bird attack due to late harvesting, and during manual or mechanical harvesting and bagging. Losses can also occur during transportation from farm to storage, from storage to grain cleaning and grading facilities, and further to distribution networks. Losses also occur during storage, grain milling, processing, and marketing. The worst of them all, because of its ethical and moral implications, is the loss that takes the form of wastage at households and restaurants before or after food is prepared which is often a result of carelessness and lack of proper planning.
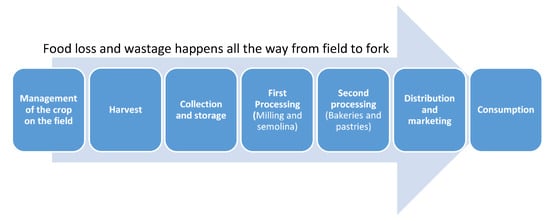
Figure 1.
Important nodes for loss and wastage in crop value chains.
In the North African region, the level of postharvest loss alone for cereals is estimated at 14–19% [2]. National estimates of losses in the grain supply chains are rare, and if any, mainly concern the storage phase, which appears to be a stage that involves large amounts of losses. In Morocco also, there has been few studies to quantify the amount of food lost, especially on the field but most of them are old. Besides fruits and vegetables, the wheat value chain in Morocco is one of the most visible sources of all the kinds of losses in the pre- and post-harvest phases and even at the consumption phase. In fact, due to the rudimentary technologies used during production, marketing, and processing, and the sale of bread at a highly subsidized price, considerable losses are believed to be happening across the entire wheat value chain which became the motivation for this study.
A combination of several methods and data sources are used here to generate estimates of food losses and wastage at each node of the value chain in Morocco. Whenever possible and when cultural barriers don’t prevent, physical measurements of losses were carried out. Otherwise, farm household surveys, interviews with different actors along the entire value chain were employed, and whenever available, company records were consulted. By providing estimates of losses at each node of the entire wheat value chain, this study aims to provide important information (the first of its kind in the country) which we believe will be useful to raise awareness about the scale of loss and wastage, help the government set priorities for interventions, and for identifying areas of research in the overall effort to reduce losses in the country. The estimates of impacts on food security, natural resource, energy, and the environment are also expected to reveal the ugly faces of food losses and wastage which are often unknown to many thereby opening the eyes of policy makers. The information generated in this study will also be useful for donors, development practitioners and extension personnel.
2. The Wheat Sector in Morocco
2.1. Importance, Demand, and Supply
The cereal sector is placed at the heart of the development of the agricultural sector in Morocco. It represents 62% of total national cultivated area and 55% of total value-added from crop production [3]. It provides source of livelihoods to 1.5 million farming households and helps to meet the needs of 34 million consumers of basic food and nutrition [4]. With a 10-year average area of about 2 million ha and accounting for 45% of the total cereal area, soft wheat remains the most important cereal in Morocco. When soft and durum wheat are combined, wheat is by far the most important crop covering about 2.9 million ha (65% of total cereal area). During the study year (2016/2017), the area sown with the main autumn cereals (soft wheat, durum wheat, and barley) and spring cereals (corn and rice) was about 4.4 million ha with total production of about 9.9 million tones (Table 1).

Table 1.
Distribution of areas of cereal crops in Morocco for the 2016/2017 agricultural campaign.
Cereals provide Moroccans with three quarters of their protein and two thirds of their calorie intakes annually. With an annual consumption of about 200 kg/capita/year, domestic production of cereals falls short of meeting the national demand [5]. Particularly, the demand for wheat-based products has been increasing over the years for which Morocco relies on large volumes of imports to meet the shortfall. For example, during 2016, bad weather has caused domestic production to fall to only 3.5 million tons thereby causing the country to import a record high of about 5 million tons [6]—costing the country over US$1.75 billion.
Given that 85% of total wheat production in Morocco is under rainfed conditions, domestic supply of wheat is intricately linked to climatic conditions, particularly precipitation. When rainfall is low, the producers generally prefer to save on farm expenses, particularly fertilization as crop response is associated with moisture levels. Adoption of improved varieties and other agricultural technologies in the country is also low [7]. The average landholding, which barely exceeds 5 ha for 70% of the farmers, also contributes to the complexity of wheat farming, especially in terms of mechanization.
Although domestic production levels have fluctuated and demand increased over the past decade, import of soft wheat which represents the bulk of imported cereals, has generally shown a significant downward trend. In the absence of area expansion, this reflects an improvement in productivity and hence production levels. However, current yield levels in Morocco are still much lower than the potential [7].
2.2. Value Chain
The wheat value chain in Morocco is complex involving several actors with different goals and aspirations. Figure 2 below presents the different actors in the wheat value chain in Morocco and their linkages.
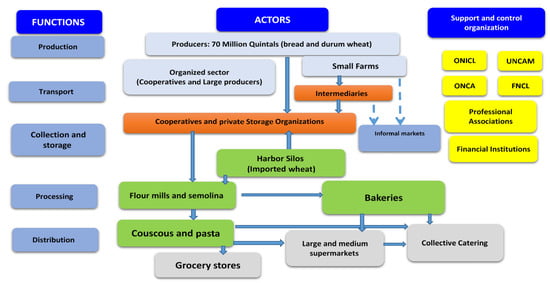
Figure 2.
Important Actors and Linkages in the Wheat Value Chain in Morocco. Key: Arrows represent transportation. ONICL: Created in 1937, the National Office for Cereals and Legumes (ONICL), is responsible for monitoring and stabilizing the market. ONCA: National Agricultural Advisory Office. UNCAM: National Union of Moroccan Agricultural Cooperatives. They intervene mainly in the importation, the collection, the storage and for some in the industrial transformation. FNCL: National Federation of Cereal and Legume Traders represents the Moroccan sector of the trading of cereals and derived products.
2.2.1. The Production Node (Including Harvest)
Cereal production systems are impacted by several factors including varietal choice, natural environment conditions, management practices, degree of maturity at harvest time, weed infestation and insect attack, shattering, and bird and rodent attacks. An experimental study in the Meknes region on three agricultural campaigns on cereal production showed that the most popular varieties of soft wheat are characterized by a high sensitivity to shattering. Thus, the drop in yield can vary on average from 0.71% to 1.2% per day of delay compared to the optimum harvest date to ensure 13% grain moisture content. As for weeds, they accentuate pre-harvest losses, header losses, sorting losses, as well as separation and cleaning losses [8]. Despite the use of chemical control with an insecticide, yield losses from pests and diseases can reach 36 to 42% for soft wheat and 32–45% for durum wheat [9].
During the harvest period, which lasts between the end of May and the beginning of September, significant losses are caused due to certain poor practices during mechanical harvesting. These losses can in some cases exceed 20% [10]. These studies have shown that the losses at the cutter bar take values of the order of 3 to 7% in the presence of lodging and if the machine is not equipped with lifter (the most common case), the figures could go up to 8 to 14%. Some settings adopted by most service providers are an additional source of loss. These include the tight adjustment of the threshing drum speed, thresher-to-thresher spacing (concave clearance) which increases breakage and sorting losses, and shriveled grains which overload the cleaning system. However, excessive losses occur mainly due to calibration problems [8]. This can be further aggravated by the rush on the side of the service providers to increase their profit margins by covering as much as 600 to 800 ha annually which are several hundred kilometers apart sometimes causing the extension of the harvest period thereby causing higher losses from shattering, bird attack, and rodents [8].
2.2.2. The Storage Node
In Morocco, the amount of wheat stored on the farm is declining because, the selling price varies only little during the year and storage carries high risk of loss-providing no or little incentive for farmers to store. As a result, most of the soft wheat is sold by farmers immediately after harvest. The only exception to this is a small part of the production which is stored on farm using traditional storage facilities for family consumption and/or seed for the following season. The most widespread traditional on farm storage system is the Matmoras which is a grain pit with a depth varying between 3 and 4 m generally dug near the house. Nationally, this storage system covers a total capacity estimated at 1 million ton which is equivalent to about 15% of total annual wheat production [11].
Large grain traders and flour mills with modern storage facilities (including at the ports) and national strategic reserve by the government represent the main actors involved in the storage of wheat. Therefore, storage of wheat is carried with the traditional and modern facilities which coexist in the country where an estimated 40% of production is stored on farm using traditional facilities (including Matmoras) and the remaining (60%) is stored off farm using modern facilities.
Traditional storage methods vary according to climatic zones, socio-economic conditions, the nature, and purpose (seeds, consumption, etc.) of the product.
Modern storage is carried by keeping grain in bags or in bulk placed either in stores (also called hangars), or in bulk in silos which often have large dimensions. The total storage capacity of modern facilities is estimated at 6.7 million tons of which over 76% is held by commercial enterprises [12]. The storage capacity held by the storage enterprises is divided into 483 depots held by different operators involved in storage and processing. The storage capacity held by industrial flour mills is around 0.95 million tons. It is intended to house the stock for the industries to ensure at least 50 days of uninterrupted milling [13].
The deterioration of stored grain is linked to many physical, chemical, and biological factors. The temperature, relative humidity, oxygen and carbon dioxide, the location and structure of the storage facilities, the crop variety, the properties of the grain, the fauna and microflora, etc., are the most important factors.
The losses take different forms including loss of viability and germination capacity, loss of dry weight, change in color and flavor, damage to starch and proteins, development of molds, and consequently loss of commercial value [14]. A good management of all these factors makes it possible to attenuate or even to stop the processes of deterioration of the quality of the stored grains [15].
Some research has been carried out in Morocco with the aim of improving storage conditions for cereals. Results showed that plastic coating of the internal surfaces of Matmoras reduces the rate of loss from to only 3 to 4% or even to as low as 1.5% per year [16] instead of 20% in the case of a straw coating [17]. As for modern storage in silos, it has been estimated that the average dry weight loss rate is between 1.6% [18] and 3.6% ([19] per year. On the contrary, the loss rates in modern stores are between 4% and 10% depending on the storage period and the ventilation conditions [20].
2.2.3. The Transportation Node
Transportation allows the distribution of harvested and imported wheat to the different regions in Morocco according to the difference between local production and demand which is also affected by the industrial infrastructure set up in each region. Transportation losses occur during transport to the factory, transshipments of grains to storage facilities and transportation from storage to processing units and loss of primary products during transportation to distribution and marketing units. Given the relatively short transport time and fairly good road infrastructure, the losses caused during this operation can be considered negligible. This could possibly be the reason why past studies that have addressed the issue of food loss have ignored transportation loss.
2.2.4. The Processing Node
Morocco has an important cereal processing infrastructure to ensure adequate supply of several products including flour, semolina, pasta, and couscous in the local markets. Flour mills and semolina mills are of two types: modern and traditional. The modern type is more industrialized with irregular geographic distribution relative to both the production and market areas [21]. There are also small traditional mills which significantly contribute to meeting consumers’ needs for cereal products which are available everywhere.
The industrial flour milling sector currently has 161 units in operation, including 137 units for soft wheat. The total national milling capacity is 10.44 million tons per year, 87% of which is dedicated to soft wheat [22].
Artisanal flour milling still plays an important role despite the progress that industrial flour milling showed over the years. Indeed, more than 10,000 units remain active for custom milling and constitute close to half of the milling of all cereals and especially durum wheat in a year of normal production. Their existence is explained by a better response to consumer preferences and their special attention towards the recovery of by-products, especially bran [21]. The pasta and couscous processing industries currently have 21 units in operation which have a production capacity of 0.31 million tons. The bakeries in the country recorded a high rate of growth over the years. For example, the number of bakeries grew from 1410 in 1999 to 2447 in 2008, which represents an increase of 74%.
Quantitative assessment of losses at the processing phase remains difficult given the lack of information available in this node. This is mainly due to the desire of the millers not to share information relating to the industrial processes (trade secret), the practice of recycling during processes and the release of processing by-products into animal feed. The more coordinated the steps (collection, storage, and processing on the same site of large volumes of wheat), the lower the losses. The practice of recycling including introduction of products (flour, semolina, etc.) into the transformation processes helps to greatly reduce losses.
The rate of grain extraction is an important factor in determining industrial production levels and losses. With the change in consumption patterns and the requirements for baking qualities, extraction rates are becoming lower and lower in order to decrease the bran content. Currently, industrial flour is produced with an average extraction rate of 75% against 81% for the subsidized flour which is intended for low-income households or 90% for artisanal flour [23]. This production gap can be considered as a processing loss in terms of direct human consumption despite the fact that some of the by-products are used as feed for animals which are consumed by humans as products of higher value. The debate is then one of whether it is healthy and economically viable relative to other feed sources.
2.2.5. The Marketing Node
Farmers deliver their production to cooperatives, private traders, or directly to flour mills. The collection and disposal of products may concern the industrial flour mill circuit or that of the artisanal flour milling particularly active in rural areas and in the working-class neighborhoods of urban centers. However, ONICL is responsible for monitoring all flows marketed especially for soft wheat with much higher quality standards set for industrial products.
Thus, the operation of marketing can be characterized by the simultaneous existence of two markets: (1) Traditional markets in which commercial transactions take place at the so-called weekly rural souks (markets) and grain halls. This market involves small and medium-sized farmers, intermediary traders (collectors) and consumers [24]. This type of transaction can be spread throughout the campaigns that often take place following the harvests, depending on liquidity needs, and the forecasts of the possible outcomes of the campaign itself [21]. Wheat that passes through this market is often intended for meeting the needs of local markets and households. However, a non-negligible part of the local production processed at these places is also transmitted by collectors to storage organizations and flour mills operating within the framework of the organized market [24]; (2) Organized markets whose marketing, storage, import, and export and industrial processing activities are controlled by ONICL by regulation. In this type of market, the government establishes a specific regime for the collection of national production for each season. The measures of this marketing regime are reflected in a campaign decree setting, particularly the conditions for the purchase of soft wheat by storage organizations and delivery to industrial flour mills for the manufacture of subsidized flour [24]. Available estimates indicate that less than 50% of wheat production passes through the organized market.
The flow of cereals sold in the national market goes through several stages from collection, sale in the souks, and conservation at the level of storage organizations until it is milled. In this circuit characterized by the multitude of players, it is difficult to quantify the losses due to poor product management practices. Given the importance of managing the stock of this commodity throughout the year, storage losses constitute a major part of the losses incurred during the marketing of cereals.
2.2.6. The Consumption Node
The average consumption of wheat-based food items in Morocco is estimated at 140 kg/capita/year which is slightly lower than the world average of 152 kg/capita/year (FNM, 2008). The consumption of industrial flour alone ranges between 60 to 100 kg/capita/year depending on the region. With urban growth, changes in lifestyle and government subsidies, there has been an increase in purchases of bread at the expense of the purchase of cereals and flour for domestic breadmaking. The estimated consumption of purchased bread is around 27 kg/capita/year—showing that domestic breadmaking is till important [23].
The new consumption habits of Moroccans and the efforts of the state to ensure the supply of these products including bread with subsidized prices within the reach of the population have led to increased intakes of these food items with which wastage has also been increasing with time. However, despite the importance of the quantities wasted, no studies have been carried to quantify the amount of bread and other wheat-based products wasted nationwide annually.
A regional study carried in 2016 by FAO reported that, food waste in Morocco is often linked to the purchasing habits of households because they often buy much more than their needs. The study also reported that food waste attains its peak during Ramadan season reaching 84.8% in Mediterranean countries including Algeria, Egypt, Lebanon, Morocco, Tunisia, and Turkey where the rite of fasting is practiced. The study stated that several dishes are prepared and thrown into the trash without even having been partly consumed. In terms of financial losses, nearly 10.7% of families in the region throw away the equivalent of $21 to $50, and 42% throw away the equivalent of $6 to $20 of food each month. Only 0.8% of households waste more than $51 worth of food [25]. The most wasted foods are bread and other products from wheat flour such as cakes and biscuits.
3. Methods for Measurement or Estimation of Food Loss and Waste at Each Node
In this study, we followed the life cycle approach suggested by [26] to estimate food losses and wastes at each node along the wheat value chain in Morocco. The study tried to first generate measurements or estimates of loss per unit area or weight of grain stored, transported, processed, marketed, and prepared for consumption at each of the corresponding nodes. Then, these results were aggregated to regional and subsequently national levels using appropriate regional area, population, housing units, and number of restaurants, processing units and market outlets as weights. As there are important distinctions in the production, marketing, and consumption patterns between the predominant (85%) rainfed and relatively small (15%) irrigated agro-ecologies, the area shares of these agro-ecologies were also used as weights during aggregation. In the estimation of pre-harvest and harvest losses, area weights not only include the irrigated vs. rainfed classifications but also area under the different harvesting methods. The results presented and discussed below for each of the different nodes are therefore weighted averages. To make all the estimations consistent and to minimize errors due to differences in moisture contents, in all steps which involved physical measurements, the grains from all the samples were oven-dried to 13% moisture before weighting. Flour and bread products were also converted into 13% moisture equivalents.
3.1. Data
For the measurement of farm-level agronomic loss estimation, data was obtained from a nationally representative sample survey of 2296 wheat fields. The survey was carried in 2014 where the sample households were randomly selected from the top 21 wheat-producing provinces of Morocco. We also collected two-year (2017 and 2018) measurement data for the estimation of pre-harvest, and harvest loss from 80 fields systematically selected from the Tadla, Benslimane, and Settat regions of Morocco out of which 15 represented the areas where manual harvesting is practiced and 65 from areas where mechanical harvesting is practiced. Each year, the samples for pre-harvest and harvest loss estimation were taken from four replications of quadrates (i.e., 1 m × 1 m area) for each sample field. Data on storage loss was obtained from 25 storage units randomly selected from five different storage facilities namely, Grain cooperative CAM Meknès, Grain Cooperative CAM Benslimane, Grain milling unit in Casablanca, Grain Milling Unit in Meknès, and Harbor Silo of Casablanca. Two-years data for transportation loss was obtained from only 4 tracks (eight observations in total), which hauled grain between the provinces of Meknes and Settat. For processing loss, data was obtained from three large processing units (one from each of the cities of Casablanca, Meknes and Settat) where a total of 37 observations were taken in two years (2017 and 2018). For estimation of marketing losses, data were obtained from surveys carried out with 80 stores, bakeries, and pastry shops selected using a stratified sampling technique from four cities, namely: Rabat, Salé, Kénitra and Témara. Data for consumption losses, were obtained from surveys carried on a total of 100 restaurants, snack bars and households selected using a stratified sampling technique from the same four cities where surveys about marketing losses were carried out.
3.2. Estimation of Losses Related to Poor Management of the Crop during its Growing Period
Management related losses are the most difficult to measure. This is because they represent production that would have been possible if the farmers used optimal management practices including the use of improved varieties, optimal planting and harvesting dates, optimal agronomic practices including methods, timing and rates of seeding, fertilization, pesticide, and herbicide applications. Experimental approaches would be the best methods to carry such measurement, and, in their absence, simulation models can be used. However, given that this involves several combinations of practices, it is practically impossible to carry experiments and suitable models that consider all the agronomic and socio-economic factors that affect yield are non-existent in Morocco as the estimates need to be carried on farmers’ fields further complicating the challenge.
This paper followed [27] and used the stochastic frontier production function (SFPF) approach [28] to indirectly estimate the level of production that is lost due to failure to apply optimal management practices (i.e., the level of production that could have potentially been realized if optimal practices were followed). The SFPF approach is a method which separates part of the error term in a regression which is purely random (outside of the control of the producer) from that which is systematic (the inefficiency component). By doing so, the model helps to provide a comparison of yields between inefficient farmers who are producing under the production frontier and efficient famers who are producing on the production frontier. The SFPF (Detailed description and discussion of the theoretical model based on the stochastic frontier production function is omitted here in the interest of space. We refer the reader to Battesse and Coelli (1995) for the modeling details) is estimated using data from 2296 wheat fields in 21 major wheat producing provinces of Morocco. Then the mean percentage efficiency level (MPEL) for the typical Moroccan farmer and then the total production-related loss (TPRL) which represents the sum of management related loss (MRL) and harvest loss (HL) were estimated as follows:
where, EMEF is the efficiency level of the most efficient farmers producing on the production frontier which is assumed to be 100%. This assumption is based on the premise that given the circumstances (weather, quantity, and quality of natural resources, available technologies, etc.) governing the farmers in the country, the estimated frontier is the maximum level a given farmer can achieve. This production frontier is less than what is obtained in experimental plots, but they are more appropriate and realistic for this analysis as they represent what farmers who follow best practices are able to produce being limited by all the challenges as the rest of their peers.
TPRL = EMEF − MPEL
Then, management related loss is computed as the difference between total production related loss (TPRL) and the sum of pre-harvest loss (PHL) and harvest loss (HL) both of which are measured (discussed below).
3.3. Measurement of Pre-Harvest Losses (PHL)
The estimation of pre-harvest losses was based on two stages of physical crop harvest sampling using manual harvesting. The first sample was taken at physiological maturity and the second one at the time of actual harvest by the farmer. Moreover, the shattered and fallen grains and spikes were collected before harvest. The samples were 1 square meter (1 m × 1 m) quadrates repeated four times in each of the sample fields. For a better representation of the entire field, attempts haves been made to evenly distribute the quadrates across each sample field.
3.4. Measurement of Harvest Loss (HL)
Considering the different harvesting methods existent in the country, harvest losses were estimated in three ways using sample sizes which are proportional to the wheat area each harvest method represents. First, manual harvesting and mechanical threshing is considered for the relatively small wheat production area in the mountains where manual harvesting is still practiced. A total of 15 farms were sampled for this measurement. Second, mechanical harvesting using farmers’ combines with their own calibration for the irrigated Tadla and rainfed Benslimane and Settat areas. For this scenario, 65 fields were sampled. Third, mechanical harvesting using farmers’ combines but calibrated by an expert from Institut National de la Recherche Agronomique (INRA). As it is difficult to interfere with the operators during harvesting for various considerations, calibration by INRA expert was carried in only eight farmers’ fields.
Calibration included: (1) the cutting level: the cutting bar was set at 20 cm height in order to reduce the incoming straw. This is inputting mostly the threshing and the plugging; (2) the distance between the threshing cylinder and the concave and the speed of the cylinder; (3) the fan blowing intensity; (4) the working speed of the combine; and (5) the time of day of operation. In all cases, the reference yields were estimated using similar sampling procedures as in the pre-harvest losses where 4 sample quadrates of (1 m × 1 m) were taken from each field, carefully cut and threshed. In the case of manual cutting in the mountain areas, 4 sample quadrates were taken after the riper passes or the hand cutting. Then, the threshing loss is estimated as the difference between the average yields from the 4 sample quadrates and the sum of the observed yield and cutting loss.
3.5. Estimation of Storage Losses
Estimation of storage losses targeted only the modern storages as they are the main method of storage in the country. At the store level, the losses were determined by placing 10 samples of 10 kg of wheat grain in special bags (Figure 3) which have meshes to allow exchange with the external environment also with the aim of measuring weight losses under real grain storage conditions at the experimental sites. The samples were distributed over two levels of the “Bardis” which is a structure containing bulk grains inside the store—the first at 2 m above ground and the second 4 m above ground. Horizontally, the samples were distributed evenly throughout the storage structure for good representation.
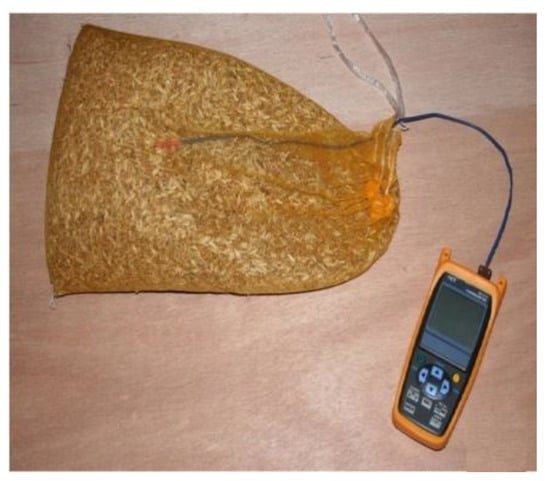
Figure 3.
10 kg bag used for sample weight tracking.
The samples were also measured for specific gravity, impurity, moisture, and broken kernels during entry and exit from the bardis. The storage structures (warehouses) studied were located at: (1) Moroccan Agricultural Cooperative of Meknes (CAM): organization dedicated to the storage of cereals located in the city of Meknes to control the production of cereals in the plain of Saïs; (2) Private store type agency located in the city of Fez; and (3) Store-type Private Agency located in the city of Azrou.
For silo storages, sampling was carried from a total of five silos: two long-term storage silos (owned by agricultural cooperatives), two silos owned by processors and one port silo owned by the government mainly used for temporary storage until the grain is shipped into the silos on mainland for long term storage. The distribution of the sample silos was as follows: (1) Two silos (one in Meknes and one in Benslimane provinces) owned by the CAM; (2) silo of a processing unit installed in the city of Casablanca; (3) silo of a processing unit installed in the city of Meknes; and (4) silo at the port of Casablanca.
Following [29], the percentage loss in grain weight (Tx) is determined using the following formula:
with:
w1: weight of the sample at the entry to storage site (kg)
w2: weight of the sample when leaving storage site (kg)
H1: moisture content of the grains at the entry to storage site (%)
H2: moisture content of the grains at the end of storage (%)
Grain samples were kept for the duration of the actual storage period until the operators decided to ship it. The duration differed depending on the storage site and the year of the experiment (Table 2).
Table 2.
Storage period in the storage sites.
During transfers of wheat between the cells of a silo, it was feared that temperature might increase, and the bags of samples may be destroyed due to friction from the high speed of grain movement. As a result, it was necessary to remove the bags during these moments and monitor and measure the factors that potentially cause weight loss including temperature and humidity. Specific gravity, impurity, moisture, and broken kernels at the entrance to the silo.
Measurement of temperature and relative humidity made it possible for us to estimate the weight loss by metabolic respiration using the following formula (Jouin, 1964):
where,
PMS = dry matter loss (Tons)
DC = heat release (MJ/ton/day).
Nj = Number of days of storage (Day)
W = weight of stored grain in tons
C = A constant factor = 1500 MJ/Ton
The heat release during grain storage is determined using the measured values of temperature and humidity as proposed by [30].
3.6. Estimation of Transportation Losses
To estimate transportation loss, the difference between the weight of transport trucks at the storage site and their weight at the destination (upon arrival at the processing plants) is taken. While transportation loss can also occur during loading and unloading, this is ignored in this study as no measurements of those losses was carried out. An initial evaluation of the results from 4 typical trucks that hauled grain in the provinces of Meknes and Settat, the distance of which, is considered to be representative of the route crossed by trucks in the country showed that transportation loss is negligible and hence data collection was limited to only the initial 4 trucks.
3.7. Evaluation of Processing Losses
Soft wheat processing operations were evaluated in three processing units located in the cities of Casablanca, Meknes and Settat. The evaluation was mainly based on a questionnaire survey with the managers of these units, but on-site monitoring of the milling process was also carried.
3.8. Estimation of Marketing Losses
Surveys to assess losses linked to the marketing of wheat-based products have been carried out with 80 stores, bakeries, and pastry shops in four cities, namely: Rabat, Salé, Kénitra and Témara. The information collected included about the weight of wheat-based products (by type) that were disposed because of either expiry date or because the optimal time for sales is passed for products which do not have expiry dates.
3.9. Estimation of Consumption Losses
Surveys for the evaluation of losses during consumption of wheat-based products were carried on a total of 100 restaurants, snack bars and households in the same four cities where surveys about marketing losses were carried out. To capture seasonal variability of consumption losses, the surveys during the first year was in the month of October while it was carried out in the month of Ramadan for the 2nd year.
4. Results
4.1. Estimates of Pre-Harvest Losses
For unclear reasons, the results obtained using the difference between measured yield at physiological maturity and actual harvest were mostly negative and hence were discarded from this estimation. A possible explanation for these counterintuitive results is non-uniform yield in each field. Therefore, the loss included in this node represent only losses related to dropped spikes and shattered grains measured just before harvest.
The results in Table 3 show that the overall pre-harvest loss (PHL) in mechanized areas is low (0.05%). This low average loss could be associated with the type of varieties used in the area which may not be susceptible to shattering but also to the harvesting operation carried out at the right time. However, other sources of loss during the phase from physiological maturity to harvest such as strong wind, rodents and ants were not measured. Pre-harvest loss is found to be much higher in the irrigated than in the rainfed areas (0.19% vs. 0.03 %). One of the major reasons behind this difference in loss would be the effect of lodging due to wind that was observed in several surveyed plots in the irrigated area. In the semi-mechanized areas, two fields out of the sample of ten were discarded because their results were extremely high and considered as outliers. The weighted average loss among the sampled farmers is 0.08% which is low. Considering the harvesting method as another weighting parameter, the National average pre-harvest loss was estimated at 0.052%.
Table 3.
Yield and area-weighted average losses in mechanized areas (as % of total production).
4.2. Estimates of Harvest Losses
The weighted average loss aggregated by Agro-ecologies, under the mechanized harvesting varied across production seasons where it was 1.8% in 2016–2017 which increased to 3.5% in 2017–2018 (Table 4). The reason is that in 2017–2018, higher rainfall was received, and yields were especially higher in the rainfed areas. Moreover, the distribution of rainfall narrowed the harvesting period which caused farmers to rush the harvesting operation causing higher harvest losses.
Table 4.
Weighted average loss (%) in mechanized areas in 2016–2017 and 2017–2018.
Considering the probability of occurrence of the specific climatic conditions in the two years (2016–2017 and 2017–2018) which were roughly estimated at 0.6 and 0.4, respectively, the aggregated average loss at the national level is estimated at 2.82%. This level of loss is less than the 3.69% reported by [31].
The study of the impacts of combine calibration was carried only during the 2017–2018 season on eight farms. The results showed that the calibration made on the combines led to a substantial (140%) reduction in harvest loss (1.77% vs. 4.31%). The loss on the experimental combine was only 0.68% which is 40% less than the commercial combine harvesters calibrated by an expert. Considering the loss levels of the small experimental combine as the best that is achievable, it is concluded that there is room for further loss reduction by improving the design and carrying out more specific adjustments and calibration on the commercial combine harvesters.
4.3. Estimates of Losses Related to Poor Management of the Crop during its Growing Period
Results of the stochastic frontier production function are provided in Table 5. Model results show that the quantities of Diammonium phosphate (DAP) fertilizer, seed, and labor and the use of improved varieties, legume-based rotation and irrigation all have positive and significant (p < 0.01) effects on wheat yield. The inefficiency model shows that the use of irrigation, size of the field, the use of certified seed and the purchase of seed from seed companies reduce inefficiency. However, the use of improved varieties is found to increase inefficiency which is counterintuitive. The possible explanations are: (1) even though these varieties are classified as improved, most of them are over 15 years old and hence might be susceptible to different diseases and pests and other biotic and abiotic stresses, (2) the higher performance of improved varieties compared to the traditional ones is mostly due to their higher level of responsiveness to agricultural inputs and optimum crop management practices to which most farmers have no access, and (3) in cases where improved varieties lead to higher yields losses tend to increase especially with poor combine calibration. This aspect could be a potential area for further investigation.
Table 5.
Parameter estimates of the stochastic frontier production and inefficiency model.
The technical efficiency levels of farmers ranged between 0.40 and 0.98 with an average national estimate of 0.67 (indicating that the mean efficiency level (MPEL) is 67%). Therefore, total production related loss (TPRL) = 100% − 67%= 33%. Given that the measured pre-harvest los (PHL) = 0.052% and the measured harvest loss = 2.82%, the management related loss during the growing period of the crop is 30.13% (i.e., 33% − 0.052% − 2.82%).
4.4. Estimates of Storage Losses
Observed weights of the samples stored in the warehouse sites during the storage periods in the two study years (2016/2017 and 2017/2018) are presented in Table 6 below.
Table 6.
Observed loss in wheat grain storage facilities.
Uncertainty of estimates = 0.19 Using the respective probabilities of receiving the weather conditions in each of the two sample years provided in Section 4.2, the weighted average loss in grain storage is estimated at 1.17% per month of storage. Physical observation of the storage conditions (ventilation, cleanliness of the building, space between cladding, sunshine, etc.) revealed that the condition in the CAM store in Meknes was better than the others providing an explanation for the lower loss rate recorded on this site. The results are comparable to the results of a previous study estimated the loss to be between 0.8 and 2% per month of storage [20]. The estimates based on the formula that uses metabolic respiration of the grains and the measurement of temperature and humidity (Equation (3)) are provided in Table 7 below. The estimates based on this approach gave an average value of 1.06% per month during the first year and 0.91% per month in the second year leading to an overall average of 0.98% per month. Physical evaluation of the silos which are the subject of our study revealed that the silos don’t have adequate ventilation and that the only treatment applied against damage caused by insects is the chemical compound called Phosphine.
Table 7.
Results of estimated loss rates in each observed silo based on formula for 2016/2017 and 2017/2018.
Similar studies carried out in the past [18,19] have shown that the loss rates vary between 0.5% to 1.2% per month of storage. In addition, comparison between the results based on physical measurement and using the formula that is based on metabolic respiration of the grains (Table 7) shows that the results are comparable, providing confidence for our measurements. Our results confirm that the formula provides an easier method for estimation of loss in grain storage given the difficulty of physical measurement due to the challenge in tracking sample weights inside the silo.
4.5. Estimates of Transportation Losses
Table 8 provides the results of the weight measurements and estimation of losses based on observation of four trucks transporting grain. For transporting wheat from the field to storage sites or points of sale, farmers either use the bulk system by placing a waterproof plastic tarpaulin in the trailer or well-placed bags. The causes of losses in transport generally correspond to tears in the bags used and also to improper handling of the bags. Given the relatively short transport time compared to the other stages of the cereals chain, the estimates provided here can be considered as the minimum expected loss during transportation.
Table 8.
Estimates of losses during transportation.
4.6. Estimates of Processing Losses
Estimates of losses during processing are presented in Table 9. The product extraction rates at the flour mills visited during the two years of the study showed comparable results. The two-year average extraction rate in the processing at Casablanca was 78% where 20% was bran. The two-year average extraction rate at the processing unit in Settat was 80% with 19% bran. The corresponding figures for the processing unit in Meknes were 79% and 21%, respectively. All bran was sold by all processing units as animal feed. From these results, it can be seen that processing takes place under fairly controlled conditions and that the losses caused are often related to rare maladjustments of the crushing machines.
Table 9.
Estimates of losses during processing.
In addition to modern processing units, one must also consider the artisanal flour mills, which number around 10,000 units nationwide. Based on the surveys that were carried out with 12 of such units in the two cities of Rabat and Salé, the rate of loss in these units is estimated at 2%. Therefore, given the share of each milling method in the total national flour production, the national average milling loss is estimated at 1.28%.
4.7. Estimates of Marketing Losses at Bakeries, Pastries and Stores
A survey of 40 stores was carried in the cities of Rabat, Salé, Témara and Kénitra. Size wise, small (37%), medium (40%) and large (23%) stores were included in the sample which was representative of the proportion of the different sizes of stores in the country. The survey included the products with high demand including durum wheat flour, soft white flour, semolina, couscous, and pasta. Summary of survey results showed that about 0.1% of the total volume of the commodities is lost per day with an estimated value of about $22.5 /ton of product sold/month. These quantities are often accidentally lost during handling or sale and are generally either disposed as waste according to 63% of the stores surveyed or given away for animal feed according to 37% of the stores.
40 bakeries and pastry shops with different sizes were also surveyed in the cities of Rabat, Salé, Témara and Kénitra in the proportion of: small (28%), medium (40%), and large (33%). Summary of the survey results showed that an average of about 1.5% total bakery/pastry products are lost. Major losses represent products which are not sold when sales are not as planned. About 52% of these are reported to be given to workers as human food and 48% given away for use as animal feed.
4.8. Estimates of Consumption Losses at Restaurants and Households
The 40 sample restaurants drawn from the four cities included in the survey are of different types where 54% were fast-food restaurants and snack bars, 23% were middle-class restaurants, and 23% high-end restaurants. Summary of the loss levels in the different restaurant types are presented in Table 10.
Table 10.
Estimates of losses in restaurants.
Wasted products constitute both leftovers after food is served and whole products that are not partially consumed. Results of the survey showed that 95% of the food waste from restaurants is either freely given or sold as animal feed with only 5% disposed-off as waste.
Surveys of 20 households during the month of October in the first year and 40 households during the month of Ramadan in the second year were also carried out in the four cities of Rabat, Salé, Témara and Kénitra. A stratified sampling method was used to draw households of different income levels. The sample constituted 14% of households with low income of <$300 per month, 58% with medium income of between $300 and $ 2000 per month, and 28% of households representing the high-income group earning >$2000 per month. Summary of the survey results on loss levels of wheat-based foods is presented in Table 11.
Table 11.
Estimation of losses in households.
From Table 11, it can be clearly seen that the loss in the second year which was carried during the month of Ramadan are higher than in the first year which was carried in October. This is quite normal given the change in consumption patterns during this holy month and more particularly with regard to wheat-based products. Also, it emerges from the table above that the loss rates differ according to the household income levels. Indeed, the higher the income, the higher the loss levels. This is because low-income households are mindful to optimize their consumption in order to avoid waste and reduce the cost of meals. The survey results also showed that 20% of the waste is given to other households for human consumption, 14% as animal feed and the majority (66%) disposed-off as waste.
4.9. Aggregation of Losses to the National Level
Any effort that aims to generate national level food loss and waste in the entire wheat value chain should consider the following factors: (1) Existence of both formal and informal channels for the movement of local production along the value chain; (2) Volume of imported wheat; (3) Types of storage structures (warehouse, silo, or traditional system); (4) Types of processing units (modern or traditional); (5) Types of restaurants (fast food, middle class, and high-end); (6) Household income levels (low, medium, and high). The assumptions adopted to calculate the loss rates at the national level, the formulas used for calculating national level losses (NLL) and estimates of the cumulative national-level losses are presented in Table 12 and Figure 4. The procedures we followed to aggregate estimates are as follows: (1) we estimated the percentage loss in each node (i.e., as percentage of the total amount entering the node) as presented above; (2) we converted those values into their equivalents as percentages of the total wheat supply in the country (local production + imports). For example, suppose total wheat supply in the country is 1000 t, the total value that entered into a given node was only 600 t, and loss at that particular node (out of the 600 t) was estimated at 10%. Then, we computed loss in that particular node as a percentage of total wheat supply in the country as: 10% × 600/1000 = 6%. We did the same for each node and these values can be sequentially added to generate the cumulative loss without double counting.
Table 12.
Aggregation of estimates of loss to the national level.
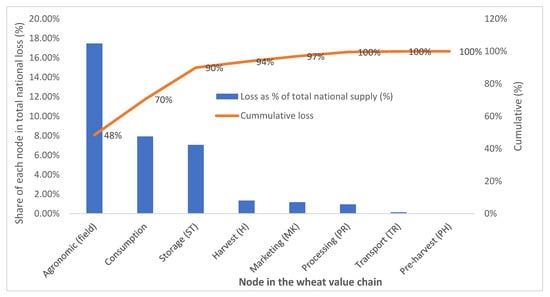
Figure 4.
Share of each node in total wheat loss in Morocco.
Based on to the assumptions made and the loss values determined in the context of this study, the overall farm-to-fork loss in Morocco is estimated at 36.08% of total locally produced and imported wheat. Post-harvest losses constitute 47.78% of the total loss while harvest, pre-harvest, and management losses constitute the remaining 52.22%. This value is comparable with other estimates in the region. For example, [27] estimated the total loss and wastage (excluding storage loss) in Jordan at 34% while [32] estimated the total loss and waste in the wheat value chain of Egypt to be 20.62%.
4.10. Implications of the Estimated Losses and Wastes on Food Security, Natural Resources, Energy Use, Greenhouse Gas Emissions
The production of food in the fields and making it available on the table for consumption by households requires the utilization of several natural resources. Therefore, the losses or wastage of food at the different stages result in unnecessary exploitation of natural resources. Moreover, had these losses and wastage been prevented, it would have been possible to feed more population or reduced the country’s dependency on imports thereby saving much needed foreign currency. Some of the social, economic, natural resource, and energy implications of the 36.08% loss and wastage in Morocco include:
Impacts on food security: the estimated losses correspond to a quantity of 4.04 million tons of wheat which, assuming a price of US$250/ton, has a value of US$1.02 billion. These levels of losses and wastes have national and household-level food security implications:
- The annual losses/wastes are equivalent to the historically highest volume of imports by Morocco during the drought year of 2016. This shows that by preventing food losses and wastes, Morocco can substantially reduce its dependency on wheat imports and at best become self-sufficient.
- Assuming the current average consumption rate of 140 kg/capita/year in Morocco, by preventing food loss and wastage, the country can guarantee food supply for additional 29.29 million people (i.e., it can feed its population almost twice over).
Impacts on natural resources: Assuming the two-year (2016/17 and 2017/18) national average yield of 2.29 ton/ha, and an average water requirement for wheat production of 1.1 m3/kg [32], and 0.79 L/kg for processing [25], the total loss from both local production and imports implies:
- Wastage of production from 1.79 million ha (equivalent to about 56.6% of total wheat land in the country); and
- Wastage of at least 2.67 billion m3 of water (regardless of the source).
Impacts on Energy utilization: applying the energy expenditure across the entire value chain from production to consumption of 16,084 MJ per ton ([27], the estimated total level of wheat loss and waste in Morocco is associated with an expenditure of at least 64.28 million GJ of energy (for tillage, harvesting, transportation, preservation, processing, and cooking) which is equivalent to 58.34% of the country’s total electric energy consumption of 110.11 million GJ in 2015 [33].
Impacts on greenhouse gas emissions: Assuming a modest 20% for the total wheat-based food waste to end up in landfills in Morocco (while the remaining 80% is reused for human consumption or animal feed), a total of 0.2 million tons of wheat-based food is estimated to go to landfills. Using a food waste to carbon dioxide equivalent conversion rate of 2.54 kg [34] and a food waste to methane emission conversion rate of 0.08 kg per kg of food waste [35], this level of food that is dumped in landfills is associated with 509.32 million kg of carbon dioxide equivalent (CO2-e) and 16.61 million kg of methane emissions into the atmosphere.
5. Policy Implications
The loss and wastage of 36.08% of total wheat supply in Morocco and the associated energy, natural resource, and environmental costs are extremely high by any standards and hence should call the attention of policy makers. The green Morocco plan (GMP) is at the heart of the national sustainable development strategy of Morocco. GMP has prioritized investment on agricultural technologies as the main vehicle to increase agricultural production through intensification. To this effect, GMP has made sizeable investment where between 2008 and 2018 alone, it has invested about US$12 billion and by doing so, agricultural GDP has increased by 5.25% against 3.8% for the other sectors. Unfortunately, except for prevention of loss in the fruit and vegetable sectors, reduction of food loss and waste was not given due policy attention. In the face of serious resource degradation and intensifying climate change, Morocco which is a dryland country heavily dependent on food imports should be intentional in making effective use of every bit of what is locally produced and imported using very much needed foreign currency. To this effect, the country should give high priority to the food loss and waste reduction policy agenda as an alternative food security strategy, design and implement effective measures, and invest on research for technological development especially for postharvest loss and waste reduction.
To ensure food security, the Moroccan government provides high level of subsidy for flour mills. For example, in 2018/19, the subsidized price of a quintal (100 kg) of soft wheat which is milled into flour was 258.8 Dirhams (Dh). At a flour extraction rate of only 81%, the actual cost of producing an equivalent amount of wheat flour was 401.69 Dh showing a subsidy level of 142.89 Dh (36%) per quintal. Given the cheap price of bread (an average of 10.76 Dh per kg) that is produced using subsidized flour, we argue that consumers (both rich and poor) don’t have incentives to reduce bread waste. Therefore, shifting the subsidy from flour mills to consumers using food vouchers that target only the needy households can be an effective strategy to reduce food waste in Morocco. Lack of awareness on the magnitude of the macro-level impacts and their implications is often the main reason for food waste. Therefore, a policy to launch a national awareness raising campaign involving public and private media, civic societies, schools, and other fora could be a good place to start.
6. Discussion
The estimated losses in some of the nodes along the wheat value chain are high necessitating the country to develop good strategies to prevent them. For example, while crop is on the field, poor management practices such as failure to use most recent improved varieties, and to carry out timely application of the right types and quantities of fertilizers, herbicides, pesticides, and appropriate agronomic and irrigation practices can lead to high level of loss of potentially realizable yield. If farmers were educated and provided with the necessary input and extension service delivery systems, these losses can be substantially reduced. While it is often negligible, loss related to shattering and bird attack can be prevented by choosing the right crop varieties and harvesting time. Encouraging the establishment of professional service providers for calibration of combine harvesters can also help in substantially reducing harvest losses. Educating all actors along the value chain about the need for careful bagging and use of fit-for-purpose vehicles can also help in reducing transportation loss.
Unlike most industrial production, agricultural production involves seasonality. In contrast, consumption of agricultural products takes place throughout the year-making storage necessary, sometimes over several months. Storage plays a particularly important role in the national food security strategy, market regulation, and maintaining prices at the desired levels by building up reserve stocks. However, storage of large volumes of wheat and wheat products carry serious risk of losses. Storage losses can be substantially reduced by implementing proper storage management practices that can involve one or a combination of physical, chemical, and biological methods [36]. Likewise, transportation, processing and marketing losses can be reduced by developing clear protocols and standards including the design and fitness of the seed packaging method and material and vehicles used for moving produce from one node to the other, developing a policy for avoiding excessive husking of the wheat grain, systematic forecasting of demand, and developing efficient inventory management systems.
Food waste at the households and restaurants mainly occur due to poor estimation of the quantity of groceries to be purchased and quantity of food to be prepared for the family and for sales in restaurants. Even after excessive purchases and preparations, lack of knowledge and needed equipment including refrigerators for preservation contribute to the problem. Above all, poor ethical and moral values, lack of awareness about the magnitude of wastage at national and global levels, and its implications in terms of food security, natural resource, energy, and environmental degradation, we argue, are the most important factors.
The estimated level of food waste is too high to be ignored. By giving the flexibility, simple measures such as introducing smaller-sized packages for wheat-based products and smaller bread loafs may help in reducing food waste. By providing flexible food vouchers to the households which need them instead of blanket flour subsidy, the Moroccan government can reduce food waste substantially. Such an arrangement will provide the poorer households to rationalize their bread purchases and be able to purchase other food items including vegetables and meats which will contribute in enhancing their nutrition. While such a policy change may also encourage the middle-income population to reduce bread waste as it becomes more expensive, it may not be high enough to induce the richer households for change. Bread subsidies given indiscriminately to both the poor and the rich substantially contribute to food waste [27]. The issue of bread subsidy in the Arab world was considered extremely sensitive (even being responsible for sparking the Arab Spring) and hence was believed to be off limits for the governments to touch. However, in 2014, Egypt which was historically known to be a country with extremely high food wastage dared to overhaul and reorient the bread subsidy system. The government decided to target only those who need help through the establishment of a voucher system, which proved to be effective in both reducing food waste and enhancing the food and nutrition security in the country [37]. The bold measure by the Egyptian government has shown that bread subsidy can be provided in a way that benefits the targeted communities as well as the country at large without necessarily leading to undesirable social unrest [32]. In 2019, similar policy changes have also been introduced by the Jordanian government which are believed to have helped in reducing food waste in the country.
We argue that the media and civic societies can also play important roles in raising awareness in the society on food loss and waste issues through: (1) holding cultural exchanges with communities which have traditional methods for preserving and recycling food and reducing wastes; (2) Incorporation of the topic in civic education at schools to target young pupils; (3) Setting regulations which necessitate agro-food industry companies to include tips and messages aimed at reducing food waste in food product packaging; and (4) Developing regulations that introduce smaller sizes of food packages and bread loaves to allow smaller families purchase the quantity of food compatible with their family size and restaurants to reduce the amount of bread they serve for solo diners and smaller parties.
Globally, the world population is expected to reach 9.7 billion by 2050 [38], which means there will be 33% more human mouths to feed most of which, will be in the poorest countries of the world [35]. To meet the projected food demand in 2050, food supplies would need to increase by 60%. Food availability can be increased through one or a combination of: (i) increased production through area expansion; (ii) increasing yield per unit area through intensification and hence increased productivity; (iii) increasing cropping intensity by using the same land to produce more than one crop per year; and (iv) reduction of food loss and wastage from the field to the fork. However, there is generally limited scope for expansion of arable lands and when it is possible, it comes at the expense of environmental health [39]. Increasing productivity through intensification is therefore the major route that had been taken and considerable achievements have been recorded over the years. However, the potential of genetic improvements and improved agronomic practices in increasing productivity seems to be approaching the right tail of the sigmoid curve for agricultural productivity. For instance, the global average annual productivity growths in the three major crops (rice, maize, and wheat) have been much lower for the period 1990–2007 than that for the period 1960–1990 [39].
If the additional wheat demand by 2050 is to be met, wheat yields must grow by 1.4% per year. This means, breeders will need to increase average global wheat yield by 0.7% per year-a rate of progress that most breeding programs are struggling to achieve, and agronomists will have to achieve yield gains of another 0.7% [40]. Achieving these targets is even more challenging in the dry areas including Morocco where agricultural production is highly constrained by water scarcity, moisture stress and drought, and land limitation and degradation. Therefore, a multifaceted approach involving the exploration and exploitation of the potential with other alternative options that will complement the additional food supply from genetic gains and improved management practices is essential.
About 1.2–2 billion tones (30–50% of global production) is estimated to be lost every year which has the potential to provide 60–100% more food for consumption [41,42,43]. This level of wastage also implies wastage of 550 billion m3 of water and 1% to 1.5% of global energy [44]. Given the magnitude of food that is being lost and wasted globally, we argue that reducing food losses and wastage can be an effective polity option for ensuring food and energy security, reducing the stress on natural resources and the environment, and in combating comate change through reduction of emissions.
7. Conclusions and Recommendations
Our analysis showed that sizeable portion (36.08%) of the total wheat that is locally produced and imported is lost or wasted across the different nodes of the value chain in Morocco. Even though it is comparable with estimates from other countries in the region, such a level of loss and wastage is alarming and calls for urgent interventions to reduce it. This level of loss is even more serious for dryland countries like Morocco, where moisture is a major limiting factor, and the natural resources are highly degraded. In such countries, every bit of food that is produced has extremely high opportunity costs. Therefore, the issue is not whether or not to reduce food loss and wastage, but rather one of how. In this regard, several interventions can be considered to reduce losses at the different nodes of the value chain.
Adoption of recent improved varieties which are tolerant to heat, drought, pests, and diseases along with appropriate agronomic practices such as conservation agriculture and optimal input use can help reduce crop loss during the growing season. Moreover, educating farmers on the optimal harvesting time and encouraging the establishment of professional combine harvester calibration services can help in reducing the pre- and harvest losses. For small farms production for own consumption and saving seed for the next year is quite important. Therefore, the use of less expensive but effective storage systems is necessary to preserve the quality of stored grain. The government can help improve on-farm storage by: (1) building local storage structures close to small processing units (artisanal mills) which are in close proximity to the production areas; (2) through the establishment of quality standards and developing mechanisms for enforcing them; and (3) providing training to help farmers adopt, assimilate, and implement improved storage management practices; and (4) providing farmers and storage service providers with subsidies for investment in modern storage units. Loss at large storage facilities can be reduced through the development of better mechanisms for aggregation of production and marketing; the use of better-quality bags in hangars; building the capacity of traders on stock management and grain quality preservation; and more importantly through the creation of grain quality grading system to provide incentives for high quality and hence investment on good storage facilities.
In the face of the sizeable food waste at the consumption node, creating awareness in the society on the extent of food waste and its implications on food security, natural resources, energy, and the environment can go a long way in reducing food waste. More importantly, replacing the blanket bread subsidy with food vouchers targeting only the needy can be an effective policy measure in reducing food waste. Finally, in the absence of a major breakthrough, the potential for genetic gains to increase food supply to meet the food demands of the world population which is projected to reach 9.7 billion by 2050 is being doubted. Therefore, reducing food loss and waste can be a viable policy option to complement the policy of agricultural intensification not only under the Green Morocco Plan (GMP) of Morocco but also globally.
Author Contributions
Conceptualization, Y.A.Y., A.A.N., H.H.; methodology, Y.A.Y., A.A.N., M.B. (Mohamed Boutfirass), E.H.B.; software, Y.A.Y.; validation, A.A.N., E.H.B., M.B. (Mohamed Boutfirass); formal analysis, M.B. (Mohamed Boughlala), E.H.B., Y.A.Y., M.B. (Mohammed Belmakki); investigation, E.H.B., M.B. (Mohamed Boughlala), Y.A.Y.; resources, H.H., Y.A.Y., A.A.N.; data curation, M.B. (Mohamed Boutfirass), Y.A.Y., E.H.B., M.B. (Mohamed Boughlala).; writing—original draft preparation, E.H.B., M.B. (Mohamed Boughlala), Y.A.Y., M.B. (Mohammed Belmakki); writing—Y.A.Y., H.H., A.A.N.; visualization, Y.A.Y., E.H.B., M.B. (Mohamed Boughlala); supervision, E.H.B., M.B. (Mohamed Boughlala); project administration, H.H.; funding acquisition, H.H., Y.A.Y., A.A.N. All authors have read and agreed to the published version of the manuscript.
Funding
This research was funded by the Arab Fund for Economic and Social Development (AFESD) agreement No. 200021, the Kuwait Fund for Arab Economic Development (KFAED) agreement No. 200001, the Bill & Melinda Gates Foundation (BMGF) agreement No. 200052, the OPEC Fund for International Development (OFID) agreement No. 200070, and CGIAR program on wheat (CRP-Wheat) agreement No. 200181. The APC was funded by CRP-Wheat.
Institutional Review Board Statement
Not applicable.
Informed Consent Statement
Not applicable.
Data Availability Statement
All data used in this study is presented in the paper.
Acknowledgments
This study was supported by the project on “Enhancing Food Security in Arab Countries-Phase II” funded by the Arab Fund for Economic and Social Development (AFESD), the Kuwait Fund for Arab Economic Development (KFAED), the Bill & Melinda Gates Foundation (BMGF), the OPEC Fund for International Development (OFID), and CGIAR program on wheat (CRP-Wheat).
Conflicts of Interest
There is no actual or potential conflict of interest what-so-ever with the publication of this article.
References
- Tyler, P.S.; Gilman, G.A. L’évaluation des Pertes Post-Récolte; Séminaire de Bamako: Bamako, Mali, 1979; pp. 137–151. [Google Scholar]
- Zaki. Proche-Orient–Afrique du Nord. In Organisation des Nations Unies pour l’alimentation et l’agriculture; Fiche d’information Conférence régionale pour le Proche-Orient; FAO: Rome, Italy, 2014. [Google Scholar]
- HCP. Prospective Maroc 2030: Agriculture 2030, Quels Avenirs Pour le Maroc? Haut Commissariat au Plan en Collaboration avec le Conseil Général du Développement Agricole: Casablanca, Morocco,, 2008. [Google Scholar]
- Rastoin, J.L.; Benabderazzik, E.H. Céréales et Oléoprotéagineux au Maghreb pour un co-Développement de Filières Territorialisées; IPEMED: Split, Croatia, 2014. [Google Scholar]
- MAPM. L’agriculture en Chiffres: Année 2016; Ministère d’Agriculture et de Pêche Maritime: Rabat, Morocco, 2016. [Google Scholar]
- FAOSTAT. Food and Agriculture Organization of the United Nations (FAO). 2017. Available online: https://www.fao.org/faostat/en/#data (accessed on 30 October 2022).
- Yigezu, Y.A.; Boughlala, M.; El-Shater, T.; Najjar, D.; Bentaibi, A. Analysis of the adoption, impacts, and seed demand of improved varieties. In Political Economy of the Wheat Sector in Morocco: Seed Systems, Varietal Adoption, and Impacts; Bishaw, Z., Yigezu, Y.A., Niane, A., Telleria, R., Najjar, D., Eds.; International Center for Agricultural Research in the Dry Areas: Beirut, Lebanon, 2019; p. 300. [Google Scholar]
- Boutahar, K. Étude technico-économique des pertes en grain à la récolte mécanisée du blé dans le Saïss. In Revue Marocaine des Sciences Agronomiques et Vétérinaires; Institut Agronomique et Vétérinaire Hassan II: Rabat, Morocco, 2011. [Google Scholar]
- Lhaloui, S.; Buschman, L.; El Bouhssini, M.; Amri, A.; Hatchett, J.H.; Keith, D.; Starks, K.; El Houssaini, K. Control of Mayetiola species (Diptera: Cecidomyiidae) with carbofuran in bread wheat, durum wheat and barley, with yield loss assessment and its economic analysis. Awamia 1992, 77, 55–73. [Google Scholar]
- Baali, E.H.; Bourarach, E.H. Les Pertes en Grains à la Récolte Mécanique des Céréales. Transfert de Technologie en Agriculture; Bulletin mensuel d’information et de liaison du PNTTA N°170; MAPM/DERD: Rabat, Morocco, 2008. [Google Scholar]
- Dahmali, S. Apport du SIG dans le secteur de stockage des céréales pour l’installation d’une unité de stockage (région Chaouia Ouardigha). Mémoire De Troisième Cycle De L’iav Hassan II Option Génie Rural, 2001. [Google Scholar]
- ONICL. Filière focus: Marché des céréales_campagne 2014-2015 Commercialisation des Céréales et des Légumineuses au Maroc; Bulletin d’information N01/2015; ONICL: Casablanca, Morocco, 2015. [Google Scholar]
- ONICL. Qualité de la Récolte Nationale du Blé Tendre en 2017. Rapport de Synthèse. Available online: http://www.onicl.org.ma/.
- Tahani, N. Stockage et Transformation de blé Tendre: Analyse et Contrôle de la Qualité de blé Tendre et des Produits de sa Transformation; Editions Universitaires Européennes: Chisinau, Moldavie, 2011. [Google Scholar]
- De Lecia, M.; Assenato, D. L’après-récolte des grains-organisation ettechniques. In Bulletin des Services Agricoles de la FAO; Organisation des Nations Uniespour L’alimentation et L’agriculture: Rome, Italy, 1993. [Google Scholar]
- Belmakki, M. Impact des conditions de stockage sur la qualité technologiquedu blé etmodélisation bidimensionnelle de transfert de chaleur dans unemasse de grains dans un silo métallique. Mémoire De 3ème Cycle De L’iav Hassan II Option Génie Rural, 2009. [Google Scholar]
- Bartali, E.H.; Debbarh, A. Evaluation et amélioration de la technique traditionnelle de stockage au Maroc. In Comptes Rendus de Séminaire International sur les Structures de Stockages des Céréales et des Légumineuses et de Leurs Dérivés; CIGR/ANAFIDE: Rabat, Morocco, 1991. [Google Scholar]
- Ait-Bella, J.; El Arabi, M. Suivi et évaluation des performances de cinq systèmes de stockage des céréales et légumineuses dans le Saiss. Mémoire De 3ème Cycle De L’iav Hassan II Option Génie Rural 1993, 20, 200. [Google Scholar]
- Bachri, M.; Lamzouri, J. Contribution à la maîtrise des techniques de stockage dans le Saiss. Mémoire De 3ème Cycle De L’iav Hassan II Option Génie Rural 1989, 15, 190. [Google Scholar]
- Reffouh, A. Suivi et évaluation des performances de cinq structures destockage sur une période de deux années consécutives. Mémoire De 3ème Cycle Del’iav Hassan II Option Génie Rural 1994, 22, 90. [Google Scholar]
- Ait-El Mekki, A. Les politiques céréalières au Maroc. Les Notes D’analyse Du CIHEAM 2006, 2006, 7. [Google Scholar]
- ONICL. Fiche Relative à la Minoterie Industrielle. March 2016. Available online: http://www.onicl.org.ma/ (accessed on 30 October 2022).
- FNM. Etude Stratégique sur les Perspectives d’évolutiondu Secteur Meunier; Programme d’Appui aux Associations professionnelles; Formation, Organisation et Conseil de Sociétés: Casablanca, Morocco, 2008. [Google Scholar]
- ONICL. Commercialisation des Céréaleset des Légumineuses au Maroc; Note sur la Commercialisation des céréales pour l’année 2010; ONICL: Casablanca, Morocco, 2010. [Google Scholar]
- Mediterra. Zero Waste in the Mediterranean. International Center for Advanced Mediterranean Agronomic Studies (CIHEAM). 2016. Available online: https://www.ciheam.org/publication/zero-waste-in-the-mediterranean/ (accessed on 30 October 2022).
- Bellemare, M.F.; Çakir, M.; Peterson, H.H.; Novak, L.; Rudi, J. On the measurement of food waste. Am. J. Agric. Econ. 2017, 99, 1148–1158. [Google Scholar] [CrossRef]
- Khader, B.; Yigezu, Y.A.; Duwayri, M.; Niane, A.; Shideed, K. Where in the value chain are we losing the most food? The Case of Wheat in Jordan. Food Secur. 2019, 11, 1009–1027. [Google Scholar] [CrossRef] [PubMed]
- Battesse, G.E.; Coelli, T.J. A model for technical inefficiency effects in a stochastic frontier production function for panel data. Empir. Econ. 1995, 20, 325–332. [Google Scholar] [CrossRef]
- Bartali, H.; Dunkel, F.V.; Seid, A.; Sterling, R.L. Performance of Plastic Lining for Storage of Barley in Traditional Underground Structures (Matmora) in Morocco. J. Agric. Eng. Res. 1990, 47, 297–314. [Google Scholar] [CrossRef]
- Jouin, C. Grundlegende Kalkulationen für die Belüftung des Getreides, Getreide und Mehl. In Beilage der Zeitschrift, Die Mühle; Verlag Moritz Schäfer: Detmold, Germany, 1964; Volume 14. [Google Scholar]
- Chafai, E.A.; Bentassil, A.; El Mekkaoui, M. Pertes à la Récolte des Céréales Dans un Pays Mediterranéen; Actes edition: Rabat, Morocco, 1996; p. 186. [Google Scholar]
- Yigezu, Y.A.; Moustafa, M.A.; Mohamed, M.M.; Ibrahim, S.E.D.; Ghanem, W.; Niane, A.A.; Abbas, E.; Sabry, S.R.S.; Halila, H. Food losses and wastage along the wheat value chain in Egypt and their implications on food and energy security, natural resources, and the environment. Sustainability 2021, 13, 10011. [Google Scholar] [CrossRef]
- UNEP. Energy Profile: Morocco. United Nations Environment Programme. 2017. Available online: https://wedocs.unep.org/bitstream/handle/20.500.11822/20524/Energy_profile_Morocco.pdf?sequence=1&isAllowed=y (accessed on 30 October 2022).
- FAO. Food Wastage Footprint: Impacts on Natural Resources; Food and Agriculture Organization of the United Nations (FAO): Rome, Italy, 2013; Available online: http://www.fao.org/3/i3347e/i3347e.pdf (accessed on 30 October 2022).
- EF. Food Waste and the Climate Crisis. A Publication of ExtraFood (EF). 2021. Available online: https://extrafood.org/the-need/food-waste/# (accessed on 30 October 2022).
- Yigezu, Y.A.; Alexander, C.E.; Preckel, P.V.; Maier, D.E.; Woloshuk, C.P.; Mason, L.J.; Lawrence, J.; Moog, D.J. Integrated Joint Pest Management Strategies in the Presence of Control Spillovers. Eur. Rev. Agric. Econ. 2013, 40, 785–805. [Google Scholar] [CrossRef]
- Moustafa, M.A.; Mohamed, M.M.; Ibrahim, S.E.; Ghanem, W.; Yigezu, Y.A.; Niane Sabri, S.; Halila, H. Enhancing Food Security in Arab Countries: Assessment of farm-to-fork losses and food wastage along the wheat value Chain in Egypt. In International Center for Agricultural Research in the Dry Areas (ICARDA) Report; International Center for Agricultural Research in the Dry Areas (ICARDA): Beirut, Lebanon, 2018. [Google Scholar]
- UN-DESA. World Population Projections. United Nations Department of Economic and Social Affairs. Available online: https://population.un.org/wpp/ (accessed on 30 October 2022).
- Pardey, P.G. A strategic look at global wheat production productivity and R&D developments. Czech J. Genet. Plant Breed. 2011, 47, S6–S19. [Google Scholar]
- CRP-Wheat. Wheat Agri-Food Systems Proposal-2017–2022. The CGIAR Program on Wheat. 2016. Available online: https://archive.wheat.org/phase-ii/ (accessed on 25 September 2022).
- Gustavsson, J.; Cederberg, C.; Sonesson, U.; van Otterdijk, R.; Meybeck, A. Global Food Losses and Food Waste: Extent Causes and Prevention; Food and Agriculture Organization of the United Nations (FAO): Rome, Italy, 2011; Available online: http://www.fao.org/docrep/014/mb060e/mb060e00.pdf (accessed on 25 September 2022).
- Trostle, R. Global Agricultural Supply and Demand: Factors Contributing to the Recent Increase in Food Commodity Prices/WRS-0801; Economic Research Service/USDA: Washington, DC, USA, 2010. Available online: https://www.ers.usda.gov/webdocs/publications/40463/12274_wrs0801_1_.pdf?v=0 (accessed on 27 July 2019).
- World Bank. 2008. Double Jeopardy: Responding to High Food and Fuel Prices. A World Bank Publication. 2019. Available online: http://siteresources.worldbank.org/INTPOVERTY/Resources/335642-1210859591030/G8-HL-summit-paper.pdf (accessed on 19 April 2018).
- Fox, T.; Fimeche, C. Global Food Waste Not, Want Not. IMechE. England and Wales. 2013. Available online: https://www.imeche.org/policy-and-press/reports/detail/global-food-waste-not-want-not (accessed on 30 October 2022).
Publisher’s Note: MDPI stays neutral with regard to jurisdictional claims in published maps and institutional affiliations. |
© 2022 by the authors. Licensee MDPI, Basel, Switzerland. This article is an open access article distributed under the terms and conditions of the Creative Commons Attribution (CC BY) license (https://creativecommons.org/licenses/by/4.0/).