Article

The Importance of Agricultural Export Performance on the Economic Growth of Indonesia: The Impact of the COVID-19 Pandemic

by
Khilda Faoziyah Arifah
and
Jonghwa Kim
*
Department of Agricultural and Resource Economics, Kangwon National University, Chuncheon 24341, Republic of Korea
*
Author to whom correspondence should be addressed.
Sustainability 2022, 14(24), 16534; https://doi.org/10.3390/su142416534
Submission received: 1 November 2022 / Revised: 2 December 2022 / Accepted: 2 December 2022 / Published: 9 December 2022

Abstract

:
The agriculture sector has been affected by the COVID-19 pandemic. In Indonesia, agriculture is the most cultivated sector, especially in rural areas. During the COVID-pandemic, agriculture survived and positively contributed to economic growth. In light of this, this study aimed to investigate the effect of the COVID-19 pandemic on agricultural export and also the impact of agriculture export during the COVID-19 pandemic on economic growth. We also give some recommendations on ways to enhance agriculture export performance during the COVID-19 pandemic. The Indonesia agricultural export quarterly panel data from the years 2012 to 2021 were analyzed with the 2SLS regression model. Agriculture export was used as an endogenous variable and the COVID-19 pandemic was used as a dummy variable to reflect the number of years since the COVID-19 pandemic began. The empirical results demonstrate that agriculture export and the COVID-19 pandemic have positively affected economic growth. A 1% increase in agriculture export and the COVID-19 pandemic may increase economic growth by 0.69% and 0.16%, respectively. In contrast, the labor force and inflation were found to have inverse effects on economic growth. Therefore, we recommend that, during the COVID-19 pandemic, agriculture export should be used as an alternative way to increase economic growth. Policies could be developed to increase the agricultural export value.

1. Introduction

The COVID-19 pandemic has caused various problems, especially health problems, for various sectors. Such problems will cause the human death rate to increase. As of April 2021, due to the COVID-19 pandemic, the number of deaths worldwide reached more than 3 million people, including more than 1.5 million confirmed COVID-19 cases [1]. This situation indicates that the pandemic is still a big problem for all countries in the world, including Indonesia. Up to April 2021, 1.64 billion COVID-19 cases had been recorded in Indonesia with a death toll of 44,594 [2]. This value has decreased compared to that in 2020. However, the COVID-19 pandemic still affects various sectors of Indonesia’s economy.
Agriculture is a sector that was significantly affected by the COVID-19 pandemic [3]. In Indonesia, agriculture is the sector that represents many people’s livelihoods, especially those living in rural areas, and it is deeply rooted in the lives of some Indonesians [4]. Work in the agriculture sector does not require a high skill level. Indonesia’s young people tend to work in industrial or service sectors that are associated with a high-level of prestige. Consequently, the agriculture sector has been deprioritized. Indonesia’s agriculture sector has been facing an aging farmer problem, which is associated with farmers having difficulty adopting technologies or innovations [4].
The agricultural contribution to GDP grew by 16.24% in the second quarter of 2020, as opposed to other sectors that had negative growth rates during the COVID-19 pandemic [5]. In addition, the agricultural sector contributed 2.15% to economic growth and absorbed 29.76% of the labor force, making it the largest labor-absorbing sector in the third quarter of 2020. This percentage is 2.23% higher than that of the previous year. Thus, in the COVID-19 pandemic era, agriculture has become one of the savior sectors amidst the worsening economic recession [6,7].
As this pandemic spread worldwide, many countries instituted a policy to prevent the spread by mandating social distancing in all aspects of daily life. This policy affected the economic performance through trade and tourism in partner economies [8] and led to decreasing shares in world trade. The WTO reports that the volume of world trade decreased by 14.3% in the second quarter of 2020. Trade in agricultural commodities also experienced a negative growth rate with a fairly large range of 14.1% to 38.39%, compared to that before the COVID-19 pandemic [9].
In Indonesia, the first case of COVID-19 was found in March 2020. During the pandemic, the growth of agricultural export increased by 8.73% compared to the year prior to the pandemic. This positive growth was larger than that of other sectors, such as the processing industry and non-oil industry, which experienced positive growth rates of 5.02% and 3.66%, respectively. Meanwhile, the mining and other sectors had negative growth rates of 5.76% and 39.44%, respectively (see Figure 1).
Many studies on the consequences of agriculture export performance on economic development have been carried out with a focus on countries and companies [10,11,12], but the results have been mixed. Earlier studies found a favorable association between export growth and economic growth [13]. Export growth has a positive impact on economic growth [14,15,16,17] and there is causality behavior between trade and economic growth [18,19,20,21]. The latest study investigated the relationship between agricultural export and economic growth. Using panel cointegration methods and granger causality, a long-term relationship between GDP and agricultural export [22] and a unidirectional and bidirectional causal relationship between banana and cocoa export [23] were identified. Further, Kyaw [22] investigated the relationship using a fixed-effect equation and found a positive relationship between agricultural export and GDP growth. This research also demonstrates that capital formation and employment were found to affect economic growth. A panel data analysis of the relationship between exports and economic growth using the three-stage least square technique [24] indicated positive feedback and a bidirectional relationship. Additionally, the relationship between agricultural export and economic growth was found to have a strong beneficial impact, and GDP had a positive and important relationship with agricultural export [25].
As the pandemic spread throughout the world, many countries took action to reduce the spread by implementing social distancing policies. This affected trade as a result of limited movement and isolation. Several studies about the impact of the COVID-19 pandemic on trade have been conducted but were limited. In Hayakama and Mukunoki [26], the gravity equation model was used to examine the impact and report the significant influence of the COVID-19 pandemic on worldwide trade. Another study by Beckman and Countryman [27] examined the impact of agriculture on COVID-19 economic analysis using the CGE model and found that agriculture has played a crucial role in economic change during the pandemic. Firm-level survey data demonstrated that agricultural firms have experienced lower export rates during the COVID-19 pandemic, except for grain and oil exports. Additionally, small firms are more vulnerable than large firms [12].
In Osabohien et al. [28], agricultural trade and FDI’s impact on inclusive growth were investigated. This study was conducted in west Africa and examined the potential issue of endogeneity using the two-stage least-square method. The findings reveal that agricultural trade can explain inclusive growth. This means that agricultural trade can boost inclusive growth. In Indonesia, the impact of the COVID-19 pandemic on agricultural export was examined by Maulana [29], and it was found that the COVID-19 pandemic has had no important effect on agricultural export based on the t-test method, but an important effect was detected when using the F-test.
However, research on the impact of agricultural export on economic growth during the COVID-19 pandemic in Indonesia has not been widely carried out. Most previously conducted studies lack generalizability, because the place of study was country-specific, so the results cannot be generalized to other countries. Additionally, according to Maulana [29], data was only examined partially, not simultaneously. This study aimed to fill this gap and determine the contribution of agricultural exports to economic growth during the pandemic situation. This study generally aimed to look at the impact of agricultural export performance during the COVID-19 pandemic on economic growth, using a two-stage least-square regression analysis to solve the endogeneity problem and to explain the simultaneous effects of the variables.
In this paper, following this introductory section, we present the conceptual framework, Section 3 presents the materials and methods, Section 4 provides the results and discussion, and the conclusions of the study as well as some implications are presented in Section 5.

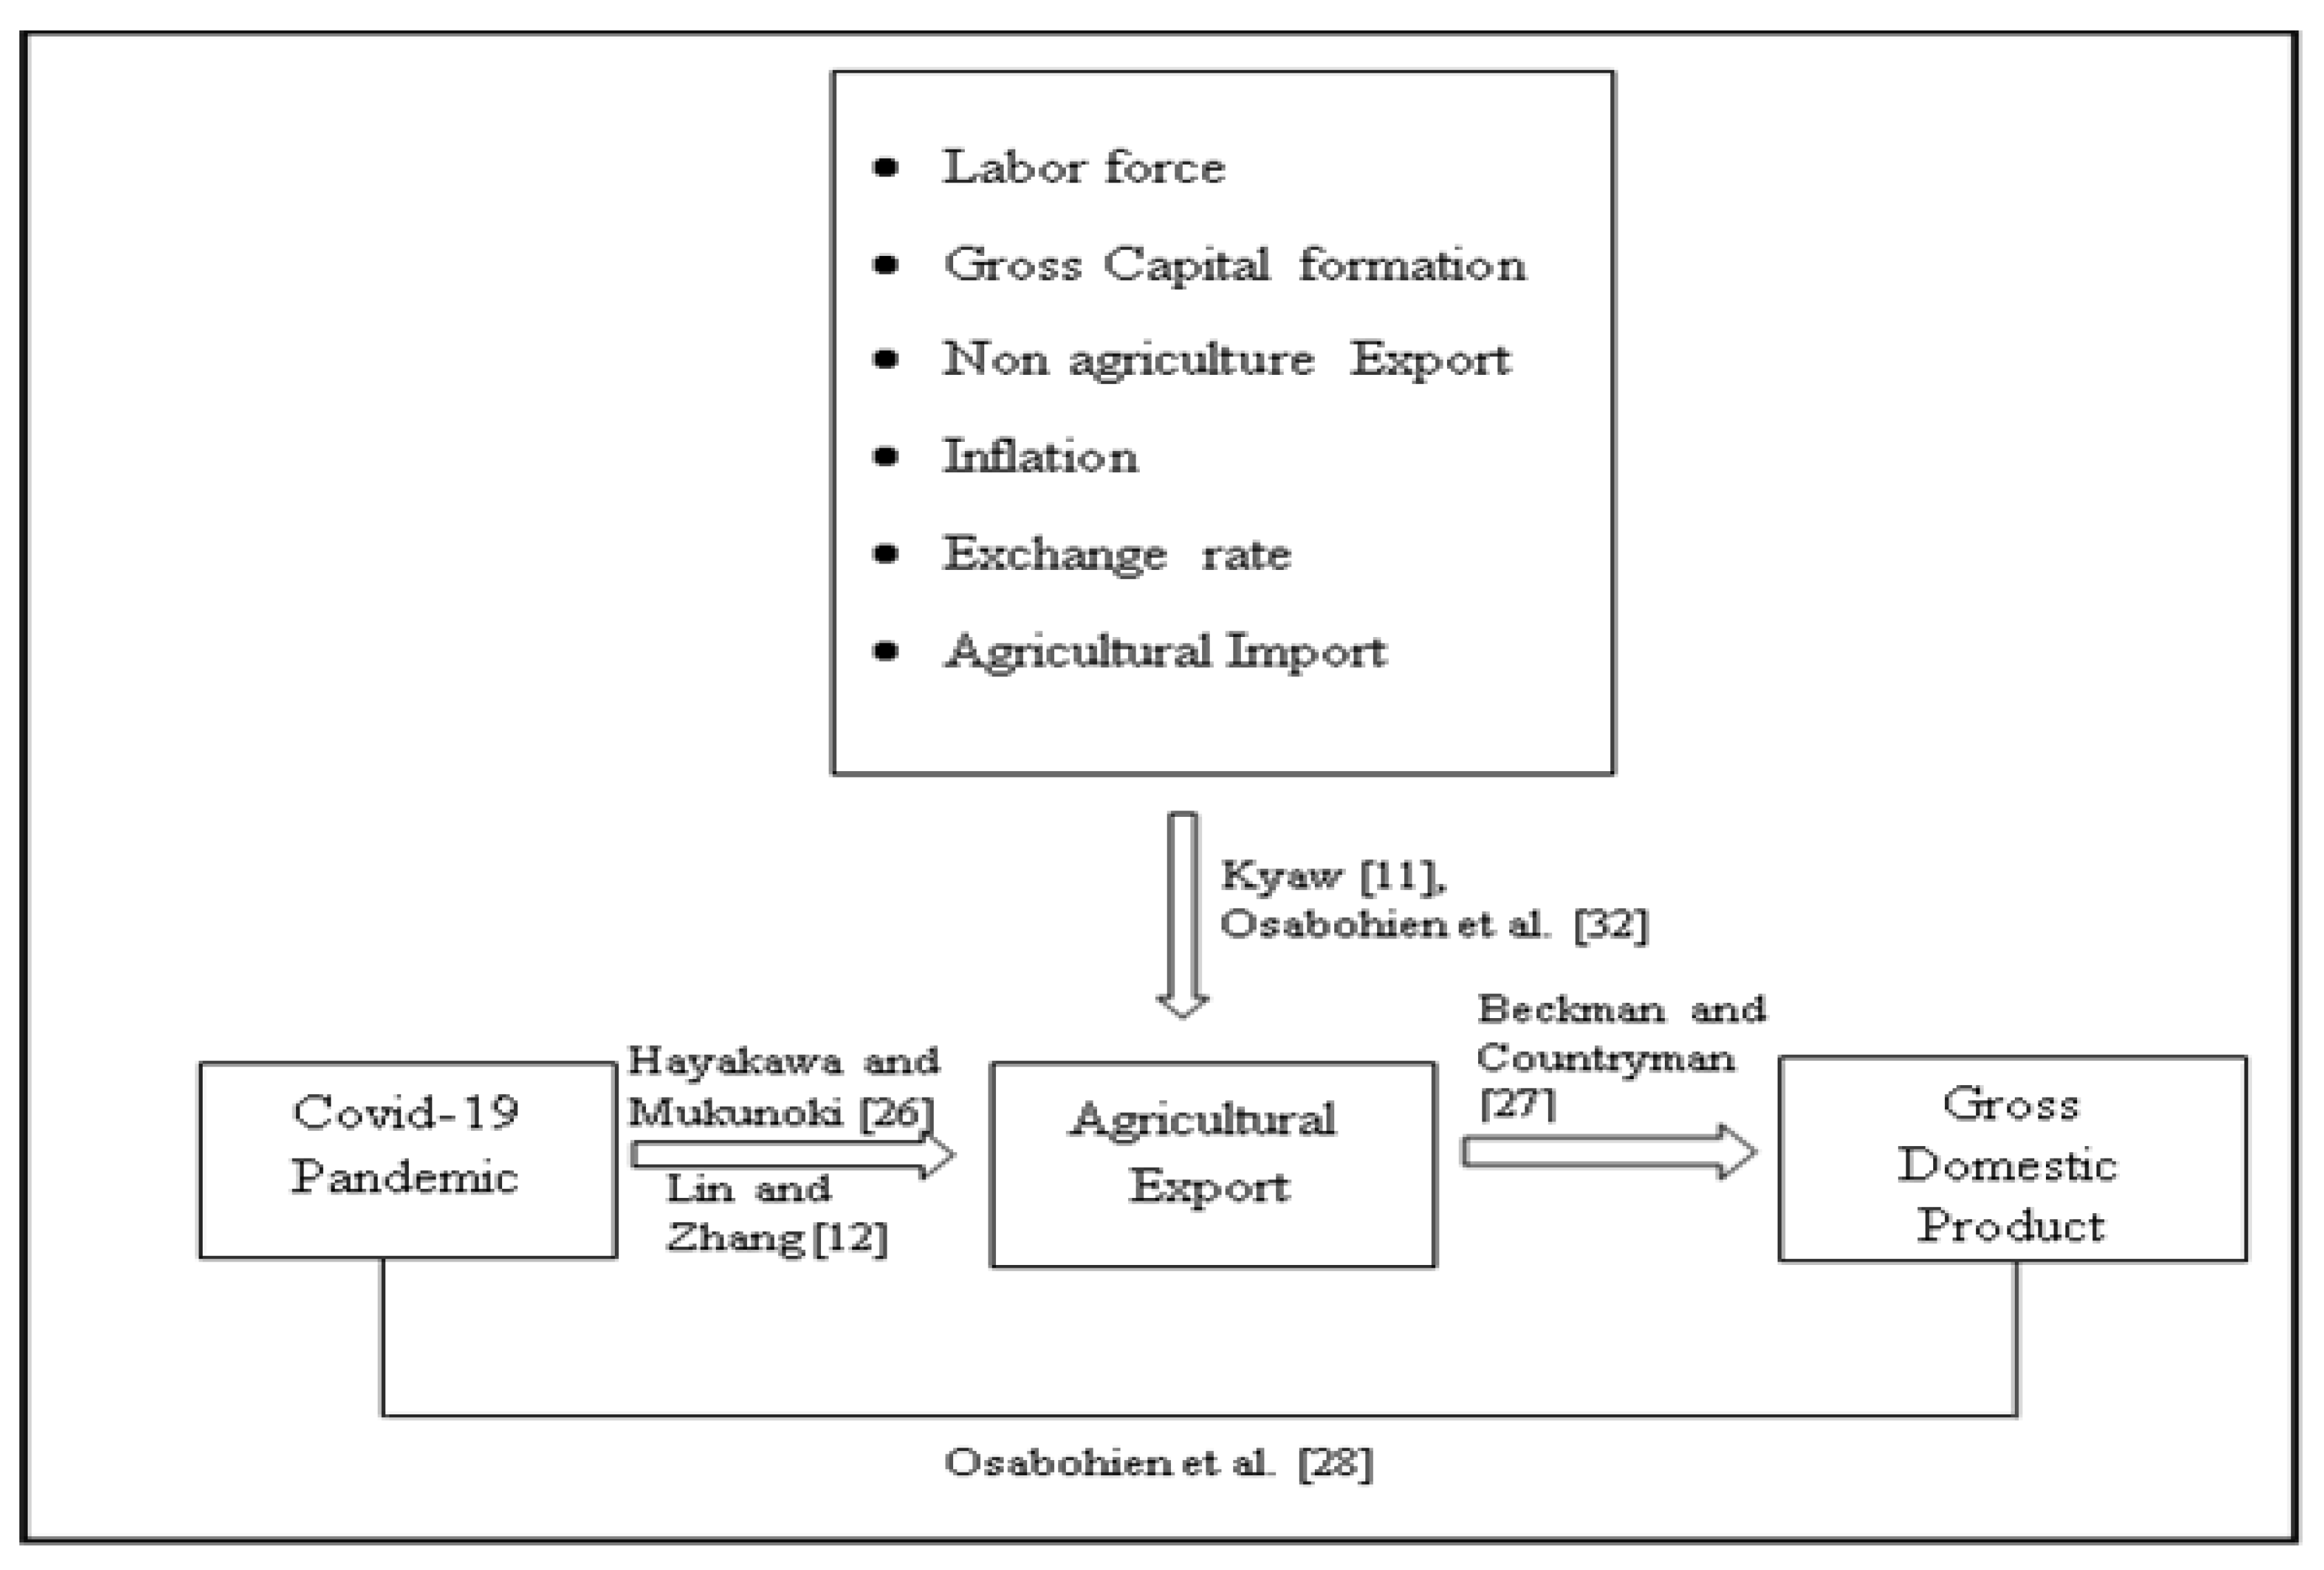
2. Conceptual Framework

The economic growth concept is based on growth theory. Classical growth theory suggests that production is an activity carried out to utilize resources and is determined by labor, capital, and land. Another growth theory is neoclassical theory. This theory suggests that technology can increase economic growth. This means that economic growth may be affected by macroeconomic factors. In addition, economic growth can be influenced by the growth of trade, and the impact varies from one region to other, depending on the ability of the region to utilize its comparative advantages [28].
The hypothesis theory of export-led growth describes the link between agricultural export and economic growth [22]. This link is made by income growth from the foreign trade multiplier, foreign exchange [30], and competition in the market. Based on endogenous growth theory, export leads to more efficient production and growth [31]. According to Osabohien et al. [32], the volume and value of agricultural export can increase the share of agricultural export and decrease the portion of non-agricultural export and agricultural imports in global trade. This means that agricultural export is significant for economic growth and is affected by macroeconomic factors, such as gross capital formation, non-agricultural export, exchange rate, agricultural import, and inflation [11].
In Indonesia, agriculture is one of the commodities exported. During the COVID-19 pandemic, agriculture export experienced a positive increase and a large growth rate of 8.73%, compared to previous years before the pandemic (see Figure 1). However, this is a different situation compared to that described in [12,26,33], which stated that trade activities worldwide came to a halt and agricultural export volumes decreased during the COVID-19 pandemic, having a negative effect on economic growth. Additionally, in Indonesia, agriculture is considered a labor-intensive sector that is able to absorb labor with a low production cost. This means that the cost of producing agricultural products is kept low, so products can be exported at low prices.
Many types of research have recently been conducted to analyze the correlation between agricultural export and economic growth. According to Negem, Henneberry and Khan, and Osabohien et al. [24,25,28], the correlation between agricultural export and economic growth can be measured by simultaneous regression analysis methods, such as the 2SLS (Two-Stage Least-Square). This type of analysis can solve the endogeneity problem and explain simultaneous effects of the variables. Agriculture export can be affected by variables such as the labor force, gross capital formation, non-agriculture export, inflation, exchange rate, and agricultural import [11,32], and agricultural export can influence economic growth [27], which means that agriculture export is an endogenous variable, and the correlation between agricultural export and economic growth can be measured by 2SLS. To analyze this situation, it is important to conduct the research based on the diagram below (see Figure 2).

3. Materials and Methods

3.1. Materials

This study was conducted based on secondary quarterly panel data from January 2012 to June 2021 (see Figure 3). The reason that these data were selected is that there was complete data for each variable for these years. The agricultural export data were taken mainly from the Ministry of Agriculture database and data on another control variable mentioned in the model were sourced from the Central Bureau of Statistics, Ministry of Trade as well as the Investment Coordinating Board database. The sample comprised four groups of sectors: food crops, horticulture, estate crops, and livestock. Data from the years 2020–2021 were used to investigate the consequences of the COVID-19 pandemic on agricultural export.
The dependent variables used in this study were agricultural export and real gross domestic product at the 2010 constant price. Real gross domestic product is an indicator of economic growth. The independent variables were the dummy variables from the years before and after the COVID-19 pandemic. Control variables were also employed to reduce the influence of missing variables in this study. The control variables were inflation, to control the influence of inflation on the GDP, labor force, to control the total output, employment, the population in the national economy, and gross capital formation, to control the effect of investment on GDP. To address the issue of outliers and different measurement units, all of these variables were turned into natural log form [11]. The description variable can be seen in Table 1 below.
A summary of the variables is presented in Table 2. The statistical summary provides variables for the whole sample. In this study, the standard deviation was decomposed into two distinct dimensions to provide comparable insights within (intra-sector) and between (inter-sector) values of the mean, standard deviation, minimum, and maximum variables in the panel data. The overall values were calculated based on 152 sub agriculture sectors, while the between data comparisons were calculated based on quarterly data from four agriculture subsectors: food crops, horticulture, plantation, and livestock. The within data comparisons were observed from 38 quarterly data points.
It can be seen that the overall panel mean of agriculture export is USD 480,123.90. The averages value fluctuates slightly among each commodity sector (from USD 99,615 to 1,063,842). Meanwhile, the agricultural export within value was observed to be between -USD 449,019.8 and USD 807,787.3 during the 38 quarters. Thus, we cannot conclude that every commodity sector has a negative value.
Similarly, the overall sample mean of the gross domestic product (GDP) at a constant price is 58,624.20, which means that, on average, Indonesia’s GDP from the agriculture sector is 58,624.20 billion rupiahs. There is a gap among commodity sectors, where the lowest value is 33,985.40, while the highest is 90,480.10. The gap indicates that over the 10 years of quarterly data, the value of GDP from agriculture has increased. In terms of mean values of other variables, the labor force contains 9.6 million people, the capital formation is 5,407.90 billion rupiahs, and the mean value of non-agriculture export is 42,327.70 million USD.
Table 3 presents the mean and standard deviation values of variables in each commodity sector. The food crops hold the lowest position in the mean values of agriculture export, gross capital formation, and agricultural import but hold the highest positions in the mean value of the labor force and non-agricultural export. Horticulture holds the lowest position in terms of the growth of the economy and labor force. Plantation holds the highest position in terms of the mean value of agricultural export, the growth of the economy, and gross capital formation, as well as the lowest position in terms of the mean values of non-agricultural export and inflation. Livestock holds the highest position in terms of the mean values of inflation and agricultural import.
In terms of agriculture export, the lowest export value is USD 99,615.07 for the food crops, and the highest export value is USD 1,063,842 for the plantation sector. Regarding the growth of the economy, the lowest income is 33,985.38 constant rupiah in 2010 in the horticulture sector, and the highest income at the 2010 constant price is 90,480 billion rupiahs for the plantation sector. In contrast, for the labor force, the mean value of food crops is the highest with 14.74 million people, while the mean value for horticulture is the lowest at 5.96 million persons. The level of labor force is considered very high in the food crop commodity sector more than one and a half times the average mean for the overall panel of 9.6 million people.

3.2. Methods

To achieve the objectives of this study, the analysis was conducted based on the panel data regression and two-stage least-square methods. Panel data regression is a method that aims to model the effect of one or more predictor variables on the response variable. It is used in some sectors of an object of research for a specific period of time. The techniques used to analyze the panel data were the fixed effect, random effect, and feasible generalized least-square. The fixed effect assumes that the subsector-specific effects of agriculture export are not correlated with the exogenous variable. In contrast, the random effect assumes that the subsector-specific effects of agricultural export are correlated with the exogenous variable. However, the feasible generalized least-square method assumes that there is a certain degree of correlation between the residual in the regression model. This means that the FGLS is used when the panel data have heteroscedasticity, cross-sectional correlations, and autocorrelations.
Following the methods of previous studies [24,28], for panel data analysis, the correlation between agricultural export and economic growth can be estimated by the 2SLS regression analysis method. The 2SLS is a technique that considers the simultaneous equations used when the dependent variable’s error terms are correlated with independent variables; this is called the endogeneity problem. To solve this problem, the 2SLS method uses instrument variables to estimate the endogenous variables. The instrumental variables must be defined based on the requirements for an instrument in which an instrument must correlate with the regressor, be uncorrelated with the error term, and have no direct cause due to independent variables. In this study, the instrument variables were the non-agricultural export and exchange rate. The non-agricultural export and exchange rate were found to have a significant correlation when tested with the pairwise correlation analysis. This means that the non-agricultural export and exchange rate are the relevant instruments. Another assumption is that the non-agricultural export and exchange rate have no direct effects on economic growth and are uncorrelated with the error term. This assumption is usually described as the exclusion restriction and homogeneity. This assumption cannot be tested, since it cannot be demonstrated in real time, but can be supported by conducting a regression analysis. The results of the regression illustrate that the agricultural export and exchange rates do not affect economic growth.
The analysis began with the test of stationary using the unit root test, the heteroscedasticity, the serial correlation test, and the cross-sectional dependence to determine the possibility of error in the data. After that, the data were analyzed by FGLS, Fixed and random effects, and the 2SLS regression methods to determine their impacts and investigate the possibility of an endogeneity problem. Lastly, the analysis was finalized with a post estimation test for the 2SLS regression methods to show whether the endogeneity problem occurred or not.
The model specifications for this study were generated by the panel data technique. This followed the methods used in Kyaw, Lin and Zhang, Hayakawa and Mukunoki, Beckman and Countryman, and Osabohien et al. [11,12,26,27,32]. The present study provides a suitable measure of the impact of agricultural export on economic growth by carrying out an empirical analysis using simultaneous regression analysis. To resolve the possible issue of endogeneity, this study applied the Two-stage Least-Square (2SLS) method. The baseline model is given in Equation (1):
L n G D P t i = β 0 + β 1 l n A E X P t i + β 2 l n L F t i + β 3 l n G C F t i + β 4 l n N A E X P t i + β 5 l n I N F t i + β 6 l n E R t i + β 7 l n I M P t i + β 8 D C O V t i + β 9 D i i t + ε t
The Two-stage Least Square (2SLS) model represent in Equations (2) and (3):
l n A E X P i t = α 0 + α 1 l n L F i t + α 2 l n G C F i t + α 3 l n N A E X P i t + α 4 l n I N F i t + α 5 l n E R i t + α 6 l n I M P i t + α 7 D C O V i t + α 8 D i i t ε 1 i t
l n G D P i t = β 0 + β 1 l n A E X P ^ i t + β 2 l n L F i t + β 3 l n G C F i t + β 4 l n I N F i t + β 5 l n I M P i t + β 6 D C O V i t + β 7 D i i t + ε 2 i t
where G D P i t represents the gross domestic product (the dependent variable), α 0 and β 0 are the constant terms, α 1 , α 2 , α 3 , α 4 , α 5 , α 6 , α 7 , α 8 and β 1 , β 2 , β 3 , β 4 , β 5 , β 6 , β 7 are the parameters to be estimated, i represents the agricultural sectors (food crops, horticulture, plantation, and livestock), 1,2…, N, t represents time, 1,2…N, and l n denotes the natural logarithm. AEXP represents agricultural export, LF represents the agricultural labor force, GCF represents gross capital formation (investment), NAEXP is the non-agricultural export, INF means inflation (GDP deflator), IMP represents agriculture import, DCOV is the dummy variable for the years of the COVID-19 pandemic, and Di is the dummy variable for sectors.
Equation (1) is the baseline model used for the panel data regression analysis, which includes the generalized least-square, fixed effect, and random effect model. The two-stage least square (2SLS) analysis was conducted based on Equations (2) and (3) with the variable instruments being non-agriculture export and the exchange rate. The justification for these variable instruments based on three conditions are relevance, exclusion restriction, and exchangeability. The analysis was performed with Stata software, and the options “first “and “vce (robust)” were added for the two-stage least-square method. The option “first” illustrates the endogenous variable as a dependent variable in the first equation. The option “vce (robust)” calculates the robust standard error to control the heteroscedasticity error, serial correlation, and cross-sectional dependence.

4. Results and Discussion

4.1. Unit Root Test, the Test of Heteroscedasticity, Serial Correlation, and Cross-Sectional Dependence

To fulfill the stationary properties of model variables, five unit root tests were conducted. The Fisher-type test, Im-Pesaran-Shim (IPS), and Levin-Lin-Chu unit root test have the same null hypothesis, while the Hadri Lagrange Multiplier (Hadri) test indicates the opposite null hypothesis of stationary variables. The “Breitung” panel unit root test was also conducted as a robustness check for the variables. The results of all unit root tests demonstrate that, at the first difference level, all variables employed in this study are stationary. It means the alternative hypothesis that all or some of the panels did not have a unit root is accepted.
For the panels data sets, there is the possibility of heteroscedasticity, serial correlation, and cross-sectional dependence. To acknowledge this, the modified Wald test for GroupWise heteroscedasticity and the Langrage-Multiplier test for serial correlation were conducted. As illustrated in Table 4, the data contain heteroscedasticity and a cross-sectional dependence error but do not have a first-order correlation (serial correlation). This result suggests that, for the regression analysis conducted in this study, it was appropriate to use the standard robust error estimates and the generalized least-square to reduce that error.

4.2. Estimates from FGLS, FE, and RE

This subsection presents the results obtained from the generalized least-square (FGLS) test. The results for the analysis of the random and fixed effects are presented in Table 5. The FGLS was employed to provide a robust standard error, because the data in this study have N < T characteristics [34]. The random effects (RE) model assumes that the impacts of subsectors are unrelated to the exogenous variable. The fixed effect (FE), on the other hand, posits that subsector-specific impacts are associated with external factors [28].
The FGLS results (Table 5) demonstrate that agricultural export (log AEXP), gross capital formation (log GCF), non-agricultural export (log NAEXP), and agricultural import (log IMP) do not play significant roles in determining the rate of growth of the economy (log GDP) in Indonesia. However, even though agricultural export demonstrated no significance, it was found to harm economic growth. This is because, in Indonesia, agricultural export still depends on the primary products of agricultural commodities, so the share of receipts in the total payment balance is very low and has no sizeable impact [35]. According to Levin and Raut [36], the impact is negligible.
The labor force (log LF), exchange rate (log ER), and COVID-19 pandemic (DCOV) were identified as significant variables. The labor force was found to have a positive effect in terms of explaining the growth of the economy at the 95% level of confidence, and the exchange rate was found to have a positive effect in terms of explaining the growth of the economy at 99% CI. The labor force and the exchange rate can increase economic growth by approximately 0.03% and 1.2%, respectively. This finding is consistent with Kyaw [11], who found that labor force participation has a statistically significant effect and increases economic growth.
The COVID-19 pandemic coefficient, interestingly, has a positive relationship with the economy’s growth and is statistically significant at a level of 5%. Thus, a 1% increase in the COVID-19 pandemic could increase Indonesia’s economic growth by approximately 0.09 percent. This result is different from those of previous studies regarding the impact of COVID-19 on economic growth. Most previous studies found that the COVID-19 pandemic has harmed economic growth. The COVID-19 pandemic has led to shock and unusual changes worldwide. One of the reasons for this result is that, in 2020, which is the period in which the COVID-19 pandemic began in Indonesia, Indonesian agricultural exports experienced the highest positive growth rate compared to other business sectors: 8.73% compared to the previous year [37]. This means that agriculture export during the pandemic increased its share of income from trade, and trade investment as well as agriculture production increased. Additionally, Indonesia’s agriculture sector is a labor-intensive sector, so increasing agricultural export can increase the ability to absorb more labor and thereby increase income. However, inflation was found to harm economic growth at the 1% confidence level. This effect of inflation implies that Indonesia’s economic growth would be reduced by approximately 1%. This result is similar to that of previous research by Kyaw [11].
At the individual level of agricultural subsectors, all subsectors had statistically significant effects at different confidence levels and with different effects on growth. Firstly, the horticulture and livestock subsectors had highly significant effects at a 99% CI, but the coefficient was negative. This finding implies that a 1% increase in the horticulture and livestock sectors can decrease the growth of the economy by 0.48% and 0.46 percent, respectively, on average. Lastly, the plantation subsector had a positive effect that was highly significant at the 5% confidence level. Consequently, a 1% increase in the plantation subsector can increase the GDP of the agriculture sector by 0.21 percent, which means that if we want to increase the growth of the economy during the COVID-19 pandemic, we should increase the export of plantation export products.
The FE result presented in Table 5 illustrates that agricultural export (log AEXP), Inflation (log INF), exchange rate (log ER), import (log IMP), and the COVID-19 pandemic (log DCOV) have significant effects on economic growth. Agricultural export and inflation were found to have negative relationships with economic growth, while the exchange rate, imports, and the COVID-19 pandemic were found to have positive relationships with economic growth. The coefficient of inflation demonstrated the greatest decrease while the exchange rate was associated with the greatest increase in economic growth, with values of 0.95% and 1.02 percent, respectively.
The results of the random-effect model for agricultural export are consistent with the FE model and FGLS in illustrating a negative relationship. This consistency was also found in the results for inflation, exchange rate, and the COVID-19 pandemic. Inflation harms economic growth by an average of 0.98%. The exchange rate and the COVID-19 pandemic were found to have positive relationships with growth at confidence levels of 99% and 95%, respectively. The exchange rate was found to increase the growth of the economy the most—by 1.16%. The gross capital formation was found to have consistent positive impacts on FGLS, FE, and RE, but in a non-significant manner.
In the results for our main variables for the three regressions described above, agricultural export and the COVID-19 pandemic were found to have different effects on the growth of the economy. The export of agriculture was found to have inverse effects and was significant only in the FE regression, while for the other regressions, it had a non-significant negative effect. For the COVID-19 pandemic, consistent results were obtained with positive effects and slightly different coefficient values. To identify the most appropriate model out of the fixed effect or random effect models, the Hausman test was conducted. The probability of 0.000 was lower than the five percent significance level, so the null hypothesis that the fixed effect is not appropriate was rejected. Hence, it is better to use the fixed effect model to analyze the model regression.
This subsection presents the primary analysis, which involved the Two-stage Least-Square regression. The 2SLS estimation method is used to test the assumption of endogeneity. The instrument variable was used in the model to solve the endogeneity problem. The instrument variables were the non-agriculture export and exchange rate. Even though testing this requirement is impossible, it is done to justify the choices of instrument variables. The test of exclusion restriction with the Stata command “testex” was conducted and the result was satisfied. The regression was conducted to examine the causal effects of the instrument variable and the outcome variable. The result was not significant, meaning that the outcome is unconfounded (exchangeability). The correlation test was conducted to illustrate the correlation between the instrument and outcome variables, and the result was significant (relevance). The outcomes of this analysis are reported in Table 6.
The first stage of regression (Table 6) used Equation (2) from the model specification. From this stage, the labor force (log LF), exchange rate (log ER), and import (log IMP) were found to be statistically significant in explaining agricultural export. The results imply that 1% increases in the labor force, exchange rate, and imports will increase agricultural export by 0.13%, 1.31%, and 0.42%, respectively. On the contrary, 1% increases in the GCF, non-agricultural export, inflation, and the COVID-19 pandemic may reduce the agricultural export by 0.01%, 0.02%, 0.09%, and 0.05%, respectively, but these results were not significant.
The results from the second stage regression (Table 6) are expressed in Equation (3) in the model specifications, where agricultural export is the endogenous variable and the other variables are the explanatory variables with non-agricultural export and exchange rate as instrument variables. The results demonstrate that the gross capital formation and the non-agricultural export had no important effects, but had positive and negative coefficients, respectively. The other variables had different levels of significance and effects on the growth of the economy, especially for the two main variables: agricultural export and the COVID-19 pandemic. As an endogenous variable, agricultural export was found to have a considerable beneficial influence on economic growth. The level of significance was high, at the 1% level of the confidence interval, and was found to increase economic growth by approximately 0.7%, on average. This means that agricultural export could increase economic growth in Indonesia by 0.7%.
These findings are consistent with previous research on agricultural export in terms of its effects on the growth of the economy. Previous studies [11,22,38] demonstrated that the impact of agricultural exports on the growth of the economy is favorable and consistent with the theoretical growth theory of the export-led hypothesis theory. The export-led growth theory suggests that exports can increase growth through income growth from foreign trade multipliers and foreign exchange, the creation of competition in the market, and the creation of more efficient products.
Table 6 demonstrates that, even during the COVID-19 pandemic, agricultural export still had a positive effect on the growth of the economy. This finding is important for Indonesia’s economic growth, since agricultural export is among the sectors that contributed to economic growth in the country throughout the COVID-19 pandemic. This result demonstrates that agriculture is the only sector that has survived the pandemic [4].
At the subsector level, the results of the first stage of the two-stage least-square analysis demonstrate that all subsectors had highly significant effects at the 99% CI level. The first stage of the regression demonstrated that a 1% increase in the export of horticulture (i.ID2), plantation (i.ID3), and livestock (i.ID4) can increase agricultural export by 2.44%, 6.28%, and 1.37%, respectively, but the food crop sectors, as a basis for dummy variables, were found to have an insignificant negative effect on agricultural export. However, the results of the second stage of the two-stage least-square analysis demonstrate that a 1% increase in the export of the horticulture (iID2), plantation (i.ID3), and livestock (i.ID4) subsectors can, on average, decrease the growth of the economy by 0.82%, 0.78%, and 0.82%, respectively.
The result of the second stage of the 2SLS (Table 6) also demonstrate consistent results for the COVID-19 pandemic variable with the FGLS, FE, and RE regression analyses. The significance level is also the same at the 5% confidence level, and the coefficient value obtained for the 2SLS regression is larger than those obtained for the three previous regressions by 0.16% (0.08%, 0.06%, and 0.05% for FGLS, FE, and RE, respectively). This suggests that the COVID-19 pandemic can increase economic growth. This finding is supported by the trend for the agricultural GDP from 2020 to the 2nd quarter of 2021 (Figure 4). The increase in GDP fluctuated from the fourth quarter of 2019 until the second quarter of 2021 and the agricultural GDP increased, but from the third quarter until the fourth quarter of 2020, it decreased and then increased again in the first and second quarters of 2021. Even though COVID-19 was associated with an increase in the GDP from agricultural export, this fluctuating trend demonstrates uncertainty and instability in the Indonesian economy. This uncertainty is caused by value instability in the Indonesian export value (see Figure 5).
Generally, the results of the second stage of the 2SLS estimation demonstrate that agricultural export can increase economic growth, but at the individual level, agricultural export is found to decrease economic growth. This finding is supported by the fluctuation of exports in the agriculture sector, especially during the COVID-19 pandemic, which occurred in three main agricultural export subsectors: horticulture, plantation, and livestock (see Figure 5). This fluctuation may have been caused by the number and prices of export commodities harvested. Thus, there was instability in exported commodities in the horticulture, plantation, and livestock subsectors. On the other hand, in the food crop subsector, although there was a slight decrease in value during the COVID-19 pandemic, the trend was stable from year to year. This instability caused the tendency for commodities to become large, thereby harming the economy [39,40,41,42]. Furthermore, according to Ocran and Biekpe [39], the detrimental impact of primary commodity export volatility can be related to increased long-term financial uncertainty and the risk of imported input shortages.

4.3. Post Estimation Test for 2 SLS

The post-estimation tests were used to clarify the endogeneity problem. The first test was the test of endogeneity. The results of this test demonstrated a statistically significant p-value of 0.000, and the values of the Durbin Chi-square, Wu-Hausman F, Robust score Chi-square, and Robust regression F tests were 38.28, 47.45.3, 20.16, and 37.76, respectively. These results suggest that agricultural export is an endogenous variable.
The second test, the weak instrument test, was used to assess the level of correlation between the addition of one more instrument variable and the endogenous variables. The p-value was 0.0002, and the minimum eigenvalue statistic was 17.99 larger than the nominal 5% 2SLS size from the Wald test. This means that the instrument variables used in this model are relevant and exogenous.
The third test was the test of overidentifying restriction. This test was applied to analyze the “homogeneity condition” of the instruments [43]. The results of the overidentifying restriction test illustrate p-values for the Sargan chi-square and Baumann chi-square tests of 0.8841 and 0.8883, respectively. This means that we were able to accept the null hypothesis, because the p-values were greater than 0.1. If the test produces a non-significant result, it can be concluded that the instruments are valid and the model is correctly specified.
The last test conducted was the heteroscedasticity test for instrumental estimation. This test solves the problem in the error term that finds that the error term’s variance is non-constant [44] (p. 69). The result for the chi-square p-value of 0.52 means that we were able to accept the null hypothesis that describes the disturbance as homoscedastic. If the disturbance is homoscedastic, our model has no heteroscedasticity problem. The results indicate the constant value of the error term and the variance of the error term.

5. Conclusions, Recommendations, and Implications

5.1. Conclusions

The goal of this research was to investigate the effects of the agriculture export performance on the growth of the economy in Indonesia during the COVID-19 pandemic. This study used panel data from four subsectors of agricultural export in Indonesia. The data were obtained from the BPS, Ministry of Agriculture, and Investment Coordinating Boards for quarterly periods from 2012 until the second quarter of 2021.
This study used different econometric analyses to achieve the objectives. The generalized least-square, fixed, and random effect analysis regression methods were applied for the analysis. To address the issue of endogeneity, an instrumental regression method called 2SLS was applied. The results for the FGLS, labor force, and exchange rate had positive effects in terms of explaining the economic growth at the 95% and 99% CI levels. The labor force and the exchange rate can increase the economic growth by approximately 0.03% and 1.2 percent, respectively.
The fixed effect model showed significant negative relationships of agricultural export and inflation with economic growth, causing decreases of 0.13% and 0.95%, respectively. The random effect illustrated that inflation has a negative effect on the growth of the economy by 0.98%, on average. The exchange rate was found to have the greatest effect on increasing economic growth (1.16%). The three regressions analyses demonstrated that agricultural export and the COVID-19 pandemic had different effects on economic growth. Agriculture export was found to have a significant inverse effect only in the FE regression, and for the other regressions, it had a non-significant negative effect. For the COVID-19 pandemic, positive effects were found consistently with slightly different coefficient values, with a difference of 1.4 percent.
From the two-stage least-square analysis, agricultural export was found to be an endogenous variable with an important and positive effect on growth, leading to growth of approximately 0.7%. The COVID-19 pandemic was also found to lead to an increase in economic growth by approximately 0.16%. Another result is that the labor force and inflation, although they are significant but inversely related to economic growth. This implies that a 1% increase in the labor force in agriculture and inflation may reduce Indonesia’s economic growth by 0.07% and 0.86%, respectively.
To summarize the outcomes of this research, the COVID-19 pandemic has increased the fluctuations and instability in agricultural export as well as the degree of uncertainty. The COVID-19 pandemic has increased economic growth, but the level of uncertainty has led to instability in the agricultural export value and high commodity dependence. This agricultural export instability has increased income uncertainty which, in turn, has stimulated increases in saving, investment, and the growth of the economy [39,41,45,46].
Some limitations of this study are as follows: (1) this study was only conducted in Indonesia, and future studies need to look at the effect of agriculture export during the COVID-19 pandemic on economic growth in other developing countries, as different countries will have different results based on geographical, social, and economic differences, (2) at the time of conducting this study, the COVID-19 pandemic was still present, and only one year of data on the impact of COVID-19 was used. Therefore, future studies could use more data to better determine the impact of the COVID-19 pandemic, and (3) this study was conducted using the 2SLS estimation. This estimation method is beneficial as it can solve the problem of endogeneity, but the requirements for instrument variables must be met, and it is difficult to choose the most appropriate instrumental variable, since it is impossible to meet the exclusion restrictions in reality. Thus, future studies could use the 2SLS estimation method to assess the effects of agricultural export and economic growth with other instrument variables.

5.2. Recommendations and Implications

We conducted an examination of models and identified the key factors impacting economic growth during the COVID-19 pandemic. The major contribution of this study is the examination of how agricultural export and other microeconomic variables, such as the labor force, gross capital formation, non-agricultural export, inflation, exchange rate, and import, can affect economic growth during the pandemic. Recommendations for improving economic growth during the pandemic are provided by the results of each variable based on the simultaneous model.
Our findings suggest that, to increase economic growth during the pandemic, the government could invest in the further development of agricultural export. To increase the positive impact of agricultural export during the pandemic, the policy suggestion that may be proposed from this research is that the current government should endeavor to diversify agriculture export during the COVID-19 pandemic to improve the influence of agricultural export on economic development. The agricultural commodities exported should not only be raw materials but also processed commodities to reduce the commodity dependence. Processed agricultural commodities could increase the value added by agricultural commodities. The government should make a policy to stimulate the agroindustry to increase the value added by agricultural commodities.
At the individual agricultural export subsector level, the government should support increases in the contributions of the horticulture, plantation, and livestock subsectors. Despite having negative impacts on economic development, during the COVID-19 pandemic, the trends of export have been increasing. The government should support this sector to increase the value added by commodities and to export the added-value products, not only the raw material products. One method that could be proposed to increase the added value of agricultural export products is to increase the quality of agricultural export products. The government can support policies to enhance knowledge and technical education about better farming and the use of agriculture technology by farmers.
The results of our study add great value to current sustainability research in two ways. First, we provide a theoretical basis for explaining the effects of the COVID-19 pandemic on the current situation of economic growth in terms of international trade in agriculture. Agriculture can be seen as an important sector in the COVID-19 pandemic in terms of increasing economic growth and stimulating a decrease in poverty. In Indonesia, agriculture is the prominent sector in rural areas; therefore, by increasing agricultural export, welfare will increase.
Second, to increase agricultural export, in 2020, the government, in this case the Ministry of Agriculture, implemented a program called “GRATIEKS” to increase agricultural export. This policy aims to encourage the agricultural sector to increase the export of agricultural commodities by three fold. This policy was implemented to increase the contribution of agriculture to economic growth through the export of agricultural commodities during the COVID-19 pandemic by creating a trade surplus for Indonesia’s agricultural exports. The results of this study are also important to provide a general description of the performance of this policy in terms of the sustainability of economic growth. With this program, in 2020, the agricultural export value has increased, and based on the results of this study, this performance could increase economic growth. Thus, the sustainability of economic growth during the COVID-19 pandemic can be increased by increasing agricultural export.

Author Contributions

Conceptualization: K.F.A. and J.K.; methodology: K.F.A.; formal analysis: K.F.A.; writing—original draft preparation: K.F.A.; writing—review and editing: J.K.; supervision: J.K. All authors have read and agreed to the published version of the manuscript.

Funding

This research received no external funding.

Institutional Review Board Statement

Not applicable.

Informed Consent Statement

Not applicable.

Data Availability Statement

The study did not report any data.

Acknowledgments

This paper is based on my master’s thesis “The Importance of Agricultural Export Performance on The Economic Growth of Indonesia: The Impact of COVID-19 Pandemic”, conducted at Kangwon National University.

Conflicts of Interest

The authors declare no conflict of interest.

References

  1. World Health Organization. WHO Coronavirus (COVID-19) Dashboard. 2021. Available online: https://covid19.who.int/ (accessed on 5 May 2021).
  2. Satuan Tugas Penanganan COVID-19. Analisis Data COVID-19 Indonesia (Issue April). 2021. Available online: https://covid19.go.id/id/p/berita/analisis-data-covid-19-indonesia-update-25-april-2021 (accessed on 5 May 2021).
  3. Wang, J.; Shao, W.; Kim, J. Analysis of the impact of COVID-19 on the correlations between crude oil and agricultural futures. Chaos Solitons Fractals 2020, 136, 109896. [Google Scholar] [CrossRef] [PubMed]
  4. Rozaki, Z. COVID-19, agriculture, and food security in Indonesia. Rev. Agric. Sci. 2020, 8, 243–261. [Google Scholar] [CrossRef] [PubMed]
  5. Badan Pusat Statistik. Pertumbuhan Ekonomi Indonesia Triwulan II-2020. 2020. Available online: www.bps.go.id (accessed on 8 May 2021).
  6. Statistic Indonesia. Indonesian Economic Growth in Q3-2020. Badan Pusat Statistik: Jakarta Indonesia 2020, 85/11/Th.XXIII, 1–10. [Google Scholar]
  7. BPS. Keadaan Ketenagakerjaan Indonesia Agustus 2020; Badan Pusat Statistik: Jakarta, Indonesia, 2020; XXiI, 05 N(91); pp. 1–20. [Google Scholar]
  8. Maliszewska, M.; Mattoo, A.; van der Mensbrugghe, D. The Potential Impact of COVID-19 on GDP and Trade: A Preliminary Assessment; World Bank Group: Washington, DC, USA, 2020. [Google Scholar] [CrossRef]
  9. Yofa, R.D.; Erwidodo, E.S. Dampak Pandemi COVID-19 Terhadap Ekspor dan Impor; Iaard Press: Jakarta, Indonesia, 2020. [Google Scholar]
  10. Andenew, Y.; Woldeyohannes, B. The Impact of Agricultural Export Commodity Prices on Nigeria’s Economic Growth. J. Integr. Mark. Comm. Digital Mark. 2020, 25–42. [Google Scholar] [CrossRef] [Green Version]
  11. Kyaw, A.M.M. 2017. Agricultural Export and Economic Growth In ASEAN Countries. Master’s Thesis, KDI School of Public Policy and Management, Sejong, Republic of Korea. Available online: www.idpublications.org (accessed on 5 October 2021).
  12. Lin, B.X.; Zhang, Y.Y. Impact of the COVID-19 pandemic on agricultural exports. J. Integr. Agric. 2020, 19, 2937–2945. [Google Scholar] [CrossRef]
  13. Balassa, B. Exports and economic growth. Further evidence. J. Dev. Econ. 1978, 5, 181–189. [Google Scholar] [CrossRef]
  14. Siamwalla, A.; Setboonsarng, S.; Werakarnjanapongs, P. Changing Comparative Advantage in Thai Agriculture. In OECD Development Centre Working Paper No.35; OECD Publishing: Paris, France, 1991; Volume 35, pp. 9–52. [Google Scholar]
  15. Feder, G. On exports and economic growth. J. Dev. Econ. 1983, 12, 59–73. [Google Scholar] [CrossRef]
  16. Ram, R. Exports and Economic Growth in Developing Countries: Evidence from Time-Series and Cross-Section Data. Econ. Dev. Cult. Change 1987, 36, 51–72. [Google Scholar] [CrossRef]
  17. Vohra, R. Export and economic growth: Further time series evidence from less-developed countries. Int. Adv. Econ. Res. 2001, 7, 345–350. [Google Scholar] [CrossRef]
  18. Ahmad, J.; Kwan, A.C.C. Causality between exports and economic growth. Empirical evidence from Africa. Econ. Lett. 1991, 37, 243–248. [Google Scholar] [CrossRef]
  19. Chow, P.C.Y. Empirial Evidence from the NICs. J. Dev. Econ. 1987, 26, 55–63. [Google Scholar] [CrossRef]
  20. Sephton, P.S. Causality Between Export Growth and Industrial Development. J. Dev. Econ. 1989, 31, 413–415. [Google Scholar] [CrossRef]
  21. Matsuyama, K. Agricultural productivity, comparative advantage, and economic growth. J. Econ. Theory 1992, 58, 317–334. [Google Scholar] [CrossRef] [Green Version]
  22. Sanjuán-López, A.I.; Dawson, P.J. Agricultural Exports and Economic Growth in Developing Countries: A Panel Cointegration Approach. J. Agric. Econ. 2010, 61, 565–583. [Google Scholar] [CrossRef]
  23. Siaw, A.; Jiang, Y.; Pickson, R.B.; Dunya, R. Agricultural Exports and Economic Growth: A Disaggregated Analysis for Ghana. Theor. Econ. Lett. 2018, 8, 2251–2270. [Google Scholar] [CrossRef] [Green Version]
  24. Negem, S.H. Simultaneity Problem of Exports and Economic Growth: A Panel Data Analysis of the European Union. China-USA Bus. Rev. 2016, 15, 577–601. [Google Scholar] [CrossRef]
  25. Henneberry, S.R.; Khan, M.E. An analysis of the linkage between agricultural exports and economic growth in Pakistan. Cross-Natl. Cross Cult. Issues Food Mark. 2014, 10, 13–30. [Google Scholar] [CrossRef]
  26. Hayakawa, K.; Mukunoki, H. The impact of COVID-19 on international trade: Evidence from the first shock. J. Jpn. Int. Econ. 2021, 60, 101135. [Google Scholar] [CrossRef]
  27. Beckman, J.; Countryman, A.M. The Importance of Agriculture in the Economy: Impacts from COVID-19. Am. J. Agric. Econ. 2021, 103, 1595–1611. [Google Scholar] [CrossRef]
  28. Osabohien, R.; Iqbal, B.A.; Osabuohien, E.S.; Khan, M.K.; Nguyen, D.P. Agricultural trade, foreign direct investment and inclusive growth in developing countries: Evidence from West Africa. Transnatl. Corp. Rev. 2021, 14, 244–255. [Google Scholar] [CrossRef]
  29. Maulana, A.S.; Nubatonis, A. Dampak Pandemi COVID-19 terhadap Kinerja Nilai Ekspor Pertanian Indonesia. Agrimor 2020, 5, 69–71. [Google Scholar] [CrossRef]
  30. Chenery, H.B.; Strout, A.M. American Economic Association Foreign Assistance and Economic Development: Reply. Communications 2009, 58, 912–916. [Google Scholar]
  31. Michalski, W. Exports and economic growth. Intereconomics 1970, 5, 209–211. [Google Scholar] [CrossRef] [Green Version]
  32. Osabohien, R.; Akinpelumi, D.; Matthew, O.; Okafor, V.; Iku, E.; Olawande, T.; Okorie, U. Agricultural Exports and Economic Growth in Nigeria: An Econometric Analysis. IOP Conf. Ser. Earth Environ. Sci. 2019, 331, 012002. [Google Scholar] [CrossRef]
  33. Barua, S. Munich Personal RePEc Archive COVID-19 pandemic and world trade: Some analytical notes COVID-19 pandemic and world trade: Some analytical notes. Munich Pers. RePEc Arch. 2020, 99761, 1–36. [Google Scholar]
  34. Hoechle, D. Robust standard errors for panel regressions with cross-sectional dependence. Stata J. 2007, 7, 281–312. [Google Scholar] [CrossRef] [Green Version]
  35. Zahir, M. Contribution of agricultural exports to economic growth in Pakistan. Pak. J. Commer. Soc. Sci. 2012, 6, 133–146. [Google Scholar]
  36. Levin, A.; Raut, L.K. Complementarities between exports and human capital in economic growth: Evidence from the semi-industrialized countries. Econ. Dev. Cult. Change 1998, 46, 155–174. [Google Scholar] [CrossRef]
  37. Badan Pusat Statistik. Republik Indonesia. Ekonomi Indonesia 2019 Tumbuh 5,02 Persen; Badan Pusat Statistik: Jakarta, Indonesia, 2020; 17/02/Th. XXIV; pp. 1–12. [Google Scholar]
  38. Bakari, S.; Mabrouki, M. (2017). The Effect of Agricultural Exports on Economic Growth in South-Eastern Europe: An Empirical Investigation Using Panel Data. J. Smart Econ. Growth 2017, 2, 49–64. [Google Scholar]
  39. Ocran, M.K.; Biekpe, N. Primary commodity export and economic growth in sub Sahara Africa: Evidence from panel data analysis. S. Afr. J. Econ. Manag. Sci. 2008, 11, 465–474. [Google Scholar] [CrossRef] [Green Version]
  40. Gyimah-Brempong, K. Export Instability and Economic Growth in Sub-Saharan Africa. Econ. Dev. Cult. Change 1991, 39, 815–828. [Google Scholar] [CrossRef]
  41. Adams, F.G.; Behrman, J.R.; Roldan, R.A. Measuring the Impact of Primary Commodity Fluctuations on Economic Development: Coffee and Brazil. Am. Econ Rev. 2017, 69, 164–168. [Google Scholar]
  42. Sule, O.; Harrigan, J. Export Instabillity and Growth. In UCLA Economics Working Papers 486; UCLA Department of Economics: Los Angeles, CA, USA, 1988; pp. 1–28. [Google Scholar]
  43. Ullah, S.; Zaefarian, G.; Ullah, F. How to use instrumental variables in addressing endogeneity? A step-by-step procedure for non-specialists. Ind. Mark. Manag. 2021, 96, A1–A6. [Google Scholar] [CrossRef]
  44. Gujarati, D.N. Basic Econometrics; McGraw-Hill: New York, NY, USA, 2004. [Google Scholar]
  45. Abu-lila, Z.M.; Alghazo, A.; Ghazo, A. The Impact of Export Instability on Economic Growth: Evidence from Jordan. J. Asian Financ. Econ. Bus. 2021, 8, 13–19. [Google Scholar] [CrossRef]
  46. Bashayreh, A.G.; Alomari, M.W.; Abdelhadi, S. The impact of export instability on economic growth: Sample of MENA countries. Int. J. Econ. Bus. Res. 2019, 18, 429–435. [Google Scholar] [CrossRef]
Figure 1. Export growth (percentage) in 2018−2020. Source: Author’s calculation based on data from the Central Bureau of Statistics (BPS).
Sustainability 14 16534 g001
Figure 2. Conceptual framework. Source: Author’s compilation based on Kyaw [11], Lin and Zhang [12], Hayakawa and Mukunoki [26], Beckman and Countryman [27], Osabohien et al. [28], and Osabohien et al. [32].
Sustainability 14 16534 g002
Figure 3. Line Graph of Time Series Panel Data.
Sustainability 14 16534 g003
Figure 4. Trend for the Agricultural GDP from 2019 to the 2nd quarter of 2021. Source: Ministry of Agriculture processed by the authors.
Sustainability 14 16534 g004
Figure 5. Export Value for each subsector in Indonesia. Source: Ministry of Agriculture processed by the authors.
Sustainability 14 16534 g005
Table 1. Descriptions of variables.
NoVariableDescriptionSourceDefinition and Measurement
1AEXPAgriculture export (constant USD)Database of the Ministry of AgricultureAgricultural raw material products are based on the total value of HS code and country destination.
2GDPConstant Gross Domestic Product at 2010 national price (in billion rupiahs)Central Bureau of Statistics (BPS)In this study, GDP is the constant gross domestic product in four primary agriculture subsectors (food crop, horticulture, plantation, and livestock) based on the year 2010.
3LFLabor force, number of persons engagedCentral Bureau of Statistics (BPS)The labor force is the total number of people working in four agriculture subsectors (food crop, horticulture, plantation, and livestock). It is calculated as the proportion of the population above the age of 15.
4GCFGross capital formation (billion rupiahs)Investment Coordinating Boards.Gross capital formation is the total value of the investment resulting from domestic and foreign investment in agricultural sectors.
5NAEXPNon-agriculture Export (Constant USD)Database of the Ministry of Agriculture based on Central Bureau of Statistics (BPS) dataNon-agriculture export is the amount of export for other sectors. It measures the total export minus agriculture export in four subsectors.
6INFInflation rate with GDP deflator 2010 = 100Central Bureau of Statistics (BPS) The   percentage   rise   in   the   price   of   services   and   goods   is   known   as   the   inflation   rate .   It   is   calculated   as   a   proportion   of   the   GDP s   implicit   price   deflator .   GDP   Deflator = GDP   at   Current   price GDP   at   Constant   price × 100
7ERExchange rateDatabase of the Ministry of Trade based on Central Bureau of Statistics (BPS)The exchange rate is defined as the price of Rupiah in USD. This rate is measured as the average rate for the period.
8IMPImport (Constant USD)Database of the Ministry of Agriculture based on Central Bureau of Statistics (BPS) dataAgricultural raw material products based on the total value of HS code and the country destination.
9DCOVDummy Variable of the COVID-19 pandemic.1: year COVID-19 0: year non COVID-19This dummy variable reflects the number of years since the COVID-19 pandemic began.
Table 2. Descriptive statistics of variables.
Variable MeanStd. Dev.MinMaxObservations
Agriculture exportoverall480,123.9398,213.567,054.91,391,506N = 152
(USD)between 411,794.499,615.11,063,842n = 4
within 174,787.7−449,019.8807,787.3T = 38
Gross Domestic Productoverall58,624.229,068.73626.3170,614.5N = 152
(Billion Rp)between 28,652.333,985.490,480.1n = 4
within 15,006.521,632.9154,036.9T = 38
Labor Forceoverall9.68.631.438.8N = 152
(Million people)between 4.155.914.7n = 4
within 7.84−2.142.4T = 38
Gross Capital Formationoverall5407.96167.50.618,233.5N = 152
(Billion Rp)between 2980.73859.89877.3n = 4
within 5597.4−2898.418,681.1T = 38
Non-agriculture exportoverall42,327.74559.332,567.353,831.5N = 152
(Million USD)between 411.941,743.842,708.5n = 4
within 4545.233,151.253,450.7T = 38
Inflation (GDP deflator)overall148118.426.11310.6N = 152
between 29.6122.9190.9n = 4
within 115.635.31267.6T = 38
Exchange rateoverall12,834.51732.1910014,989.7N = 152
(Rupiah)between 012,834.512,834.5n = 4
within 1732.1910014,989.7T = 38
Importoverall411,402.5304,803.298,289.71144,9N = 152
(USD)between 338,181.2153,953.3902,846.5n = 4
within 81,006.3202,731.3653,512.4T = 38
Dummy COVID-19 Pandemicoverall0.20.401N = 152
between 00.20.2n = 4
within 0.401T = 38
Table 3. Summary statistics of variables for the individual commodity sectors.
Unit Agriculture ExportGross Domestic ProductLabor ForceGross Capital FormationNon-Agriculture ExportInflationExchange RateImport
Food CropsMean99,615.0775,201.8214.743859.7942,708.54138.9112,834.46153,953.3
St.Dv22,232.1522,628.397.7023.034558.9210.951749.5315,123.53
HorticultureMean342,722.133,985.385.963863.0542,464.93139.2812,834.46231,454.5
St.Dv49,770.465205.638.386131.464564.8218.331749.5333,722.4
PlantationMean1,063,84290,480.0711.099877.3141,743.81122.9412,834.46357,355.7
St.Dv346,47017,484.117.424037.944678.5710.951749.5365,662.68
LivestockMean414,316.134,829.586.484031.4042,393.33190.9912,834.46902,846.5
St.Dv40,831.238613.908.176028.854560.72231.331749.53145,267.4
Table 4. Heteroscedasticity test, Serial Correlation test, and Cross-sectional dependence test.
FE Heteroscedasticity Test
H0: sigma(i)2 = sigma2 for all
chi2 (4) = 211.45
Prob > chi2 = 0.000
RE Heteroscedasticity Test
Ho: Panel Homoscedasticity
Ha: Panel Groupwise Heteroscedasticity
Lagrange Multiplier LM Test = 104.1831 p-Value > Chi2(3) 0.0000
Likelihood Ratio LR Test = 28.5354 p-Value > Chi2(3) 0.0000
Wald Test = 1117.1115 p-Value > Chi2(4) 0.0000
Serial Correlation test
H0: no first-order autocorrelation
F (1, 3) = 0.873
Prob > F = 0.4191
Cross-Sectional Dependence Test
Pesaran’s test of cross-sectional independence = 6.238, Pr = 0.0000
Average absolute value of the off-diagonal elements = 0.413
Table 5. Estimates from the FGLS, Fixed Effect, and Random Effect analyses.
VariablesFGLSFixed EffectRandom Effect
CoefficientStd. Errorp-ValueCoefficientStd. Errorp-ValueCoefficientStd. Errorp-Value
Constant3.327 *1.8080.0663.7733.7730.1694.8522.9520.100
Agricultural export−0.0460.0300.131−0.131 **0.0530.015−0.0580.0500.248
Labor force0.031 **0.0150.0370.0300.0250.0240.0580.0510,238
Gross Capital Formation0.00490.0040.2590.000.0070.4600.0070.0080.383
Non-agricultural export0.12970.1060.222−0.0720.1620.6560.0430.1830.815
Inflation−1.003 ***0.0110.000−0.951 ***0.0550.000−0.976 ***0.0650.000
Exchange rate1.227 ***0.1320.0001.023 ***0.1760.0001.163 ***0.1780.000
Import0.0170.2300.8200.347 **0.1250.006−0.0020.0940.988
COVID-19 Pandemic0.084 **0.0390.0320.098 **0.0480.0430.109 **0.0550.048
Horticulture−0.654 ***0.0870.000
Plantation0.192 **0.0870.028
Livestock−0.609 ***0.1310.000
Wald Chi-Square Test11,186.81
R-Square 0.7170.670
p-value of Chi-Square0.000 0.000
p-Value of F-statistics0.000
Hausman test chi2 (8) = 66.40 prob > chi2 = 000
Note: *, **, *** denote the significance level at 10%, 5%, and 1%, respectively.
Table 6. Estimates from the Two-stage Least-Square Regression.
Variables1st Stage2nd Stage
CoefficientStd. Errorp-ValueCoefficientStd. Errorp-Value
Constant−5.5834.2250.1897.940 **3.0020.008
Agricultural export 0.730 ***0.2290.001
Labor force0.132 **0.0660.048−0.085 **0.0450.059
Gross Capital Formation−0.0110.0110.3070.0090.0110.413
Non-agricultural export−0.1630.1980.934
Inflation−0.0930.0940.322−0.862 ***0.1300.000
Exchange rate1.313 ***0.3180.000
Import0.420 **0.2030.040−0.0630.2030.757
COVID-19 Pandemic−0.0520.0740.4850.153 **0.0740.038
Horticulture1.235 ***0.08170.000−1.731 ***0.2820.000
Plantation1.985 ***0.2000.000−1.534 ***0.5300.004
Livestock0.862 ***0.3120.007−1.734 ***0.3840.000
R-Square0.8990.721
Note 1: Non-agricultural export (NAEXP) and Exchange rate (ER) are instrumental variables. Note 2: *, **, *** denote the significance level at 5%, and 1%, respectively.
Publisher’s Note: MDPI stays neutral with regard to jurisdictional claims in published maps and institutional affiliations.

