
Greenhouse Gas Emissions and Carbon Sequestration from Conventional and Organic Olive Tree Nurseries in Tuscany, Italy

 ,
,  and
and
Abstract
:1. Introduction
2. Materials and Methods
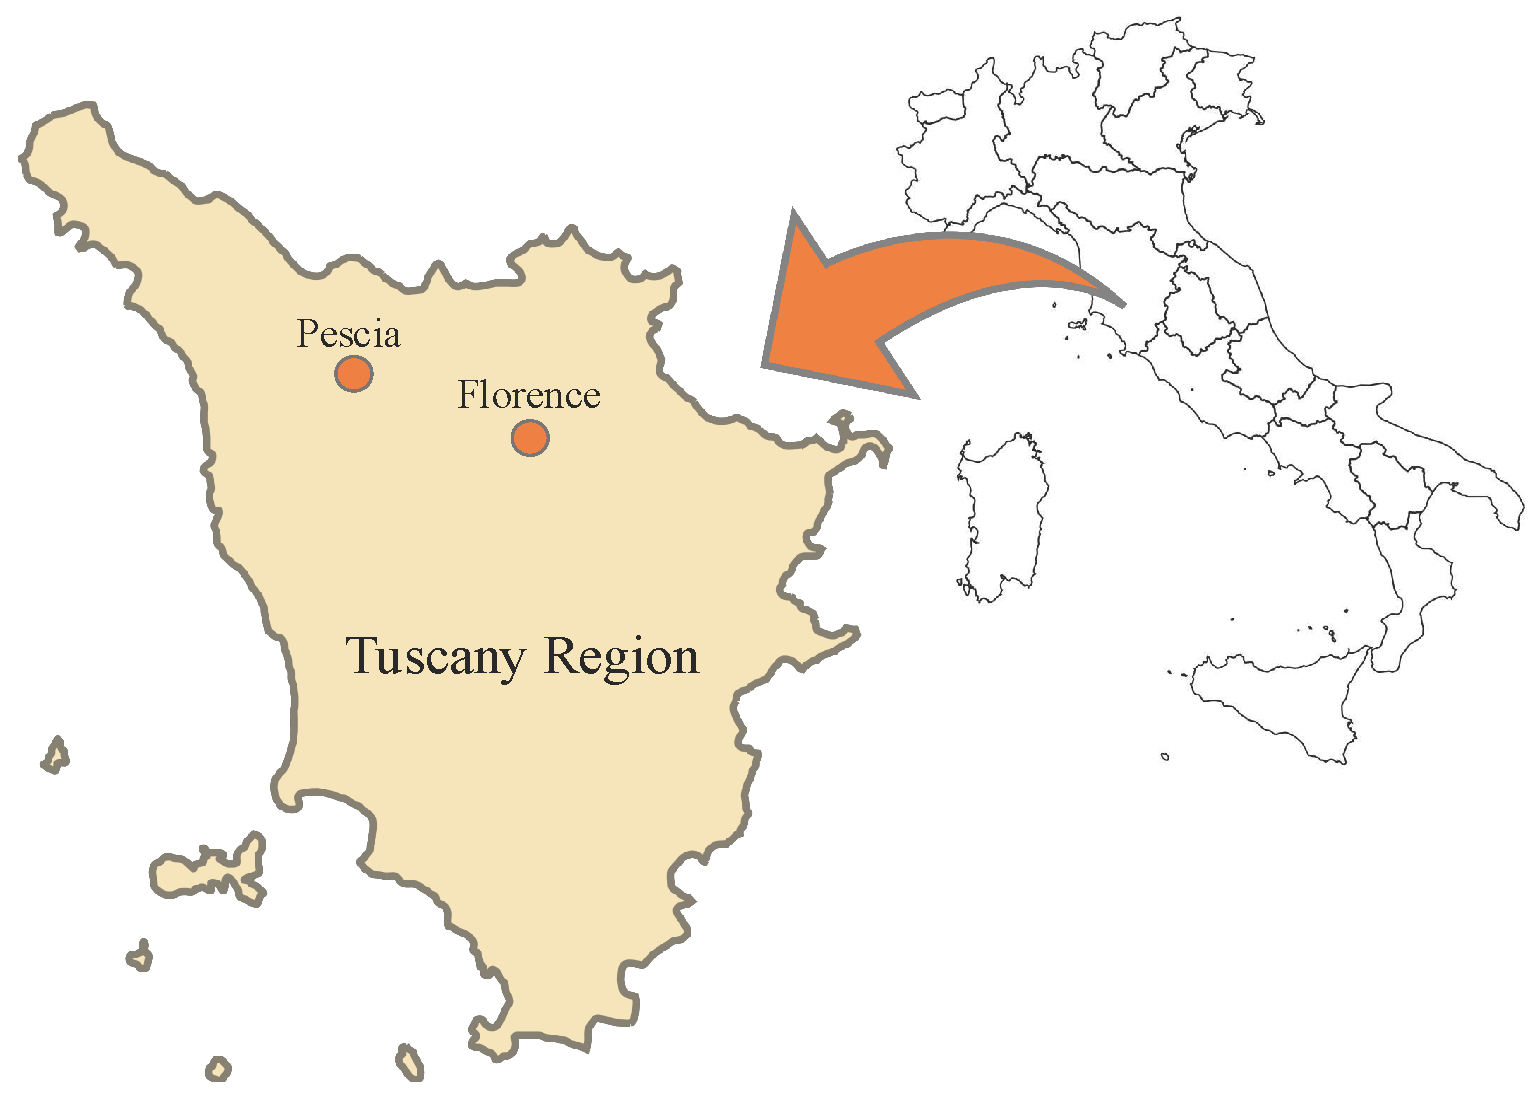
2.1. Production System Description
2.2. LCA Methodology and Impact Category
2.2.1. Goal, Scope, and Functional Unit
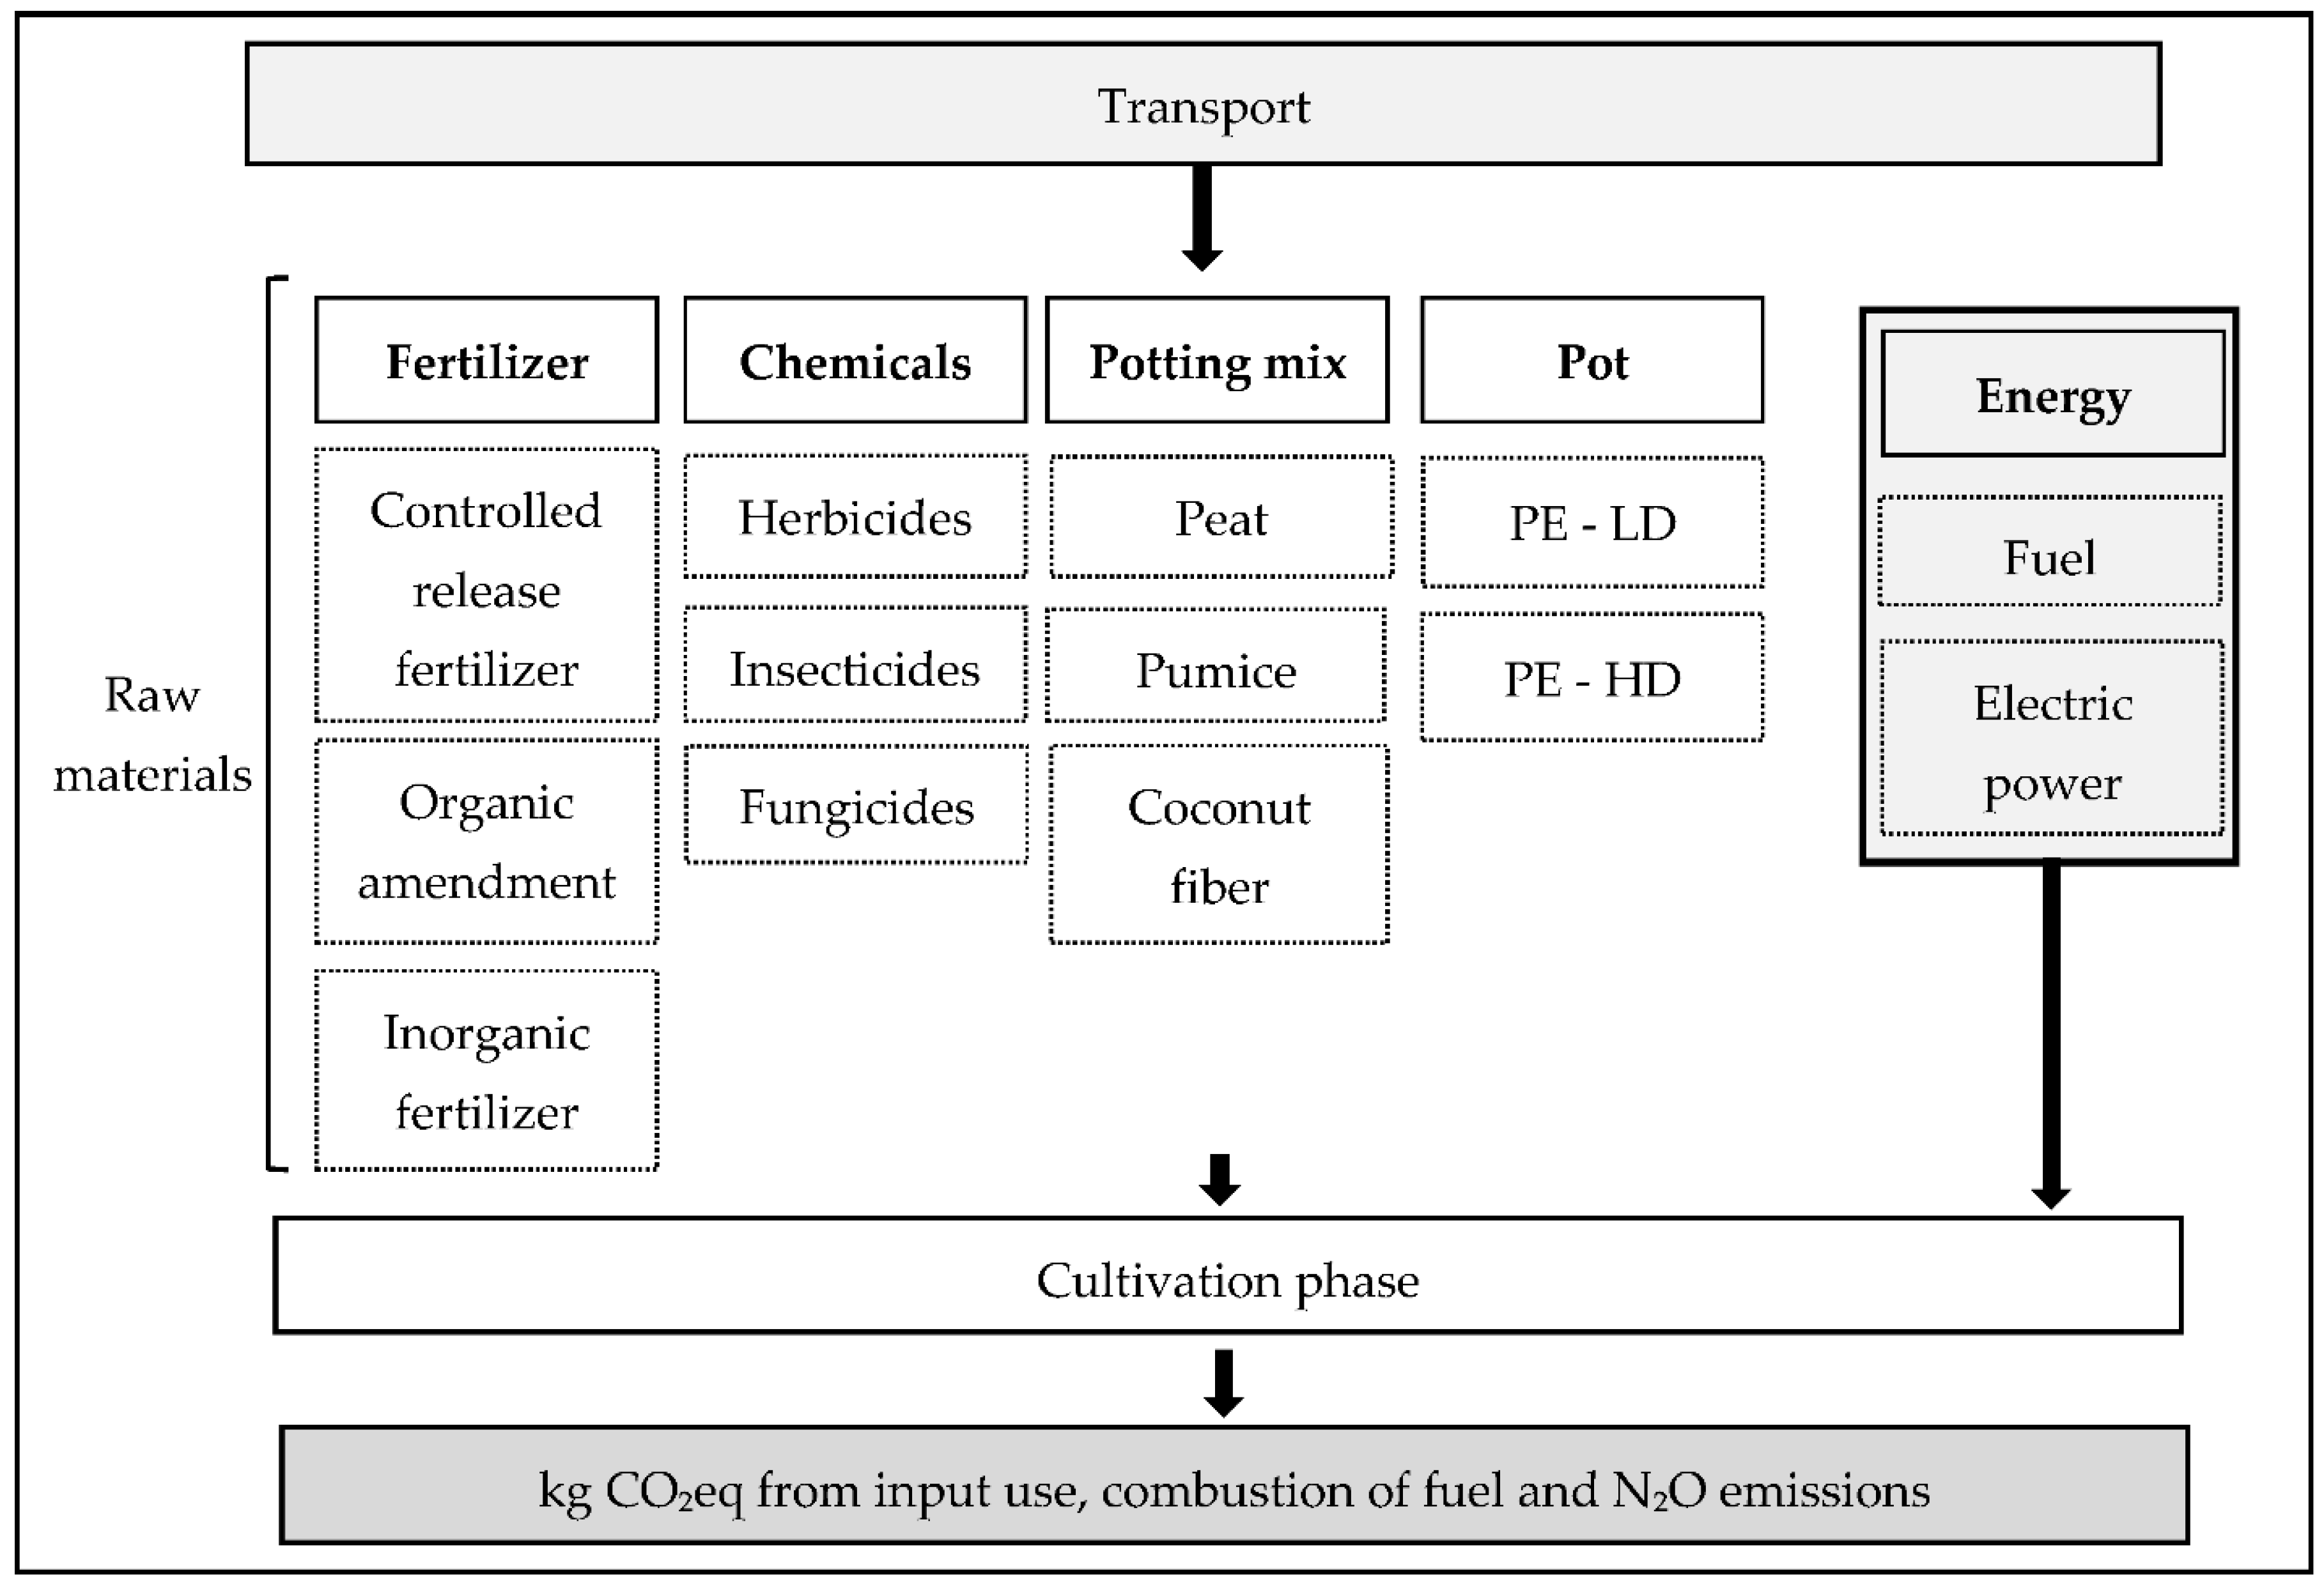
2.2.2. System Boundary
2.2.3. Life Cycle Inventory (LCI)
- -
- Fertilizers: the quantity (kg) distributed on the surface unit (m2) during the cultivation season was recorded. For controlled-release fertilizer, organic amendments, and inorganic/organic fertilizers used in ferti-irrigation, the element contents (N, P, K and microelements) were calculated.
- -
- Chemicals: the quantity (kg) distributed on the surface unit (m2) during the cultivation season was recorded. For fungicides, insecticides, and herbicides, the active ingredients were considered.
- -
- Potting mix: many kinds of materials are used in the Pescia nursery district. The most common are peat, pumice, and coconut fiber. Each nursery has its own substrate “recipe” and, considering the number and volume of the pots, it was possible to calculate the quantities of any “ingredient” (kg) used on the surface unit (m2) during the cultivation season.
- -
- Pot: the weight (kg) of a pot of 15 cm diameter was determined (150 g per pot) and then the total number was considered. The plastic materials used in the analyzed nurseries are low-density polyethylene (LDPE) or high-density polyethylene (HDPE).
- -
- Energy consumptions: the nurseries’ yearly power consumption (MJ) was referred to farm surface (m2).
- -
- Diesel consumptions: the quantity of diesel fuel (both for machinery movement and greenhouse heating) was considered in kg/m2/year and it was analyzed during the cultivation season. The emissions due to either production or combustion were considered.
- -
- -
- The emissions from farm equipment and structures (e.g., greenhouses, build containers, plastic covers for container cultivations, irrigation systems, ferti-irrigation systems) and packaging (e.g., net used to wrap plants) were not considered because of their low relevance for the aims of our study [43]. Furthermore, a previous study [33] demonstrated that the equipment, structures, and packaging for outdoor container cultivation have minimal importance in terms of GWP in nursery production and transport.

| Nursery | Organic Nitrogen Fertilizer (kg/plant) | Chemical Nitrogen Fertilizer (kg/plant) | Phosphorus Fertilizer (kg/plant) | Potassium Fertilizer (kg/plant) | Fuel (kg/plant) | Electric Power (kW/plant) | Herbicides (kg/plant) | Insecticides (kg/plant) | Fungicides (kg/plant) |
|---|---|---|---|---|---|---|---|---|---|
| 1C | 0.001 | 0.001 | 0.001 | 0.001 | 0.022 | 0.020 | 9.2 × 10⁻⁵ | 3.7 × 10⁻³ | 3.6 × 10⁻⁶ |
| 2C | - | 0.007 | 0.004 | 0.005 | 0.005 | 0.019 | 1.5 × 10⁻⁴ | 1.7 × 10⁻⁵ | − |
| 3C | 0.001 | 0.011 | 0.009 | 0.002 | 0.008 | 0.083 | 5.4 × 10⁻⁴ | 5.5 × 10⁻⁵ | 4.8 × 10⁻⁶ |
| 3O | 0.001 | - | - | - | 0.014 | 0.034 | - | 1.5 × 10⁻⁴ * | - |
| 4C | - | 0.007 | 0.009 | 0.015 | 0.002 | 0.034 | 8.3 × 10⁻⁴ | 2.1 × 10⁻⁴ | 6.8 × 10⁻⁵ |
| 5C | 0.003 | 0.012 | 0.009 | 0.004 | 0.001 | 0.059 | 1.7 × 10⁻⁴ | 3.7 × 10⁻⁴ | - |
| 6C | - | 0.016 | 0.016 | 0.016 | 0.005 | 0.019 | 1.6 × 10⁻⁴ | 8.0 × 10⁻⁴ | 7.2 × 10⁻⁵ |
| 6O | 0.003 | - | - | - | 0.001 | 0.059 | - | 1.5 × 10⁻⁴ * | - |
2.3. Sensitivity Analysis
2.4. Carbon Sequestration in Woody Biomass
3. Results
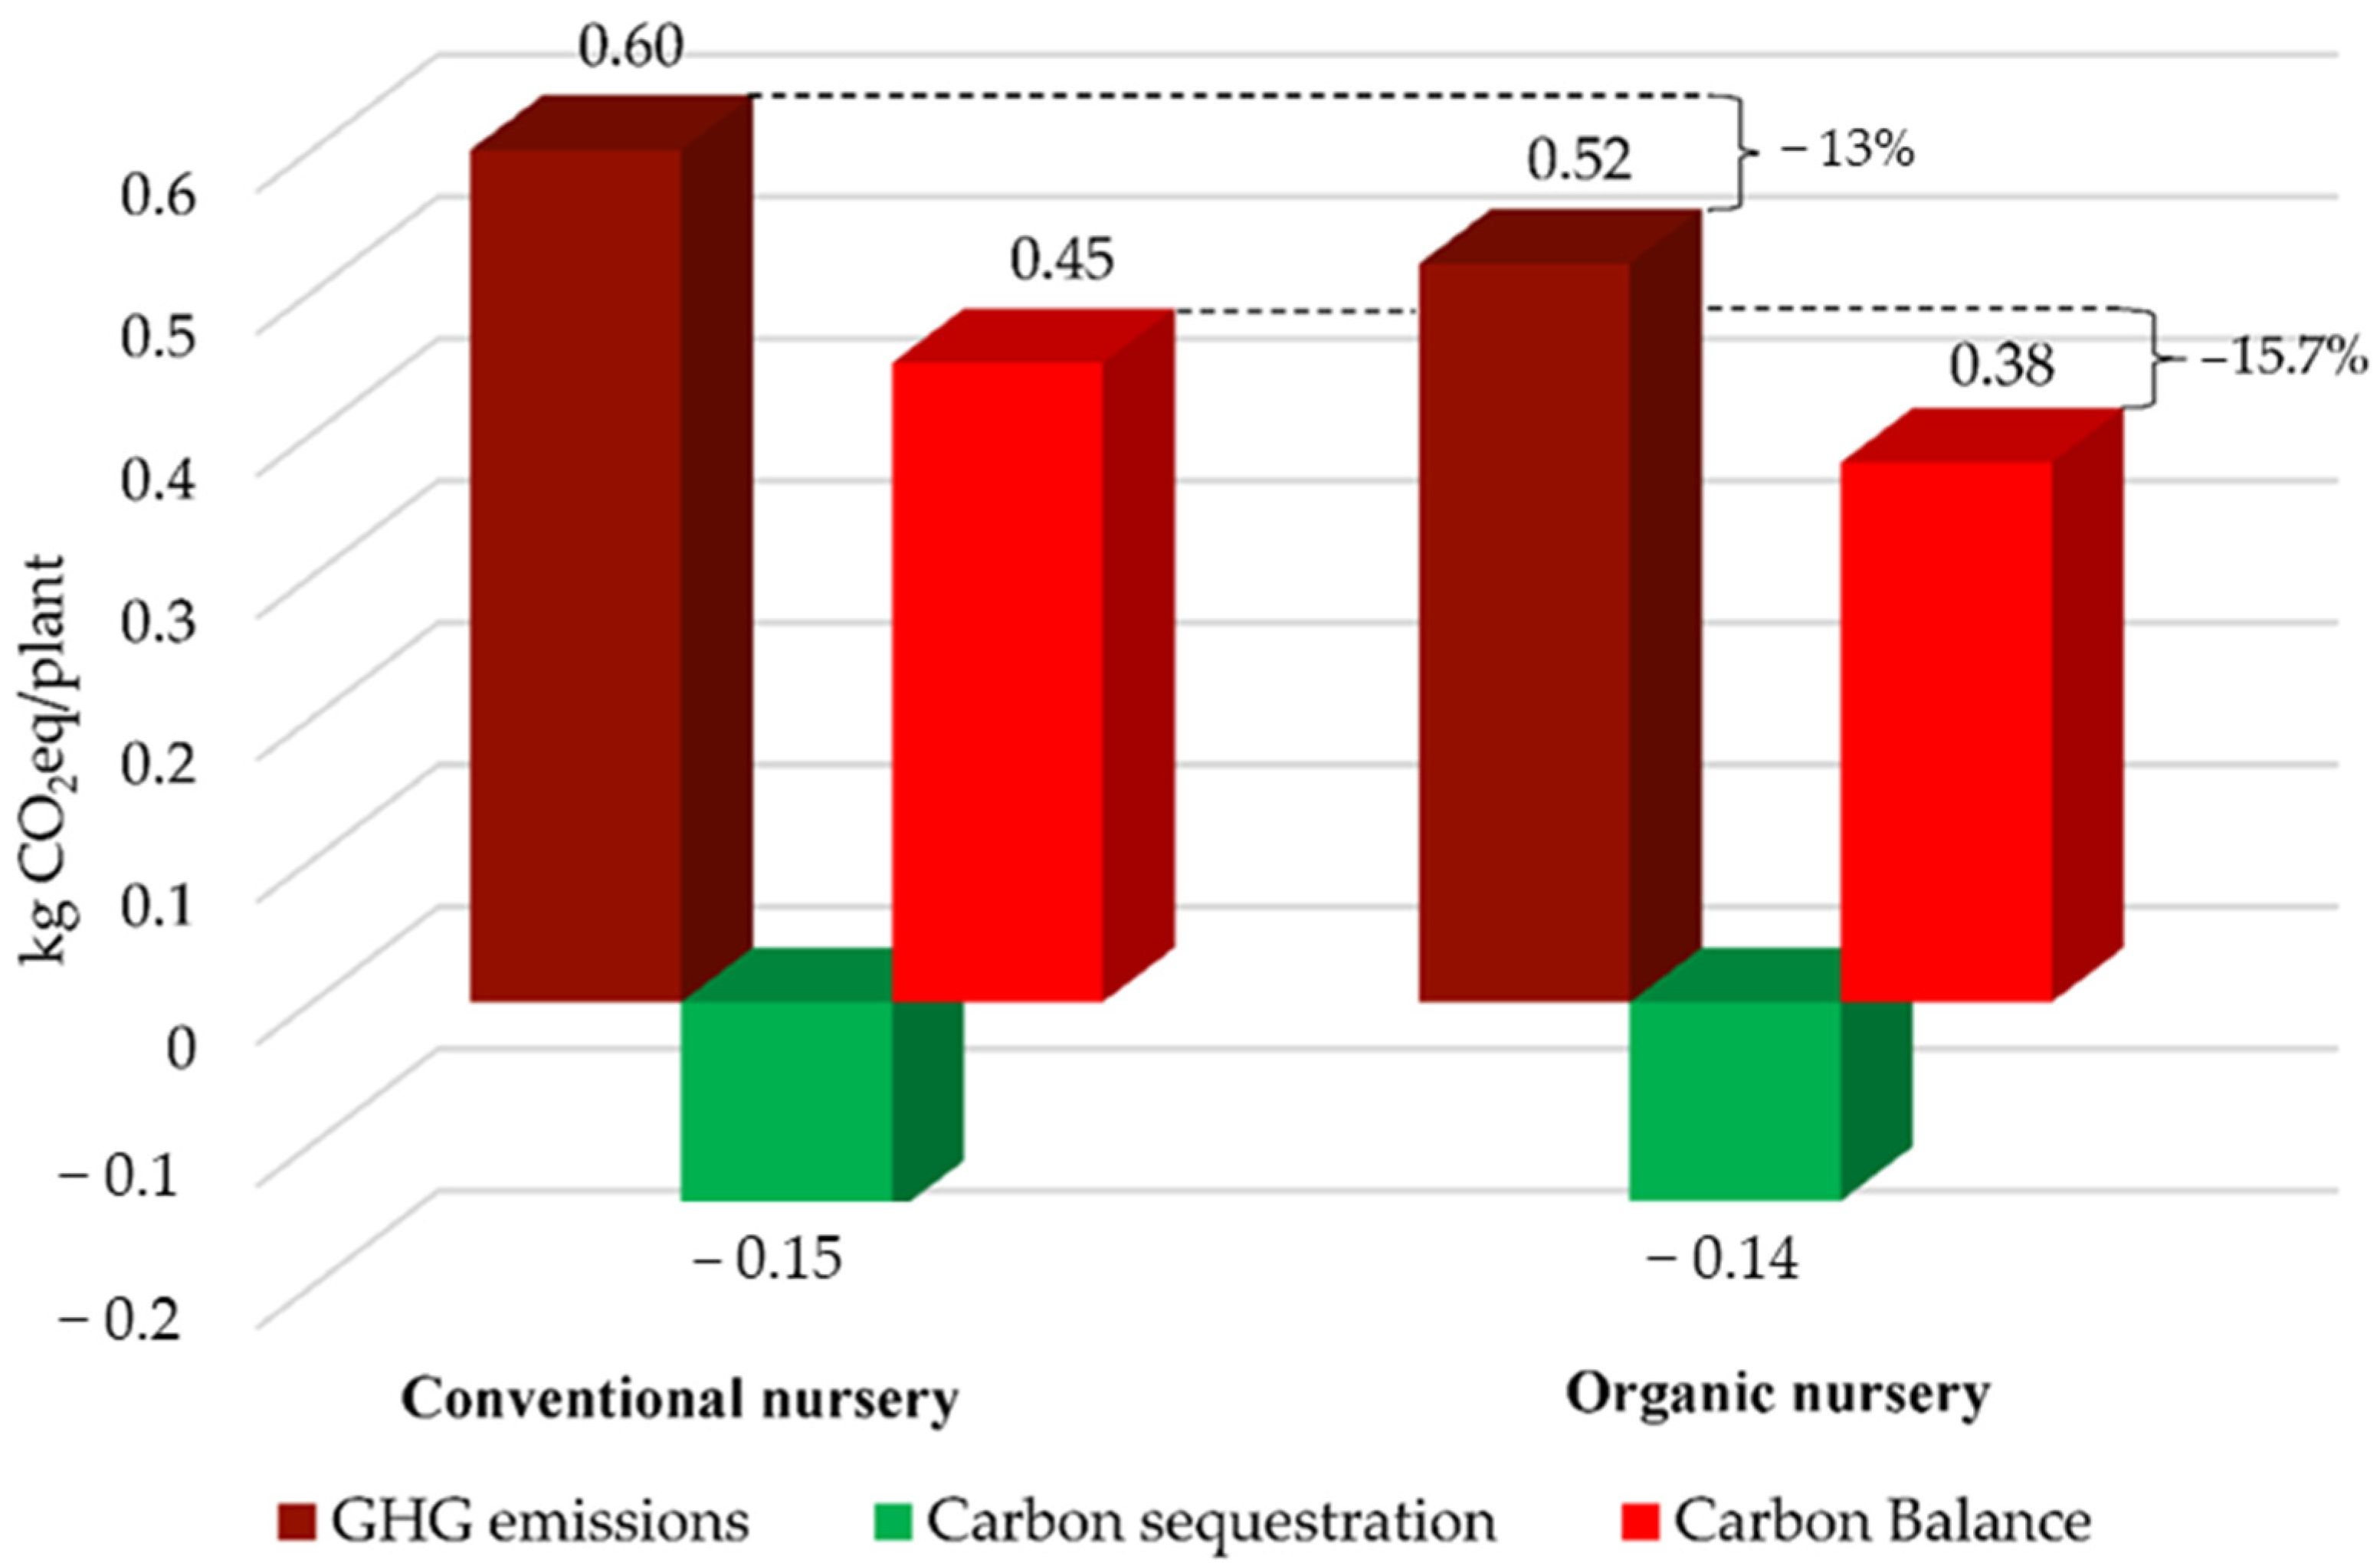
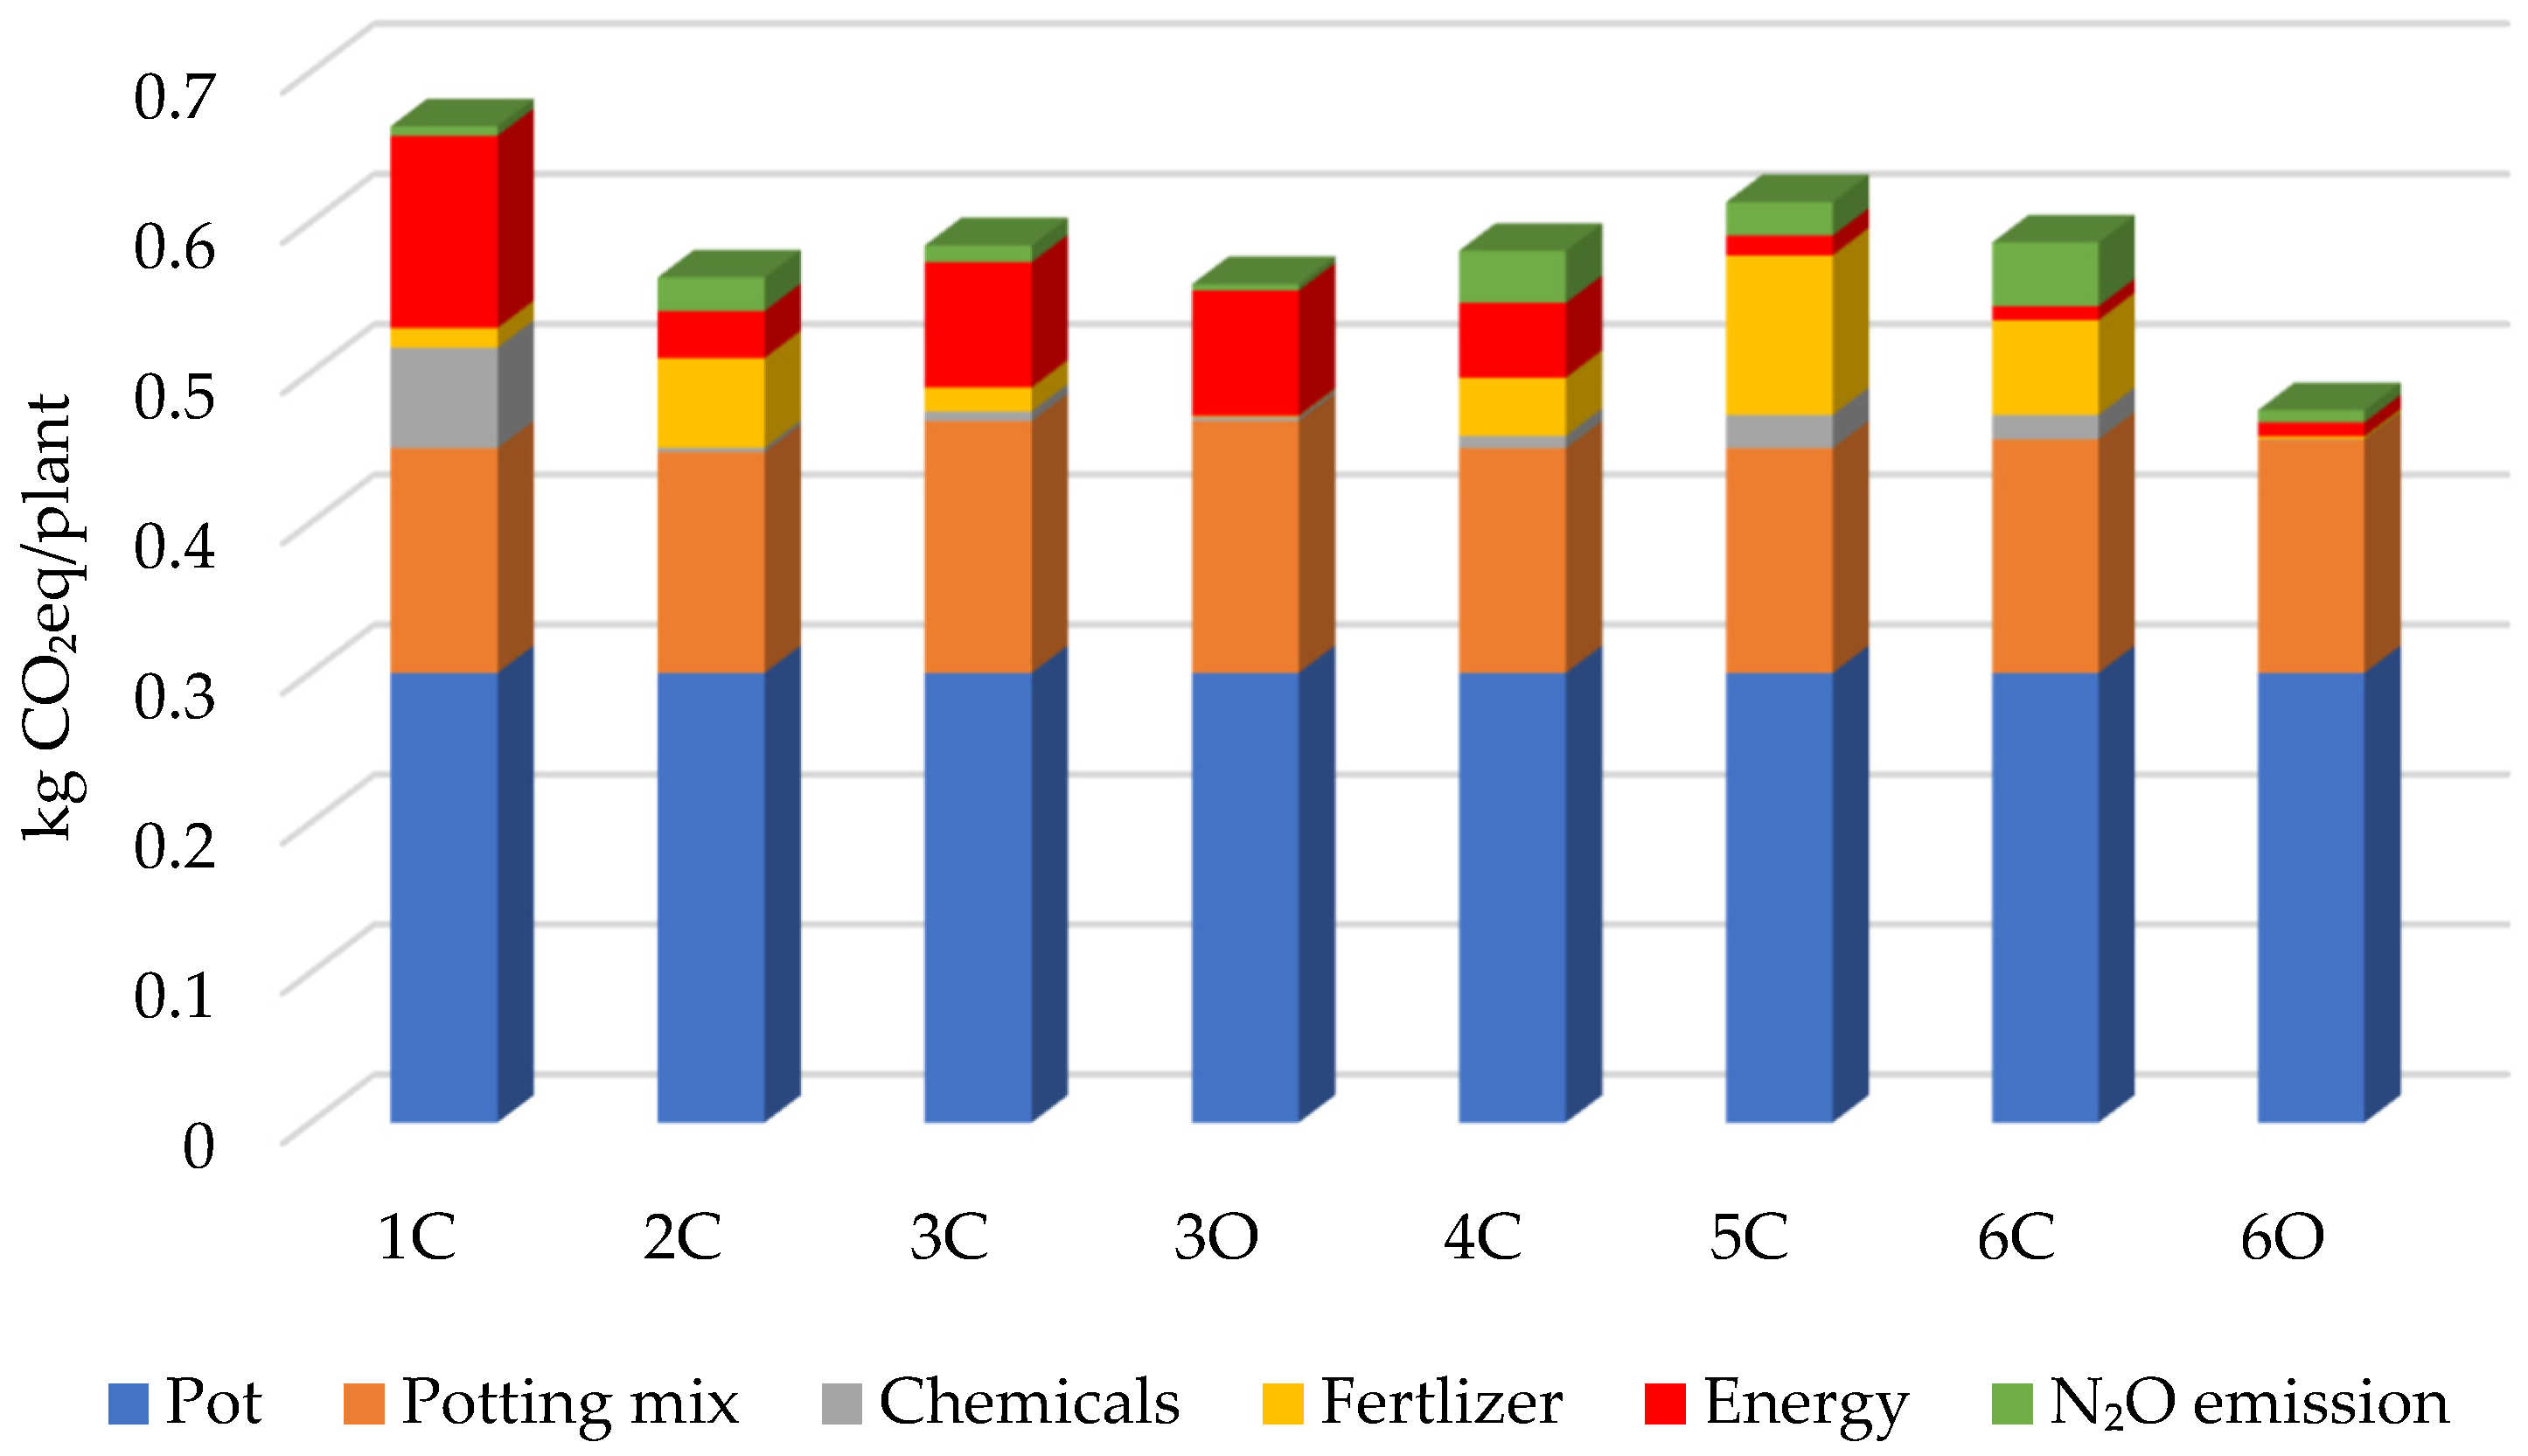
3.1. GHG Emissions
3.1.1. Carbon Balance
3.1.2. Sensitivity Analysis Results
4. Discussion
5. Conclusions
Author Contributions
Funding
Institutional Review Board Statement
Informed Consent Statement
Data Availability Statement
Acknowledgments
Conflicts of Interest
References
- Vossen, P. Olive Oil: History, Production, and Characteristics of the World’s Classic Oils. HortScience 2007, 42, 1093–1100. [Google Scholar] [CrossRef] [Green Version]
- FAOSTAT. 2018. Available online: http://www.fao.org/faostat/en/#data/QC (accessed on 18 February 2021).
- Vilar, J.; Pereira, J.E.; Urieta, D.; Menor, A.; Cano, S.; Barreal, J.; Velasco, M.; Puentes, R. International olive growing. In Worldwide Analysis and Summary, 1st ed.; Fundacion Caja Rural Jaen: La Carolina, Spain, 2018. [Google Scholar]
- Tregua, M.; D’Auria, A.; Marano-Marcolini, C. Oleotourism: Local actors for local tourism development. Sustainability 2018, 10, 1492. [Google Scholar] [CrossRef] [Green Version]
- D’Auria, A.; Marano-Marcolini, C.; Čehić, A.; Tregua, M. Oleotourism: A comparison of three mediterranean countries. Sustainability 2020, 12, 8995. [Google Scholar] [CrossRef]
- Torres, M.; Pierantozzi, P.; Searles, P.; Rousseaux, M.C.; García-Inza, G.; Miserere, A.; Bodoira, R.; Contreras, C.; Maestri, D. Olive cultivation in the southern hemisphere: Flowering, water requirements and oil quality responses to new crop environments. Front. Plant Sci. 2017, 8, 1830. [Google Scholar] [CrossRef] [PubMed] [Green Version]
- Maesano, G.; Chinnici, G.; Falcone, G.; Bellia, C.; Raimondo, M.; D’Amico, M. Economic and Environmental Sustainability of Olive Production: A Case Study. Agronomy 2021, 11, 1753. [Google Scholar] [CrossRef]
- Petruccelli, R.; Micheli, M.; Proietti, P.; Ganino, T. Moltiplicazione dell’olivo e vivaismo olivicolo in Italia. Italus Hortus 2012, 19, 3–22. [Google Scholar]
- Council Regulation (EC) No 834/2007 of 28 June 2007 on Organic Production and Labelling of Organic Products and Repealing Regulation (EEC) No 2092/91. Available online: https://eur-lex.europa.eu/legal-content/EN/TXT/?uri=CELEX%3A32007R0834 (accessed on 10 December 2020).
- Niggli, U.; Schmid, H.; Fließbach, A. Organic Farming and Climate Change; Doc. No. MDS-08-152.E.; International Trade Centre UNCTAD/WTO and Research Institute of Organic Agriculture (FiBL): Geneva, Switzerland, 2007; p. 27. [Google Scholar]
- Niggli, U.; Fließbach, A.; Hepperly, P.; El-Hage-Scialabba, N. Low Greenhouse Gas Agriculture: Mitigation and Adaptation Potential of Sustainable Farming Systems; Food and Agriculture Organization of the United Nations: Rome, Italy, 2009. [Google Scholar]
- Nemecek, T.; Dubois, D.; Huguenin-Elie, O.; Gaillard, G. Life cycle assessment of Swiss farming system: I. Integrated and organic farming. Agric. Syst. 2011, 104, 217–232. [Google Scholar] [CrossRef]
- Nemecek, T.; Huguenin-Elie, O.; Dubois, D.; Gaillard, G.; Schaller, B.; Chervet, A. Life cycle assessment of Swiss farming system: I. Extensive and intensive production. Agric. Syst. 2011, 104, 233–245. [Google Scholar] [CrossRef]
- Seufert, V.; Ramankutty, N.; Foely, J.A. Comparing the yields of organic and conventional agriculture. Nature 2012, 485, 229–232. [Google Scholar] [CrossRef]
- Aguilera, E.; Guzmán, G.; Alonso, A. Greenhouse gas emissions from conventional and organic cropping systems in Spain. II. Fruit tree orchards. Agron. Sustain. Dev. 2014, 35, 725–737. [Google Scholar] [CrossRef] [Green Version]
- Lazzerini, G.; Lucchetti, S.; Nicese, F.P. Analysis of greenhouse gas emissions from ornamental plant production: A nursery level approach. Urban For. Urban Green. 2014, 13, 517–525. [Google Scholar] [CrossRef]
- Meier, M.S.; Stoessel, F.; Jungbluth, N.; Juraske, R.; Schader, C.; Stolze, M. Environmental impacts of organic and conventional agricultural products-Are the differences captured by life cycle assessment? J. Environ. Manag. 2015, 149, 193–208. [Google Scholar] [CrossRef]
- Roy, P.; Nei, D.; Orikasa, T.; Xu, Q.; Okadome, H.; Nakamura, N.; Shiina, T. A review of life cycle assessment (LCA) on some food products. J. Food Eng. 2009, 90, 1–10. [Google Scholar] [CrossRef]
- Casey, J.W.; Holden, N.M. Quantification of GHG emissions from sucker-beef production in Ireland. Agric. Syst. 2006, 90, 79–98. [Google Scholar] [CrossRef]
- Casey, J.W.; Holden, N.M. GHG emissions from conventional, agri-environmental and organic Irish suckler beef units. J. Environ. Qual. 2006, 35, 231–239. [Google Scholar] [CrossRef]
- Audsley, A.; Alber, S.; Clift, R.; Cowell, S.; Crettaz, R.; Gaillard, G.; Hausheer, J.; Jolliett, O.; Kleijn, R.; Mortensen, B.; et al. Harmonisation of environmental Life Cycle Assessment for agriculture. Final report, concerted action AIR3-CT94-2028. In Proceedings of the European commission DG VI, Brussels, Belgium, 30 April 1997; p. 139. [Google Scholar]
- Ceuterick, D. (Ed.) Proceedings of the International Conference on Application of Life Cycle Assessment in Agriculture, Food and Non-Food Agroindustry and Forestry, Brussels, Belgium, 4–5 April 1996; VITO: Brussels, Belgium, 1996; p. 334.
- Ceuterick, D. (Ed.) Proceedings of the International Conference on Life Cycle Assessment in Agriculture, Agro-Industry and Forestry, Brussels, Belgium, 3–4 December 1998; VITO: Brussels, Belgium, 1998; p. 250.
- Williams, A.G.; Audsley, E.; Sandars, D.L. Determining the environmental burdens and resource use in the production of agricultural and horticultural commodities. In Main Report, Defra Research Project IS0205; Cranfield University and Defra, 2006. Available online: http://www.defra.go.uk (accessed on 25 September 2008).
- Warner, D.J.; Davies, M.; Hipps, N.; Osborne, N.; Tzilivakis, J.; Lewis, K.A. Greenhouse gas emissions and energy use in UK-grown short-day strawberry (Fragaria × ananassa Duch) crops. J. Agric. Sci. 2010, 148, 667–681. [Google Scholar] [CrossRef] [Green Version]
- Cerutti, A.K.; Beccaro, G.L.; Bagliani, M.; Donno, D.; Bounus, G. Multifunctional Ecological Footprint Analysis for assessing eco-efficiency: A case study of fruit production systems in Northern Italy. J. Clean. Prod. 2013, 40, 108–117. [Google Scholar] [CrossRef] [Green Version]
- Cerutti, A.K.; Beccaro, G.L.; Bruun, S.; Bosco, S.; Donno, D.; Notarnicola, B.; Bounus, G. LCA application in the fruit sector: State of art and recommendations for environmental declarations of fruit products. J. Clean. Prod. 2014, 73, 125–135. [Google Scholar] [CrossRef]
- Cambria, D.; Pierangeli, D. A life cycle assessment case study for walnut tree (Juglans regia L.) seedlings production. Int. J. Life Cycle Assess. 2011, 16, 859–868. [Google Scholar] [CrossRef]
- Kendall, A.; McPherson, E.G. A life cycle greenhouse gas inventory of a tree production system. Int. J. Life Cycle Assess. 2012, 17, 444–452. [Google Scholar] [CrossRef]
- Ingram, D.L. Life cycle assessment of a field-grown red maple tree to estimate its carbon footprint components. Int. J. Life Cycle Assess. 2012, 17, 453–462. [Google Scholar] [CrossRef]
- Ingram, D.L. Life Cycle Assessment to Study Carbon Footprint of System Components for Colorado Blue Spruce Field Production and Use. J. Am. Soc. Hortic. Sci. 2013, 138, 3–11. [Google Scholar] [CrossRef] [Green Version]
- Beccaro, G.L.; Cerutti, A.K.; Vandecasteele, I.; Bonvenga, L.; Donno, D.; Bounous, G. Assessing environmental impacts of nursery production: Methodological issues and results from a case study in Italy. J. Clean. Prod. 2014, 80, 159–169. [Google Scholar] [CrossRef]
- Lazzerini, G.; Lucchetti, S.; Nicese, F.P. GHG emissions from the ornamental plant nursery industry: A LCA approach in a nursery district in center Italy. J. Clean. Prod. 2016, 112, 4022–4030. [Google Scholar] [CrossRef]
- Tuomisto, H.L.; Hodge, I.D.; Riordan, P.; Macdonald, D.W. Does organic farming reduce environmental impacts? e A meta-analysis of European research. J. Environ. Manag. 2012, 112, 309–320. [Google Scholar] [CrossRef] [PubMed]
- Venkat, K. Comparison of twelve organic and conventional farming systems: A life cycle greenhouse gas emissions perspective. J. Sustain. Agric. 2012, 36, 620–649. [Google Scholar] [CrossRef]
- Strohbach, M.W.; Arnold, E.; Haase, D. The carbon footprint of urban green space—A life cycle approach. Landsc. Urban Plan. 2012, 104, 220–229. [Google Scholar] [CrossRef]
- McPherson, E.G.; Kendall, A.; Albers, S. Life cycle assessment of carbon dioxide for different arboricultural practices in Los Angeles, CA. Urban For. Urban Green. 2015, 14, 388–397. [Google Scholar] [CrossRef]
- Spampinato, G.; Malerba, A.; Calabrò, F.; Bernardo, C.; Musarella, C. Cork Oak Forest Spatial Valuation toward Post Carbon City by CO2 Sequestration; Bevilacqua, C., Calabrò, F., Spina, L.D., Eds.; Springer International Publishing: Cham, Switzerland, 2021; pp. 1321–1331. [Google Scholar] [CrossRef]
- Marble, S.C.; Prior, S.A.; Runion, G.B.; Torbert, H.A.; Gilliam, G.H.; Fain, G.B. The importance of determining carbon sequestration and greenhouse gas mitigation potential in ornamental horticulture. HortScience 2011, 46, 240–244. [Google Scholar] [CrossRef] [Green Version]
- Baldo, G.L.; Mariono, M.; Rossi, S. Analisi del ciclo di vita LCA. In Manuali di Progettazione Sostenibile; Edizioni Ambiente: Milano, Italy, 2008. [Google Scholar]
- IPCC—Intergovernmental Panel on Climate Change. Climate change 2007. The physical science basis. In Contribution of Working Group I to the Fourth Assessment Report of the Intergovernmental Panel on Climate Change; Intergovernmental Panel on Climate Change: Cambridge, UK, 2007. [Google Scholar]
- EN ISO 14044:2006; Environmental Management—Life Cycle Assessment—Requirements and Guidelines. International Standards Authority (ISO): Geneva, Switzerland, 2006.
- PAS 2050:2011; Specification for the Assessment of the Life Cycle Greenhouse Gas Emissions of Goods and Services. BSI British Standards (Publicly Available Specification); BSI Group: London, UK, 2008; p. 45.
- Nicese, F.P.; Lazzerini, G. CO2 Sources and Sink in Ornamental Plant Nurseries. International Symposium of the WoodyOrnamentals of the Moderate Zone, At Ghent, Belgium. Acta Hortic. 2013, 990, 91–98. [Google Scholar] [CrossRef]
- Meisterilng, K.; Samaras, C.; Schweizer, V. Decisions to reduce greenhouse gases from agriculture and product transport: LCA case study of organic and conventional wheat. J. Clean. Prod. 2009, 17, 222–230. [Google Scholar] [CrossRef]
- Cellura, M.; Ardente, F.; Longo, S. From LCA of food products to the environmental assessment of protected crops districts: A case-study in the south of Italy. J. Environ. Manag. 2012, 93, 194–208. [Google Scholar] [CrossRef]
- Ketterings, M.; Coe, R.; Van Noordwjk, M.; Ambagau, Y.; Palm, C.A. Reducing uncertainly in the use of allometric biomass equation for predicting above-ground tree biomass in mixed secondary forests. For. Ecol. Manag. 2001, 146, 199–209. [Google Scholar] [CrossRef]
- Nordh, N.E.; Verwijst, T. Above-ground biomass assessments and first cutting cycle production in willow (Salix sp.) coppice—A comparison between destructive and non-destructive methods. Biomass Bioenergy 2004, 27, 1–8. [Google Scholar] [CrossRef]
- Dewar, R.C.; Cannell, M.G.R. Carbon sequestration in the trees, products and soils of forest plantations: An analysis using UK examples. Tree Physiol. 1992, 11, 49–71. [Google Scholar] [CrossRef]
- Cederberg, C.; Mattsson, B. Life cycle assessment of milk production—A comparison of conventional and organic farming. J. Clean. Prod. 2000, 8, 49–60. [Google Scholar] [CrossRef] [Green Version]
- Haas, G.; Wetterich, F.; Kopke, U. Comparing intensive, extensified and organic grassland farming in southern Germany by process life cycle assessment. Agric. Ecosyst. Environ. 2001, l83, 43–53. [Google Scholar] [CrossRef] [Green Version]
- Flessa, H.; Ruser, R.; Dörsch, P.; Kamp, T.; Jimenez, M.A.; Munch, J.C.; Beese, F. Integrated evaluation of greenhouse gas emissions (CO2, CH4, N2O) from two farming systems in southern Germany. Agric. Ecosyst. Environ. 2002, 91, 175–189. [Google Scholar] [CrossRef]
- De Boer, I.J.M. Environmental impact assessment of conventional and organic milk production. Livest. Prod. Sci. 2003, 80, 69–77. [Google Scholar] [CrossRef]
- Pelletier, N.; Pirog, R.; Rasmussen, R. Comparative life cycle environmental impacts of three beef production strategies in the Upper Midwestern United States. Agric. Syst. 2010, 103, 380–389. [Google Scholar] [CrossRef]
- De Backer, E.; Aertsens, J.; Vergucht, S.; Steurbaut, W. Assessing the ecological soundness of organic and conventional agriculture by means of life cycle assessment (LCA). A case study of leek production. Br. Food J. 2009, 111, 1028–1061. [Google Scholar] [CrossRef] [Green Version]
- Russo, G.; Mugnozza, G.S.; De Lucia Zeller, B. Environmental improvements of greenhouse flower cultivation by means of LCA methodology. Acta Hortic. 2008, 801, 301–308. [Google Scholar] [CrossRef]
- Sahle, A.; Potting, J. Environmental life assessment of Ethiopian rose cultivation. Sci. Total Environ. 2013, 443, 163–172. [Google Scholar] [CrossRef] [PubMed]
- Girgenti, V.; Peano, C.; Bounous, M.; Baudino, C. A life cycle assessment of non-renewable energy use and greenhouse gas emissions associated with blueberry and raspberry production in northern Italy. Sci. Total Environ. 2013, 458, 414–418. [Google Scholar] [CrossRef] [PubMed] [Green Version]
- Nambuthiri, S.; Fulcher, A.; Koeser, A.K.; Geneve, R.; Niu, G. Moving toward sustainability with alternative containers for greenhouse and nursery crop production: A review and research update. HortTechnology 2015, 25, 8–16. [Google Scholar] [CrossRef] [Green Version]
- Barrett, G.E.; Alexander, P.D.; Robinson, J.S.; Bragg, N.C. Achieving environmentally sustainable growing media for soilless plant cultivation systems—A review. Sci. Hortic. 2016, 212, 220–234. [Google Scholar] [CrossRef] [Green Version]
- Atzori, G.; Pane, C.; Zaccardelli, M.; Cacini, S.; Massa, D. The Role of Peat-Free Organic Substrates in the Sustainable Management of Soilless Cultivations. Agronomy 2021, 11, 1236. [Google Scholar] [CrossRef]
- Mattei, P.; Gnesini, A.; Gonnelli, C.; Marraccini, C.; Masciandaro, G.; Macci, C.; Lucchetti, S.; Nicese, F.P.; Renella, G. Phytoremediated marine sediments as suitable peat-free growing media for production of red robin photinia (Photinia × fraseri). Chemosphere 2018, 201, 595–602. [Google Scholar] [CrossRef]
- Arfaioli, P.; Azzini, L.; Cincinelli, A.; Heřmánková, M.; Lucchetti, S.; Macci, C.; Renella, G.; Waska, K.; Nicese, F.P. Waste materials-based substrates for ornamental plant production: Technical and environmental aspects. Acta Hortic. 2021, 1317, 79–86. [Google Scholar] [CrossRef]
- Fryda, L.; Visser, R.; Schmidt, J. Biochar replaces peat in horticulture: Environmental impact assessment of combined biochar & bioenergy production. Detritus 2019, 5, 132–149. [Google Scholar]
- Proietti, P.; Sdringola, P.; Brunori, A.; Ilarioni, L.; Nasini, L.; Regni, L.; Pelleri, F.; Desideri, U.; Proietti, S. Assessment of carbon balance in intensive and extensive tree cultivation systems for oak, olive, poplar and walnut plantation. J. Clean. Prod. 2016, 112, 2613–2624. [Google Scholar] [CrossRef]
- Nicese, F.P.; Colangelo, G.; Comolli, R.; Azzini, L.; Lucchetti, S.; Marziliano, P.A.; Sanesi, G. Estimating CO2 balance through the Life Cycle Assessment prism: A case–Study in an urban park. Urban For. Urban Green. 2021, 57, 126869. [Google Scholar] [CrossRef]
- Sgroi, F.; Foderà, M.; Di Trapani, A.M.; Tudisca, S.; Testa, R. Cost-benefit analysis: A comparison between conventional and organic olive growing in the Mediterranean Area. Ecol. Eng. 2015, 82, 542–546. [Google Scholar] [CrossRef]


| Nursery | Density (plants/m2) | Conventional Nursery Surface (ha) | Organic Nursery Surface (ha) | Pot Volume (l) | Substrate (%) |
|---|---|---|---|---|---|
| 1C | 12 | 5.0 | 3 | Pe 1 50%-Pu 2 50% | |
| 2C | 12 | 5.0 | 3 | Pe 50%-Pu 40%-Co 3 10% | |
| 3C/O | 12 | 3.8 | 1.0 | 3 | Pe 65%-Pu 35% |
| 4C | 10 | 2.3 | 3 | Pe 50%-Pu 50% | |
| 5C | 8 | 2.5 | 3 | Pe 50%-Pu 50% | |
| 6C/O | 8 | 2.0 | 0.5 | 3 | Pe 55%-Pu 45% |
| Olive Tree Cultivars | Management System | Woody Biomass (Wt1 − Wt0) | Carbon Content (CC) | |||
|---|---|---|---|---|---|---|
| Above Ground Biomass (g) | Roots Biomass (g) | Total Biomass (g) | Above Ground Biomass (%) | Roots Biomass (%) | ||
| Maurino | conventional | 71.9 ± 18.0 | 23.8 ± 9.6 | 95.7 ± 27.6 | 44.6 | 45.5 |
| Maurino | organic | 48.1 ± 6.9 | 21.7 ± 5.8 | 69.9 ± 9.7 | 46.0 | 47.0 |
| Frantoio | conventional | 41.0 ± 8.1 | 13.8 ± 4.1 | 54.8 ± 12.0 | 46.2 | 45.4 |
| Frantoio | organic | 50.3 ± 10.4 | 18.9 ± 8.3 | 69.2 ± 18.4 | 46.2 | 48.9 |
| Leccino | conventional | 84.4 ± 11.7 | 25.5 ± 6.2 | 109.9 ± 16.2 | 45.3 | 45.6 |
| Leccino | organic | 75.0 ± 8.1 | 26.2 ± 3.6 | 101.2 ± 6.9 | 46.7 | 44.6 |
| Input | 1C | 2C | 3C | 4C | 5C | 6C | 3O | 6O |
|---|---|---|---|---|---|---|---|---|
| Pot | 0.300 | 0.300 | 0.300 | 0.300 | 0.300 | 0.300 | 0.300 | 0.300 |
| Potting mix: | ||||||||
| Peat | 0.105 | 0.105 | 0.136 | 0.105 | 0.105 | 0.115 | 0.136 | 0.115 |
| Pumice | 0.045 | 0.036 | 0.031 | 0.045 | 0.045 | 0.040 | 0.031 | 0.040 |
| Coconut fiber | 0.000 | 0.006 | 0.000 | 0.000 | 0.000 | 0.000 | 0.000 | 0.000 |
| Total | 0.150 | 0.147 | 0.168 | 0.150 | 0.150 | 0.156 | 0.168 | 0.156 |
| Chemicals: | ||||||||
| Herbicides | 0.003 | 0.003 | 0.006 | 0.002 | 0.018 | 0.002 | ||
| Fungicides | 0.0001 | 0.0002 | 0.0002 | 0.0004 | ||||
| Insecticides | 0.064 | 0.000 | 0.001 | 0.007 | 0.004 | 0.014 | 0.003 | 0.0001 |
| Total | 0.067 | 0.003 | 0.007 | 0.008 | 0.022 | 0.016 | 0.003 | 0.0001 |
| Fertilizer: | ||||||||
| Controlled release fertilizer | 0.010 | 0.008 | 0.004 | 0.020 | ||||
| Organic nitrogen | 0.004 | 0.000 | 0.005 | 0.003 | 0.000 | 0.008 | ||
| Inorganic/organic 1 fertilized used in ferti-irrigation | 0.009 | 0.049 | 0.003 | 0.036 | 0.102 | 0.035 | 0.001 | 0.002 |
| Total | 0.013 | 0.060 | 0.016 | 0.039 | 0.106 | 0.063 | 0.001 | 0.002 |
| Energy: | ||||||||
| Electric power | 0.001 | 0.001 | 0.002 | 0.004 | 0.002 | 0.003 | 0.002 | 0.003 |
| Fuel for machine use | 0.127 | 0.030 | 0.020 | 0.046 | 0.011 | 0.006 | 0.020 | 0.006 |
| Fuel for greenhouse | 0.000 | 0.000 | 0.061 | 0.000 | 0.000 | 0.000 | 0.061 | 0.000 |
| Total | 0.128 | 0.031 | 0.083 | 0.050 | 0.013 | 0.009 | 0.083 | 0.009 |
| N2O emission | 0.006 | 0.022 | 0.011 | 0.035 | 0.022 | 0.042 | 0.004 | 0.008 |
| Total Emissions | 0.664 | 0.563 | 0.585 | 0.581 | 0.613 | 0.586 | 0.559 | 0.475 |
| Cultivar | Management System | Trunk and Branches (kg CO2/plant) | Root (kg CO2/plant) | Total (kg CO2/plant) |
|---|---|---|---|---|
| Maurino | Conventional | 0.118 ± 0.033 | 0.039 ± 0.018 | 0.157 ± 0.051 |
| Maurino | Organic | 0.081 ± 0.013 | 0.039 ± 0.011 | 0.120 ± 0.018 |
| Frantoio | Conventional | 0.069 ± 0.015 | 0.025 ± 0.008 | 0.094 ± 0.023 |
| Frantoio | Organic | 0.084 ± 0.020 | 0.032 ± 0.017 | 0.115 ± 0.036 |
| Leccino | conventional | 0.144 ± 0.022 | 0.042 ± 0.012 | 0.186 ± 0.030 |
| Leccino | Organic | 0.128 ± 0.016 | 0.043 ± 0.007 | 0.171 ± 0.013 |
| Sensitivity (%) | 1C | 2C | 3C | 4C | 5C | 6C | 3O | 6O |
|---|---|---|---|---|---|---|---|---|
| Pot | 4.519 | 5.325 | 5.132 | 5.164 | 4.890 | 5.115 | 5.369 | 6.317 |
| Potting mix | 2.254 | 2.609 | 2.868 | 2.576 | 2.439 | 2.654 | 3.001 | 3.277 |
| Chemicals | 1.008 | 0.051 | 0.112 | 0.141 | 0.362 | 0.276 | 0.047 | 0.003 |
| Fertilizer | 0.196 | 1.060 | 0.271 | 0.665 | 1.730 | 1.074 | 0.016 | 0.035 |
| Energy | 1.927 | 0.558 | 1.427 | 0.858 | 0.214 | 0.159 | 1.493 | 0.196 |
| N2O emissions | 0.096 | 0.397 | 0.191 | 0.596 | 0.364 | 0.721 | 0.074 | 0.172 |
Publisher’s Note: MDPI stays neutral with regard to jurisdictional claims in published maps and institutional affiliations. |
© 2022 by the authors. Licensee MDPI, Basel, Switzerland. This article is an open access article distributed under the terms and conditions of the Creative Commons Attribution (CC BY) license (https://creativecommons.org/licenses/by/4.0/).
Share and Cite
Lazzerini, G.; Manzini, J.; Lucchetti, S.; Nin, S.; Nicese, F.P. Greenhouse Gas Emissions and Carbon Sequestration from Conventional and Organic Olive Tree Nurseries in Tuscany, Italy. Sustainability 2022, 14, 16526. https://doi.org/10.3390/su142416526
Lazzerini G, Manzini J, Lucchetti S, Nin S, Nicese FP. Greenhouse Gas Emissions and Carbon Sequestration from Conventional and Organic Olive Tree Nurseries in Tuscany, Italy. Sustainability. 2022; 14(24):16526. https://doi.org/10.3390/su142416526
Chicago/Turabian StyleLazzerini, Giulio, Jacopo Manzini, Stefano Lucchetti, Stefania Nin, and Francesco Paolo Nicese. 2022. "Greenhouse Gas Emissions and Carbon Sequestration from Conventional and Organic Olive Tree Nurseries in Tuscany, Italy" Sustainability 14, no. 24: 16526. https://doi.org/10.3390/su142416526
APA StyleLazzerini, G., Manzini, J., Lucchetti, S., Nin, S., & Nicese, F. P. (2022). Greenhouse Gas Emissions and Carbon Sequestration from Conventional and Organic Olive Tree Nurseries in Tuscany, Italy. Sustainability, 14(24), 16526. https://doi.org/10.3390/su142416526