Article

Temporal and Spatial Variation of Land Use and Vegetation in the Three–North Shelter Forest Program Area from 2000 to 2020

1
College of Geography and Environment Sciences, Northwest Normal University, Lanzhou 730070, China
2
Key Laboratory of Resource Environment and Sustainable Development of Oasis, Lanzhou 730070, China
3
College of Forestry Engineering, Gansu Forestry Polytechnic, Tianshui 741020, China
4
Surveying and Mapping Engineering Institute of Gansu Province, Lanzhou 730070, China
*
Author to whom correspondence should be addressed.
Sustainability 2022, 14(24), 16489; https://doi.org/10.3390/su142416489
Submission received: 16 October 2022 / Revised: 29 November 2022 / Accepted: 7 December 2022 / Published: 9 December 2022
(This article belongs to the Special Issue Oasis Resources Environment and Sustainable Development)

Abstract

:
The Three–North Shelter Forest Program Area (TNSFPA), covering the three subregions of Northwest, North and Northeast China, is an important green ecological barrier in northern China. Research on spatiotemporal variation of land use and vegetation in this area can help us understand the evolution of vegetation recovery. Based on MODIS image data, we built a dataset including land use/cover, annual and seasonal vegetation coverage and vegetation productivity in the TNSFPA from 2000 to 2020, then analyzed their spatiotemporal dynamics’ characteristics and further explored the driving factors. The results demonstrate that 90.05% of land area in the TNSFPA remained unchanged from 2001 to 2020. The area of barren decreased, whereas the area of all other land use types increased. From 2000 to 2020, the vegetation coverage generally presented a spatial pattern of high in the east and low in the west, and the interannual fluctuation of high coverage area was small. More than 90% of the TNSFPA had an increasing vegetation coverage (0.41%·a−1), with the change rates of 0.51%·a−1, 0.54%·a−1 and 0.37%·a−1 in Northeast, North and Northwest China, respectively. The spatial distribution of vegetation productivity was generally consistent with the vegetation coverage, and the interannual fluctuation in areas with low productivity was small. The area with an increasing vegetation productivity (3.41 gC·m−2·a−1) occupied 51.66% of the TNSFPA, mainly in the basic stable state and significantly increased state. The change rates in Northeast, North and Northwest China were 7.34 gC·m−2·a−1, 6.72 gC·m−2·a−1 and 2.10 gC·m−2·a−1, respectively. The vegetation coverage and productivity were positively correlated with climate factors, and the correlation with precipitation is significantly higher than that with temperature. The ecological protection and restoration activities in the TNSFPA have accelerated the recovery of the vegetation ecosystem. Meanwhile, the rapid growth of population has led to the acceleration of urbanization. The intensification of the interaction between humans and land has led to the reclamation and development of barren, which has a great impact on the small–scale vegetation ecosystem.

1. Introduction

Land use and vegetation information are the linkage between human socioeconomic activities and natural ecosystem processes. Both of them have been a staple and hot topic in the research of socioeconomic and environmentally sustainable development [1]. In the IPCC Special Report on Climate Change and Land (SPCCL), issues involving desertification, land degradation, sustainable land management and food security have been paid more attention [2]. Land use and cover change (LUCC) is the most direct signal to reveal the impact of human activities on the natural ecosystems of the Earth’s surface [2] and has a close connection with the mass cycle and life processes of the terrestrial surface, directly influencing biosphere–atmosphere interactions, biodiversity and surface radiation [1,3,4,5,6]. Vegetation, an important node among the atmosphere, soil, biosphere and hydrosphere [7], can indicate the change in terms of global energy transfer, biogeochemistry and hydrological cycle [8,9]. As the producer of organic matter and the input carrier of energy in terrestrial ecosystem, the growth of vegetation is influenced by many factors and plays an irreplaceable role in regional ecological security and sustainable development [10,11,12,13,14,15,16]. Therefore, in the context of global climate change, quantifying LUCC and vegetation change at different spatial scales and their relationship with climate change has become a common scientific issue of climate change and terrestrial surface ecosystem, as well as one of the main elements of global change research [17,18].
The evolution of LUCC and vegetation induced by climate change is mainly reflected in changes of land use types, vegetation coverage and productivity [2]. Therefore, it is of strategic importance to grasp their spatiotemporal evolution characteristics and driving mechanisms for improving land use efficiency, promoting rational utilization of land resources and comprehensively managing land degradation. At present, studies on LUCC mainly focus on its effects on land productivity [19,20,21,22], land use efficiency [23,24,25,26] and carbon emissions [27,28,29]. In the fields of vegetation coverage and productivity, scholars paid attention to regional monitoring and trend analysis [30] and their response to climate change. Most of these studies were concluded in this study area (e.g., administrative divisions [31,32], ecological zones [33,34,35], watersheds [18,36,37,38] and project areas [39,40,41]) and found that vegetation coverage and productivity in most areas showed an increasing trend. However, the overall understanding of LUCC and vegetation changes in the Three–North Shelter Forest Program Area (TNSFPA) and their response to climate change in the past two decades is lacking due to differences in research periods, data sources, methods and indicators.
Satellite remote sensing technology enables us to classify land use and monitor vegetation on a large extent and long time series; therefore, remote sensing data have become the main data source for long-term vegetation studies [30,42,43]. Data products such as the common vegetation index and primary productivity can fully reflect the growth status of plants. The TNSFPA is a very important natural resource reserve and agricultural and livestock production area in China, which has a harsh ecological environment because of the comprehensive influence of natural, human and historical factors. Meanwhile, the TNSFPA is a complicated climate system and land use process, as well as a sensitive ecosystem, due to the impact of significant geographical heterogeneity [44,45]. It leads to large variations in the vegetation and ecological environment within this region [46]. Therefore, it is of great significance to explore the current situation and changing trends of land use and vegetation in the TNSFPA, especially for optimizing the structure of regional land use types, as well as coordinating eco–environment protection and economic development. In this study, we constructed a dataset including land use, annual and seasonal vegetation coverage and productivity in the TNSFPA from 2000 to 2020 based on MCD12Q1, MOD/MYD13A1 and MOD/MYD17A2H data. Moreover, their spatiotemporal evolution characteristics and impact factors were analyzed. This study aims to provide the theoretical support and scientific basis for the quantitative and dynamic monitoring of vegetation coverage, ecological benefits and sustainable development in the TNSFPA.

2. Materials and Methods

2.1. Research Area

The TNSFPA (33°30′~50°12′ N, 73°26′~127°50′ E) is the most important green ecological barrier in in northern China and is known as the “Green Great Wall”. It connects to Binxian County in Heilongjiang Province in the east to the Wuziberi Pass in Xinjiang Uygur Autonomous Region in the west, starting from the Mongolian Plateau in the north, and to the Karakorum Mountains, the Buchang Khanda Mountains, the tributaries of the Yellow River and the Haihe River Basin in the south (Figure 1). It covers 13 provincial administrative regions in China, involving 559 counties (banners and districts), with a total area of 406.90 × 10⁴ km2. This area spans the three gradient terrains in China, featuring high in the west and low in the east [47]. There are intricate landform types in the TNSFPA, including eight deserts, four sandy areas and the vast Gobi Desert, accounting for about 85% of the windswept land area in China [48]. The climate is mainly temperate continental and temperate monsoon, with the characteristics of long sunshine hours, strong radiation and the synchronization of rain and heat. Influenced by the topography and the location of land and sea, the average annual temperature in this area is 2~8 °C, and the annual precipitation generally shows a decreasing trend from east to west and from south to north. On 25 November 1978, the statement “The State Council approved the State Forestry Administration’s plan for building large protective forests in the key areas of wind and sand hazards and soil erosion in the Three–North” was issued, marking the official launch of the construction of the TNSFPA. Over the past forty years, the actual investment was 56.33 billion yuan, including a national investment of 33.86 billion yuan.

2.2. Data

2.2.1. Land Use and Land Cover

In this study, we used MCD12Q1 Land Cover products to obtain LUCC. It is a suite of science data sets (SDSs) that map global land cover at 500 m spatial resolution at annual time step for six different land cover legends, including 5 legacy classification schemes (IGBP, UMD, LAI, BGC, and PFT), a new three-layers legend based on the Land Cover Classification System (LCCS) from the Food and Agriculture Organization [49,50,51] and a quality assurance layer. It is created using supervised classification of MODIS reflectance data [52,53]. We selected the International Geosphere–Biosphere Program (IGBP) legend to reflect LUCC in the study area during 2001–2020.
The IGBP scheme was classified using the C4.5 decision tree algorithm that ingested a full year of 8-days MODIS Nadir BRDF–Adjusted Reflectance data (MCD43A2 and MCD43A4) [54]. There are seventeen land use types in this dataset. In order to better analyze LUCC in the study area, the original 17 categories were integrated into 6 categories (Table 1). It was obtained from the National Space Administration of the United States of America (https://modis.gsfc.nasa.gov/ (accessed on 22 November 2022)).

2.2.2. Vegetation Information Data

In this study, we used MOD/MYD13A1 Vegetation Indices and MOD/MYD17A2H Gross Primary Productivity products to obtain vegetation change information. MOD and MYD with a spatial resolution of 500 m are acquired by the Moderate Resolution Imaging Spectroradiometer (MODIS) on the Terra and Aqua satellites, respectively. In order to reduce the impact of atmospheric and geometric deformation on data accuracy, we adopted the average value of MOD and MYD data in the same time period. They were obtained from the National Space Administration of the United States of America (https://modis.gsfc.nasa.gov/ (accessed on 31 May 2022)).

2.2.3. Meteorological Data

The meteorological data from 2000 to 2020 was adopted to analyze the climate’s trends and its effect on vegetation changes, which have a spatial resolution of 0.5° × 0.5°. Based on the air temperature and precipitation data from 2472 national meteorological stations in China newly compiled by the Basic Program of National Meteorological Information Center (http://data.cma.cn/ (accessed on 31 May 2022)), this dataset was generated spatially using the thin plate spline (TPS) interpolation method.

2.3. Methods

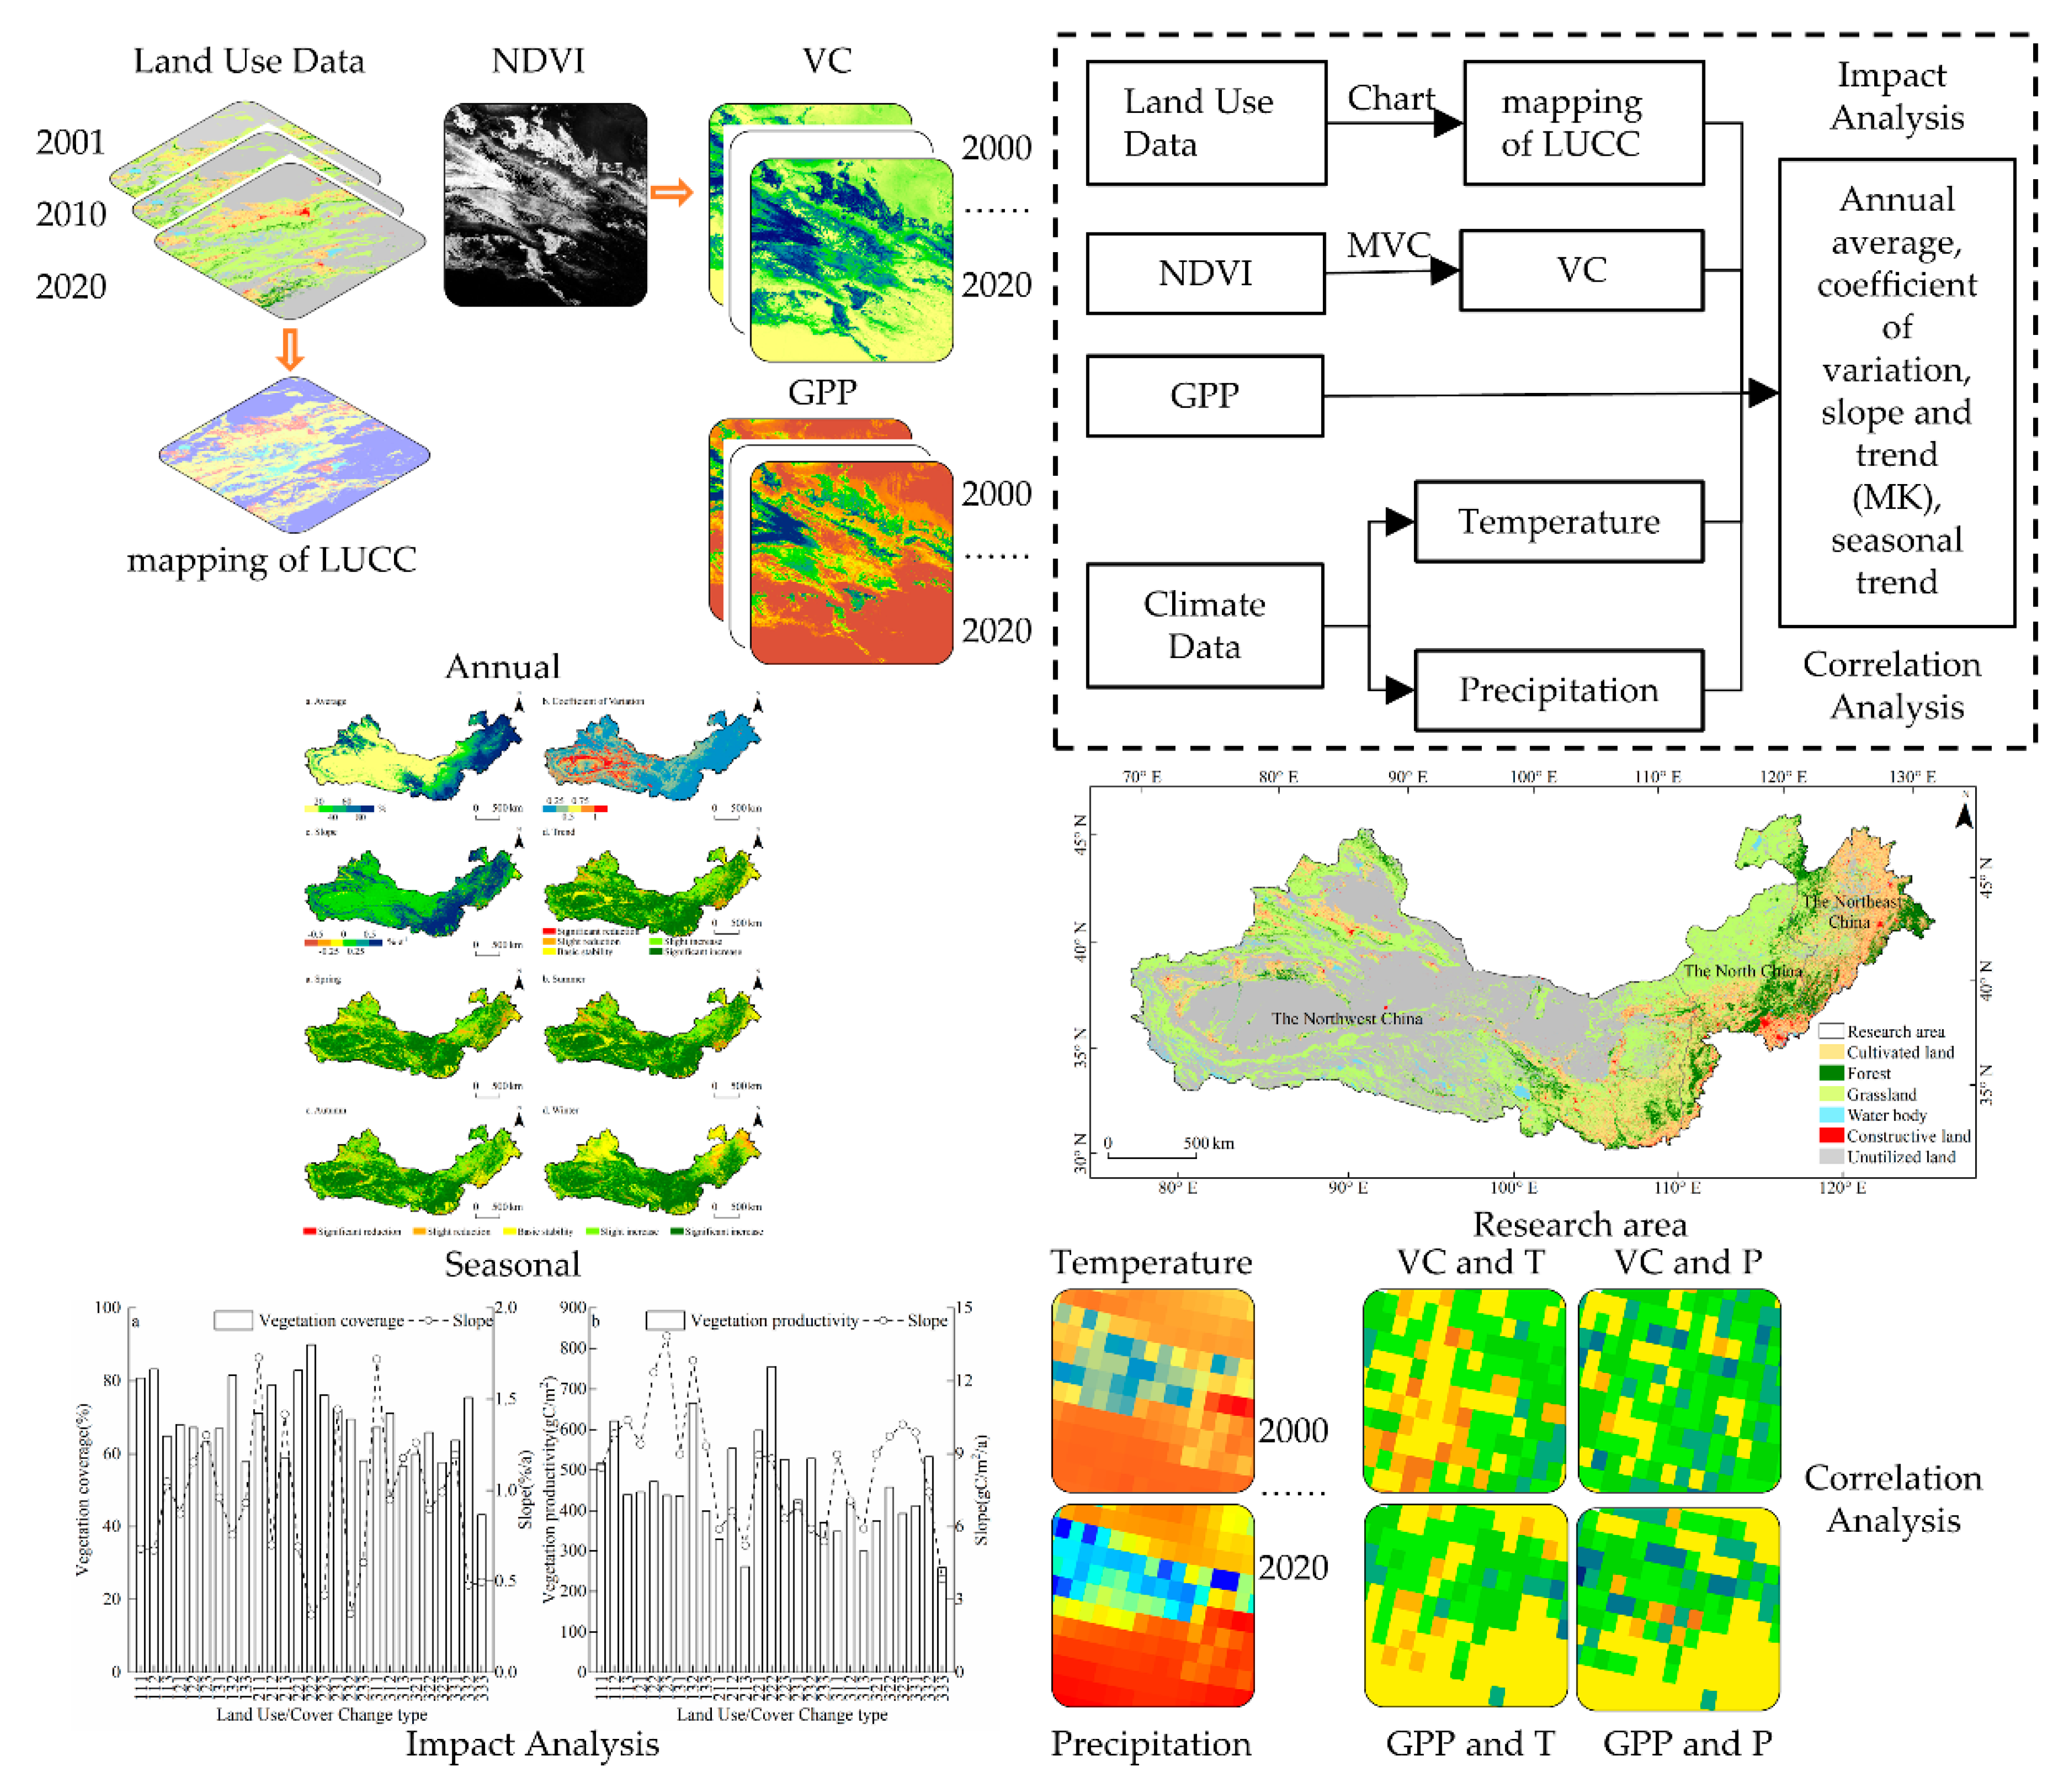
The global schema of data process is shown in Figure 2, and some key methods are provided in the following sections.

2.3.1. Land Use Change Mapping

In this paper, we adopted the map fusion proposed by Bao [55] and Wang [56] to obtain the pattern of land use change, which can be implemented by map algebraic operation on each pixel of land use images in different periods. The operation is as follows:
C = i = 1 n ( A i × 10 i 1 )
where C is the evolution mapping of land use patterns during the study period; the values of i are 1, 2 and 3, corresponding to different years (2020, 2010 and 2000), respectively. Ai is the pixel values of land use types in different periods. The types of LUCC are listed in Table 2.
(1)
No change. It denotes that the type of land remains unchanged from 2000 to 2020.
(2)
Previous change. It refers to the type of land transfer that occurred from 2000 to 2010.
(3)
Later change. It refers to the type of land transfer that occurred from 2010 to 2020.
(4)
Repeated change. It refers to the type of land that transferred only in 2010 and remained consistent in 2000 and 2020.
(5)
Continuous change. It denotes that the type of land was different in 2000, 2010 and 2020.

2.3.2. Vegetation Coverage Extraction

The vegetation coverage (VC) is the percentage of vegetation’s vertical projection on the ground over the area of the statistical zone [57]. Common methods for calculating the VC are mainly divided into ground survey and remote sensing monitoring. The former includes sampling method and calculation by instrument, whereas the latter includes regression model, vegetation index method and pixel decomposition model [58]. Limited by the influence of the scope of the study area and the accuracy of the model, this study chose remote sensing monitoring. Firstly, we used the maximum value composites method to obtain the maximum of interannual and seasonal NDVI [59,60,61]. Then, the pixel dichotomous model was applied to calculate the VC, considering all pixels as mixed ones including soil and vegetation [62].
V C = N D V I N D V I S N D V I V N D V I S × 100 %
where VC is the vegetation coverage of individual pixels and NDVIS and NDVIV represent the minimum (pure soil pixel) and maximum (pure vegetation pixel) of NDVI among all pixels in the study area, respectively. Neither of them is constant, due to the influence of some factors such as atmospheric environment, surface roughness, soil properties and vegetation type [63]. Therefore, we selected the NDVI corresponding to the cumulative frequency at 5% and 95% confidence intervals as NDVIS and NDVIV, respectively [64].

2.3.3. Linear Regression Analysis

The linear regression analysis method can calculate the slope of cells and reflect the spatial distribution characteristics of variable changes [11,65]. In this study, we used the least square method to calculate the parameters of the linear regression. The principle of the method is to find the best function by minimizing the sum of error squares.
S = n × i = 1 n ( i × X i ) i = 1 n i i = 1 n X i n × i = 1 n i 2 ( i = 1 n i ) 2
where S is the trend rate of change; n is the number of time points and Xi is the corresponding ecological indicator.

2.3.4. Sen’s Trend Degree, M–K Significance Test

The Sen’s trend degree has been widely applied on qualitative description of time series data. It mainly calculates by the median of the time series data, which can effectively reduce the influence of the abnormal value and extreme value.
β = m e d i a n ( X j X i j i ) , j > i
where β is a Sen’s trend degree. Xi and Xj are the sequences of the ecological indicators; i and y are the sequences of the time. When β is greater than 0, it means that the time series data has an overall increasing trend. When β is less than 0, it means that the time series data has a reducing trend. When β is equal to 0, it means that the time series data presents a basic stability state.
The Mann–Kendall test method is a nonparametric statistical test method and has been widely applied on time series data as well as raster data on a pixel scale [66,67]:
Z = { S 1 V A R ( S ) , S > 0 0 , S = 0 S + 1 V A R ( S ) , S < 0
S = i = 1 n 1 j = i + 1 n sgn ( X j X i )
sgn ( X j X i ) = { 1 , X j X i > 0 0 , X j X i = 0 1 , X j X i < 0
V A R ( S ) = n ( n 1 ) ( 2 n + 5 ) 18
where Xi and Xj are the sequences of the ecological indicators. i and y are the sequences of the time. We assumed that the confidence level α was set at 0.05; then, Z1-a/2 is the corresponding value (1.96) of the distribution table of the standard normal function at this confidence level. If |Z|˃Z1-a/2, it indicates that there is a significant trend of change, whereas if |Z|˂Z1-a/2, it indicates that there is a slight trend of change.
According to the combination of β and Z values, five categories of vegetation coverage and productivity trend theoretically exist. Table 3 provides the classification criteria and their corresponding trends.

2.3.5. Correlation Analysis

In order to explore the correlation between climate factors and vegetation factors, we used the Pearson correlation coefficient shown in the following formula.
r = i = 1 n [ ( a i a ¯ ) ( y i y ¯ ) ] i = 1 n ( a i a ¯ ) 2 i = 1 n ( y i y ¯ ) 2
where r is the correlation coefficient, ai, yi is the vegetation factor and climate factor of the i year, respectively. ā, ȳ is the average of the vegetation factor and climate factor.

3. Results

3.1. Change of Land Use and Land Cover in the TNSFPA from 2001 to 2020

There is an obvious change of land use and land cover area in the TNSFPA from 2001 to 2020 (as shown in Table 4). In 2020, the land use type having the largest area was barren, followed by grassland, accounting for 44.33% and 40.52%, respectively. The area of water body and constructive land was less, accounting for 1.18% and 0.72%, respectively. From 2001 to 2020, the area of all land use types increases, except for the barren. Among them, the water body witnessed the largest area change rate, which reflected the increasing trend of warming and humidification in Northwest China.
Compared with MCD12Q1 IGBP legacy classification schemes in the TNSFPA during 2001–2020, we found that evergreen broadleaf forest, closed shrublands, woody savannas, grasslands and barren showed an obvious decreasing trend (as shown in Figure 3). In addition, the other types showed an increasing trend. Grassland and barren decreased at the rate of 1663.49 km2/a and 4542.32 km2/a, respectively. Savannas and croplands increased at the rate of 1699.17 km2/a and 3098.16 km2/a, respectively.
In order to further analyze the change patterns of different land use types in the TNSFPA, change pattern mapping was established by integrating the land use data of 2001, 2010 and 2020 (as shown in Figure 4). Among them, 90.05% of the land use area remained unchanged from 2001 to 2020. The land use change pattern was dominated by later change (58.06%) and previous change (28.94%). It implies that the transfer of land use type from 2010 to 2020 was stronger than that from 2001 to 2010, which is closely related to the national strategy for high–quality development and ecological civilization construction as well as the impact of climate change. In addition, the previous change type mainly showed the mutual transformation between cultivated land and grassland. The later change type mainly showed the mutual transformation between grassland and barren. The repeated change type mainly presented the “grassland–cultivated land–grassland” model. The difference of the continuous change type (2.38%) is less than the other types.
LUCC patterns of cultivated land, forest and grassland show that cultivated land and forest were mainly transformed into grassland, with an area of 9699.75 km2 and 43,705 km2 (60.92%), respectively. Grassland was mainly transformed into cultivated land (102,090.25 km2) and barren (25,710.25 km2). It reflected the implementation of the policy of “returning cultivated land to forest land and grassland” and the current situation of grassland reclamation and degradation.

3.2. Change of Vegetation Coverage in the TNSFPA from 2000 to 2020

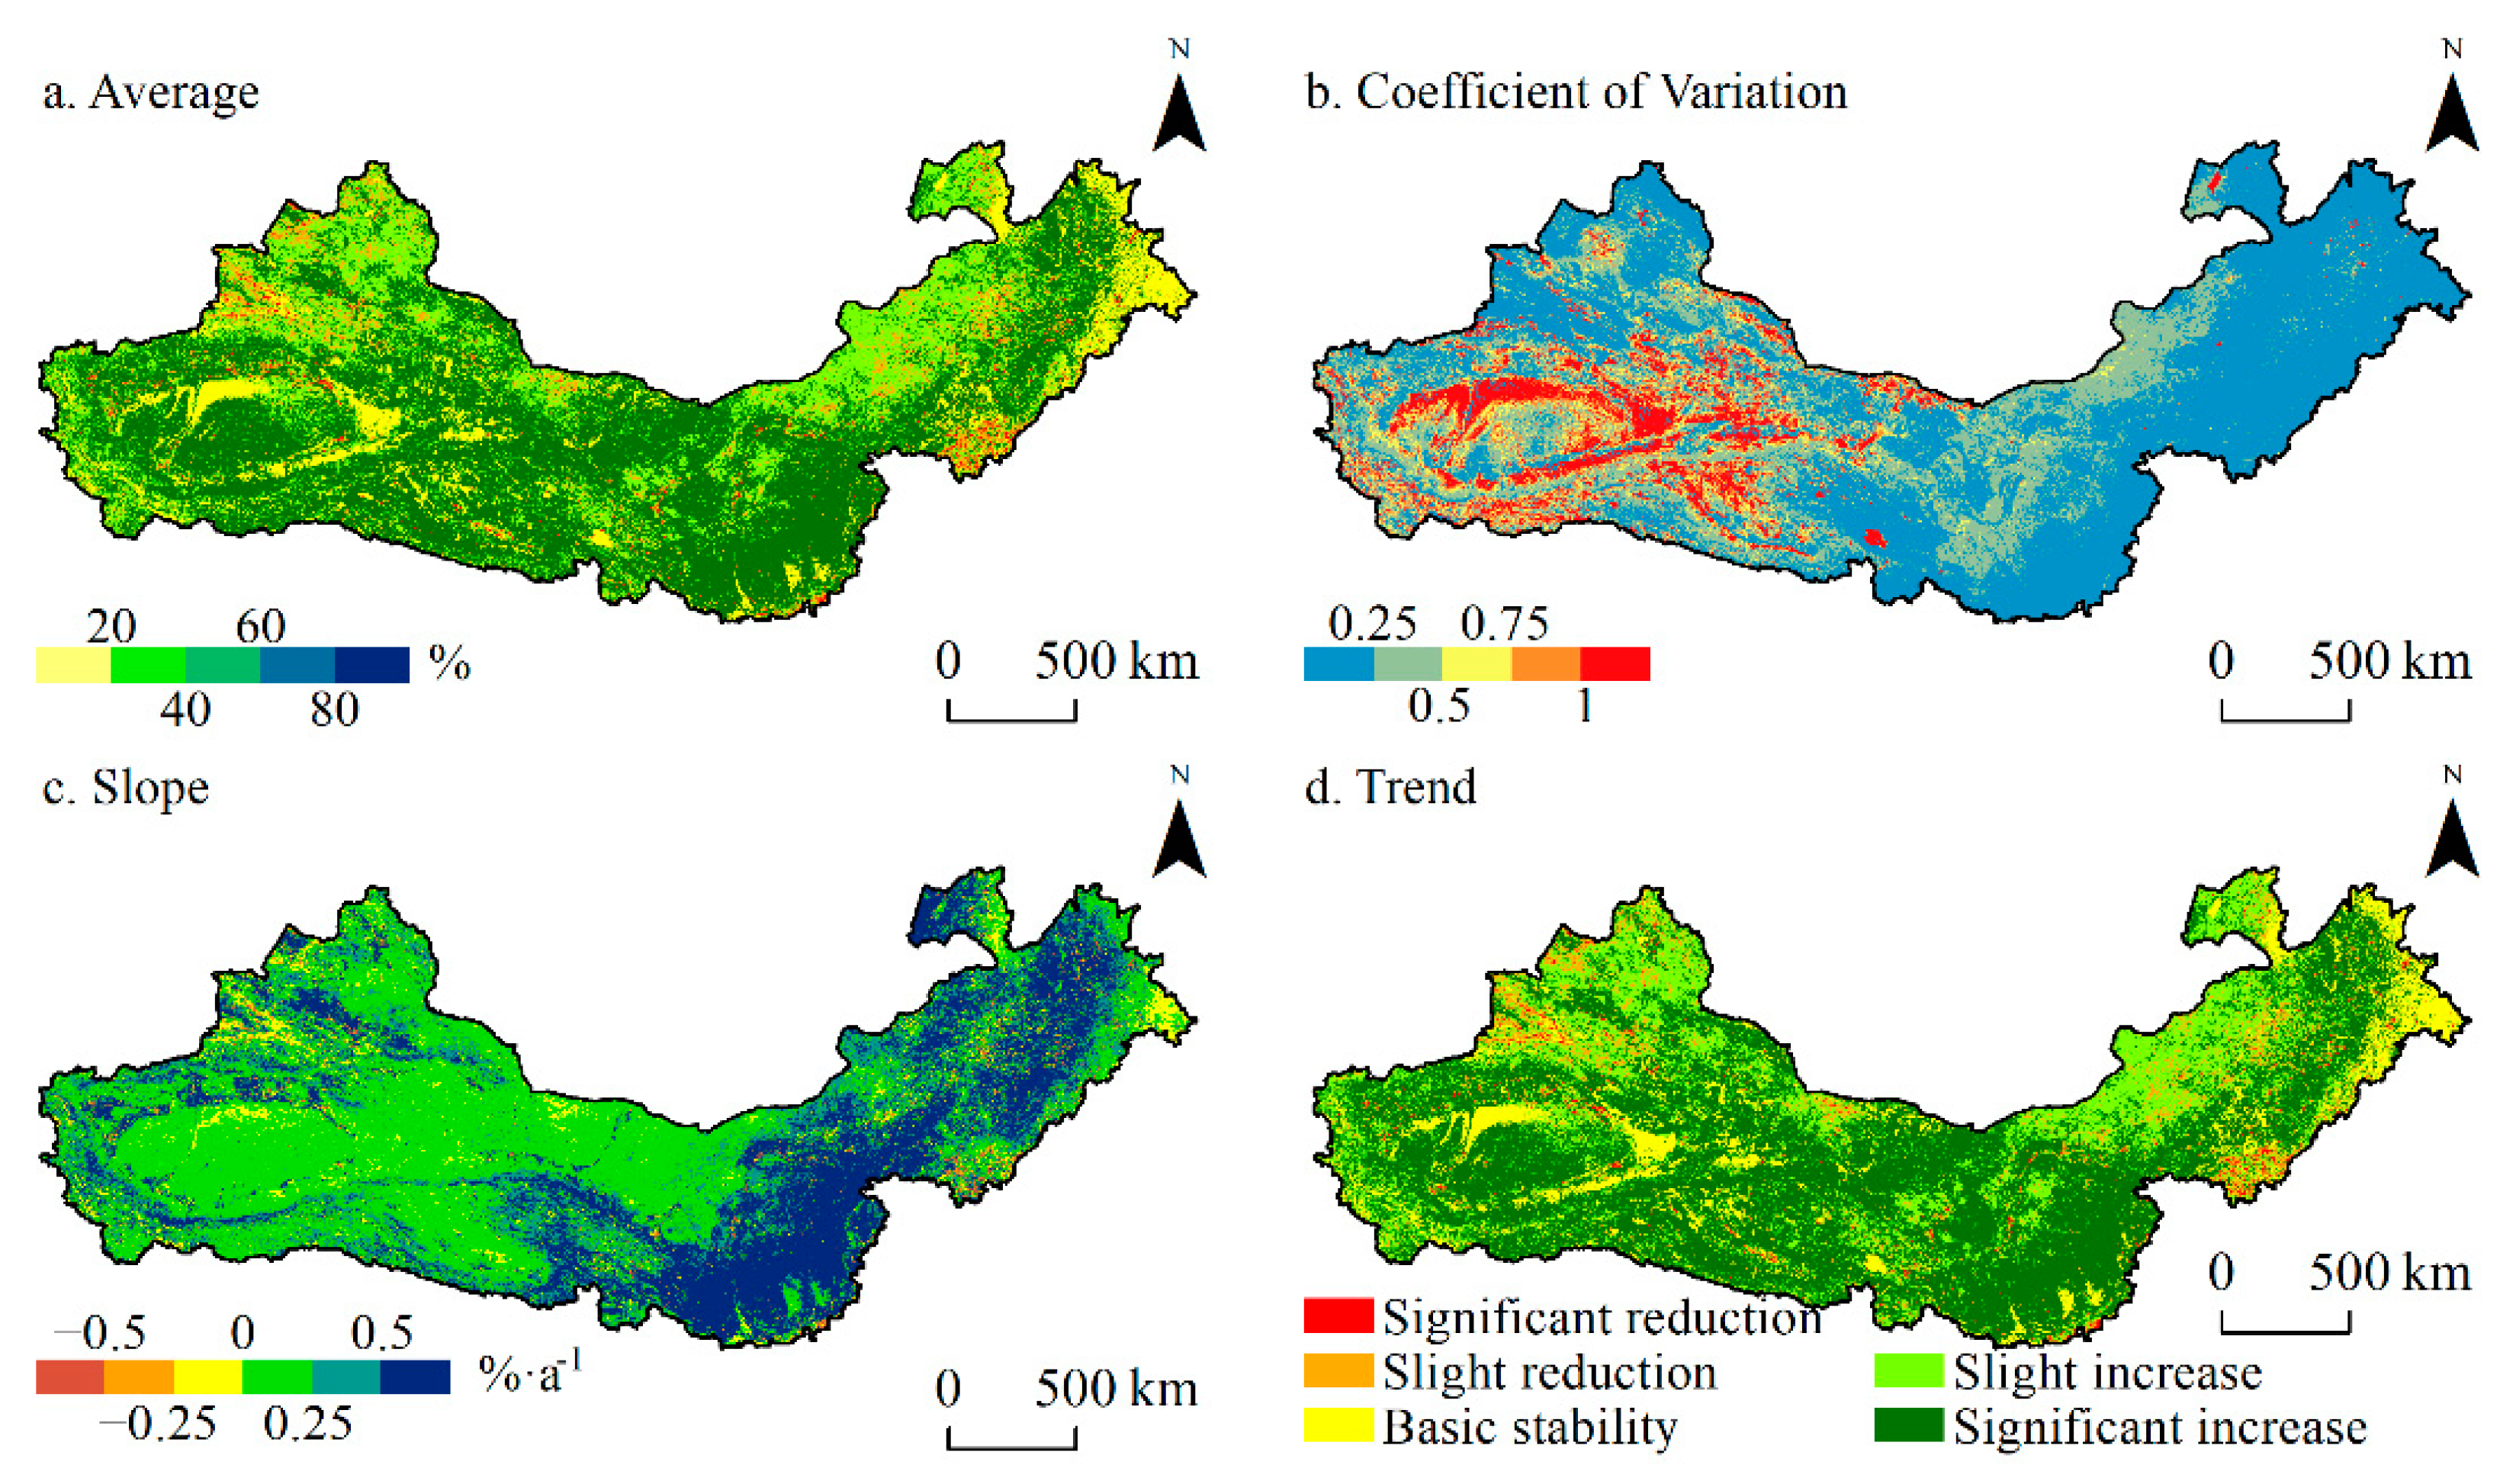
The vegetation coverage showed spatial differences of high in the east and low in the west (Figure 5). Except for the northern Tianshan Mountain, the Altai Mountain and the southern Qilian Mountain, the vegetation coverage in other regions of Northwest China was at a low level. The vegetation coverage in North China showed a decreasing trend from southeast to northwest, which is closely related to the distribution of precipitation. Vegetation coverage was at a high level in Northeast China. The interannual fluctuation of vegetation coverage was basically opposite to the distribution of the average value. Regions with high vegetation coverage had low interannual fluctuation. The region with larger interannual fluctuation was mainly concentrated in the middle and west of the Tarim Basin and Hexi Corridor, which was mainly related to the interannual precipitation changes. The area with an increasing vegetation coverage occupied 90.31% of the TNSFPA from 2000 to 2020. The region with slope between 0 and 0.25%·a−1 had the largest distribution (43.99%), which was concentrated in Northwest China. The regions with slope greater than 0.5%·a−1 were concentrated in North China and Northeast China. Based on the Mann–Kendall test for the linear trend of vegetation coverage, the results showed that 56.09% of the region showed a significant increase from 2000 to 2020. The proportion of slight increase was 28.15%, which was concentrated in the southern foothills of the Altay Mountains and the Xilingole grassland. The area with a stable state occupied 9.46% of the TNSFPA, which was concentrated in the northwest and east end of the Tarim Basin and the east of the Changbai Mountains.
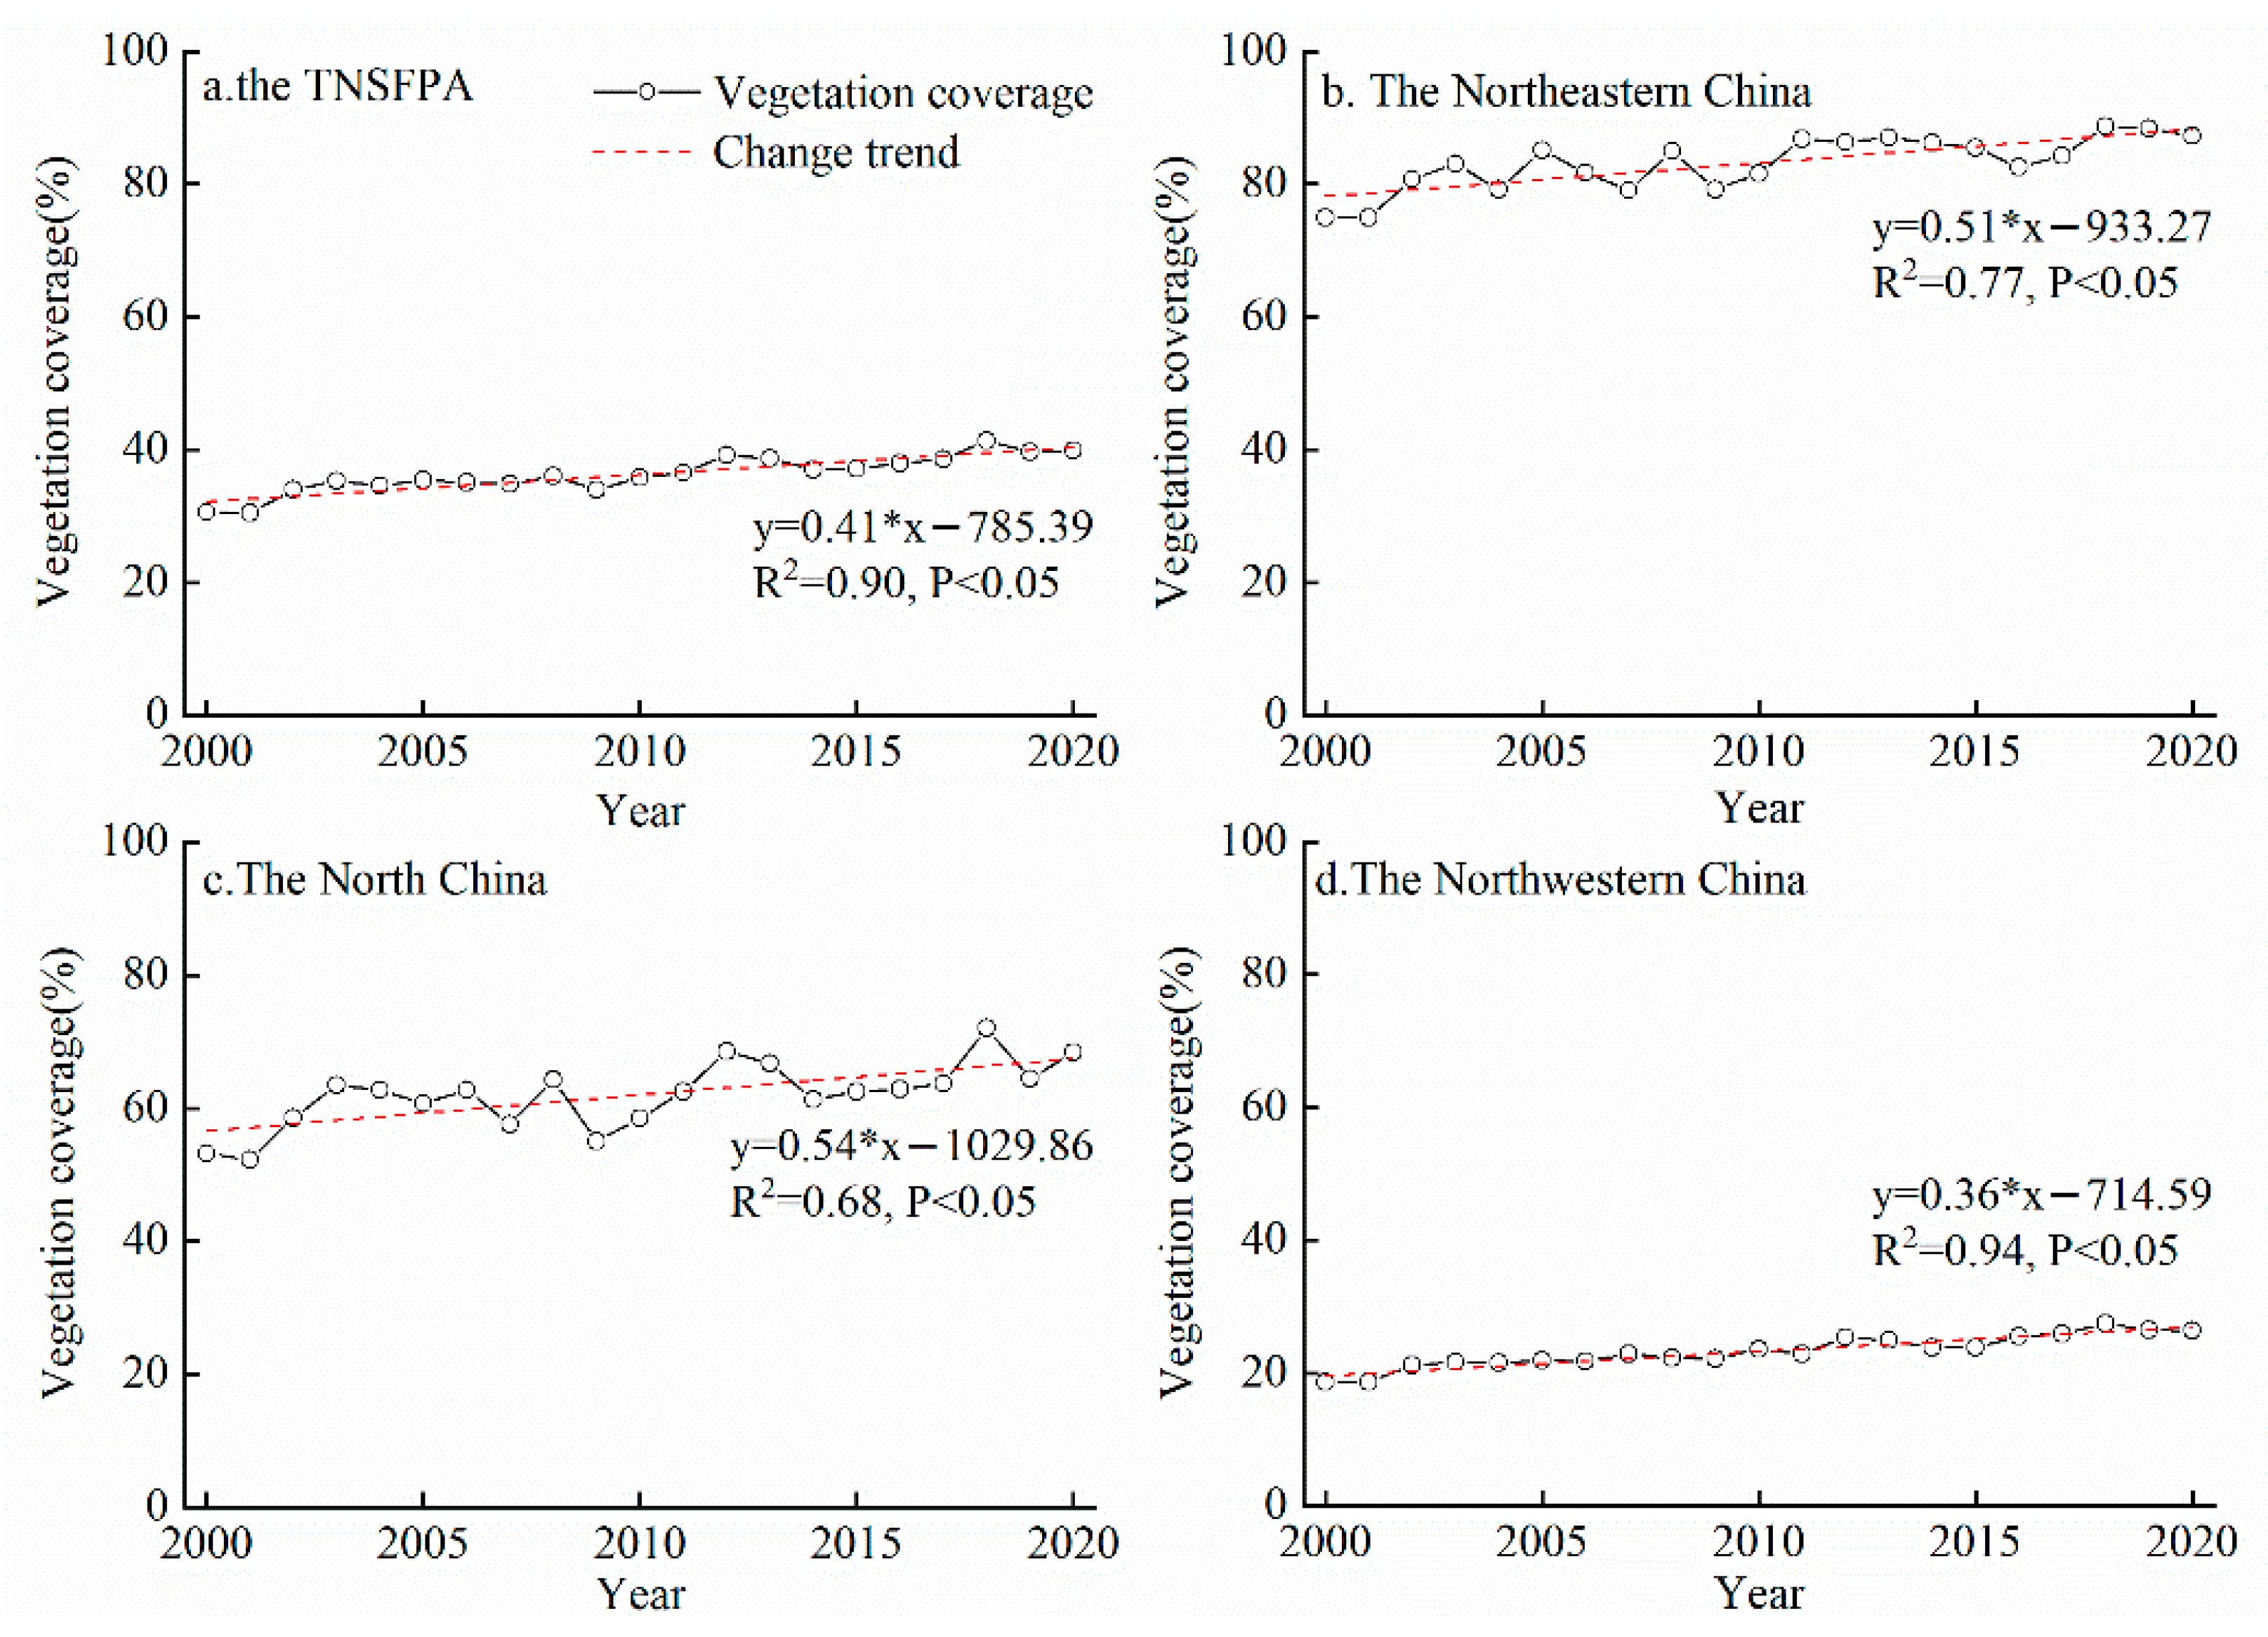
Statistical analysis of vegetation coverage in the TNSFPA (Figure 6) showed that the change of vegetation coverage from 2000 to 2020 ranged from 30.47% to 41.40%, with an overall increasing trend at the rate of 0.41%·a−1. Although all three subregions of TNSFPA experienced increasing vegetation coverage, the distribution and trend varied greatly. The vegetation coverage in Northwest China ranged from 74.99% to 88.79%, with an overall increasing trend at the rate of 0.51%·a−1. The range of vegetation coverage is from 52.27% to 71.96% and from 18.59% to 27.41%, with a rate of 0.54%·a−1 and 0.37%·a−1 in North China and Northwest China, respectively.
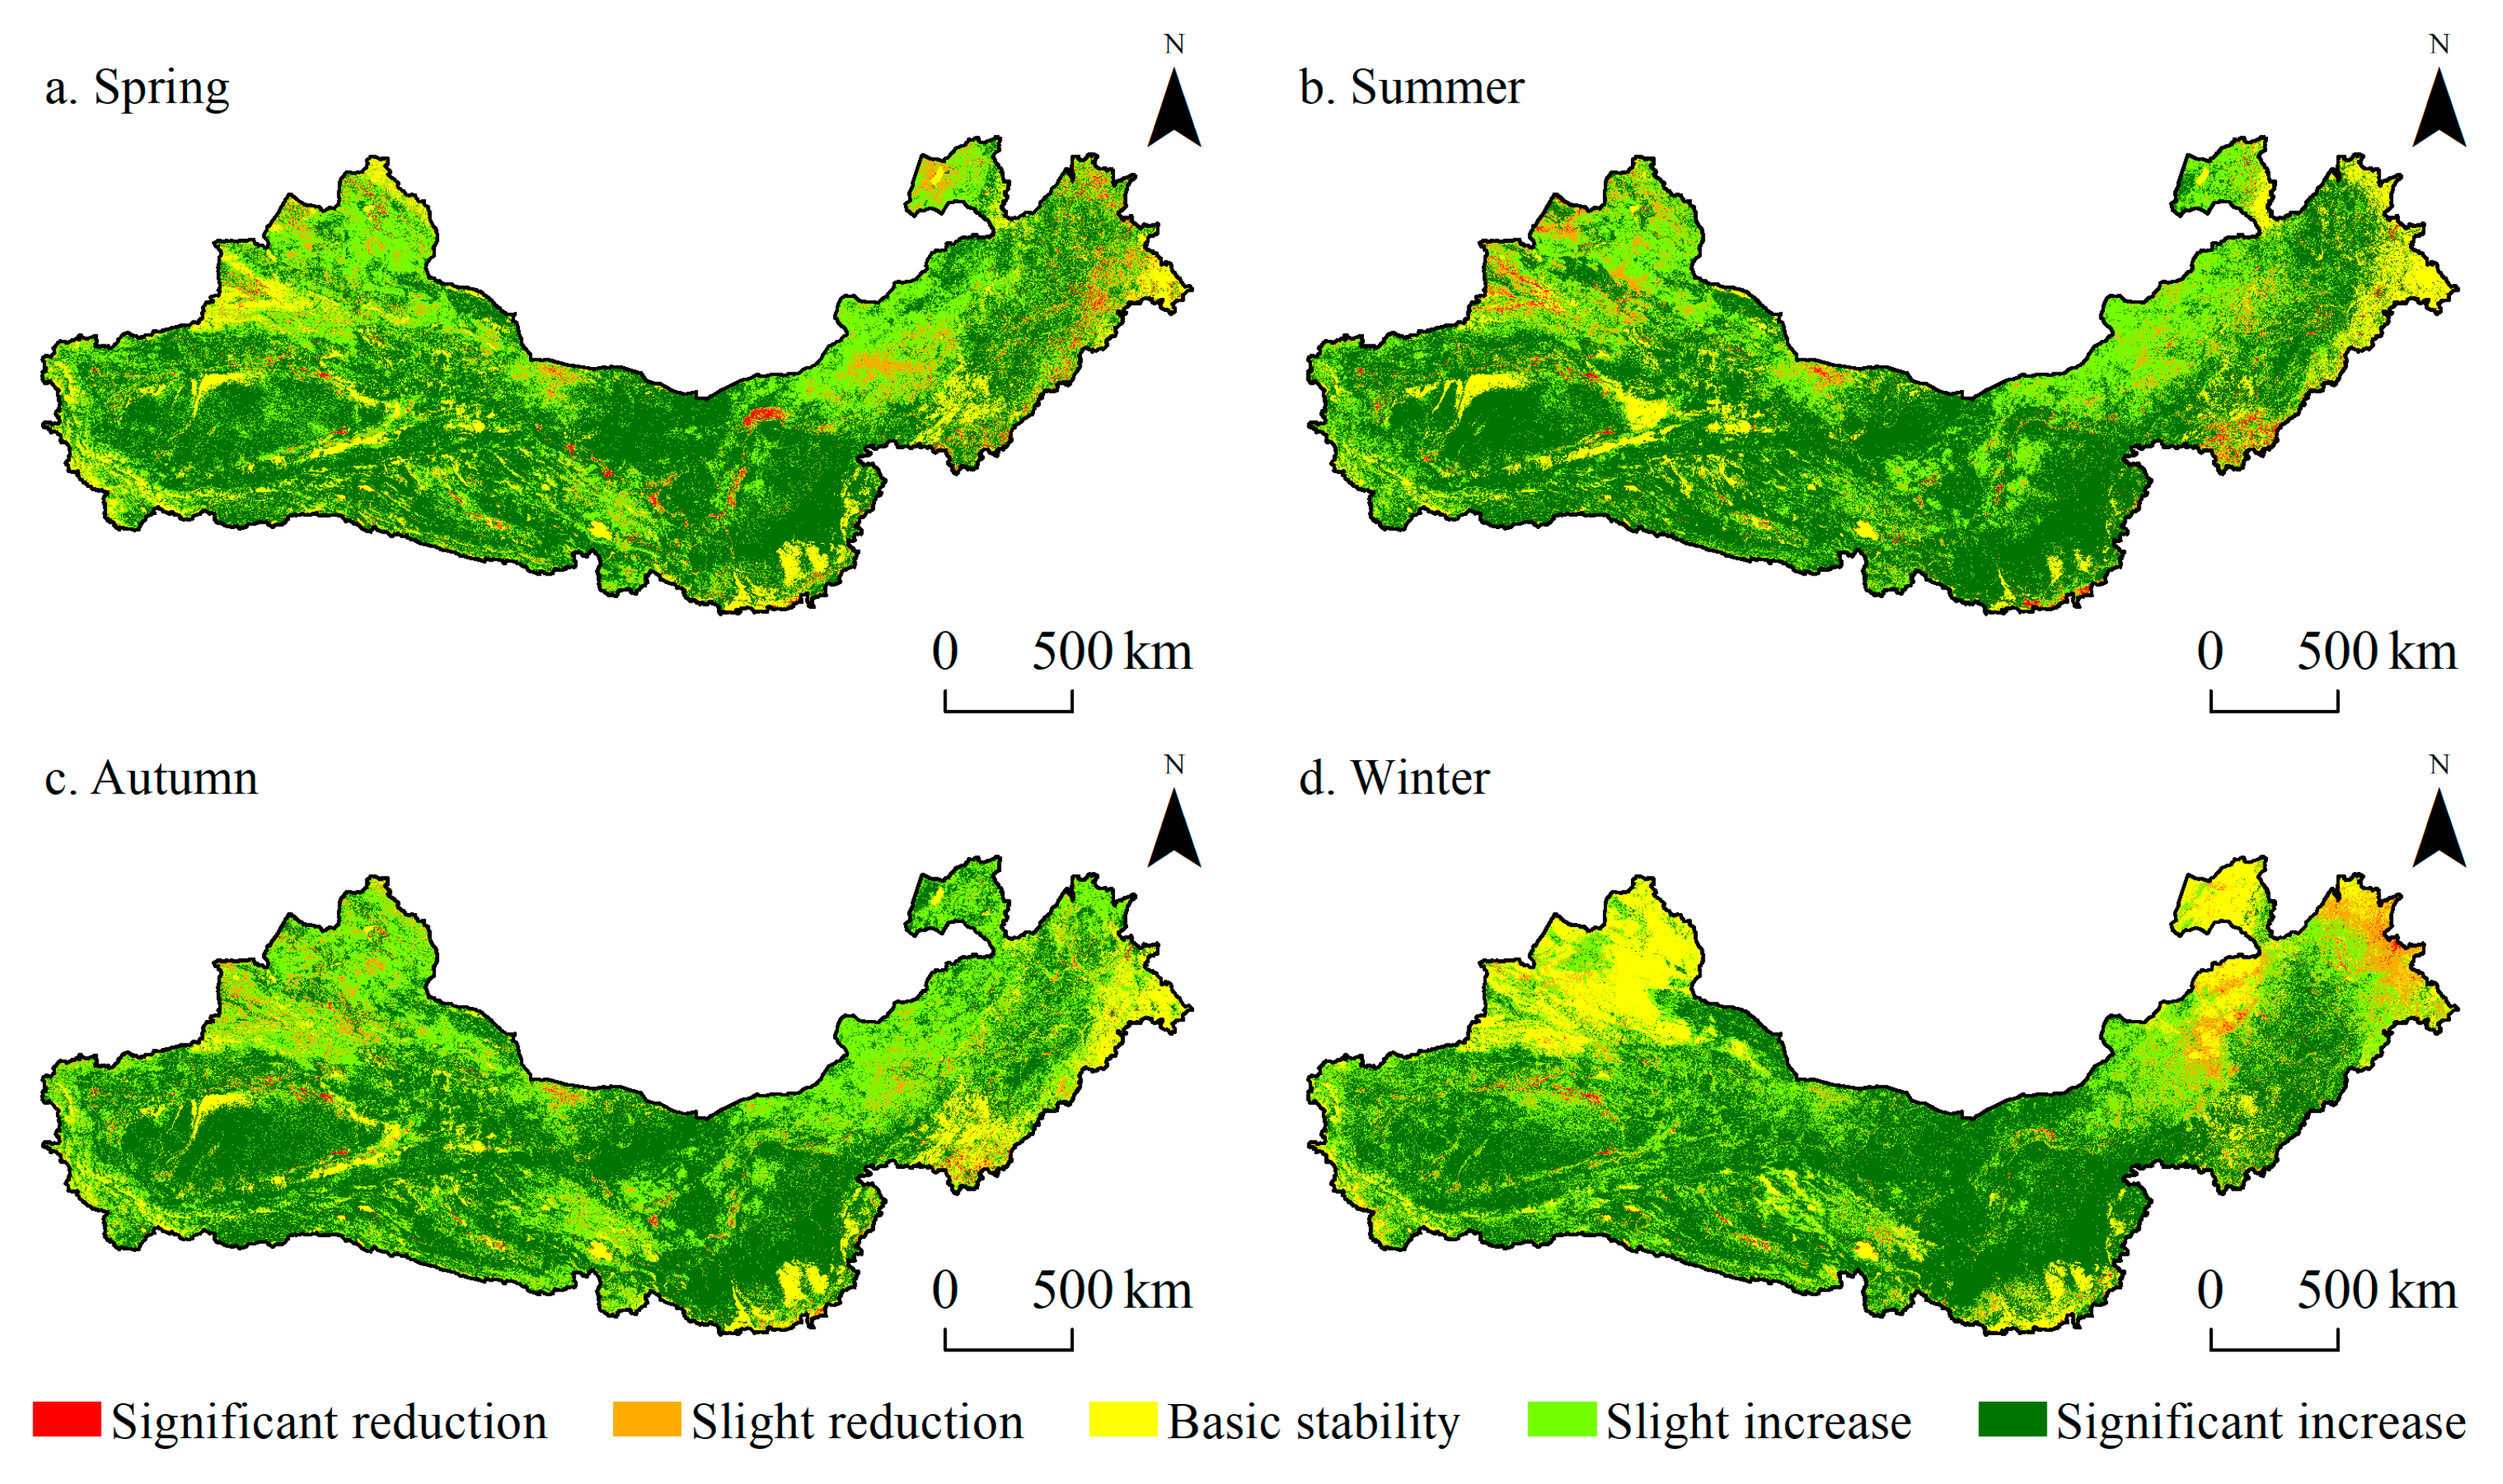
The trend of vegetation coverage in different seasons of the TNSFPA were all dominated by significant increase during the study period, but with large seasonal differences (Figure 7). The proportion of significant increase in each season was greater than 50%, with the highest in summer (55.90%). The proportion of slight increase in each season was from 20% to 40%, with the highest in autumn (33.72%). The proportion of basic stability was highest in winter (15.18%), whereas it was less than 10% in other seasons. The proportion of both significant decrease and slight decrease was highest in spring (1.22% and 7.14%). In terms of the spatial distribution of vegetation coverage trends in seasons, the regions with decreasing vegetation coverage trends in spring were concentrated in the Loop Plain, the southern part of the Xilingol Steppe and the eastern part of the Greater Khingan Mountains. The regions with decreasing vegetation coverage trends in summer were concentrated in the Yili River valley, the Badain Jaran desert and the Liaohe river basin. The regions with decreasing vegetation coverage trends in autumn were concentrated in the edge of the Tarim Basin and the eastern part of the Hexi corridor. The regions with decreasing vegetation coverage trends in winter were concentrated in the edge of the Tarim Basin, the northeastern part of the Xilingol Steppe and the eastern part of the Greater Khingan Mountains.

3.3. Change of Vegetation Productivity in the TNSFPA from 2000 to 2020

The spatial distribution of vegetation productivity was basically consistent with vegetation coverage, and the overall spatial differences were higher in the east and lower in the west (Figure 8). Among them, the percentage of vegetation productivity less than 200 gC·m−2 is 58.11%. Different from vegetation coverage, the annual fluctuation of vegetation productivity was basically consistent with the distribution of the average value. The region with low productivity had small interannual fluctuation, and the regions with large interannual fluctuation were mainly distributed in the northern part of Tianshan Mountain, the eastern part of Helan Mountain and the western part of Greater Khingan Mountain, and the central part of Northeast China. The area with an increasing vegetation productivity occupied 51.66% of the TNSFPA from 2000 to 2020. The proportion of slope between −10 and 0 gC·m−2·a−1 was 43.99%, which was basically consistent with the distribution in the low vegetation productivity area. The Mann–Kendall test shows that the changes of vegetation productivity from 2000 to 2020 were mainly in the basic stable state (44.28%) and the significant increase state (42.38%).
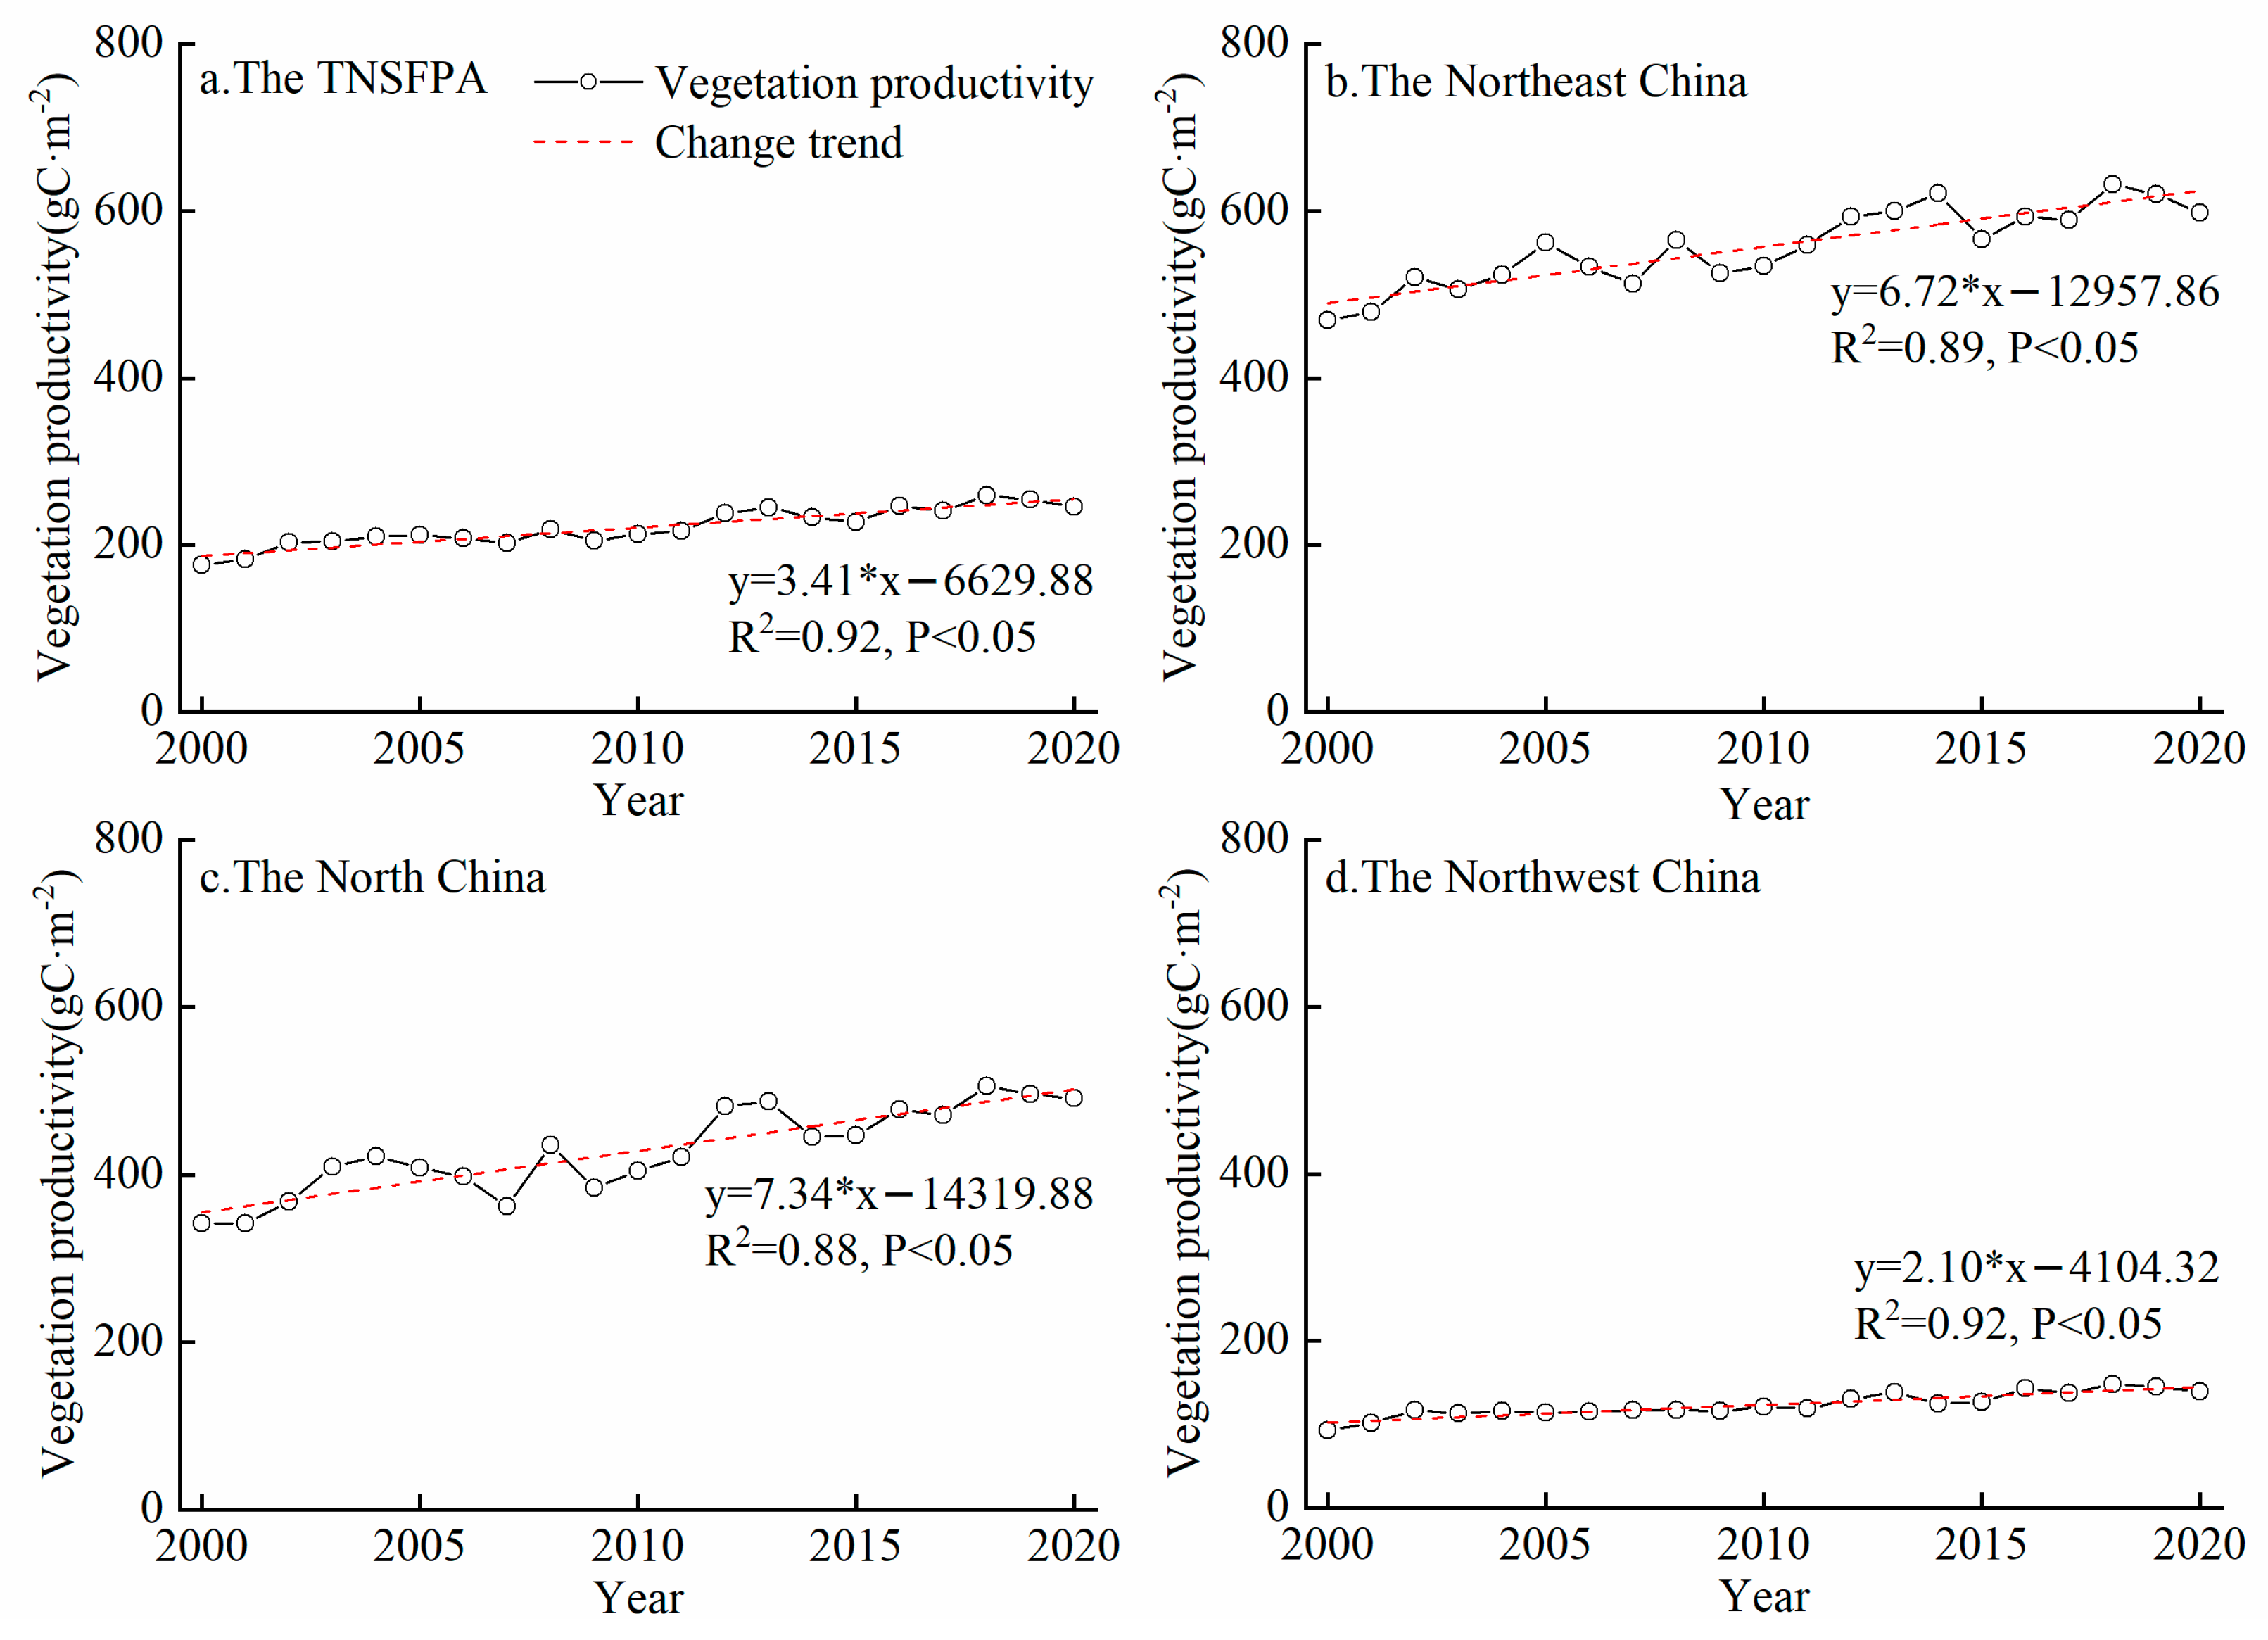
Statistical analysis of vegetation productivity in the TNSFPA (Figure 9) showed that the change of vegetation productivity from 2000 to 2020 ranged from 175.62 to 258.86 gC·m−2, with an overall increasing trend at the rate of 3.41 gC·m−2·a−1. Although vegetation productivity of all three subregions in the TNSFPA showed an increasing trend, the differences in distribution and trend varied greatly. The vegetation productivity in Northwest China ranged from 469.62 to 631.92 gC·m−2·a−1, with an overall increasing trend at the rate of 7.34 gC·m−2·a−1. The range of vegetation productivity is from 341.75 to 505.92 gC·m−2 and from 93.13 to 147.57 gC·m−2, with a rate of 6.72 gC·m−2·a−1 and 2.10 gC·m−2·a−1 in North China and Northwest China, respectively.
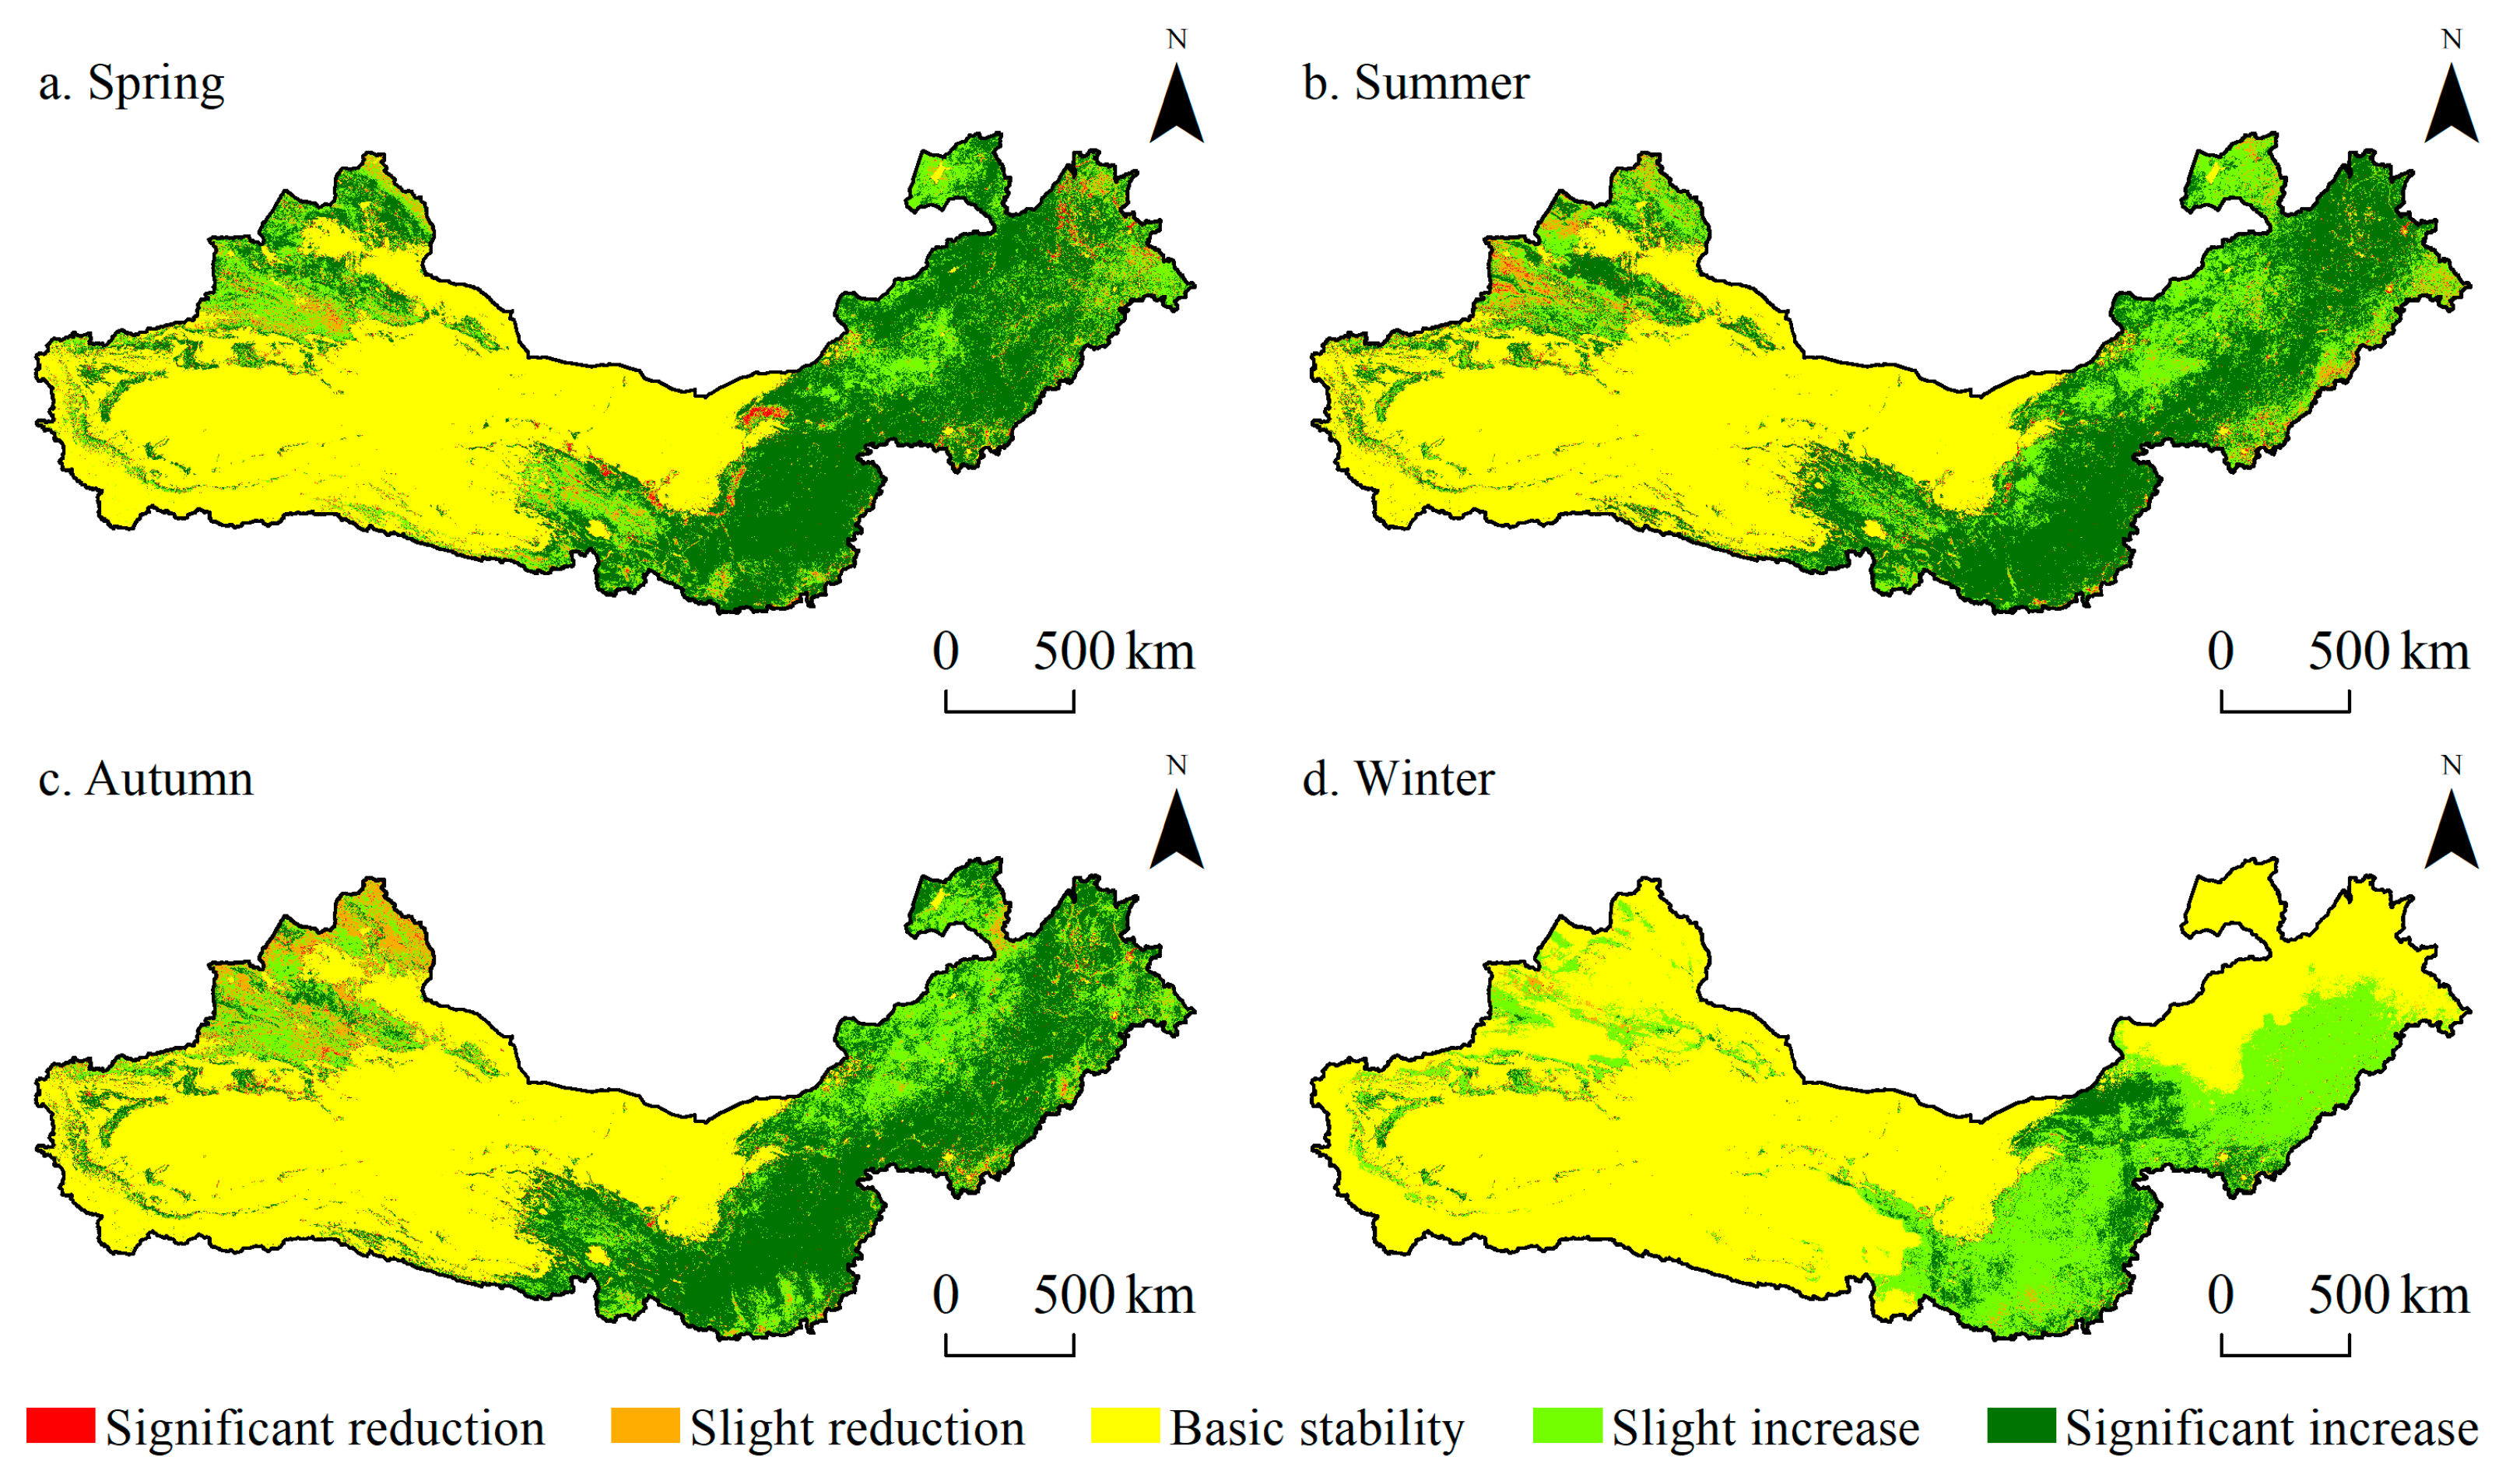
The trend of vegetation productivity in different seasons of the TNSFPA were all dominated by basic stability from 2000 to 2020, but with large seasonal differences (Figure 10). Among them, the proportion of basic stability in each season was more than 40%, with the highest in winter (68.07%). Followed by significant increasing, except for the proportion in winter (11.67%), the proportion in other seasons was from 30% to 40%. The proportion of slight increasing in winter (18.93%) was the highest, whereas in other seasons it was less than 15%. The proportion of both significant decrease and slight decrease was highest in spring (1.95%) and autumn (5.10%), respectively. In terms of the spatial distribution of vegetation productivity trends in seasons, the regions with decreasing trends in spring were concentrated in the northern part of the Qilian Mountains, the Hetao Plain and the eastern part of the Greater Khingan Mountains. The regions with decreasing vegetation productivity trends in summer were concentrated in the Ili River Valley and the Liao River Basin. The region with decreasing vegetation productivity trends in autumn was concentrated in the northern part of the Tianshan Mountains. The regions with decreasing vegetation productivity trends in winter were concentrated in the northern part of the Tianshan Mountains and the edge of Tarim Basin.

4. Discussions

4.1. Climate Drivers of Vegetation Change

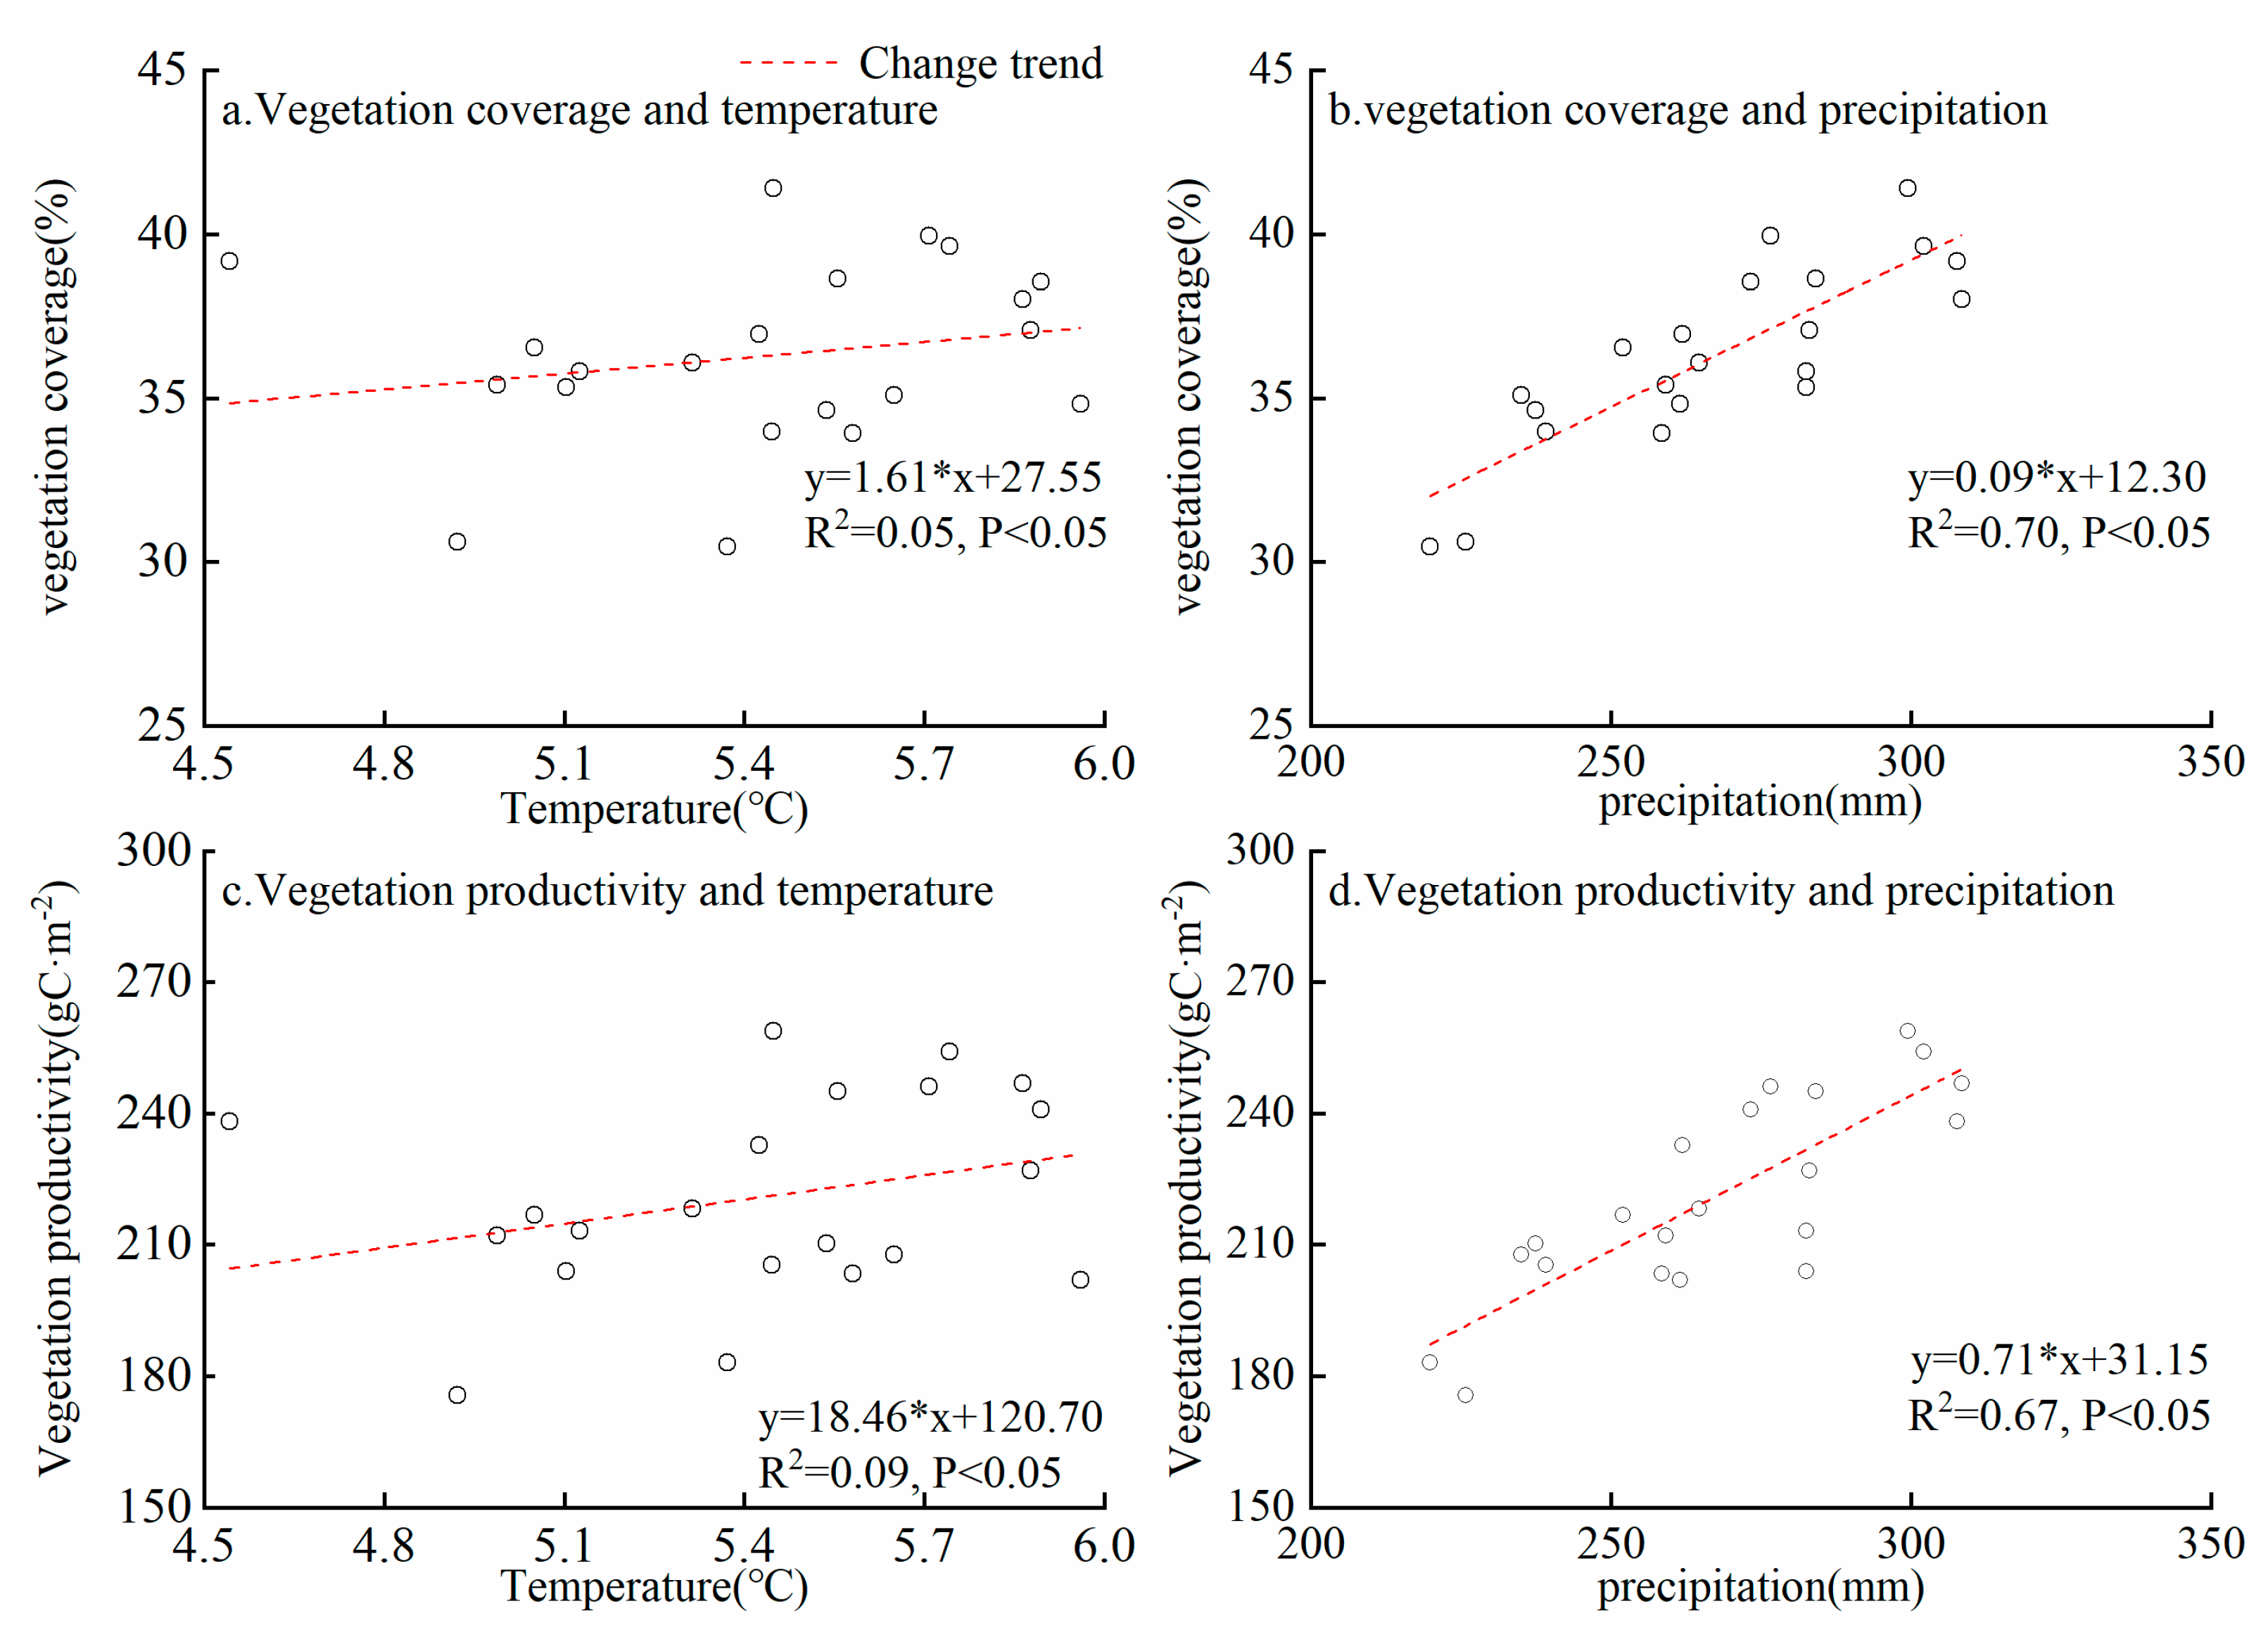
The annual average temperature and precipitation in the TNSFPA from 2000 to 2020 were 5.43 °C and 267.37 mm and showed a warm and humid trend, with annual slopes of 0.02 °C·a−1 and 3.03 mm·a−1. The increase of temperature and precipitation is conducive to the growth of vegetation. The former extends the growth period of vegetation to a certain extent and improves the vegetation coverage; meanwhile, the latter provides sufficient water for the growth of vegetation and is conducive to the improvement of the production function of vegetation [68,69,70]. By comparing the correlations of vegetation coverage and vegetation productivity with temperature and precipitation in the TNSFPA (Figure 11), the correlation between vegetation growth factors and climate factors all showed a positive correlation, and the correlation between vegetation growth factors and precipitation was significantly higher than temperature, which was consistent with the results of previous studies [8,45].
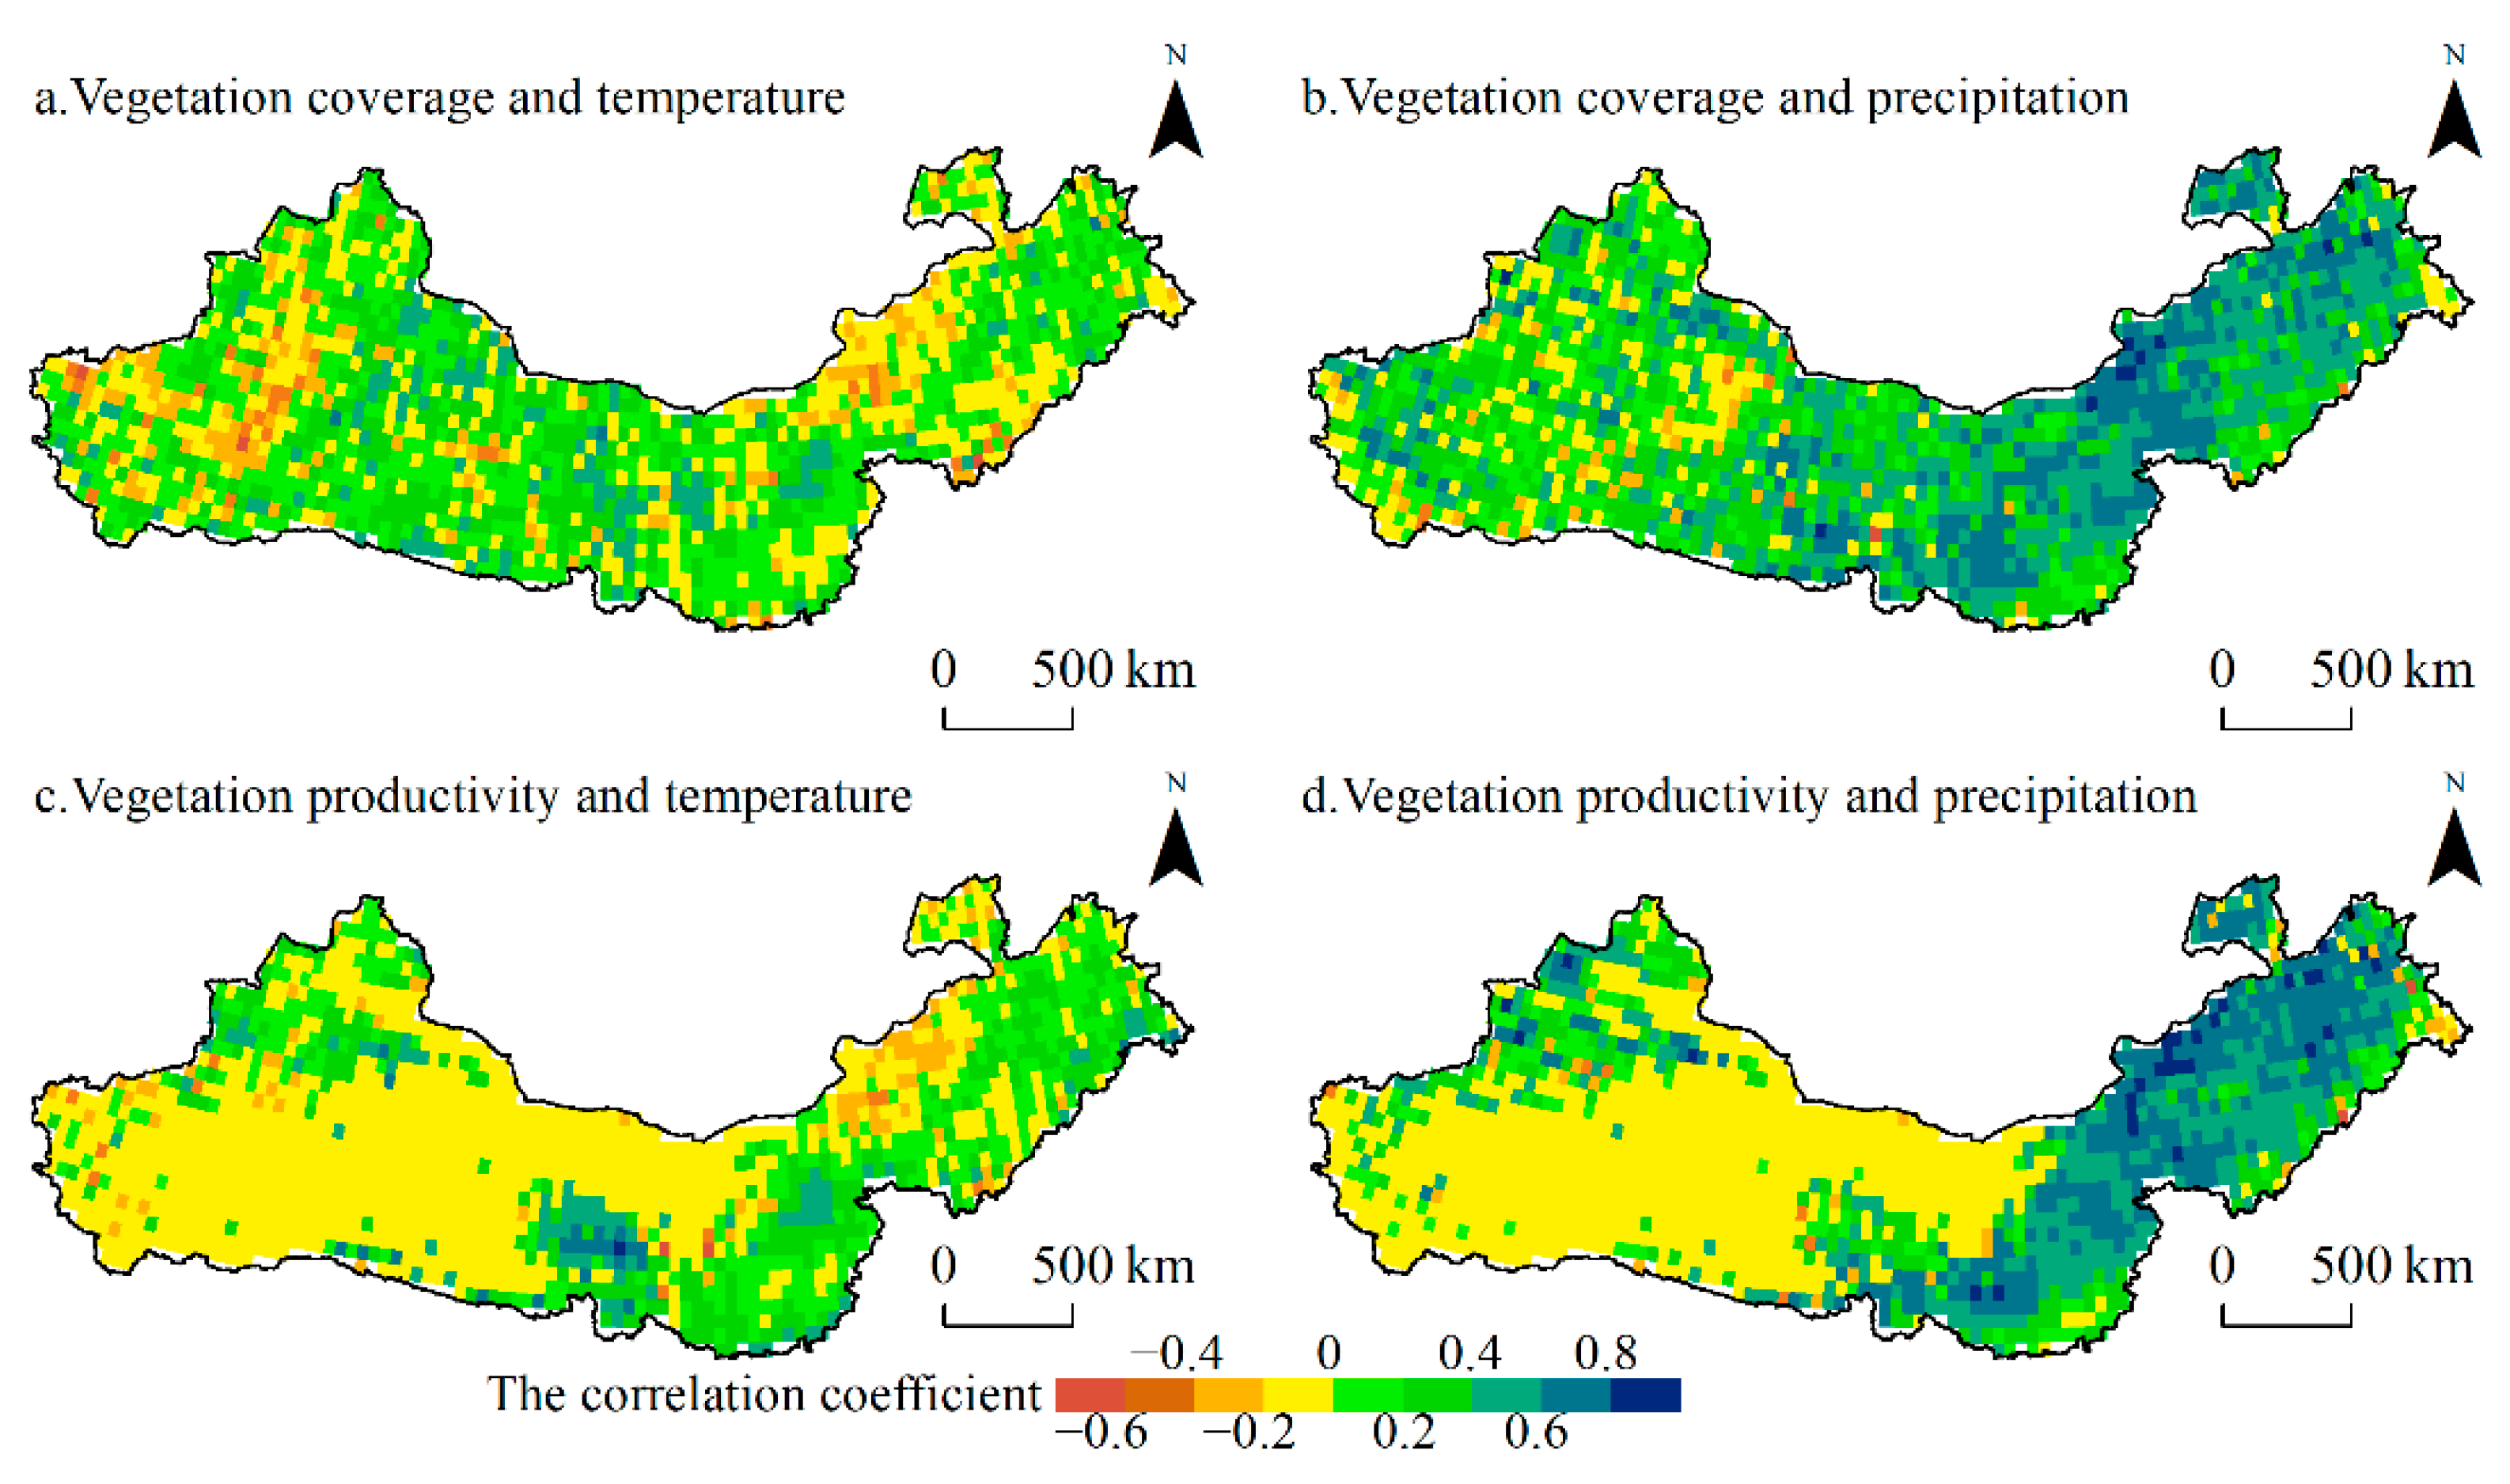
To further explore the response regularity of regional vegetation growth indicators to climate factors, the data of vegetation growth indicators was resampled, and the spatial resolution was consistent with that of climate factors. There were obvious spatial differences in the correlation between vegetation growth factors and climate factors (Figure 12). The regions with a positive correlation between vegetation coverage and temperature were mainly distributed in the central and western regions, accounting for 64.06% of the study area. While the regions with positive correlation between vegetation coverage and precipitation were mainly distributed in the eastern regions, accounting for 86.58% of the study area. The regions with positive correlation between vegetation productivity and temperature was mainly distributed in the central region, accounting for 40.70% of the study area, whereas the regions with a positive correlation between vegetation productivity and precipitation were mainly distributed in the central and eastern regions, accounting for 53.51% of the study area. From the perspective of the distribution of correlation coefficient, the correlation of factors was mainly low. The proportion of low correlation between vegetation factor and temperature was greater than 80%. The proportion of medium and high correlation between vegetation factor and precipitation was greater than temperature, which indicated that precipitation is the main climatic factor that restricts vegetation growth in the TNSFPA.

4.2. Effects of LUCC on Vegetation Coverage and Productivity

The influencing mechanism of LUCC on vegetation growth is complex. The vegetation coverage and productivity of cultivated land and forest are greater than grassland [71]. Therefore, on the basis of exploring the mechanism of climate change on vegetation growth, it is necessary to explore the impact of LUCC on vegetation growth. Taking the mutual transformation of cultivated land, forest and grassland as an example, the average and slope of vegetation coverage and productivity in the TNSFPA from 2000 to 2020 were 36.29%, 220.97 gC·m−2, 0.41%·a−1 and 3.41 gC·m−2·a−1, respectively (Figure 13). The slope of vegetation coverage was lower than in the TNSFPA, whereas the slope of vegetation productivity was greater than in the TNSFPA, except that the type is forest and previous change (coded 211). Among them, the vegetation coverage of unchanged cultivated land (coded 111), forest and grassland (coded 333) were 89.64%, 99.27% and 54.53%, and the vegetation productivity were 611.11 gC·m−2, 1015.85 gC·m−2 and 336.51 gC·m−2, respectively. When the cultivated land was changed into forest (coded 112 and 122), the vegetation coverage and productivity were greater than the unchanged cultivated land. When the cultivated land was changed into grassland (coded 113 and 133), the vegetation coverage and productivity were lower than the unchanged cultivated land. The vegetation coverage and productivity of the unchanged forest were greater than the changed forest (coded 211, 213, 223, 231 and 233), whereas the vegetation coverage and productivity of the unchanged grassland were lower than the changed grassland (coded 311, 312, 321, 322, 331 and 332). It is worth noting that many studies on vegetation coverage and productivity focused on single land use type or did not consider the impact of LUCC on it. However, our study area is usually a relatively complex ecosystem containing multi land use types. Therefore, the impact and contribution of LUCC on vegetation coverage and productivity are worthy of further study.

4.3. Comparison of Current Research

Vegetation change is a long–term dynamic process, and many studies are of great importance for the monitoring of regional ecosystems and the formulation of policy [72]. In this study, we quantified the vegetation ecological quality and its changes in the TNSFPA from the aspects of the macroscopic distribution structure and production function of vegetation using vegetation coverage and productivity. As an important indicator of the regional ecological changes, vegetation coverage is of great significance to reveal the environmental change of ecosystem and vegetation restoration [73]. Gross primary productivity is the amount of organic carbon fixed by photosynthesis of terrestrial green vegetation per unit area and time and is the starting point and an important component of atmospheric CO2 into the terrestrial ecosystem [74,75]. At present, studies based on regional ecological assessment are usually based on principal component analysis, weight method and model to fuse multiple indicators into one ecological quality index, such as RESI [76], but the integrated indicators make it difficult to distinguish the change of detailed information, such as the distribution structure and production function of vegetation [70].
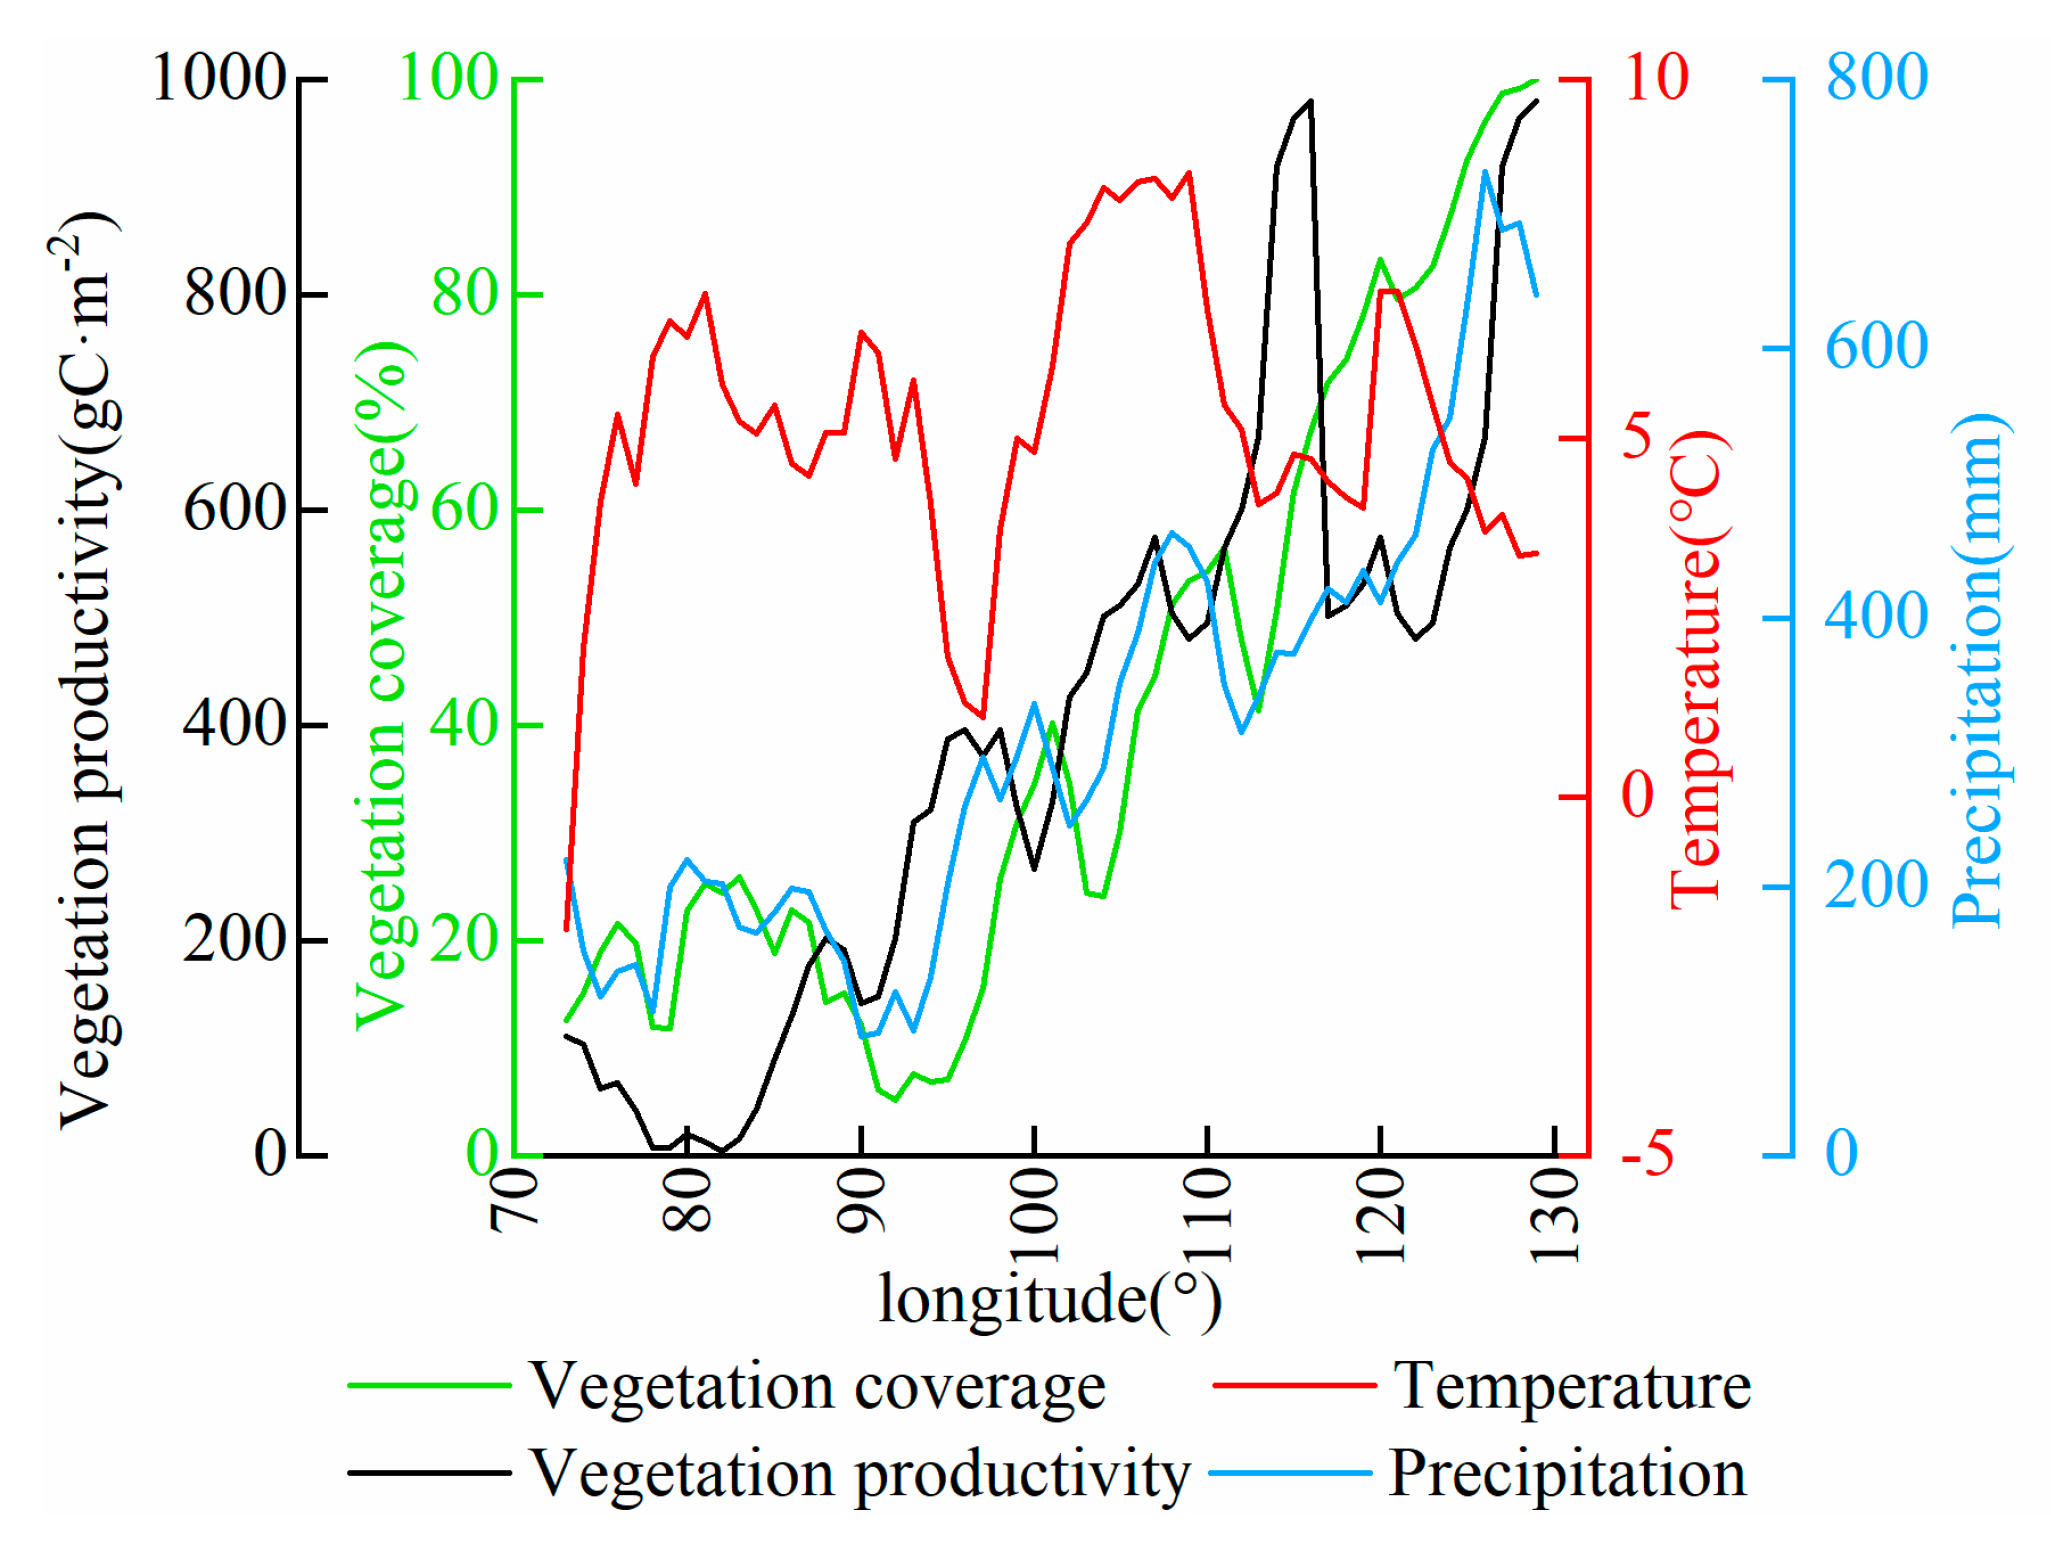
The spatial and temporal evolution of land use and vegetation coverage is influenced by the combination of climate change and human activities [77,78,79]. In particular, the growth of vegetation is more correlated with precipitation when the average annual temperature is greater than 0 °C (Figure 14). Human activities not only have caused changes in the surface landscape, but also led to changes in carbon fluxes in surface ecosystems, which are mainly reflected in the promotion and destruction of vegetated ecosystems, such as ecological engineering, mining and urban expansion [36]. Ecological protection and restoration activities include a series of measures, such as returning farmland to forest or grassland, afforestation and the establishment of nature reserves, which have accelerated the restoration of vegetation ecosystems under the background of warmer and more humid climate and played an important role in improving the quality of the ecological environment on a large scale. Meanwhile, excessive population growth has led to accelerated urbanization. From 2000 to 2020, the area of constructive land increased by 3145 km2 (12.05%). The low vegetation coverage and productivity of the project area was mainly distributed in barren, mainly sandy land and the Gobi Desert, and the part was reclaimed as cultivated land in the process of development and utilization. It has a great impact on small vegetation ecosystems. In conclusion, human activities have an important influence on the spatial and temporal evolution of land use and vegetation, so the quantitative analysis and driving mechanisms of human activity factors leading to land use and vegetation changes need to be further explored.

5. Conclusions

Based on MODIS products, the spatial–temporal evolution characteristics and influencing factors of land use and vegetation in the TNSFPA from 2000 to 2020 were analyzed by using a land use change map, line regression analysis, Sen’s and Mann–Kendall significance test and correlation analysis. The main conclusions are as follows:
(1)
The percentage of unchanged land was 90.05% in the TNSFPA from 2001 to 2020. Except for the increase in the area of cultivated land and constructive land, all other land use types showed a decreasing trend. The late change (58.06%) was the main change pattern, followed by the early change (28.94%) and repeated change (10.62%). The change of land use showed the characteristics of cultivated land and forest were mainly transformed into grassland, whereas grassland was mainly transformed into cultivated land and barren, which fully reflected the national policy of “returning farmland to forest land or grassland” and the current situation of grassland reclamation and degradation.
(2)
From 2000 to 2020, vegetation coverage in the study area generally presented a spatial distribution pattern of high coverage in the east and low coverage in the west, and the regional interannual fluctuation of high coverage was small. A total of 90.31% of the area showed an increasing trend (0.41%·a−1); 62.30% of the area showed a significant increasing trend, and the change rates in northeastern, northern, and northwestern China were 0.51%·a−1, 0.54%·a−1 and 0.37%·a−1, respectively. The trend of vegetation coverage in different seasons of the TNSFPA were all dominated by significant increase from 2000 to 2020.
(3)
From 2000 to 2020, the distribution space of vegetation productivity in the TNSFPA was basically the same as the coverage, and the interannual fluctuation in areas with low productivity was small. A total of 51.66% of the area showed an increasing trend (3.41 gC·m−2·a−1), mainly in the basic stable state and significantly increased state. The change rates in northeastern, northern, and northwestern China were 7.34 gC·m−2·a−1, 6.72 gC·m−2·a−1 and 2.10 gC·m−2·a−1, respectively. The trend of vegetation productivity in different seasons of the TNSFPA were all dominated by basic stability from 2000 to 2020.
(4)
The vegetation coverage and productivity in the TNSFPA were positively correlated with climate factors, and the correlation of precipitation was significantly higher than that of temperature. The proportion of areas with positive correlation between vegetation coverage and temperature and precipitation was 64.06% and 86.58%, respectively. The proportion of areas with a positive correlation between vegetation productivity and temperature and precipitation was 40.70% and 53.51%, respectively. The climatic factor restricting vegetation growth in the study area was mainly precipitation. The ecological protection and restoration activities of the TNSFPA have accelerated the restoration of the vegetation ecosystem. The rapid growth of population has led to the acceleration of urbanization. The intensification of the interaction of humans and land has led to the reclamation and development of barren, which had a great impact on the small–scale vegetation ecosystem.

Author Contributions

Conceptualization, C.Z. and X.Y.; data curation, C.Z. and G.W.; formal analysis, C.Z.; methodology, C.Z., T.S. and X.C.; resources, H.J. and J.Z.; software, C.Z., T.S., and J.C.; supervision, C.Z.; validation, C.Z., X.Y. and J.Z.; visualization, C.Z.; writing—original draft, C.Z.; writing—review & editing, C.Z. All authors have read and agreed to the published version of the manuscript.

Funding

This research was jointly funded by National Natural Science Foundation of China (No. 42071089) and Higher Education Innovation Fund Project of Gansu Province (No. 2022A-256).

Institutional Review Board Statement

Not applicable.

Informed Consent Statement

Not applicable.

Data Availability Statement

Not applicable.

Acknowledgments

We thank Hongyu Duan and Yu Wang for their help in writing this article. Finally, I would like to thank the previous scholars for their research results in this field, which are very enlightening for our work.

Conflicts of Interest

The authors declare no conflict of interest.

References

  1. Mooney, H.A.; Duraiappah, A.; Larigauderie, A. Evolution of natural and social science interactions in global change research programs. Proc. Natl. Acad. Sci. USA 2013, 110, 3665–3672. [Google Scholar] [CrossRef] [PubMed] [Green Version]
  2. IPCC. Climate Change 2021: The Physical Science Basis Summary for Policymakers; Cambridge University Press: London, UK, 2021. [Google Scholar]
  3. Sterling, S.; Ducharne, A.; Polcher, J. The impact of global land–cover change on the terrestrial water cycle. Nat. Clim. Chang. 2013, 3, 385–390. [Google Scholar] [CrossRef]
  4. Mishra, A.; Humpenöder, F.; Churkina, G.; Reyer, C.P.O.; Beier, F.; Bodirsky, B.L.; Schellnhuber, H.J.; Campen, H.L.; Popp, A. Land use change and carbon emissions of a transformation to timber cities. Nat. Commun. 2022, 13, 4889–4900. [Google Scholar] [CrossRef] [PubMed]
  5. Meyfroidt, P.; Lambin, E.F.; Erb, K.; Hertel, T.W. Globalization of land use: Distant drivers of land change and geographic displacement of land use. Curr. Opin. Environ. Sust. 2013, 5, 438–444. [Google Scholar] [CrossRef]
  6. Liu, J.Y.; Kuang, W.H.; Zhang, Z.X.; Xu, X.L.; Qin, Y.W.; Ning, J.; Zhou, W.C.; Zhang, S.W.; Li, R.D.; Yan, C.Z.; et al. Spatiotemporal characteristics, patterns and causes of land use changes in China since the late 1980s. Acta Geogr. Sin. 2014, 69, 3–14. [Google Scholar] [CrossRef]
  7. Parmesan, C.; Yohe, G. A globally coherent fingerprint of climate change impacts across natural systems. Nature 2003, 421, 37–42. [Google Scholar] [CrossRef] [PubMed]
  8. Chen, X.Q.; Wang, H. Spatial and temporal variations of vegetation belts and vegetation cover degrees in Inner Mongolia from 1982 to 2003. Acta Geogr. Sin. 2009, 64, 84–94. [Google Scholar] [CrossRef]
  9. Carmichael, M.J.; Bernhardt, E.S.; Bruer, S.L.; Smith, W.K. The role of vegetation in methane flux to the atmosphere: Should vegetation be included as a distinct category in the global methane budget? Biogeochemistry 2014, 119, 1–24. [Google Scholar] [CrossRef]
  10. Grahn, P.; Stigdotter, U.A. Landscape planning and stress. Urban For. Urban Green. 2003, 2, 1–18. [Google Scholar] [CrossRef] [Green Version]
  11. Ma, M.G.; Wang, J.; Wang, X.M. Advance in the inter-annual variability of vegetation and its relation to climate based on remote sensing. J. Remote Sens. 2006, 10, 421–431. [Google Scholar] [CrossRef]
  12. Zhang, X.W.; Wu, B.F.; Ling, F.; Zeng, Y.; Yan, N.N.; Yuan, C. Identification of priority areas for controlling soil erosion. Catena 2010, 83, 76–86. [Google Scholar] [CrossRef]
  13. Qiu, H.J.; Cao, M.M. Spatial and temporal variations in vegetation cover in China based on SPOT vegetation data. Res. Sci. 2011, 33, 145–150. [Google Scholar]
  14. Zhang, X.Z.; Zheng, J.Y.; He, F.N.; Dai, J.H. Regional differences in the process of vegetation cover change in Eastern China from 1982 to 2006. J. Nat. Res. 2013, 28, 28–37. [Google Scholar] [CrossRef]
  15. Wang, J.; Wang, K.L.; Zhang, M.Y.; Duan, Y.F. Temporal–spatial variation in NDVI and drivers in hilly terrain of southern China. Res. Sci. 2014, 36, 1712–1723. [Google Scholar]
  16. Lu, Y.H.; Coops, N.C.; Hermosilla, T. Estimating urban vegetation fraction across 25 cities in pan-Pacific using Landsat time series data. ISPRS J. Photogramm. 2017, 126, 11–23. [Google Scholar] [CrossRef]
  17. Roerink, G.J.; Menenti, M.; Soepboer, W.; Su, Z. Assessment of climate impact on vegetation dynamics by using remote sensing. Phys. Chem. Earth 2003, 28, 103–109. [Google Scholar] [CrossRef]
  18. Zhang, L.; Ding, M.J.; Zhang, H.M.; Wen, C. Spatiotemporal variation of the vegetation coverage in Yangtze river basin during 1982-2015. J. Nat. Res. 2018, 33, 2084–2097. [Google Scholar] [CrossRef]
  19. Milesi, C.; Elvidge, C.D.; Nemani, R.R.; Running, S.W. Assessing the impact of urban land development on net primary productivity in the southeastern United States. Remote Sens. Environ. 2003, 86, 401–410. [Google Scholar] [CrossRef]
  20. Qian, L.X.; Cui, H.S.; Chang, J. Impacts of land use and cover change on land surface temperature in the Zhujiang Delta. Pedosphere 2006, 16, 681–689. [Google Scholar] [CrossRef]
  21. Pan, P.P.; Yang, G.S.; Su, W.Z. Progress on effects of land use change on land productivity. Prog. Geogr. 2012, 31, 539–550. [Google Scholar] [CrossRef]
  22. Pan, P.P.; Yang, G.S.; Su, W.Z.; Wang, X.X. Impact of land use change on cultivated land productivity in Taihu lake basin. Sci. Geogr. Sin. 2015, 35, 990–998. [Google Scholar] [CrossRef]
  23. Dai, E.F.; Wu, S.H. Sustainable land use: Literature review and research progress. Prog. Geogr. 2004, 23, 79–88. [Google Scholar] [CrossRef]
  24. Fu, L.N.; Chen, X.D.; Leng, Z.H. Urban agglomerations eco–efficiency analysis based on super–efficiency DEA model: Case study of Chang-Zhu-Tan “3+5” urban agglomeration. Chin. Pop. Res. Environ. 2013, 23, 169–175. [Google Scholar] [CrossRef]
  25. Wang, L.J.; Li, H.; Shi, C. Urban land–use efficiency, spatial spillover, and determinants in China. Acta Geogr. Sin. 2015, 70, 1788–1799. [Google Scholar] [CrossRef]
  26. Jin, G.; Deng, Z.X.; Zhao, X.D.; Guo, B.S.; Yang, J. Spatio–temporal patterns of urban land use efficiency in the Yangtze River Economic Zone during 2005–2014. Acta Geogr. Sin. 2018, 73, 1242–1252. [Google Scholar] [CrossRef]
  27. Wang, S.Q.; Xu, J.; Zhou, C.H. The effect of land cover change on carbon cycle: A case study in the estuary of Yellow River Delta. Natl. Remote Sens. Bull. 2001, 5, 142–148. [Google Scholar] [CrossRef]
  28. Piao, S.L.; Fang, J.Y.; Ciais, P.; Peylin, P.; Huang, Y.; Stich, S.; Wang, T. The carbon balance of terrestrial ecosystems in China. Nature 2009, 458, 1009–1013. [Google Scholar] [CrossRef] [PubMed]
  29. Fu, C.; Yu, G.R.; Fang, H.J.; Wang, Q.F. Effects of land use and cover change on terrestrial carbon balance of China. Prog. Geogr. 2012, 31, 88–96. [Google Scholar] [CrossRef]
  30. Jia, K.; Yao, Y.J.; Wei, X.Q.; Gao, S.; Jiang, B.; Zhao, X. A review on fractional vegetation cover estimation using remote sensing. Adv. Earth Sci. 2013, 28, 774–782. [Google Scholar] [CrossRef]
  31. Wang, Z.; Shi, Q.S.; Wang, T.; Shi, Q.D.; Chang, S.L.; Zhang, L.B. Spatio–temporal characteristics of vegetation cover change in mountain-oasis-desert system of Xinjiang from 1982 to 2006. J. Nat. Res. 2011, 26, 609–618. [Google Scholar] [CrossRef]
  32. He, B.Z.; Ding, J.L.; Zhang, Z.; Abduwasit, G. Experimental analysis of spatial and temporal dynamics of fractional vegetation cover in Xinjiang. Acta Geogr. Sin. 2016, 71, 1948–1966. [Google Scholar] [CrossRef]
  33. Zhang, H.; Qu, J.J.; Zhang, K.C. Vegetation cover information extraction technology for Dunhuang Oasis based on remote sensing images. J. Des. Res. 2015, 35, 493–498. [Google Scholar] [CrossRef]
  34. Zhao, T.; Bai, H.Y.; Deng, C.H.; Meng, Q.; Guo, S.Z.; Qi, Z.G. Topographic differentiation effect on vegetation cover in the Qinling Mountains from 2000 to 2016. Acta Ecol. Sin. 2019, 39, 4499–4509. [Google Scholar] [CrossRef]
  35. Qi, Y.X.; Zhang, F.; Chen, R.; Wang, Y.S. Vegetation coverage dynamics in northern slope of Tianshan Mountains from 2001 to 2015. Acta Ecol. Sin. 2020, 40, 3677–3687. [Google Scholar] [CrossRef]
  36. Xiao, T.; Liu, J.Y.; Shao, Q.Q. A simulation on changes in vegetation productivity in “Three River Sources” nature reserve, Qinghai province over past 20 years. J. Geo-Inf. Sci. 2009, 11, 557–565. [Google Scholar] [CrossRef]
  37. Wu, X.F.; Li, G.X.; Pan, X.P.; Wang, Y.F.; Zhang, S.; Liu, F.G.; Shen, Y.J. Response of vegetation cover to temperature and precipitation in the source region of the Yellow River. Res. Sci. 2015, 37, 512–521. [Google Scholar]
  38. Zhang, Z.Q.; Liu, H.; Zuo, Q.T.; Yu, J.T.; Li, Y. Spatiotemporal change of fractional vegetation cover in the Yellow River basin during 2000–2019. Res. Sci. 2021, 43, 849–858. [Google Scholar] [CrossRef]
  39. Wu, Y.; Zeng, Y.; Wu, B.F.; Li, X.S.; Wu, W.B. Retrieval and analysis of vegetation cover in the Three–North Regions of China based on MODIS data. Chin. J. Ecol. 2009, 28, 1712–1718. [Google Scholar]
  40. Dai, S.P.; Ma, Z.H.; Wang, Q.; Zhang, B.; Zhang, Y.N.; Zou, Y. Dynamic changes in vegetation coverage in the Three–North Shelter Forest Program based on GIMMS AVHRR NDVI. Res. Sci. 2011, 33, 1613–1620. [Google Scholar]
  41. Zhu, P.; Huang, L.; Xiao, T.; Wang, J.B. Dynamic change of habitats in China’s typical nature reserves on spatial and temporal scales. Acta Geol. Sin. 2018, 73, 92–103. [Google Scholar] [CrossRef] [Green Version]
  42. Fensholt, R.; Langanke, T.; Rasmussen, K.; Reenberg, A.; Prince, S.D.; Tucker, C.; Scholes, R.J.; Le, Q.B.; Bondeau, A.; Eastman, R.; et al. Greenness in semi-arid areas across the globe 1981-2007: An Earth Observing Satellite based analysis of trends and drivers. Remote Sens. Environ. 2012, 121, 144–158. [Google Scholar] [CrossRef]
  43. Pang, G.W.; Yang, Q.K.; Wang, C.M.; Shan, L.X.; Wang, B.L. Influence of parameter determination methods of the pixel dichotomy model on the estimation accuracy of fractional vegetation cover by GF–1 PMS data. Geogr. Inf. Sci. 2019, 35, 27–33. [Google Scholar] [CrossRef]
  44. Puigderfabregas, J. Ecological impacts of global change on drylands and their implications for desertification. Land Degrad. Dev. 1998, 9, 393–406. [Google Scholar] [CrossRef]
  45. Lioubimtseva, E.; Cole, R.; Adams, J.M.; Kapustin, G. Impacts of climate and land–cover changes in arid lands of Central Asia. J. Arid Environ. 2005, 62, 285–308. [Google Scholar] [CrossRef]
  46. Dao, R.N. Effects of Climate and Land Use Change on Vegetation NDVI in the Three North Region. Master’s Thesis, Inner Mongolia Normal University, Hohhot, China, 2019. [Google Scholar]
  47. Zhang, L.X.; Song, Y.Q. Efficiency of the Three-North Forest Shelterbelt Program. Acta Sci. Nat. Univ. Peking 2003, 39, 594–600. [Google Scholar]
  48. Wang, Q. Study on Dynamic Change of Vegetation Coverage and Response to Climate Change in the Three–North Shelter Forest Program. Master’s Thesis, Northwest Normal University, Lanzhou, China, 2012. [Google Scholar]
  49. Loveland, T.R.; Belward, A.S. The international geosphere biosphere programme data and information system global land cover data set (DISCover). Acta Astronaut. 1997, 41, 681–689. [Google Scholar] [CrossRef]
  50. Belward, A.S.; Estes, J.E.; Kline, K.D. The igbp–dis global 1–km land–cover data set discover: A project overview. Photogramm. Eng. Remote Sens. 1999, 65, 1013–1020. [Google Scholar] [CrossRef]
  51. Sulla-Menashe, D.; Gray, J.M.; Abercrombie, S.P.; Friedl, M.A. Hierarchical mapping of annual global land cover 2001 to present: The modis collection 6 land cover products. Remote Sens. Environ. 2019, 222, 183–194. [Google Scholar] [CrossRef]
  52. Friedl, M.A.; McIver, D.K.; Hodges, J.; Zhang, X.Y.; Muchoney, D.; Strahler, A.H.; Woodcock, C.E.; Gopal, S.; Schneider, A.; Cooper, A.; et al. Global land cover mapping from MODIS: Algorithms and early results. Remote Sens. Environ. 2002, 83, 287–302. [Google Scholar] [CrossRef]
  53. Friedl, M.A.; Sulla-Menashe, D.; Tan, B.; Schneider, A.; Ramankutty, N.; Sibley, A.; Huang, X. MODIS Collection 5 global land cover: Algorithm refinements and characterization of new datasets. Remote Sens. Environ. 2010, 114, 168–182. [Google Scholar] [CrossRef]
  54. Schaaf, C.B.; Gao, F.; Strahler, A.H.; Lucht, W.; Li, X.; Tsang, T.; Strugnell, N.C.; Zhang, X.Y.; Jin, Y.F.; Muller, J.P.; et al. First operational BRDF, albedo nadir reflectance products from MODIS. Remote Sens. Environ. 2002, 83, 135–148. [Google Scholar] [CrossRef] [Green Version]
  55. Bao, W.D.; Hou, Z.H.; Wu, Q.Y. Research on land use changes based on Geo–informatic tupu–Taking Longkou city of Shandong province as an example. Area Res. Dev. 2007, 26, 80–84. [Google Scholar]
  56. Wang, S.; Zhang, L.L.; Lin, W.B.; Huang, Q.S.; Song, Y.X.; Ye, M. Study on vegetation coverage and land-use change of Guangdong province based on MODIS-NDVI. Acta Ecol. Sin. 2022, 42, 2149–2163. [Google Scholar] [CrossRef]
  57. Adams, J.E.; Arkin, G.F. A light interception method for measuring row crop ground cover. Soil. Sci. Soc. Am. J. 1977, 41, 789–792. [Google Scholar] [CrossRef]
  58. Zhu, L.F. Study on the Spatial-Temporal Variation of Vegetation Coverage and Karst Rocky Desertification Bases on MODIS Data. Ph.D. Thesis, Southwest University, Chongqing, China, 2018. [Google Scholar]
  59. Holben, B.N. Characteristics of maximum–value composite images from temporal AVHRR data. Int. J. Remote Sens. 1986, 7, 1417–1434. [Google Scholar] [CrossRef]
  60. Stow, D.; Petersen, A.; Hope, A.; Engstrom, R.; Coulter, L. Greenness trends of Arctic tundra vegetation in the 1990s: Comparison of two NDVI datasets from NOAA AVHRR systems. Int. J. Remote Sens. 2007, 28, 4807–4822. [Google Scholar] [CrossRef]
  61. Cao, X.J.; Hasbagan, G.; Hu, G.Z.; Gao, Q.Z. Characteristics of grassland degradation in the Qinghai Tibetan Plateau, based on NDVI3g data. Chin. J. Agric. 2019, 40, 86–95. [Google Scholar] [CrossRef]
  62. Gutman, G.; Ignatov, A. The derivation of the green vegetation fraction from NOAA/AVHRR data for use in numerical weather prediction models. Int. J. Remote Sens. 1998, 19, 1533–1543. [Google Scholar] [CrossRef]
  63. Carlson, T.N.; Ripley, D.A. On the relation between NDVI, fractional vegetation cover, and leaf area index. Remote Sens. Environ. 1998, 62, 241–252. [Google Scholar] [CrossRef]
  64. Mu, S.J.; Li, J.L.; Chen, Y.Z.; Gang, C.C.; Zhou, W.; Ju, W.M. Spatial differences of variations of vegetation coverage in Inner Mongolia during 2001–2010. Acta Geogr. Sin. 2012, 67, 1255–1268. [Google Scholar] [CrossRef]
  65. Stow, D.; Daeschner, S.; Hope, A.; Douglas, D.; Petersen, A.; Myneni, R.; Zhou, L.; Oechel, W. Variability of the seasonally integrated normalized difference vegetation index across the north slope of Alaska in the 1990s. Int. J. Remote Sens. 2003, 24, 1111–1117. [Google Scholar] [CrossRef]
  66. Wei, F.Y. Regional consensus forecast method with dynamic weighting for summer precipitation over China. J. Appl. Meteorol. Sci. 1999, 4, 402–409. [Google Scholar]
  67. Xu, J.H. Mathematical Methods in Contemporary Geography; Higher Education Press: Beijing, China, 2017; pp. 133–134. [Google Scholar]
  68. Yu, X.F.; Zhuang, D.F. Monitoring forest phenophases of North China based on MODIS NDVI data. Res. Sci. 2006, 28, 111–117. [Google Scholar]
  69. Deng, C.H.; Bai, H.Y.; Ma, X.P.; Zhao, T.; Gao, S.; Huang, X.Y. Spatiotemporal differences in the climatic growing season in the Qinling Mountains of China under the influence of global warming from 1964 to 2015. Theor. Appl. Climatol. 2019, 138, 1899–1911. [Google Scholar] [CrossRef]
  70. Ji, Y.H.; Zhou, G.S.; Wang, S.D.; Wang, L.X.; Zhou, M.Z. Evolution characteristics and its driving forces analysis of vegetation ecological quality in Qinling Mountains region from 2000 to 2019. Chin. J. Plant Ecol. 2021, 45, 617–625. [Google Scholar] [CrossRef]
  71. Li, H.W.; Ding, J.H.; Zhang, J.; Yang, Z.N.; Yang, B.; Zhu, Q.A.; Peng, C.H. Effects of Land Cover Changes on Net Primary Productivity in the Terrestrial Ecosystems of China from 2001 to 2012. Land 2020, 9, 480. [Google Scholar] [CrossRef]
  72. Song, Y.; Ma, M.G. Study on vegetation cover change in Northwest China based on SPOT VEGETATION data. J. Des. Res. 2007, 27, 89–93. [Google Scholar]
  73. Wu, C.G.; Zhou, Z.X.; Xiao, W.F.; Wang, P.C.; Wang, T.; Huang, Z.J. Dynamic monitoring of vegetation coverage in the Three Gorges Reservoir area based on MODIS–NDVI. Sci. Silvae Sin. 2012, 48, 22–28. [Google Scholar] [CrossRef]
  74. Beer, C.; Reichstein, M.; Tomelleri, E.; Ciais, P.; Jung, M.; Carvalhais, N.; Rodenbeckm, C.; Arain, M.A.; Baldocchi, D.; Bonan, G.B.; et al. Terrestrial gross carbon dioxide uptake: Global distribution and covariation with climate. Science 2010, 329, 834–838. [Google Scholar] [CrossRef] [Green Version]
  75. Niu, Z.E.; Yan, H.M.; Chen, J.Q.; Huang, M.; Wang, S.Q. Comparison of crop gross primary productivity estimated with VPM model and MOD17 product in field ecosystem of China. Trans. Chin. Soc. Agric. Eng. 2016, 32, 191–198. [Google Scholar]
  76. Xu, H.Q. Assessment of ecological change in soil loss area using remote sensing technology. Trans. Chin. Soc. Agric. Eng. 2013, 29, 91–97+294. [Google Scholar]
  77. Fang, J.Y.; Song, Y.C.; Liu, H.Y.; Piao, S.L. Vegetation climate relationship and its application in the division of vegetation zone in China. Acta Bot. Sin. 2002, 44, 1105–1122. [Google Scholar]
  78. Sun, Y.L.; Yang, Y.L.; Zhang, L.; Wang, Z.L. The relative roles of climate variations and human activities in vegetation change in North China. Phys. Chem. Earth 2015, 87–88, 67–78. [Google Scholar] [CrossRef]
  79. Zhang, W.; Wang, L.C.; Xiang, F.F.; Qin, W.M.; Jiang, W.X. Vegetation dynamics and the relations with climate change at multiple time scales in the Yangtze River and Yellow River Basin, China. Ecol. Indic. 2020, 110, 105892–105904. [Google Scholar] [CrossRef]
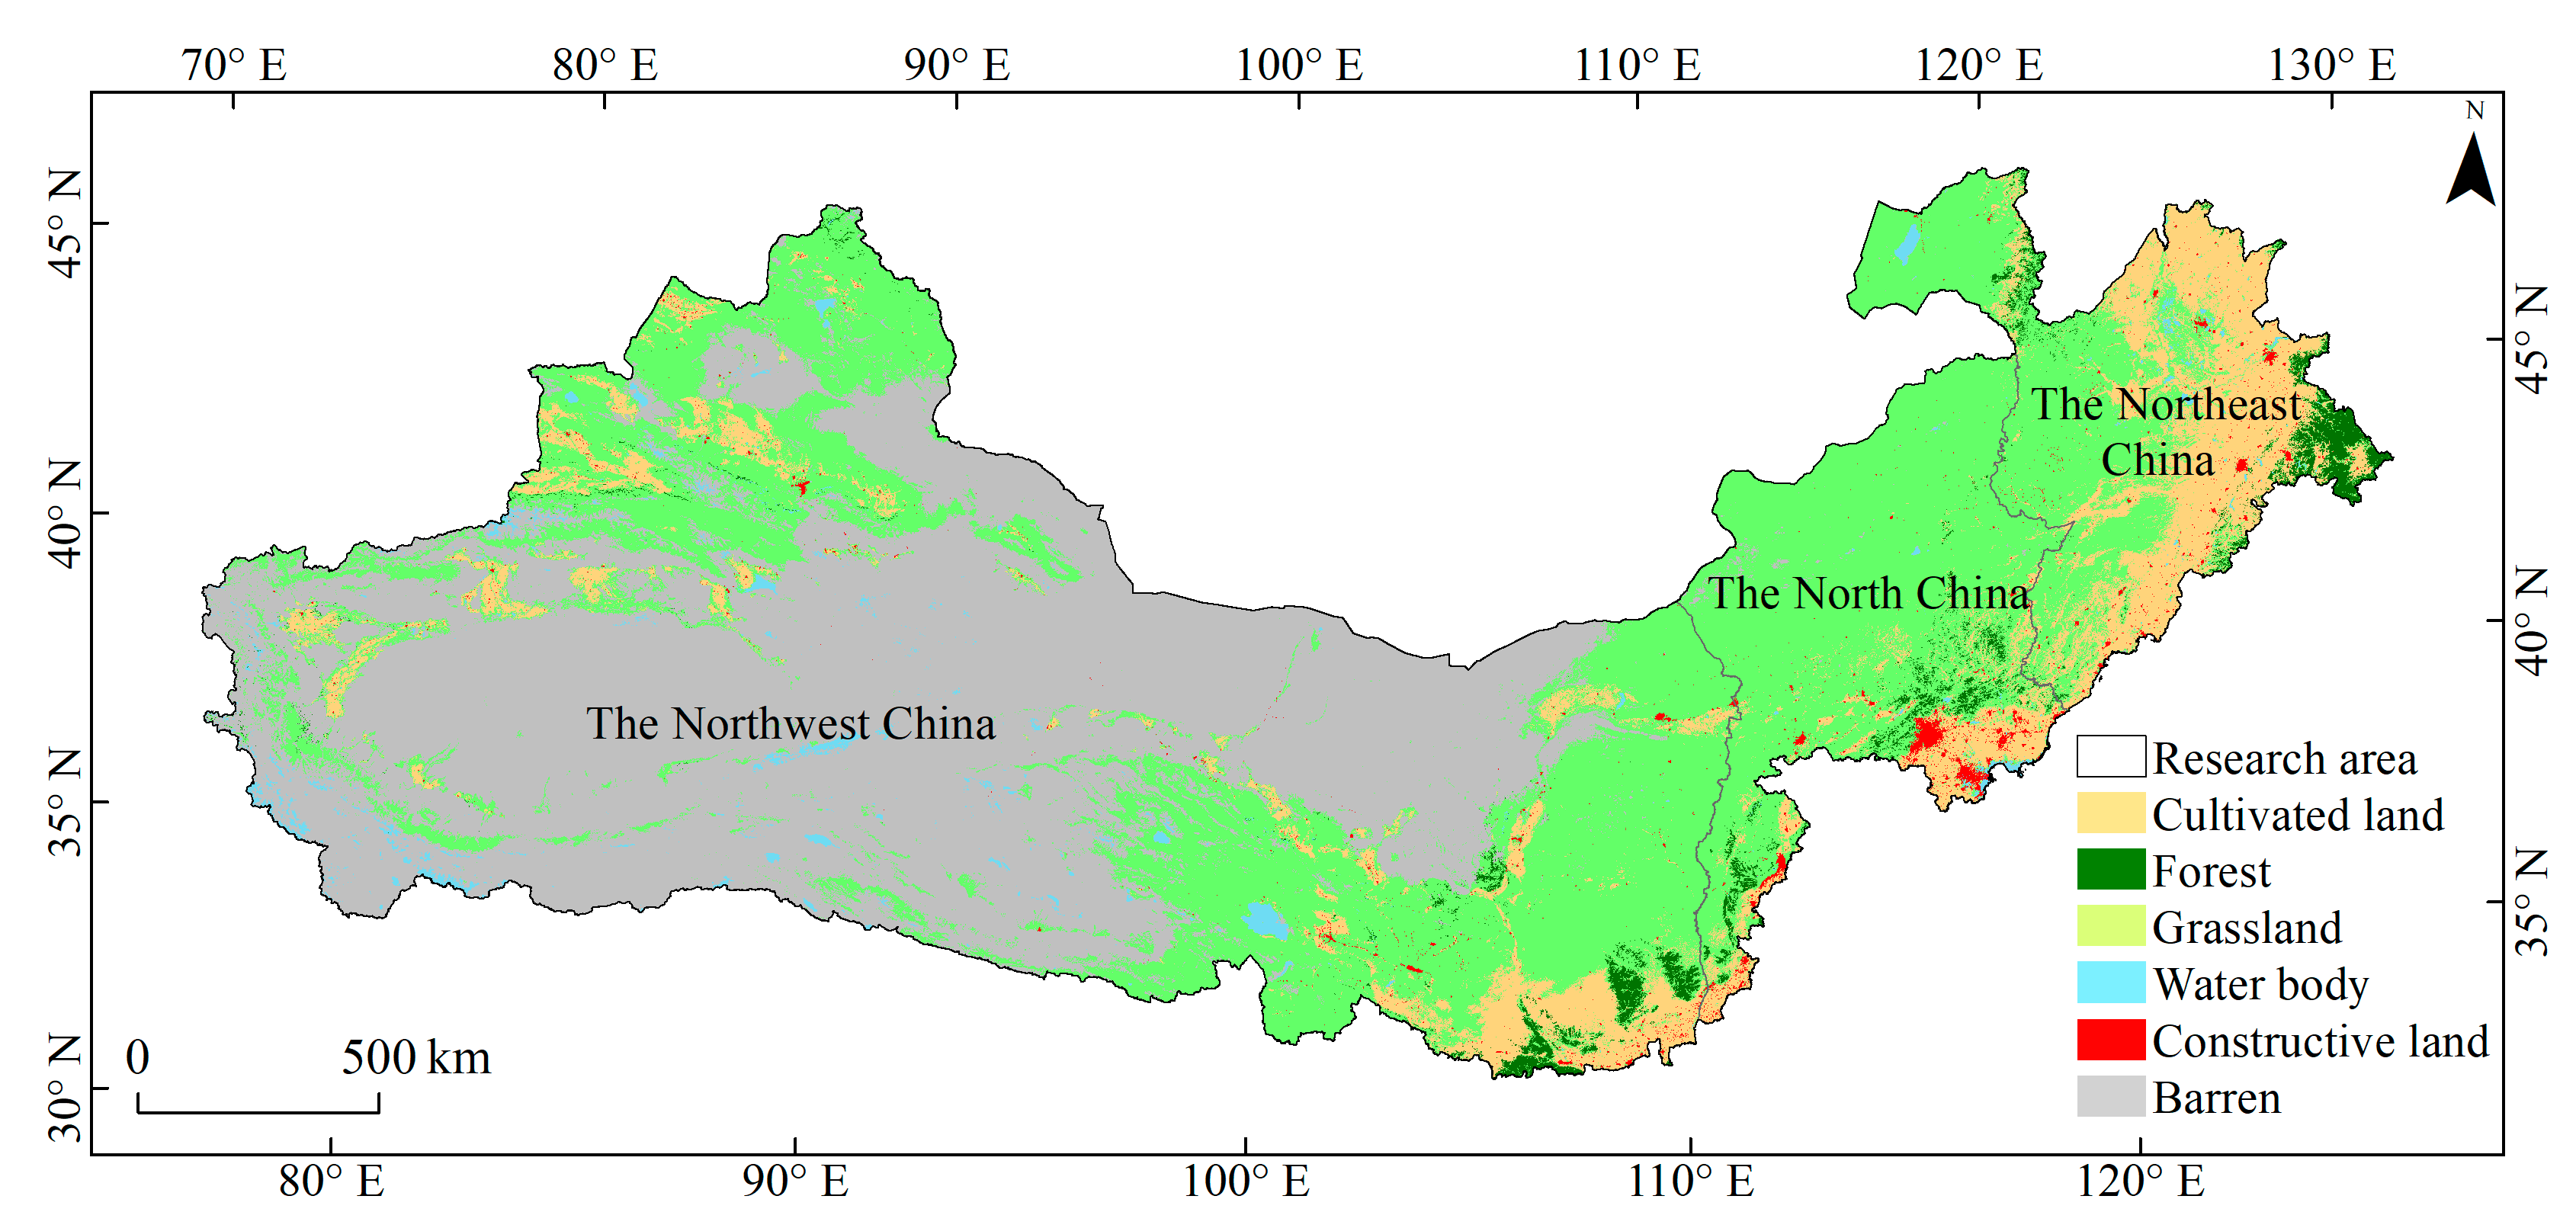
Figure 1. Map of Land use and land cover type in the Three–North Shelter Forest Program Area in 2020.
Sustainability 14 16489 g001
Figure 2. Mind map of this study.
Sustainability 14 16489 g002
Figure 3. Trend of LUCC in the TNSFPA from 2001 to 2020. (aq) trend of 17 land use types in secondary classification system; (r) rate of 17 land use types.
Sustainability 14 16489 g003aSustainability 14 16489 g003b
Figure 4. Geospectrum of LUCC change model.
Sustainability 14 16489 g004
Figure 5. Distribution and change of vegetation coverage in the TNSFPA from 2000 to 2020.
Sustainability 14 16489 g005
Figure 6. Trend of vegetation coverage in the TNSFPA and its subregions from 2000 to 2020.
Sustainability 14 16489 g006
Figure 7. Trend of vegetation coverage in different seasons in the TNSFPA from 2000 to 2020.
Sustainability 14 16489 g007
Figure 8. Distribution and change of vegetation productivity in the TNSFPA during 2000–2020.
Sustainability 14 16489 g008
Figure 9. Trend of vegetation productivity in the TNSFPA and its zones from 2000 to 2020.
Sustainability 14 16489 g009
Figure 10. Trend of vegetation productivity in different seasons in the TNSFPA from 2000 to 2020.
Sustainability 14 16489 g010
Figure 11. Effects of climate change on vegetation growth factors in the TNSFPA.
Sustainability 14 16489 g011
Figure 12. Spatial correlations between vegetation growth and climate factors in the TNSFPA from 2000 to 2020.
Sustainability 14 16489 g012
Figure 13. Average and slope of vegetation coverage and vegetation productivity under different types of land use change from 2000 to 2020.
Sustainability 14 16489 g013
Figure 14. The distribution of vegetation coverage, productivity, temperature and precipitation in different longitude zones in the TNSFPA from 2000 to 2020.
Sustainability 14 16489 g014
Table 1. The classification system of LUCC.
CodeThe Primary ClassificationThe Secondary Classification and Code
1cultivated landcroplands (12), cropland/natural vegetation mosaics (14)
2forestevergreen needleleaf forests (1), evergreen broadleaf forests (2), deciduous needleleaf forests (3), deciduous broadleaf forests (4), mixed forest (5), closed shrublands (6), open shrublands (7)
3grasslandwoody savannas (8), savannas (9), grasslands (10)
4water bodypermanent wetlands (11), permanent snow and ice (15), water bodies (17)
5constructive landurban and built-up lands (13)
6barrenbarren (16)
Table 2. Types of LUCC.
CodeAAAABBAABABAABC
TypeNo
change
Previous changeLater
change
Repeated
change
Continuous
change
Table 3. Classification criteria of the trend.
Coefficient Reference RangeTrend
β < 0, |Z| > 1.96Significant reduction
β < 0, |Z| ≤ 1.96Slight reduction
β = 0Basic stability
β > 0, |Z| ≤ 1.96Slight increase
β > 0, |Z| > 1.96Significant increase
Table 4. LUCC in the TNSFPA from 2001 to 2020.
TypeArea/km2Change Rate/%
2001201020202001~20102010~20202001~2020
cultivated land408,632428,480465,1584.868.5613.83
forest60,99268,57673,80312.437.6221.00
grassland1,637,2231,648,5841,648,8910.690.020.71
water body34,25940,94247,93619.5017.0839.92
constructive land26,10227,15829,2474.047.6912.05
barren1901,7901,855,2611,803,965−2.45−2.76−5.14
Publisher’s Note: MDPI stays neutral with regard to jurisdictional claims in published maps and institutional affiliations.