1. Introduction
In the context of a high proportion of new energy infiltrating the power grid, building up a stable and efficient new energy system is of great significance. Through the integration of new energy and traditional energy power generation, the proportion of new energy power generation output is increased to achieve the carbon peak and carbon neutralization and promote the development of a new energy industry. The realization of a new energy-based power system model has also received widespread attention. Currently, the primary research focuses can be broadly divided into three aspects. The first aspect is to promote efficiency in new energy development and participate in the research on electricity market transactions. Extending the power market mechanism to the power distribution system is essential for new energy to participate in market-based trading. The stochastic optimization method or the energy blockchain theory is applied to the power trading process based on various energy supply agents, such as demand aggregators and power distribution companies. By encouraging users to modify their electricity consumption patterns to meet load demand responses, the impact of renewable energy generation uncertainty on power trading can be mitigated. Based on the decentralization technology of energy blockchain, consumers and energy producers can trade energy directly point-to-point, which can effectively reduce transaction costs, improve market transaction efficiency, and promote the efficient use of renewable energy [
1,
2,
3].
Secondly, responsive systems for improved energy management and optimization in multiple energy complementation and load demand are needed. The system load demand response aims to reduce the frequency deviation and reserve capacity of the power system, using interruptible loads to regulate system demand and introducing energy storage systems, variable speed heat pumps, solid-state transformers, supercapacitors, and other equipment into the energy balance control of the power system. This means that the feedback control of load variations and the power allocation strategy based on system energy management are used to balance and compensate for the power shortage of the system, provide auxiliary frequency modulation services for the power grid for better voltage quality and lower operating losses and costs [
4,
5]. The multi-energy complementary optimization operation is predicated primarily on a system composed of energy sources with different power generation characteristics, taking into account operating costs, grid reliability, power generation fluctuations, load peaks, and load demand response. A multi-objective constrained optimization model of system peak shaving and valley filling is developed to reduce greenhouse gas emissions and ensure a reliable power supply. In order to use mixed integer linear programming, the multi-objective constraints are converted into single-objective constraints based on the fuzzy satisfaction maximization model. There are some signs of progress reported. According to studies, multi-energy complementary optimal operation promotes the complete consumption of clean energy as well as the optimization and modification of energy structure [
6,
7]. The research on the operation of the multi-energy complementary system in the industrial park focuses primarily on the disparity between the system’s internal electric energy, heat energy, and cooling energy demand and the uncertainty of its dispersed energy output. Furthermore, an energy supply index is calculated based on the power generation characteristics of different energies, the load characteristic curve, the energy supply reliability, the cost-effectiveness of the system, and the electrothermal coupling characteristics. Moreover, when production and operation constraints are satisfied, the paper creates a joint optimization model of thermal energy, electric energy, cold energy, and energy storage to minimize production costs to provide decision-making for the efficient use of energy in the park, with a focus on enhancing comprehensive energy utilization and production operation efficiency [
8,
9,
10]. There are many research commonalities between multi-energy complementarity and comprehensive energy, such as: ensuring the stable operation of the power system, improving its economical operation level, energy utilization efficiency, and reducing the uncertainty of new energy generation. However, the two have their emphasis. Integrated energy not only considers the optimization and integration of various forms of energy, such as electric heat but also emphasizes the ability to adjust the load side. In contrast, multi-energy complementarity focuses on making full use of the optimization of different power supply capacity ratios to strengthen the flexible adjustment and support role of the power supply side for new energy.
The third aspect is the investigation of the joint operation benefit or cost-sharing mechanism of multiple types of energy. This aspect simulates the behavior of multiple types of energy participating in a cooperative game using a cooperative game model. Multiple types of energy alliances and photovoltaic power generators are positioned as leaders and followers, respectively, according to the Stackelberg game model. The master-slave game model is used to determine the power supply price of each subject in the alliance operation, the system energy supply and demand balance is achieved via the price guidance mechanism, and system load operation characteristics are enhanced. Regarding studies on multi-energy power generation rights trading and revenue allocation of frequency modulation auxiliary services of each main body in the market, the paper adopts the Shapley equilibrium value allocation strategy for each main body’s interest balance [
11,
12,
13]. Wang et al. [
14] imposed the profit distribution method, combining the Shapley value method and nucleolus method, to optimize the benefit of the integrated energy system. The results of the two distribution methods are added, and then the average value is taken as the final distribution result to achieve a relatively balanced distribution of profits. This method promotes the overall coordinated and optimal operation of different subjects participating in the system. Zhou et al. [
15] proposed a compensation pricing optimization method for cogeneration to participate in paid peak regulation of the power grid. Based on the Shapley value method, the internal peak shaving income distribution strategy of the thermal system is formulated. This strategy can fully reflect the contribution of heating equipment to the flexibility of power grid peak regulation. Moreover, a Nash equilibrium optimal scheduling model for multiple microgrid energy transactions is established by Wei et al. [
16]. Active energy trading with other microgrids to obtain profits by minimizing the operating cost of a single microgrid. The results show that the revenue of each subject is improved after the cooperation of multiple microgrids.
There are a few major problems in the existing literature of related research: (1) Shapley value method, nucleolus method, and other methods are widely used in comprehensive energy, multi-energy alliance income distribution, or cost allocation. However, different methods have different application scenarios or allocation effects. For example, the nucleolus method is distributed among a completely average mode, with the contribution differentiation of various subjects not fully considered. The Shapley value method allocates benefits or costs according to the marginal contribution of subjects, which may successfully avoid the egalitarianism of distribution. However, the willingness of each subject to participate in alliance cooperation is not conducive to the long-term stable development of the alliance. Furthermore, there is a lack of in-depth research on the “multi-scale dynamic Shapley equilibrium value”, which incorporates the mutual constraint relationship to different output ratios, different power generation, and cost allocation of multiple power generation entities. (2) The high-efficiency coordinated development of energy with different power generation characteristics has attracted attention, and there are few studies on the construction of power systems based on new energy. There is a lack of a multi-body generation optimal portfolio decision-making method based on dynamic cost equilibrium among different main bodies. (3) There have been many research results in the multi-agent cost allocation based on the cooperative game model, but the dynamic cost allocation of each subject and the related change of the output ratio, as well as the multi-functional alliance, have been left out (of the scope of the studies). There is little research on the multi-scale optimal combination of different subjects under the model and its dynamic cost, high-granularity accounting for an increase in the proportion of new energy power generation.
The possible academic contributions of this paper: (1) Considering the limitations of the Shapley value method, it explores the applicability and accessibility of the Shapley value method in the dynamic optimization decision of cost control and product distribution of each subject. The discrete coefficient of cost-sharing value and its median index is introduced as the basis for judging the participation willingness of different subjects and the stability of the alliance. The overall equilibrium effect of the coalition is studied to determine the power generation, power generation ratio, and optimal power generation combination scheme of each agent under multi-spatiotemporal scales. (2) The paper simulates the joint operation of new energy (wind, photovoltaic) and traditional energy (hydro, thermal power) and reveals the supporting mechanism of multi-energy alliance mode for new energy power systems based on the complementary characteristics of different power generation main bodies and the overall rationality of the alliance from the perspective of multi-energy alliance operation. The model supports the new energy power system. (3) To achieve load stabilization and power system supply and demand balance, an optimal supply decision method is proposed for energy with different power generation characteristics in the alliance. For the optimal allocation of internal resources of the alliance and the optimal cost of the multi-scale portfolio of each main body, four energy alliance operation optimization portfolios and cost-sharing models have been shaped based on the Shapley value method. Through the generation output value and output ratio of each main body, the dynamic allocation value of cost-sharing and output ratio under the multi-scale portfolio of different main bodies have been iteratively solved. The correlation among different output ratios, different power generation outputs, and their dynamic cost allocation has been unveiled to provide a decision-making basis for improving the ratio of new energy power generation. (4) Based on the operation mechanism of the alliance, the paper is proposed to verify the effect of the Shapley value method in the application of high granularity accounting of dynamic cost and the equilibrium of cost sharing for all main bodies to tap the value of resources of the main bodies within the alliance model, reduce the impact of renewable energy volatility on system stability, optimize the overall operation cost of the alliance, and provide a research paradigm for the planning and operation mechanism of the new energy power system. (5) The paper, under the energy alliance operation mode, studies the dynamic change law of multi-scale portfolio output ratio and cost equilibrium of all main bodies, exploiting the potential of their dynamic cost control and the equilibrium effect of cost control. (6) As an important subject to realize, the interaction of source-network-load-storage, virtual power plants, and load aggregators provide a research paradigm for further integrating multi-party resources into new energy power systems. By referring to the scheme of this paper, virtual power plants and load aggregators can be incorporated into the operation of multi-energy alliances to reduce the scheduling and management pressure of the power grid on decentralized load-side resources and achieve efficient energy management. (7) Consider the differences between the present study and the existing representative documentation [
11,
12,
17,
18,
19]. Based on the research content, problem-solving, research methods, and lack of research in four areas compared with this study. The results of literature comparison are in
Appendix Table A1. And, the abbreviation of all professional nouns in this paper are in
Appendix Table A2.
2. Research Hypothesis
(1) Different energy sources can have alliances to achieve overall interests or individual interests. There are two, three, or four main bodies in wind power, photovoltaic, hydropower, and thermal power energy alliances. The electricity market is open, and the alliance operation mode can be realized between regional or interregional energy sources, and the transmission and distribution network can provide power transmission services independently.
(2) The average power generation cost of wind, light, water, and thermal energy adopts representative data from a certain region in China.
(3) The paper assumes that the load curve has the conditions for deep peak shaving auxiliary service; that is, utilizing different generator output portfolios to perform peak shaving auxiliary service, carry out peak load shifting for the system load, and stabilize the peak and valley loads. Under the different operation modes of the system and the multi-scale combination of each subject, the total power shortage of the system peak and valley is taken as the target (without considering the real-time shortage of load demand). According to the different output and different output proportions of each subject, the dynamic cost equilibrium allocation calculation is carried out for the overall cost of the alliance. During the practical project, the peak-valley duration can be set according to the characteristics of the selected load curve or the peak-valley division policies in different areas. The paper assumes that the peak sections of the load curve are from 07:00 am to 11:00 am and from 7:00 pm to 11:00 pm, and the valley sections are from 3:00 pm to 6:00 pm and from 11:00 pm to 07:00 am of the next day.
(4) Assume that the capacity of wind power or photovoltaic connected to the power grid can fully meet the demand for system load peak shaving and valley filling. Wind power and photovoltaic energy can cooperate with hydropower or thermal power to participate in deep peak shaving of the system. This paper sets photovoltaic power generation mainly from 6:00 to 18:00; wind power will generate electricity for 24 h, and there is no transmission blockage in the energy supply. It is assumed that the output of “wind, light, water, and fire” can meet the load demand under the alliance operation mode. Ignore the seasonal climate change impacts of wind power and hydropower.
3. Shapley Value Method Model
Let set
, if any subset
of
(representing any combination in the set of
people) corresponds to a real-valued function
, satisfying:
Call the player cooperative game, and is called the characteristic function of the game.
Usually, let
denote a share of the income that member
in
should receive from the maximum benefit
of cooperation. Based on cooperation
, the allocation of cooperative strategies is denoted by
. Obviously, the success of this cooperation must meet the following conditions:
In the Shapley value method, the profit distribution of each partner under cooperation
is called the Shapley value and denoted as:
, where
represents the distribution of the
-th member under cooperation
, which can be obtained by the following formula:
Among them, is all subsets in the set that contain member , is the number of elements in the subset , is the number of elements in the set , and can be regarded as a weighting factor. is the benefit of the subset , and the benefit that can be obtained after removing the firm from the subset . The proofs of Formulas (5) and (6) are omitted.
4. Shapley Value Method Operating Model in Multi-Class Energy Alliance
4.1. Consortium Operating Cost Model
4.1.1. Overall Cost of Alliance
The overall operating cost calculation formula of the alliance is as follows:
In the formula: —the -th is the energy cost in the alliance. —is the total cost of the multi-energy alliance. Formula (7) indicates that the overall cost of the wind-thermal-hydropower alliance is equal to the sum of the energy costs in the alliance.
4.1.2. Comparison of Individual Costs under Different Operating Modes
The comparison of individual costs between independent operation and alliance operation:
In the formula: —the independent operation cost of the -th energy. The energy operation cost of the participating alliance is less than or equal to its independent operation cost.
4.2. Multi-Scale Combined Cost Allocation Model for Each Subject
The Shapley value cost allocation model for the multi-scale combination of four energy sources is as follows.
4.2.1. Output Ratio Matrix and Its Constraints
The output ratio matrix and its constraint matrix of four energy multi-scale combinations are shown in Formulas (9) and (10).
In the formula: , , , and respectively represent the output ratio of wind, light, water, and fire energy, and the output ratio of each main body under different energy combinations is between 0 and 1.
4.2.2. Power Generation Cost Matrix of Each Main Body
The power generation cost matrix of four energy multi-scale combinations:
In the formula: ,,, represent the power generation costs of wind, light, water, and thermal energy, respectively.
The single energy cost is:
In the formula: is the cost of wind, light, water, and fire energy; the unit is yuan. is the power of wind, light, water, and fire energy.
4.2.3. Cost-Sharing Contribution of Different Energy Multi-Scale Combinations
The cost sharing contribution of the two energy multi-scale combinations is:
In the formula: is the cost-sharing contribution of the two energy sources and . is the output ratio of different energy sources and satisfies the constraints of Formula (9).
Similarly, the cost-sharing contribution of three or four different energy combinations can be deduced as follows:
In the formula:
contributes to the cost allocation of the three energy sources
,
and
.
In the formula: is the cost allocation contribution value of the four energy sources , , , and .
4.2.4. Weighting Factor of Cost Allocation Value of Each Entity
For the problem of cost allocation of each subject alliance, firstly calculate the weighting factor of each subject’s cost allocation value under the multi-scale combination of each subject. For a coalition of four subjects, the weighting factor matrix is calculated by Formula (6) as
The Shapley value of a subject
in the alliance is:
In the formula: is the Shapley value of the subject , is all subsets in the set that contain member , can be regarded as a weighting factor, and is the benefit of the subset (a set composed of multi-scale combinations of all subjects in the alliance). is the benefit obtained after the subject is removed from the subset .
When
, the Shapley cost allocation calculation formula of wind power energy cost is
In the formula: is the Shapley value of wind power cost in the alliance formed by the four energy entities. The Shapley cost value () of other photovoltaics, hydropower, and thermal power can be calculated separately according to Formula (18).
4.3. Multi-Energy Coalition Shapley Cost Allocation Equilibrium Effect and Balanced Combination Test
Different cost allocation methods are used for comparative application in the multi-energy alliance. The cost fluctuation of different subjects under different distribution modes can be calculated. Additionally, to a certain extent, it can reflect the fairness of cost allocation. However, this model is not convenient for the systematic evaluation of the balanced effect of different combination cost allocations and the optimal combination scheme. At the same time, the Shapley value method calculates the cost-sharing according to the marginal contribution of each subject to the alliance operation, which improves the enthusiasm for each subject to participate in the alliance operation to a certain extent. However, this method regards the operational risks of each member of the alliance as equal 1/n. In engineering practice, there are differences in the risk situation of each subject and the willingness to participate in the operation of the alliance if the willingness of members to participate in the alliance is considered the same. When the equilibrium value of cost-sharing with different subjects deviates from its own cost approval value, different subjects believe that their interests are damaged, and this has a direct impact on individual willingness to participate in the alliance and alliance operational stability.
Consequently, it assesses the global stability of the alliance and the acceptance of each subject to the balanced allocation effect of the cost of the alliance. The discrete coefficient equation [
17] is used to calculate the variation of the standard deviation of the cost-sharing value of each subject relative to the average value. The large combination dispersion coefficient indicates that the cost-sharing balance of each subject is unbalanced, which affects the enthusiasm for each subject to participate in the operation of the alliance. The combination discrete coefficient value is small, although each member has high participation in alliance operation enthusiasm. However, this is considering the time-varying characteristics of the load, the degree of cost fluctuation of each subject under extreme conditions or the influence of the difference in the power generation characteristics of each subject to fully tap the multi-energy alliance collaborative optimization effects. Based on the median equation, the median values of discrete coefficients under various combinations are calculated. The discrete coefficient value centering scheme is used as a reference to the multi-scale optimal combination strategy of each subject in the alliance. Combined with the median of the cost allocation value of each subject, the cost fluctuation dispersion coefficients of different combinations are constructed. Considering the balance of different portfolio cost allocations, the high proportion of new energy power generation, and the stability of the union, the discrete coefficient of portfolio cost fluctuation is minimized. The combination closest to the median value of the combined discrete coefficient is determined as the optimal combination scheme for the coalition. It can also be combined with cost fluctuation discrete coefficient and different combinations of discrete data. Considering the interests in each subject and market to demand, the specific optimization combination scheme is adopted by using the internal negotiation mechanism of the alliance. The Shapley cost allocation equilibrium effect and optimal combination test equation of multi-energy alliance are as follows:
(1) The discrete coefficient equation of the alliance portfolio is shown in Equations (19)–(21).
Formula (19) represents the ratio of the standard deviation of a set of data to its corresponding mean value, which is between 0 and 1, —the cost-sharing dispersion coefficient of a subject in the alliance. —standard deviation of cost allocation for different entities in combination with the alliance. —a subject cost-sharing value. This paper mainly considers the four kinds of energy cost-sharing balance, designating the number of participants as = 4. —the average of a combination cost allocation within the alliance.
(2) The median is calculated by selecting different formulas based on the parity of the total number of combinations of the Union, as shown in Formula (22):
In the formula, —is the median of each group of data, is the total number of combinations: when is an odd number, is the intermediate data of all data and used directly as the median. When is even, is the intermediate data of the group of data, and the average of the two needs to be calculated as the median.
(3) Based on the calculation median of the cost allocation value of each subject corresponding to different combinations, the discrete coefficient equation of combination cost fluctuation is constructed concerning Formula (20). The comprehensive fluctuation level of the combined cost is evaluated. The smaller the
in Formula (23), the smaller the discrete coefficient value of the combined cost fluctuation, indicating that the fluctuation of the cost allocation value of each subject is close to the median level, and the stability of each subject participating in the alliance is better. As shown in Formula (23):
Among them, —the discrete coefficient of portfolio cost fluctuation, —is the cost allocation value of each subject, —is the median of costing allocation value corresponding to different subjects under different combinations (47 combinations), —is the number of subjects participating in the alliance.
5. Simulation Case
5.1. Basic Data
5.1.1. KWh Cost Matrix
In 2017, the average KWH of China’s onshore wind and photovoltaic energy was about 0.478 (yuan/KWh) and 0.52 (yuan/KWh); from 2017 to 2019, the LCOE of China’s pumped storage and thermal power energy was about 0.21–0.25 (yuan/KWh), 0.230–0.327 (yuan/KWh) [
20,
21,
22,
23]. For the cost value of hydropower and thermal power, the average value of the cost range is 0.23 (yuan/KWh) and 0.27 (yuan/KWh), respectively, and the cost matrix of wind, light, water, and thermal energy is constructed as follows:
5.1.2. Load Forecast Matrix
Select the load forecast value of a power system in a certain place in Guangdong, China, and construct a load forecast matrix:
In the formula:
is the 24-h load value of the load curve, the peak-to-valley difference rate is 55.68%, and each column represents the 8-h load. According to Formula (20), the power difference matrix of the peak, valley load, and base value (average load of 24 h a day) is calculated:
5.2. Simulation Calculation Method
Through the optimization calculation of the combination and output ratio of each subject, the goal of coordinated peak shaving and valley filling auxiliary services of different energy sources is realized, and the proportion of wind power and photovoltaic energy generation is increased. When the output of wind power and photovoltaic energy fluctuates, hydropower and thermal power are the main energy sources to provide load-cut peaks and fill valleys.
(1) During the operation of the energy alliance, there is a multi-scale combination operation mode between different entities, and there are multiple output ratios for different combinations. The change in output ratio directly affects each subject’s Shapely profit value, and the Shapely value of each subject is not unique but found to be with maximum and minimum values. The corresponding auxiliary service cost compensation value for different subjects is the product of the active power output per unit time, the output ratio value, and the unit kWh cost of the subject participating in peak shaving.
(2) Some relevant literature was used to build the model, namely the Formulas (7)–(23) and the basic load data (Formulas (24)–(26)). MATLAB5.3 was used for programming simulation analysis to improve the granularity of dynamic cost accounting and the active power output of each main body. The calculation step of the value and its output ratio combination is 0.1, and the cost allocation value under the multi-scale combination of different energy sources is traversed and calculated. According to the calculation results, the corresponding relationship between the output ratio of each subject under different combinations and the cost allocation limit value (maximum or minimum) of each subject is extracted to make a data simulation diagram (According to the calculation method of this research, there are 30,240 combination schemes for the case. Considering the length of the article, based on the data association cycle change law of the combination scheme, this paper takes 47 combination schemes as examples).
(3) Taking the load peak-valley period division and load forecasting curve in Assumption 3 as the calculation conditions, which facilitate the comparative analysis of the different output ratios of each main body and its corresponding apportionment value, the cost-sharing value under the same time transmission cross section tide of each entity involved in power generation is used as the basis for comparative analysis. The cost allocation value is used as the benchmark for comparative analysis. Due to a large amount of data, 47 sets of associated data were extracted for each subject based on the same benchmark.
5.3. Multi-Scale Portfolio Cost Allocation for Each Subject
5.3.1. Cost Allocation When the Load Peaks
When the load peaks, the power gap is 313.90
. To facilitate the comparative analysis of the joint operation and independent operation, according to the case where each energy source independently meets the power gap, the cost matrix of the non-cooperation of four energy sources is calculated separately and can be obtained by the Formulas (11) and (26):
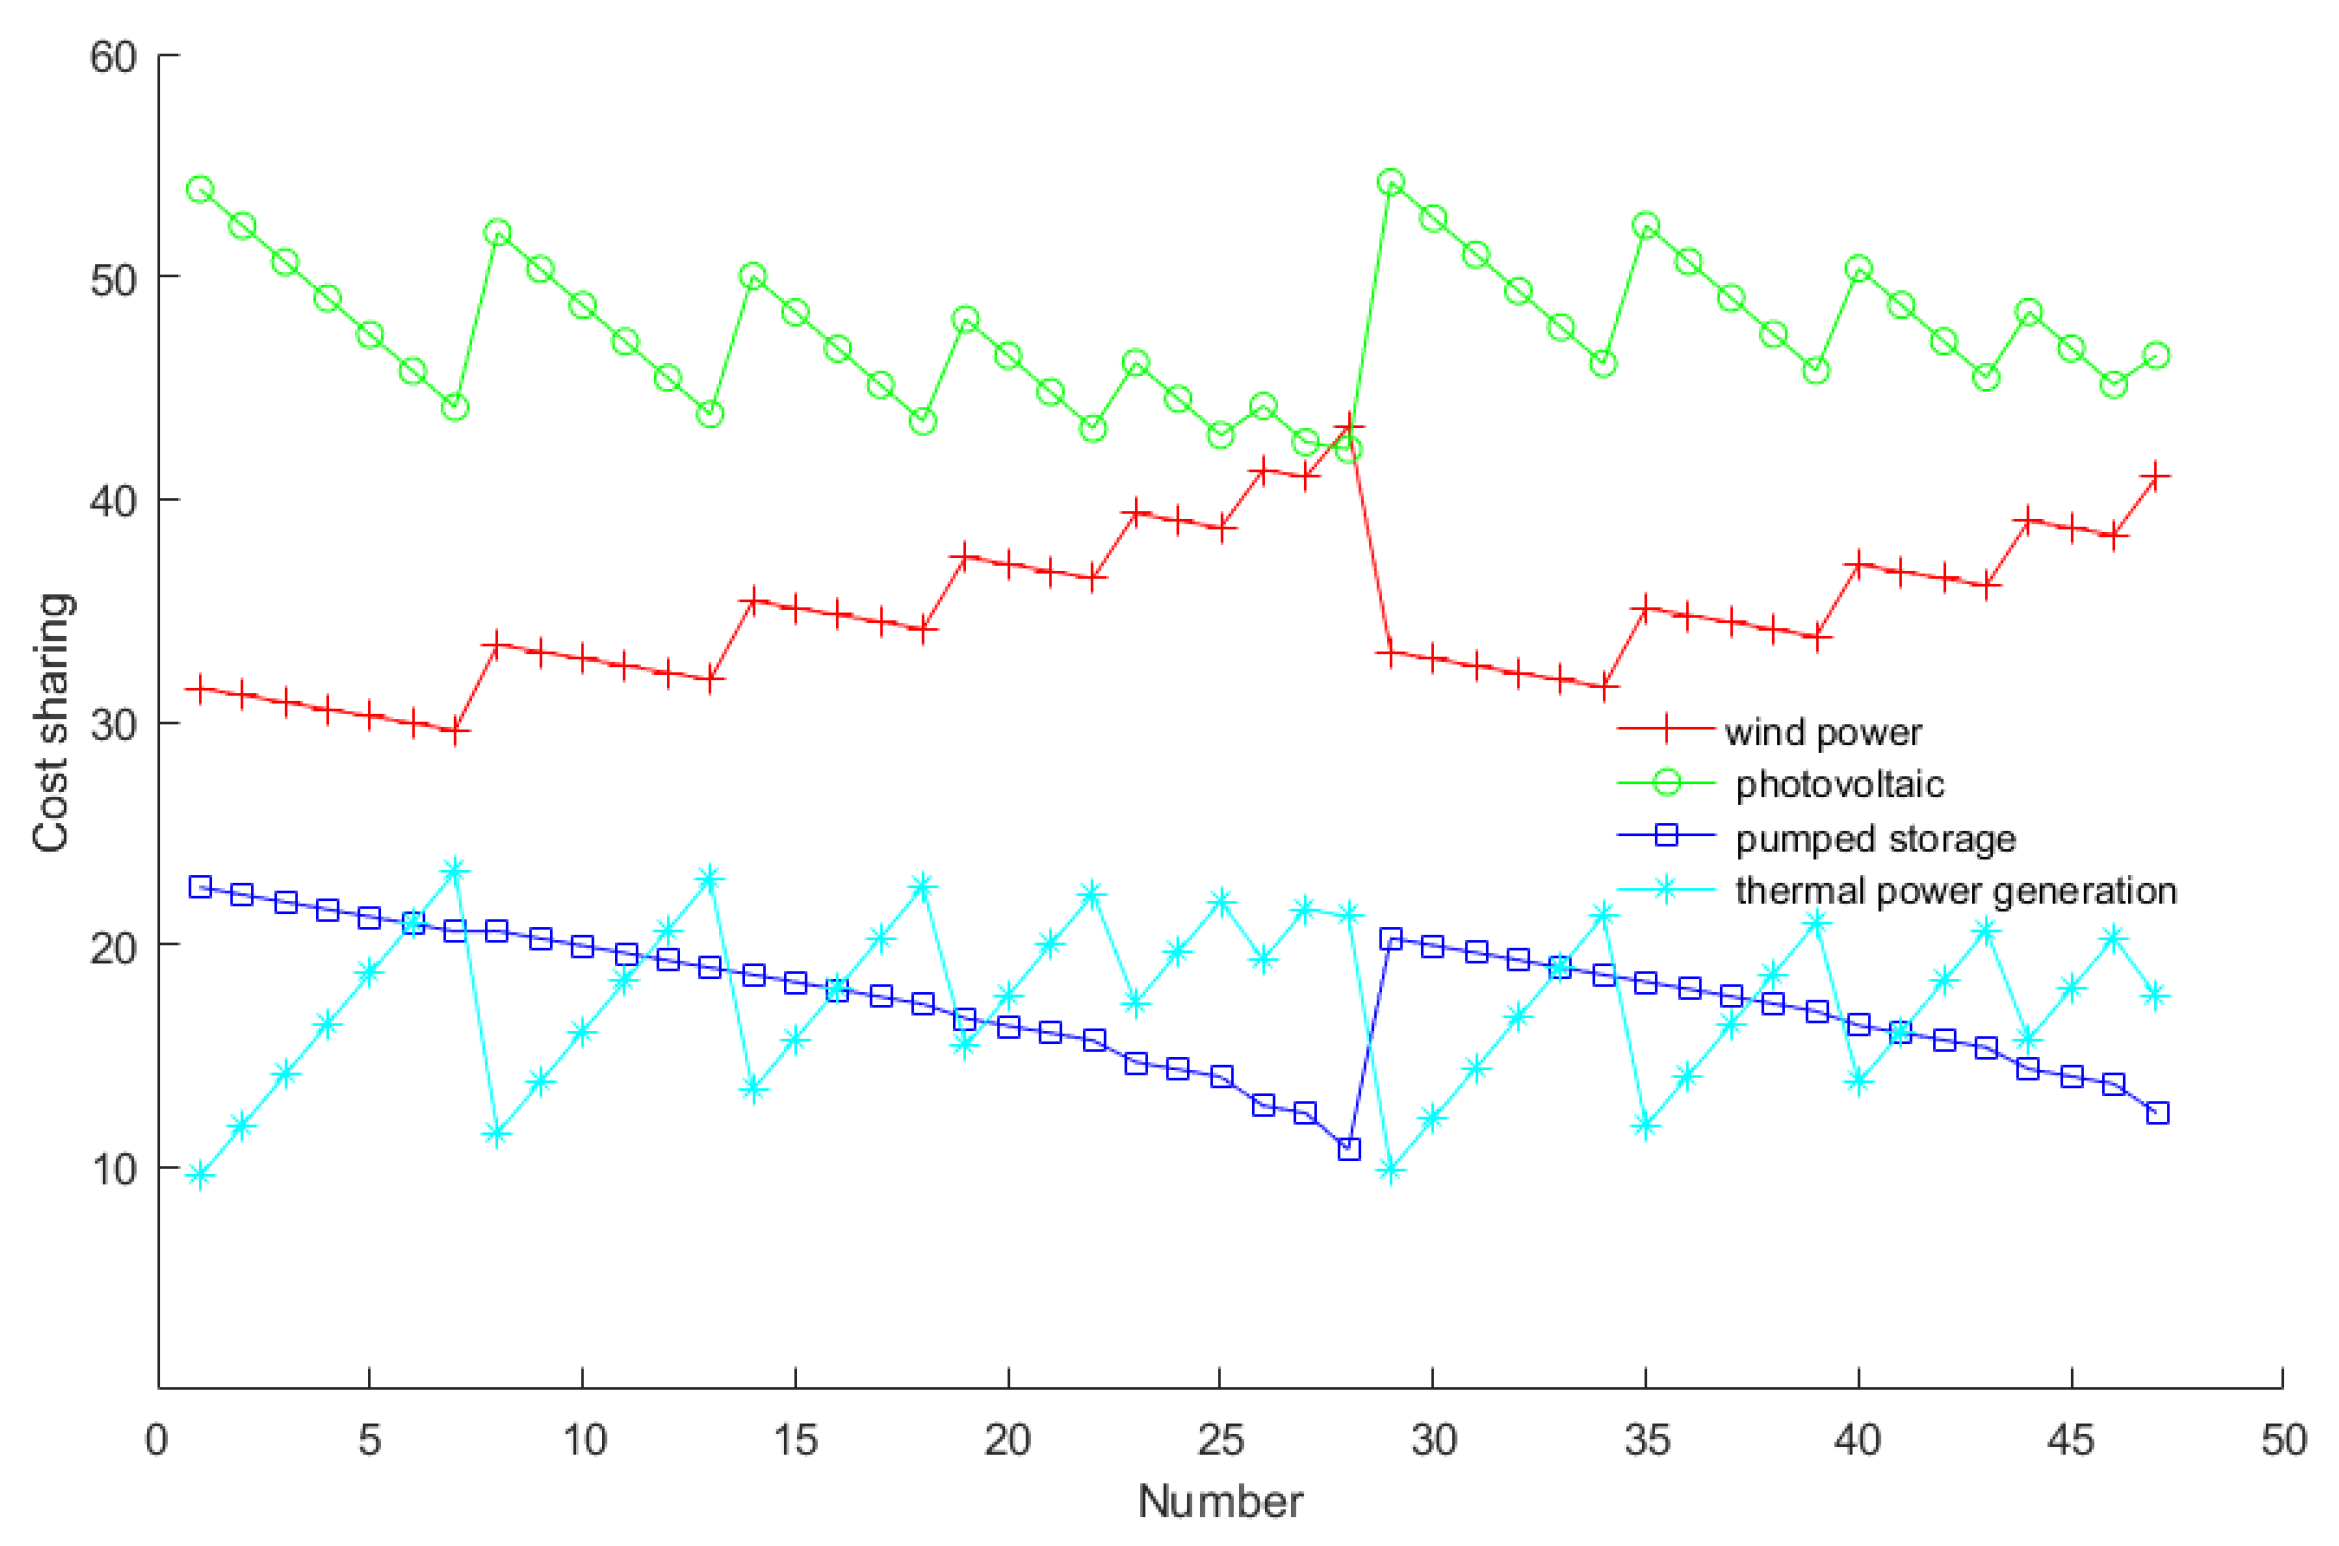
When the four energy sources are combined in multiple scales, the cost allocation is calculated from Formula (12) to Formula (18), as shown in
Figure 1.
As shown in
Figure 1, the cost-sharing value of wind power or photovoltaic energy is relatively larger, and both their dynamic cost change curve values are above the thermal power or hydropower energy. The photovoltaic cost-sharing value is the largest, and its dynamic cost change curve value is at the top. The cost change trends of hydropower, wind power, thermal power, and photovoltaic energy show opposite directions, respectively and are symmetrical. The trend of photovoltaic energy cost changes in opposite directions and is symmetrical. The fluctuation trend in the figure shows that due to the relatively high kWh cost of wind and solar energy (0.478 and 0.52), the multi-scale output ratio of each subject meets a certain power shortage. Under the combination, the cost allocation value is larger. It analyzes the trend of change in the cost value of each subject in the mechanism of operation of the multi-energy alliance. The cost extremum in the alliance operation is compared with the cost in the independent operation (matrix 27). The cost extremum, cost matrix, and output ratio are shown in
Table 1. The data in
Table 1 come from the combination schemes corresponding to the extreme values of each subject in 30,240 combination schemes.
Table 1 shows that each column of the cost matrix’s value is less than that of the corresponding column of the matrix (27), indicating that the four energy sources’ cost decreases after multi-scale cooperation. That is, when the wind power cost is maximum (57.44), its output ratio is small to 0.3 (column 1 of
Table 1), and its wind power cost-sharing value is the largest among all combinations in
Table 1. On the contrary, when the corresponding costs of hydropower and thermal power are the minimum (column 6 and column 8 of
Table 1). The corresponding wind power output ratio is relatively large, 0.6 and 0.5, respectively, but the wind power cost-sharing is higher. It shows that the characteristics of wind power generation can be fully utilized in multi-scale ratio operations to undertake more peak shaving output tasks of the system and achieve a high ratio of wind power energy consumption, but the cost of wind power generation may not be the primary consideration. Comparing the second column of the cost matrix and output ratio vertically, it is discovered that when the photovoltaic cost is the lowest (42.23, column 4 of
Table 1), its corresponding output ratio is the maximum (0.7), which indicates that the photovoltaic energy in the alliance has the optimal benefit in the system peak shaving. When the hydropower cost is the maximum (22.56, the column 5 of
Table 1), the thermal power cost is 9.58, and the corresponding output ratio value is the maximum (0.7), which indicates that the thermal power energy can be fully utilized to participate in the system peak shaving and to stabilize the power system and improve the overall efficiency.
5.3.2. Cost Allocation When the Load Is Low
Under the load valley, the power gap is −339.85
. According to the independent operation, the cost matrix of the non-cooperation of the four energy sources is calculated separately when a single energy source meets the power shortage and can be obtained by the Formulas (11) and (24):
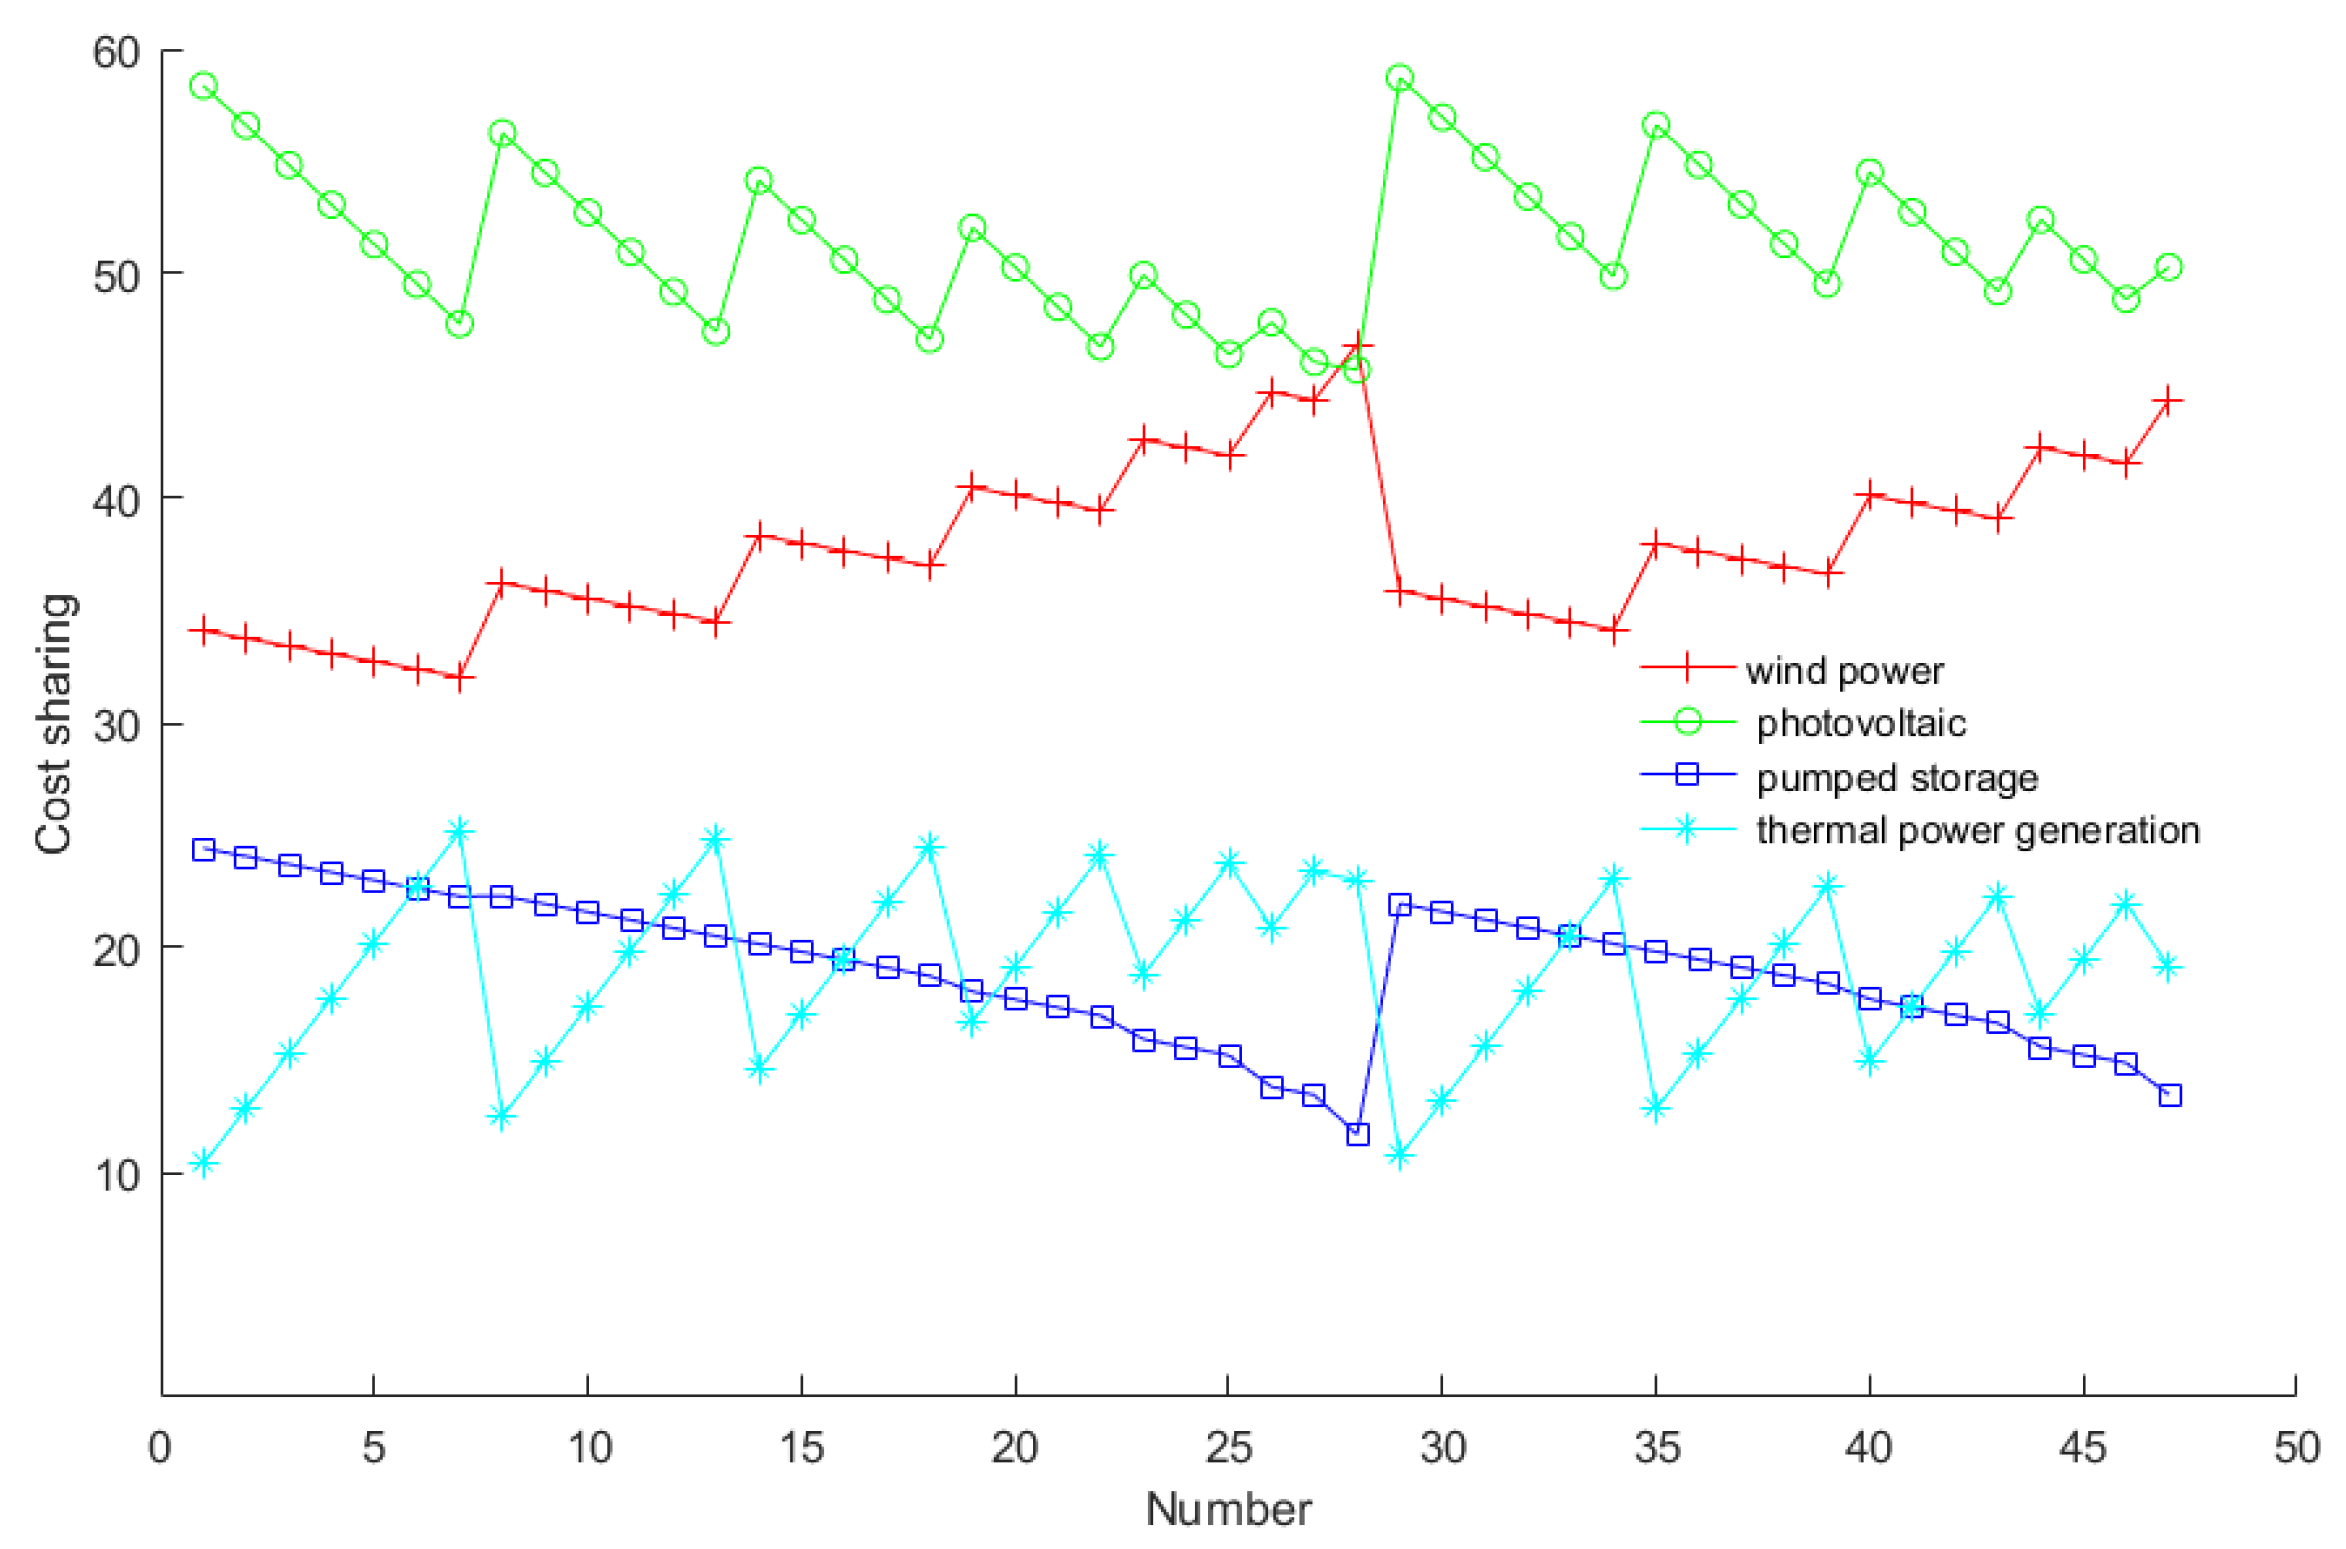
When the four energy sources are combined with various scales, they are calculated by Formula (6) to Formula (12), and the cost allocation is shown in
Figure 2.
Comparing
Figure 1 with
Figure 2, the variation of the cost-sharing values is consistent for the same subjects in different time periods. In the simulation calculation process, the different periods of peak and valley are based on the same proportion of the output, and the iterative calculation is carried out according to the 0.1 step. Therefore, the overall fluctuation trends are similar in both plots. But due to the difference in power shortage during peak or valley operation, the corresponding cost allocation values of each combination are different under different operation modes. It analyzes the trend of change in the cost value of each subject in the mechanism of operation of the multi-energy alliance. The cost extremum of each subject in the alliance operation is compared with the cost of each subject in the independent operation (matrix 28). The cost extremum, cost matrix, and output ratio are shown in
Table 2. The data in
Table 2 comes from the combination schemes corresponding to the extreme values of each subject in 30,240 combination schemes.
The value of each column of the cost matrix in
Table 2 is smaller than the value of the corresponding column of the matrix (28), indicating that after the alliance operates, the cost allocation value of each subject decreases.
When the cost of each subject is the maximum value, the comparative analysis of
Table 1 and
Table 2 shows that the cost of each subject has increased to a certain extent, which is mainly because overall load demand deficit (−339.85) at the valley value is greater than the overall load deficit at the peak value (313.90). Moreover, it shows that the electricity demand decreases when the system is operating at the valley value, and the influence of the intermittent and anti-peak shaving characteristics of wind power and photovoltaic power generation is obvious. At this stage, it is necessary to increase the adjustable reserve capacity of the system.
5.4. Comparison of the Cost of Each Subject in Different Operating Modes of the System
5.4.1. Comparison of Independent or Alliance Operating Costs of Each Entity
When each main body operates independently, and the system operates under different modes (in peak or valley values), the cost of each main body is high and greater than the maximum cost corresponding to the alliance operation (as shown in
Table 1 and
Table 2). Based on
Table 1 and
Table 2, take the maximum cost of each main body as the benchmark, and calculate its cost changes, as shown in
Table 3. It can be seen from
Table 3 that the cost saving of wind power energy is the highest (92.6 at the peak and 100.26 at the valley), and the cost saving of photovoltaic energy (92.59 at the peak and 100.24 at the valley) is close to that of the wind power energy. The cost saving of hydropower energy, however, is relatively low (49.63 at the peak and 53.75 at the valley). The above data show that the cost control of each main body is satisfactory. The unit cost of wind power or photovoltaic energy is relatively high, but the cost can be controlled effectively through the alliance operation.
5.4.2. Cost Allocation When the Load Is Low
Considering the different operating modes (peak or valley) of the Energy Alliance, combined with the data in
Table 1 and
Table 2, the analysis is performed based on the extreme cost of each entity. The changes in the cost of each entity are shown in
Table 4.
(1) Overall changes in the cost and output ratio of each entity
When the cost of each subject is the maximum value, the cost of each subject increases at the valley value. When the cost of each subject is of a minimum value, the cost of wind power or photovoltaic energy increases at the valley value, and only the energy cost of hydropower and thermal power does not change comprehensively comparing the multi-scale combined output ratios of various entities. Only the proportion of thermal power output changes, from 0.3 to 0.2 (Column 2 of
Table 4) and from 0.5 to 0.4 (Column 4 of
Table 4), and the corresponding output ratios of other energy sources have not changed. It can be seen that to maintain a certain output ratio, each entity has increased operating costs (such as photovoltaic energy costs, the increased value is up to −5.84).
By comparing the output ratio of different operation modes and the corresponding extreme value of each subject, the average output ratio of thermal power energy is the largest (peak value is 2.875, valley value is 3.0), which can show that thermal power energy plays a supporting role in the power balance within the alliance and improving the overall efficiency of operation.
(2) Correlation between the output ratio of each entity and the change in cost
When the photovoltaic cost is the smallest (45.73), the corresponding output ratio is 0.7. Compared with
Table 2, the output ratio of the two different operation modes is 0.7. At this time, the minimum cost of photovoltaic energy (45.73–42.23) increases slightly, but due to its cost being the smallest, the output ratio is the largest, and the best profit can still be obtained. When the maximum value of hydropower energy cost is 24.42, compared with the maximum cost of hydropower energy during the peak load operation, the cost of hydropower energy increases slightly (24.42–22.56), indicating that hydropower energy is more involved in the system peak regulation service at this time, which increases the cost. At the same time, the output ratio of thermal power energy is the maximum value of 0.7, and the combination of pumped storage energy and thermal power energy can be used to maintain the stability of the system and improve its overall efficiency. When the load is at the valley of the peak value, the minimum value of the hydropower energy cost-sharing value is 0.00, and the corresponding output ratio is 0.1. Therefore, pumped storage can be used to store water resources at a certain period of time corresponding to a small hydropower cost value so as to prepare for the adjustment of system power generation capacity.
5.5. Multi-Energy Alliance Portfolio Cost-Sharing Equilibrium Analysis
A total number of 47 data sets in the peak load period are selected as a case analysis to verify the equilibrium effect of Shapley value on alliance portfolio cost allocation. According to Formulas (19)–(23), the dispersion coefficient of different combination cost allocation equilibrium values and the dispersion coefficient of combination cost fluctuation in the peak load period are calculated (
Appendix A Table A3). Combined with Schedule 3 calculation data and analysis in 3.3. Considering the maximum, minimum, and intermediate values of the discrete coefficients of different combinations, the differences are compared and analyzed (as shown in
Table 5). Load peak hours, the analysis of
Table 5 is as follows:
(1) The maximum combination discrete coefficient is 0.562 (the corresponding combination number is 29), and the corresponding photovoltaic cost allocation maximum is 52.24. The high cost of photovoltaic power generation affects the enthusiasm of photovoltaic power generation to participate in the operation. The overall balance of the alliance is poor.
(2) When the minimum value of the combined dispersion coefficient is 0.310 (combination number is 7), the corresponding wind power and photovoltaic power generation costs are 29.61 and 44.11, respectively. The costs of wind and photovoltaic power generation are the lowest in
Table 3. Combination 7 has a small discrete coefficient and good alliance stability. However, the proportion of wind power and photovoltaic output is 0.1, and the overall proportion of new energy output is low. At the same time, the discrete coefficient of combined cost fluctuation (9.846) is relatively high in
Table 3. Affect the stability of the operation of the alliance.
(3) According to Formula (22), the median of the combined discrete coefficient values in
Appendix A Table A3 is obtained (the discrete coefficient value is 0.439), and the corresponding combination is 32. The ratio of wind power and photovoltaic output is 0.2 and 0.1, respectively (
Table 5). The overall output proportion of new energy is small. The discrete coefficient of Combination 46 in
Appendix A Table A3 is 0.436, which is close to the median of the discrete coefficient of 0.439. The output ratios of wind power and photovoltaic in Combination 46 are 0.2 and 0.4, respectively. The overall new energy generation ratio is 0.6. Although the cost fluctuation dispersion coefficient of combination 46 (6.854) is greater than the corresponding value of combination 32 (4.133), it is less than the corresponding value of the minimum value of the combination dispersion coefficient (combination 7) (9.846). To achieve the goal of promoting a high proportion of new energy, we realize the effective support of a multi-energy alliance mode for the new energy power system. Therefore, the 46th combination scheme can be adopted after a comprehensive balance.
6. Comprehensive Discussion
(1) Based on the dynamic output contribution of each subject and its output ratio, as well as the dynamic Shapley equilibrium cost allocation calculation, the data can be used to analyze the combination mode corresponding to the maximum output ratio of photo-voltaic or wind power when the load is at peak or valley value. Comparing
Table 2 and
Table 3 reveals that when the cost of photovoltaic power generation is lowest (42.23, 45.73), the corresponding output ratio is 0.7, and when the cost of hydropower (0.00) and the cost of thermal power (0.01) are lowest, the corresponding output ratio is 0.7. The proportion of wind power output is, respectively, 0.6% and 0.5%. According to the actual load characteristics, auxiliary service support requirements, and power generation characteristics of relevant subjects, a corresponding combination mode can be adopted to increase the proportion of new energy power generation. The selection of the combination optimization mode of the multi-energy alliance can be based on the bidding situation of the electricity market, and the method proposed in this paper can be used to calculate the dynamic cost equilibrium allocation to develop a particular combination strategy.
(2) Alliance operation and system under different operating modes, the cost of each subject has decreased, but the cost change is distinct, primarily due to the following three influencing factors: the first one is attributable to differences in the cost of the main unit of electricity. The second one is to improve the overall efficiency of the alliance; the proportion of each output varies based on the multi-energy complementary and system peak shaving and valley filling power balance mode. The third is the primary participant in the system’s power shortage output ratio and associated unit power cost support effect.
(3) Each subject’s dynamic cost change trend in
Figure 1 and
Figure 2 exhibits a symmetrical characteristic. There are differences in the increase or decrease of each subject’s cost data change, and there is interactive support between the complementary operation of energy with different power generation characteristics and the cost of power generation. The different output ratios of each subject and the internal cost-sharing balance adjustment mechanism can facilitate optimal decision-making for the alliance’s benefit as a whole.
(4) There are differences between the research results based on hypotheses 1 through 4 and their actual application, primarily in the following areas: Firstly, the overall power shortage model based on the system directly affects the accuracy of the cost calculation results of each subject. That is, the output distribution and cost variation of each subject based on real-time power demand are different from this study. Second, the effect of the primary frequency regulation function of the photovoltaic or wind power generation system on the cost-sharing and the change in output ratio of each main body during actual operation has not been taken into account. Thirdly, the power generation cost and auxiliary service income of each main body have not been combined for the calculation to optimize the alliance’s operation strategy.
(5) The case data in this paper are 47 component cost data based on the load peak and valley periods in Assumption 3. It provides a research paradigm for the selection of a multi-energy alliance combination optimization mode. During the real-time electricity market transaction, the multi-energy alliance can be simulated to balance the 24-point dynamic load demand values, and the dynamic equilibrium cost sharing can be calculated to determine the generation power, generation ratio, and optimal generation portfolio scheme under the multi-space-time scales of each main body.
7. Conclusions
(1) Using the multi-scale dynamic cost equilibrium sharing model of the alliance presented in the paper, precise dynamic cost sharing values and the multi-scale dynamic cost data based on each main body can be obtained, providing the basis for the multi-scale optimal portfolio of each main body and its power generation output decision. The survey results indicate that the operation mechanism of a multi-energy alliance can effectively increase the proportion of new energy power generation within the alliance, thereby facilitating the stable operation of the new energy power system. (2) Using actual data, the correlation mechanism between output values, output proportions, and cost-sharing equilibrium values of various subjects in a multi-energy alliance is examined. The applicability and scalability of the Shapley value method in the dynamic optimization of cost control and product distribution for each subject are demonstrated. (3) Basis on the variation law of load demand and dynamic cost data of each subject, the adjustment of the output ratio of each subject can optimize the energy generation structure, effectively improve the overall efficiency of the alliance and realize the balance of interests of each subject. This method can provide a reference for the scheduling optimization decision of multi-energy alliances.
The next work of this paper consists primarily of the following two aspects: (1) Considering the overall power shortage mode of the system, the energy supply and demand are balanced. This method affects the accuracy of each subject cost calculation results to some extent. Considering the time-varying characteristics of the load and meeting the real-time power demand, the accurate calculation of the output allocation and dynamic cost allocation of the main bodies of the alliance is focused. (2) In this paper, the internal collaborative optimization operation mechanism of the alliance is summarized through the actual case data change rules. However, the differentiation and robustness of corresponding data changes under different load peak-valley difference operation modes need to be further studied. To further clarify the general applicability of this study program.

