Article

Research on Influencing Factors of Urban Road Traffic Casualties through Support Vector Machine

1
Transportation and Logistics Engineering College, Shandong Jiaotong University, Jinan 250357, China
2
Shandong Key Laboratory of Smart Transportation (Preparation), Jinan 250357, China
3
Traffic Administration of Shandong Public Security Department, Jinan 250031, China
*
Author to whom correspondence should be addressed.
Sustainability 2022, 14(23), 16203; https://doi.org/10.3390/su142316203
Submission received: 31 October 2022 / Revised: 28 November 2022 / Accepted: 1 December 2022 / Published: 5 December 2022

Abstract

:
Urban road traffic safety has always been vital in transportation research. This paper analyzed the factors influencing the degree of traffic accident casualties on Jinan Jingshi Road and its branch roads, taking them as the study area for urban road traffic safety problems. Additionally, it used the application of Particle Swarm Optimization (PSO), a Support Vector Machine (SVM) model, and a recursive feature elimination (RFE) to rank the contribution degree of the influencing factors. The results showed that driving on rainy days has a high probability of casualties, while the type of collision was a minimum influence factor. Additionally, on rainy days, cars were accident-prone road vehicles, and 8:00–12:00 and 18:00–22:00 were accident-prone periods. Based on the results, preventive measures were further put forward regarding the driver, road drainage capacity, policy management, and autopilot technology. This study aimed to guide urban traffic safety planning and provide a basis for developing traffic safety measures.

1. Introduction

Reducing road traffic accidents has always been the primary work in traffic safety management. With the rapid increase in urban motorization, China’s vehicle ownership rate has also multiplied in recent years. However, at the same time, it has also led to an increase in the number of urban road traffic accidents and a high number of casualties, with an average annual growth rate of 5.6% [1], which threatens people’s lives and property. Many scholars have analyzed many aspects and put forward solutions to reduce the occurrence of traffic accidents and the degree of casualties. For example, the construction of roundabouts can alleviate urban traffic pressure, and the combination of vortex roundabouts and automatic vehicles ensures better safety conditions [2]. In addition, roundabouts are more conducive to driver’s traffic safety analysis [3]. The development of autonomous driving technology also contributes to the reduction of road traffic accident rates. Related research showed that a greater penetration rate of autonomous vehicles in traffic flow would ensure a more stable traffic flow and a lower risk [4]. Moreover, the penetration rate of autonomous driving can also optimize the average speed, delay of road traffic flow, and the safety performance of mixed traffic flow [5,6].
In addition to improving road infrastructure and using automated driving technology to improve urban road safety and reduce casualties, some scholars have studied the influencing factors of road traffic accidents and formulated countermeasures for critical influencing factors to minimize losses. This paper analyzed the traffic accidents occurring on Jinan Jingshi Road and its branch roads in Jinnan city from 2020 to 2021. PSO and SVM-RFE models were used to screen the accident data to determine critical influencing factors of urban road traffic accidents and further provide preventive strategies for road traffic safety.

2. Literature Review

Usually, influencing factors of traffic accidents include people, vehicles, road environment, and management. Many studies have also proven this conclusion [7,8]. The influence degree of various factors on road traffic accidents shows different proportions. Scholars who study this also hold different findings. Some scholars believe that roads and people are more important factors for road traffic accidents. For example, Meng et al. [9] listed in detail that the phenomena of travelers running red lights, roads being slippery, and the drivers’ inattentiveness are the main factors leading to traffic accidents. Moslem et al. [10] showed that drivers are essential in avoiding traffic accidents and established the Best-Worst Method (BWM) with a Triangular Fuzzy Set Ensemble to provide road drivers’ most critical behavioral factors at different levels. Jeong and Lqbal [11,12] emphasized that human factors affected road traffic accidents and improved citizens’ awareness of traffic safety. In addition, driving behaviors also play a vital role in traffic accidents. Some studies took road traffic safety entropy (RTSE) as the main index and concluded that the place where abnormal driving behavior occurs is consistent with traffic accidents [13]. Zhang et al. [14] noted that the road alignment of opposite lane isolation mode and traffic participants other than drivers are the influencing factors that cannot be ignored in road traffic accidents.
Some studies were more inclined to the influence of environmental changes on road traffic accidents. Initially, a study by Li [15] noted that drivers would be affected by the environment in the case of traffic congestion, which leads to more radical reaction behavior and reduces the awareness of safe driving, which hurts urban road traffic safety. However, some studies noted that the severity of road traffic accidents would increase under poor lighting conditions and bad weather conditions [16]. However, in a study by He, it was noted that the greater the traffic volume on a two-way six-lane urban road, the longer the accident duration, the more lanes occupied, and the greater severity and influence range of the accident [17].
Aside from the four major factors of people, vehicles, road environment, and management, some scholars have also studied other influencing factors. Some studies showed that the accident location’s upstream and downstream speed significantly influenced accident severity [18]. Popularizing public transportation modes and adjusting parking space resources [19] were also methods used to reduce traffic accident casualties to achieve the purpose of sustainable development of urban traffic. Cai et al. [20] explored the association rules between the risk factors of urban road traffic accidents by improving the Apriori algorithm, which assisted in formulating relevant traffic control measures. Additionally, the choice of traffic mode has a particular influence on the form of urban road traffic accidents [21]. In addition, the connection strength between different regions was also an important factor affecting the occurrence of cross-regional traffic accidents [7].
In addition, collision accidents are a hot spot in urban road traffic accidents, and many scholars have studied and discussed this kind of accident. For example, some scholars calculated the collision probability of roads per hour and thought that real-time weather, road surface, and traffic conditions greatly influence collision accidents [22]. Zeng [23] found that the significant influencing factors of collision accidents include driver type, seasonal traffic volume, and collision type. Additionally, the factors affecting the threshold of vehicle collision level include vehicle type, seasonal period, weather conditions, traffic volume composition, and so on. Additionally, the occurrence probability of collision was higher under the conditions of stopping or slowing down of the first car, road speed limit exceeding 80 km/h, summer, and the number of lanes exceeding two [24].
In studying influencing factors of road traffic accidents, many scholars not only learn the influence of elements but also constantly bring forth new methods for analyzing influencing factors, striving for a more comprehensive and accurate analysis scope. In the early days, Zhang [25] used the Waikato environment for knowledge analysis (Weka), analysis of moment structure (Amos), and other software to determine the path coefficient and influence degree among the influencing factors of urban road traffic safety. Additionally, this scholar held that the order of influencing factors of urban road traffic safety is people, environment, management, and vehicles. In addition, Santos et al. [26] noted that the rule-based C5.0 algorithm model could accurately detect the most relevant factors of road traffic accident severity. The stochastic forest model could also obtain good results in studying the influencing factors of urban road traffic accidents [27].
To sum up, scholars at home and abroad have made some achievements in their research on the influencing factors of urban road traffic accidents. Still, most scholars focused on the drivers, road conditions, etc., and the analysis of influencing factors is not comprehensive enough. Therefore, in building the model, this paper classified the factors such as vehicle collision type, location, and weather as input variables and used PSO to search for the optimal parameters. According to the optimal parameters, SVM-RFE was set to obtain the influencing factors of urban road traffic accident casualties. The importance ranking is determined to determine the critical influencing factors.

3. Data

3.1. Data Sources

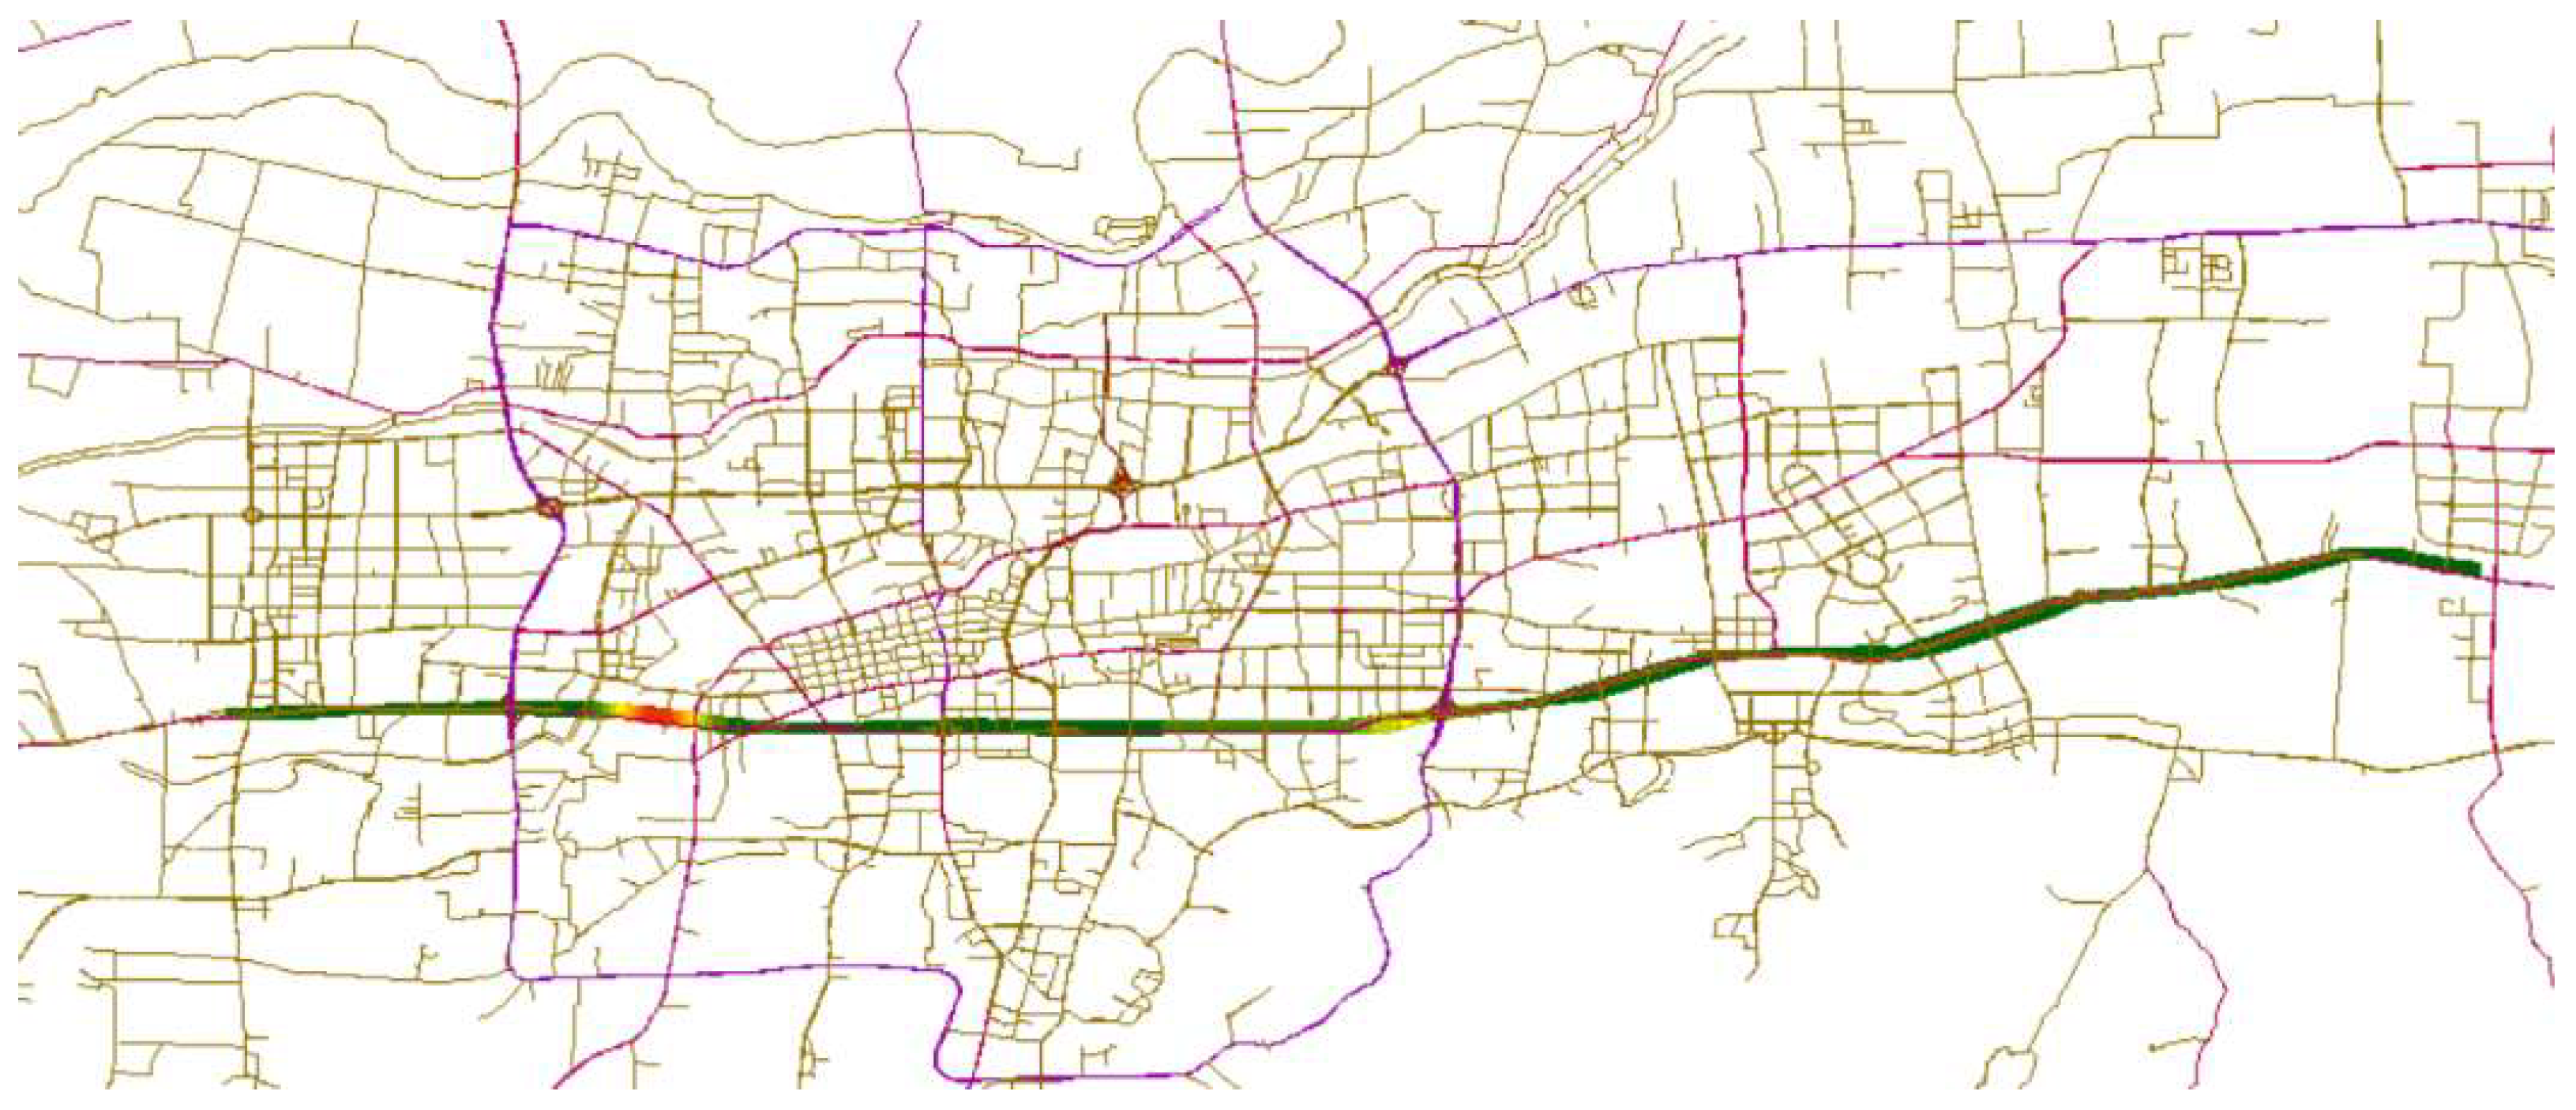
This paper’s urban traffic accident data were selected from the traffic accident data of Jingshi Road and its branch roads in Jinan city from 2020 to 2021, with 1572 traffic accidents. The raw accident data include information such as accident time, accident location, accident model, and weather. Jingshi Road, the main urban road in Jinan, can be analyzed as a typical urban road. Jingshi Road starts from Xingcun Overpass in the east and ends at Zheshang Building in the west, with a length of about 29 km, a road width of 60 m, six lanes in both directions, and a design speed of 80 km/h. At the same time, it connects with 18 secondary roads. The road terrain is shown in Figure 1. In this study, traffic accidents on this road section were divided into two categories, according to the number of casualties: minor and severe. Among them, there were 990 minor and 582 severe accidents. Table 1 shows the details of accident classification.
As seen in Table 1, severe accidents had two categories. The definition of the first category was that the number of injured people reached 1–2, and the number of such accidents was 548. The definition of the second category was that the number of wounded people was three or the number of deaths reached one, and the number of such accidents was 34. Among them, the number of severe accidents in the second category was only one-thirtieth of minor accidents. Compared with the first type of severe accidents, the former accounts for one-sixteenth of the latter, so the number of the second type of severe accidents only accounted for a tiny part of the total traffic accidents, and it had little impact on the following feature ranking. In addition, if a three-classifier is set, three binary classifiers are formed in a one-to-many manner, and the training sets and the test sets are randomly divided according to a certain proportion to conduct SVM classification. Since the number of severe accidents in the second category was only 34, its number was small, resulting in the final training set (or test set) of this type of accident having an accuracy of zero or one hundred, which significantly affected the prediction accuracy of the entire classification model. Therefore, these traffic accidents were incorporated into severe accidents.

3.2. Feature Screening

In this paper, six factors influencing urban road traffic accidents are extracted from the statistical data of traffic accidents, including season, time, type of collision, accident location, weather, and vehicle type, to analyze the degree of casualties in traffic accidents. Table 2 shows the number and proportion of accidents in each case.

3.3. Data Processing

Twenty-three subfeatures in Table 3 were encoded with dummy variables for data processing.

4. Instance Verification

4.1. Model Construction

This study used the libSVM toolbox in Matlab to build the SVM model. The SVM model is a generalized linear classifier for binary data classification in the supervised learning method. It is given input data and a learning objective in the classification problem X = { x 1 , , x N } , Y = { y 1 , , y N } , where each sample of input data constitutes the feature space, X i = { x 1 , , x n } x , and the learning objective is a binary variable y { 1 , 1 } , representing positive class and negative class, and the original data of the two types are separated by the optimal hyperplane.
The objective function and constraints of the support vector machine are as follows:
min 1 2 | | ω | | 2 + C i = 1 n ξ i , i = 1 , , n
s . t . , y i ( ω T x i + b ) 1 ξ i , i = 1 , , n
In these formulas, C is the penalty parameter, which is used to control the weight between two items in the objective function, ξ i is the slack variable, which is the allowable deviation of the corresponding data point x i from the separated interface, and ξ i is more significant than zero.
In constructing the SVM kernel function, the twenty-three subfactors screened out according to the traffic accident data of Jingshi Road are used as input variables. The number of samples was randomly divided into a training set and a test set in the proportion of 7:3. According to the Jingshi Road traffic accident data, the sample size in the feature space was inseparable. Hence, this article used the radial basis function (RBF) to map the feature space to the high-dimensional feature space to find the optimal hyperplane.
The radial basis function equation is shown in the following equation [28]:
K ( x , x i ) = exp ( γ × | | x x i | | 2 )
The kernel decision function formula:
f ( x ) = sgn [ i = 1 n a i y i K ( x i x ) + b ]
In the process of SVM model training, the k-fold cross-validation (K-CV) method was selected to verify the model. The specific steps of K-CV are: Firstly, divide the total sample into k parts randomly, take one of them as the test set evaluation model and the rest of the k − 1 parts as the training set training model, and repeat this step k times. Each time, take a different subset as the test set. Finally obtain k other models and k scores. The performance of K models was integrated to evaluate the advantages and disadvantages of the model in the current problem, and the model with the best evaluation effect was selected as the verification model. In this paper, the K-CV fold was set as three folds. Then, the particle swarm search method was used to search for excellent nuclear parameters and select the optimal parameter combination.
The basic formulas of the particle swarm search are as follows:
v i = v i + c 1 × r a n d ( ) × ( p b e s t i x i ) + c 2 × r a n d ( ) × ( g b e s t i x i )
x i = x i + v i
In these formulas, vi is the speed of the particle, rand() is a random number between (0, 1), xi is the current position of the particle, c1 and c2 are the learning factors, p b e s t i is the individual optimal solution, and g b e s t i is the optimal global solution.
In addition to the above two standard formulas, the particle swarm also introduces an inertia factor, namely w; the formula is as follows:
v i = ω × v i + c 1 × r a n d ( ) × ( p b e s t 1 x i ) + c 2 × r a n d ( ) × ( g b e s t 1 x i )
After the introduction of w, w can change linearly in the process of PSO search, or it can change dynamically according to a specific measure function of PSO performance to obtain a better optimization effect than a fixed value.
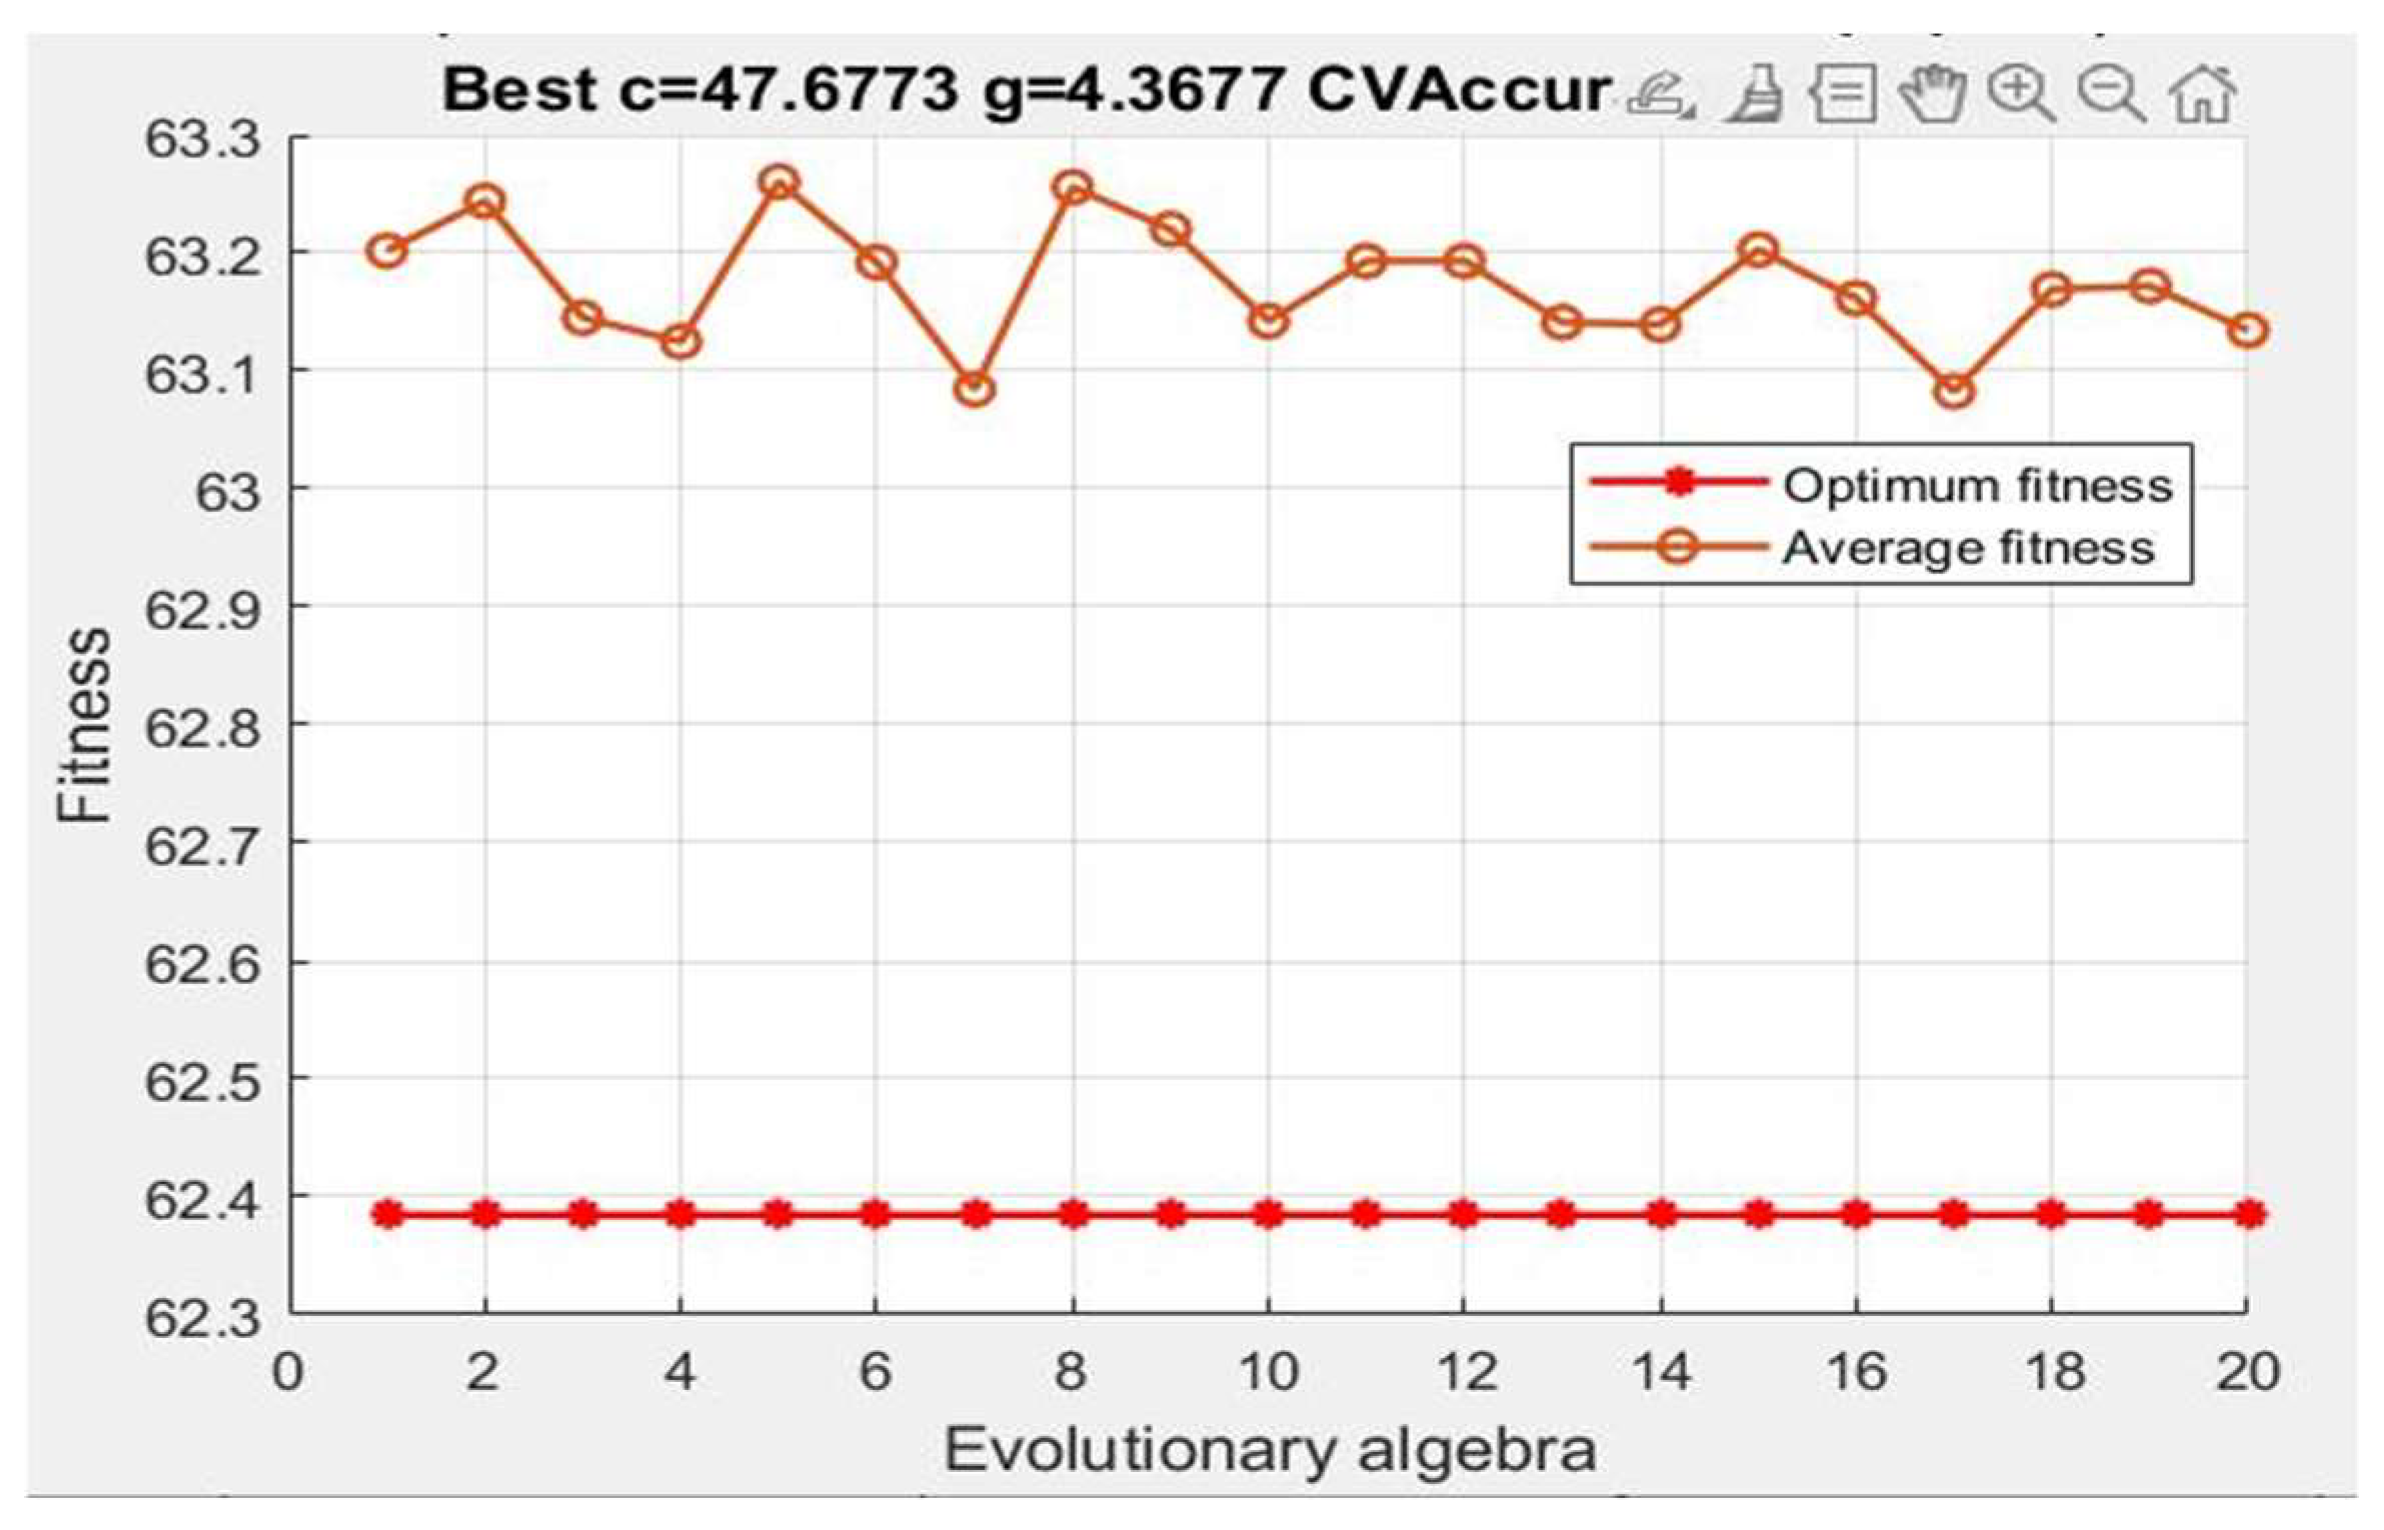
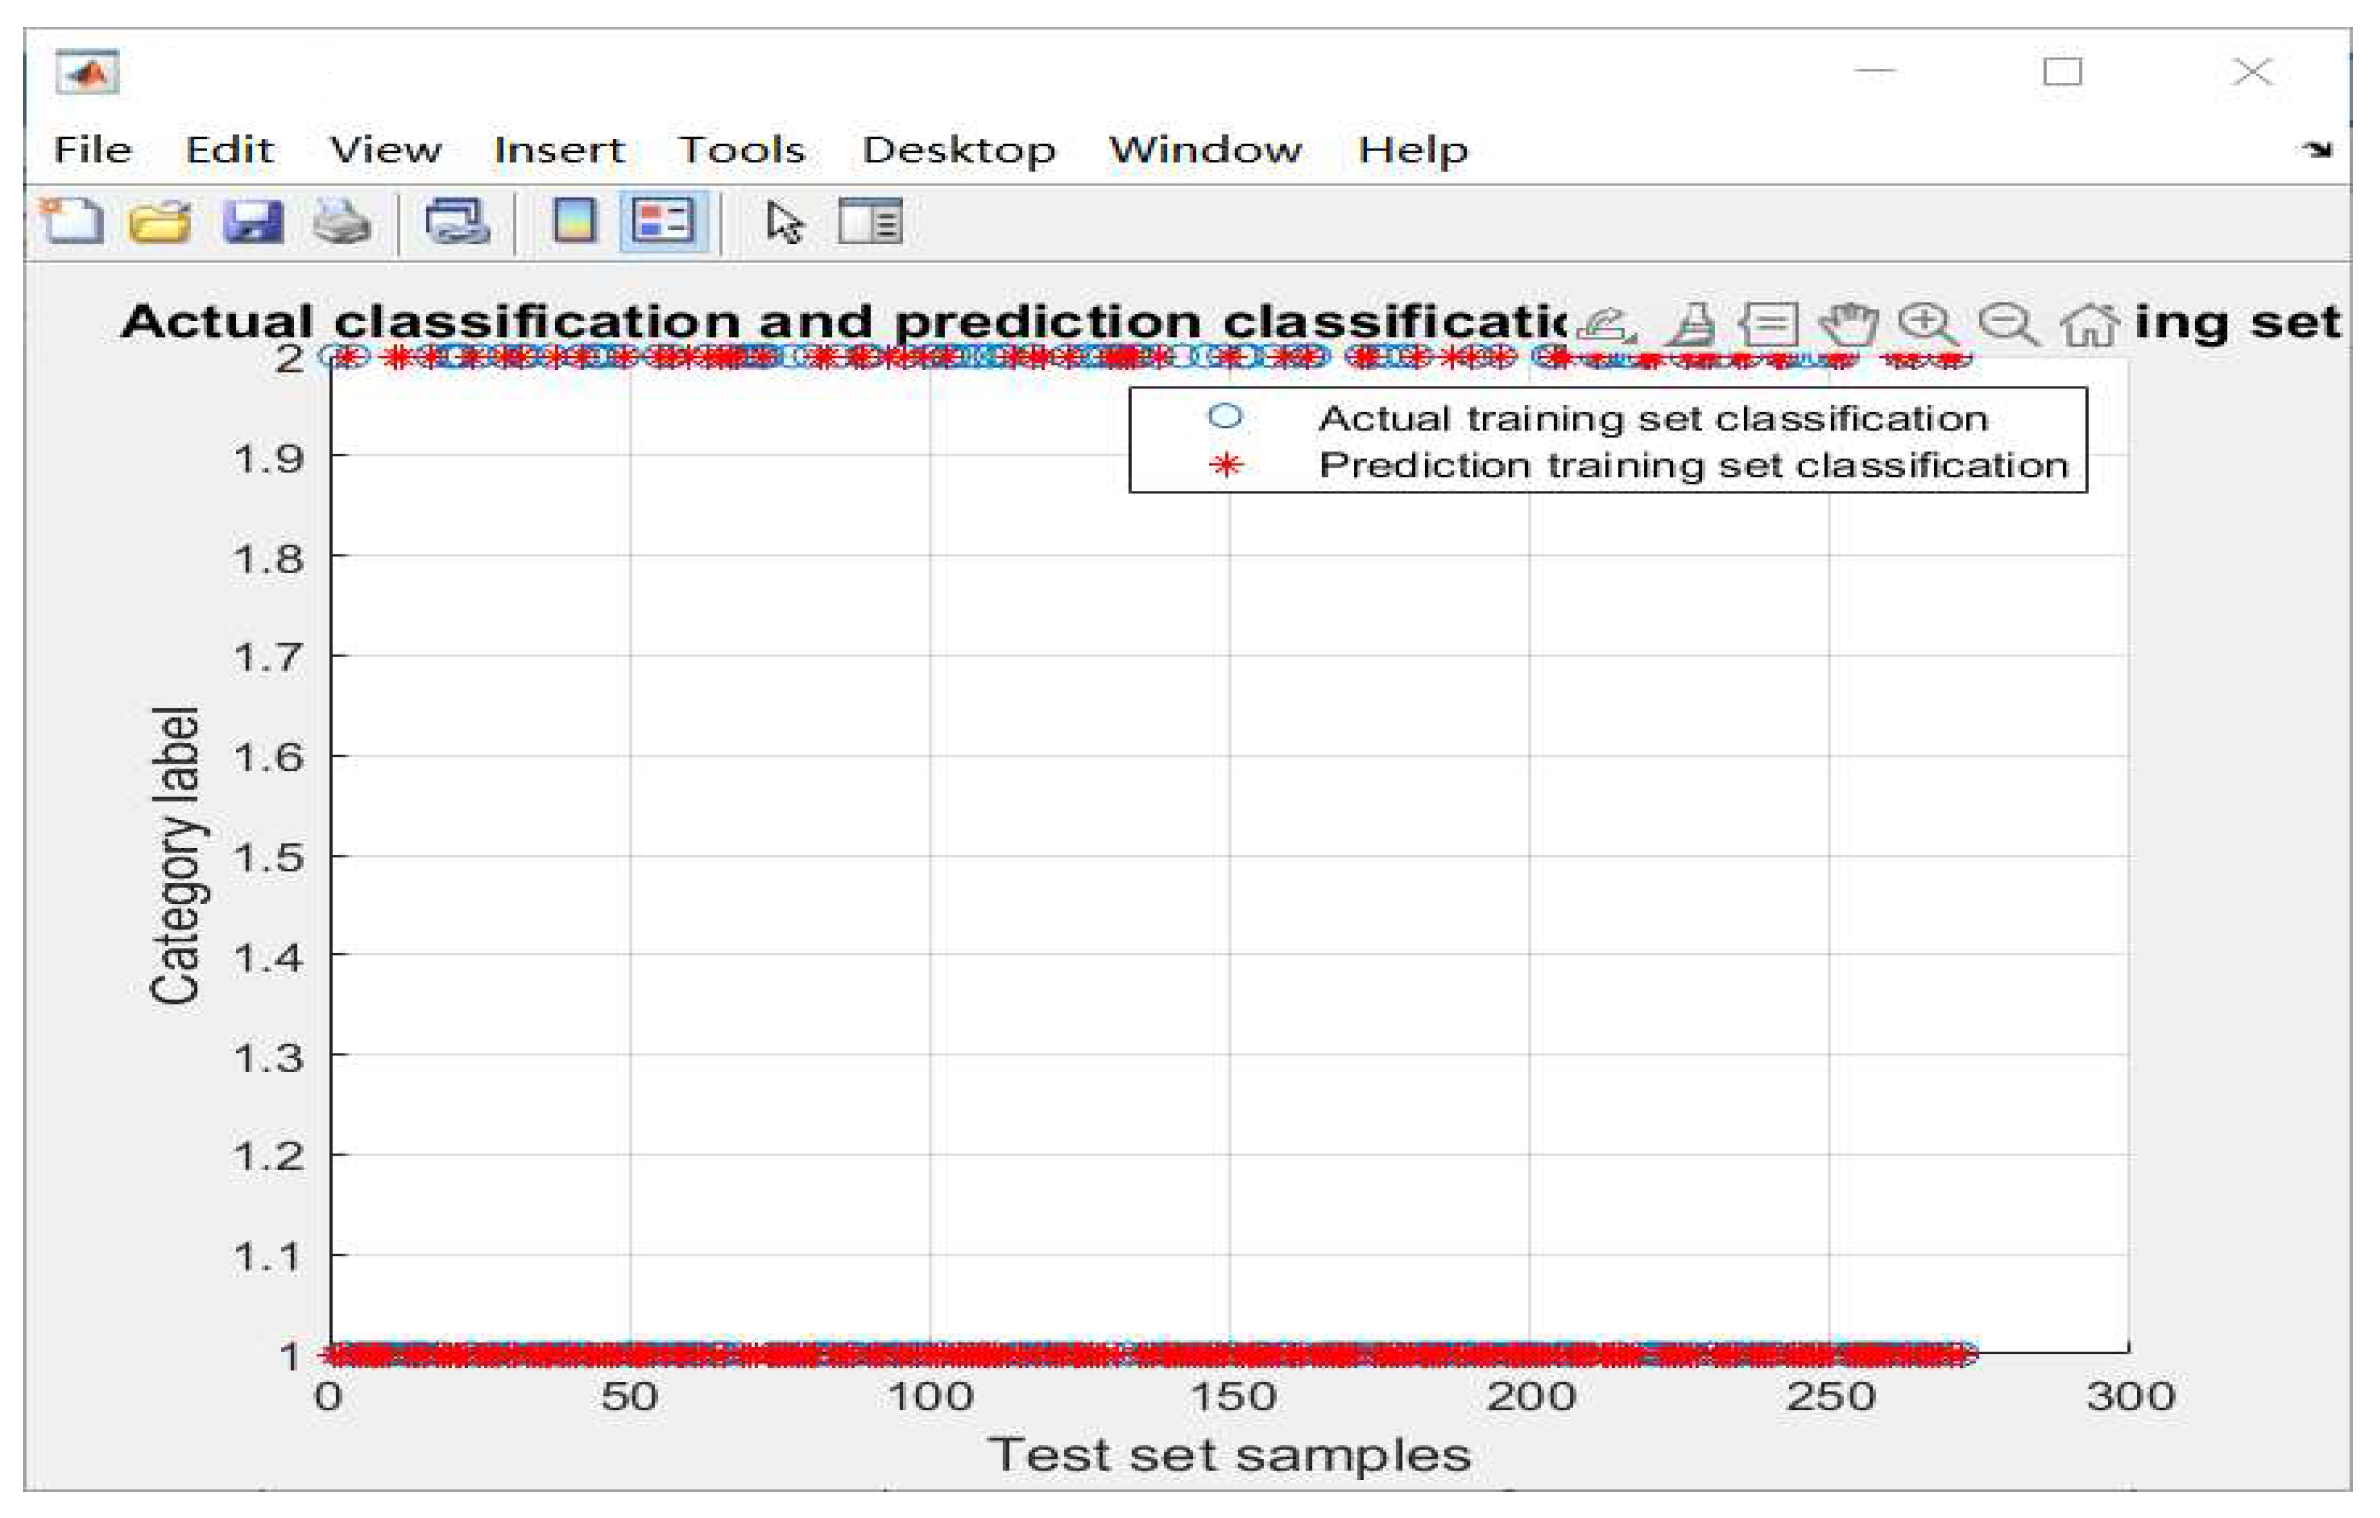
In this paper, the particle swarm parameters are all set as general values, that is, c1 = c2 = 2, the initial value of w was set as 0.9 [29], and the selection range of c and γ was 2−8~28. After repeated debugging, the optimal parameter combination g = 4.3677 of the kernel function and penalty parameter C = 47.6773 were finally determined (Figure 2, Figure 3 and Figure 4).
As seen in Table 4, the accuracy of the training set and test set for minor accidents was higher than that of severe accidents. This phenomenon occurred because the number of minor accidents (990 cases) was about twice that of serious accidents (582 cases), which made the former more conducive to model training and testing, thus resulting in a reduction in the accuracy of the training set and test set of serious accident types. The accuracy of the training set was 74.9%, the accuracy of the test set was 69.1%, and the overall accuracy was about 70%. The specific reason was that some types of data accounted for too many samples, leading to a high probability of selecting this type in the model cross-validation, which was not conducive to sample classification and led to an accuracy of the model remaining of about 70%.
The classification accuracy of the model is as follows:
Table 4. Model accuracy.
Training Set AccuracyTest Set Accuracy
Minor accident75.5%73.7%
Serious accident73.4%54.0%
Entirety74.9%69.1%

4.2. SVM-RFE Sorting

After the SVM model completes the classification, RFE ranks the importance of features representing subfactors. SVM-RFE is a sequential backward selection algorithm based on the maximum interval principle of SVM.
The basic steps are as follows:
Train SVM on the initial feature set;
Formulate the weight vector and feature ranking according to the following formulas:
ω i = i = 1 N α i y i x i 2
c i = ω i 2
Find the features with the lowest ranking and exclude them;
Update the feature data set, and N = N − 1;
Repeat the above steps until the data set is empty.
Input the C and g obtained above into the SVM-RFE model. SVM-RFE selects a subfeature with the lowest contribution weight to the overall SVM through each iteration and obtains the importance ranking of all subfeatures through multiple iterations, as shown in Table 5.

4.3. Discussion

Table 5 shows that summer was the most likely to cause casualties in the four seasons. The probability of losses caused by traffic accidents in spring was the smallest, and the possibility of deaths caused by traffic accidents in autumn and winter was in the middle. In hot and humid environments, drivers are prone to irritability, listlessness, inattention, and other emotions during driving, which constitute a significant potential safety hazard. Secondly, drivers are more susceptible to emotional control and rash judgment in a hot and dry environment. So, drivers should be careful to take proper rest to avoid fatigue while driving in summer and maintain their emotional stability. Because of the high temperatures in summer, many abnormalities can occur during the driving process, such as spontaneous combustion of tires, oil pipe bursts, etc. Therefore, it is necessary to strictly implement the relevant vehicle maintenance rules and regulations in summer, especially for passenger vehicles and dangerous chemical transport vehicles. In addition, the high temperatures in summer will make the pavement asphalt soften, which hurts vehicle braking performance. Therefore, it is vital for regular inspection and maintenance of road surfaces in summer.
Regarding time, Table 5 shows that traffic accidents were more likely to cause casualties during daytime hours. Compared with other types of roads, roads with urban traffic flow adapts to the tidal phenomenon, and traffic outflows are concentrated during commuting. Because of the enormous traffic base during the day, the incidence of traffic accidents is higher, and the probability of casualties is higher.
Table 5 shows that traffic accidents between moving and stationary vehicles were more likely to cause casualties in accidental collisions. This phenomenon occurs because stationary vehicle drivers need time to start and react before and during clashes. Drivers who are unskilled or insensitive in operation will need a longer operation time, which increases the possibility of vehicle collision and casualties. The probability of losses caused by traffic accidents between people and vehicles is the smallest. That is because the traffic control measures of urban roads are more detailed, and drivers will pay more attention to pedestrians in the driving process because of the influence of the driving environment, which reduces the occurrence of collision accidents between people and vehicles.
The analysis of the accident location from Table 5 concluded that casualties were more likely to occur when traffic accidents occurred on main roads. The main reason is that China’s current urban trunk road speed limit value-setting standard system has not been developed to perfection. Usually, the design speed is the speed limit standard. The difference between the design and operating speed has not been considered. Moreover, the road capacity will improve significantly due to the upgrading of urban road infrastructure. At this time, if the design speed is still taken as the road speed limit value without synchronous adjustment, the speeding phenomenon of some sections in good running condition and without monitoring will seriously threaten traffic safety. Additionally, the wonder of low-speed driving on the monitored road section will lead to traffic congestion and a waste of road resources, which improve the probability of traffic accidents on the main road. Therefore, in the urban road speed limit setting, the whole urban trunk road can be divided into several sections according to the different road alignments. Particular areas with significant changes in road alignment and road environment can be distinguished from the general roads. The speed limit value can be set according to the situation of the section. It is important to compare and adjust the speed limit value of each road section and set up a reasonable speed limit transition zone between different road sections [30]. In addition, it can be seen from Table 5 that the possibility of casualties in traffic accidents near buildings was minimal. When pedestrians or vehicles pass near buildings, these buildings obstruct their sight, so they cannot make judgments and are more alert and less likely to engage in impulsive behaviors.
In the judgment of weather influencing factors, Table 5 showed that traffic accidents were more likely to cause casualties on rainy days. Factors such as slippery ground, low visibility, and the interference of rain sound are critical factors that induce traffic accidents on rainy days. See Section 4.4 for a detailed analysis. Traffic accidents in foggy weather have the lowest probability of casualties. When driving in foggy weather, drivers are usually more vigilant. They pay more attention to changes in the driving environment, especially on roads with complex changes.
As seen in Table 5, traffic accidents between nonmotor and motor vehicles were the most likely to cause casualties among vehicle types. Mainly because compared with motor vehicles, nonmotor vehicles generally have the characteristics of relatively high speed, greater flexibility, and inconvenience in control and interference sensitivity, and their own violation cost is lower. Rider protection measures and vehicle performance are generally in a weak position. When two types of vehicles collide, the possibility of casualties from nonmotor cars is high. Moreover, some nonmotor vehicle riders lack safety awareness and often take dangerous driving behaviors according to their wishes. For example, nonmotor vehicles often share lanes with motor vehicles, leading to poor traffic order, declining road traffic efficiency, and frequent collisions between two cars. Such accidents often cause more casualties and property losses. It is necessary to strengthen road control and realize the time–space isolation of intensive conflict sets (such as setting nonbarriers for signal lights, etc.) to reduce accidents. In addition, diversified traffic safety, civilized travel propaganda, and traffic-emergency behavioral education can be carried out according to different age groups of traffic participants [31]. In addition, it can be seen from Table 5 that the possibility of casualties between nonmotor vehicles was the smallest because the power of nonmotor vehicles is insufficient, the speed is not fast, and the nonmotor cars are generally small in size. They could operate flexibly to avoid accidents effectively.

4.4. Analysis of Traffic Accidents on Rainy Days

It is known from the above that traffic accidents on rainy days were the most likely to cause casualties. Therefore, this study analyzed the distribution of traffic accidents on rainy days and formulated preventive measures according to the analysis results.

4.4.1. Characteristics Analysis of Accidents on Rainy Days

  • Vehicle type distribution of traffic accidents on rainy days
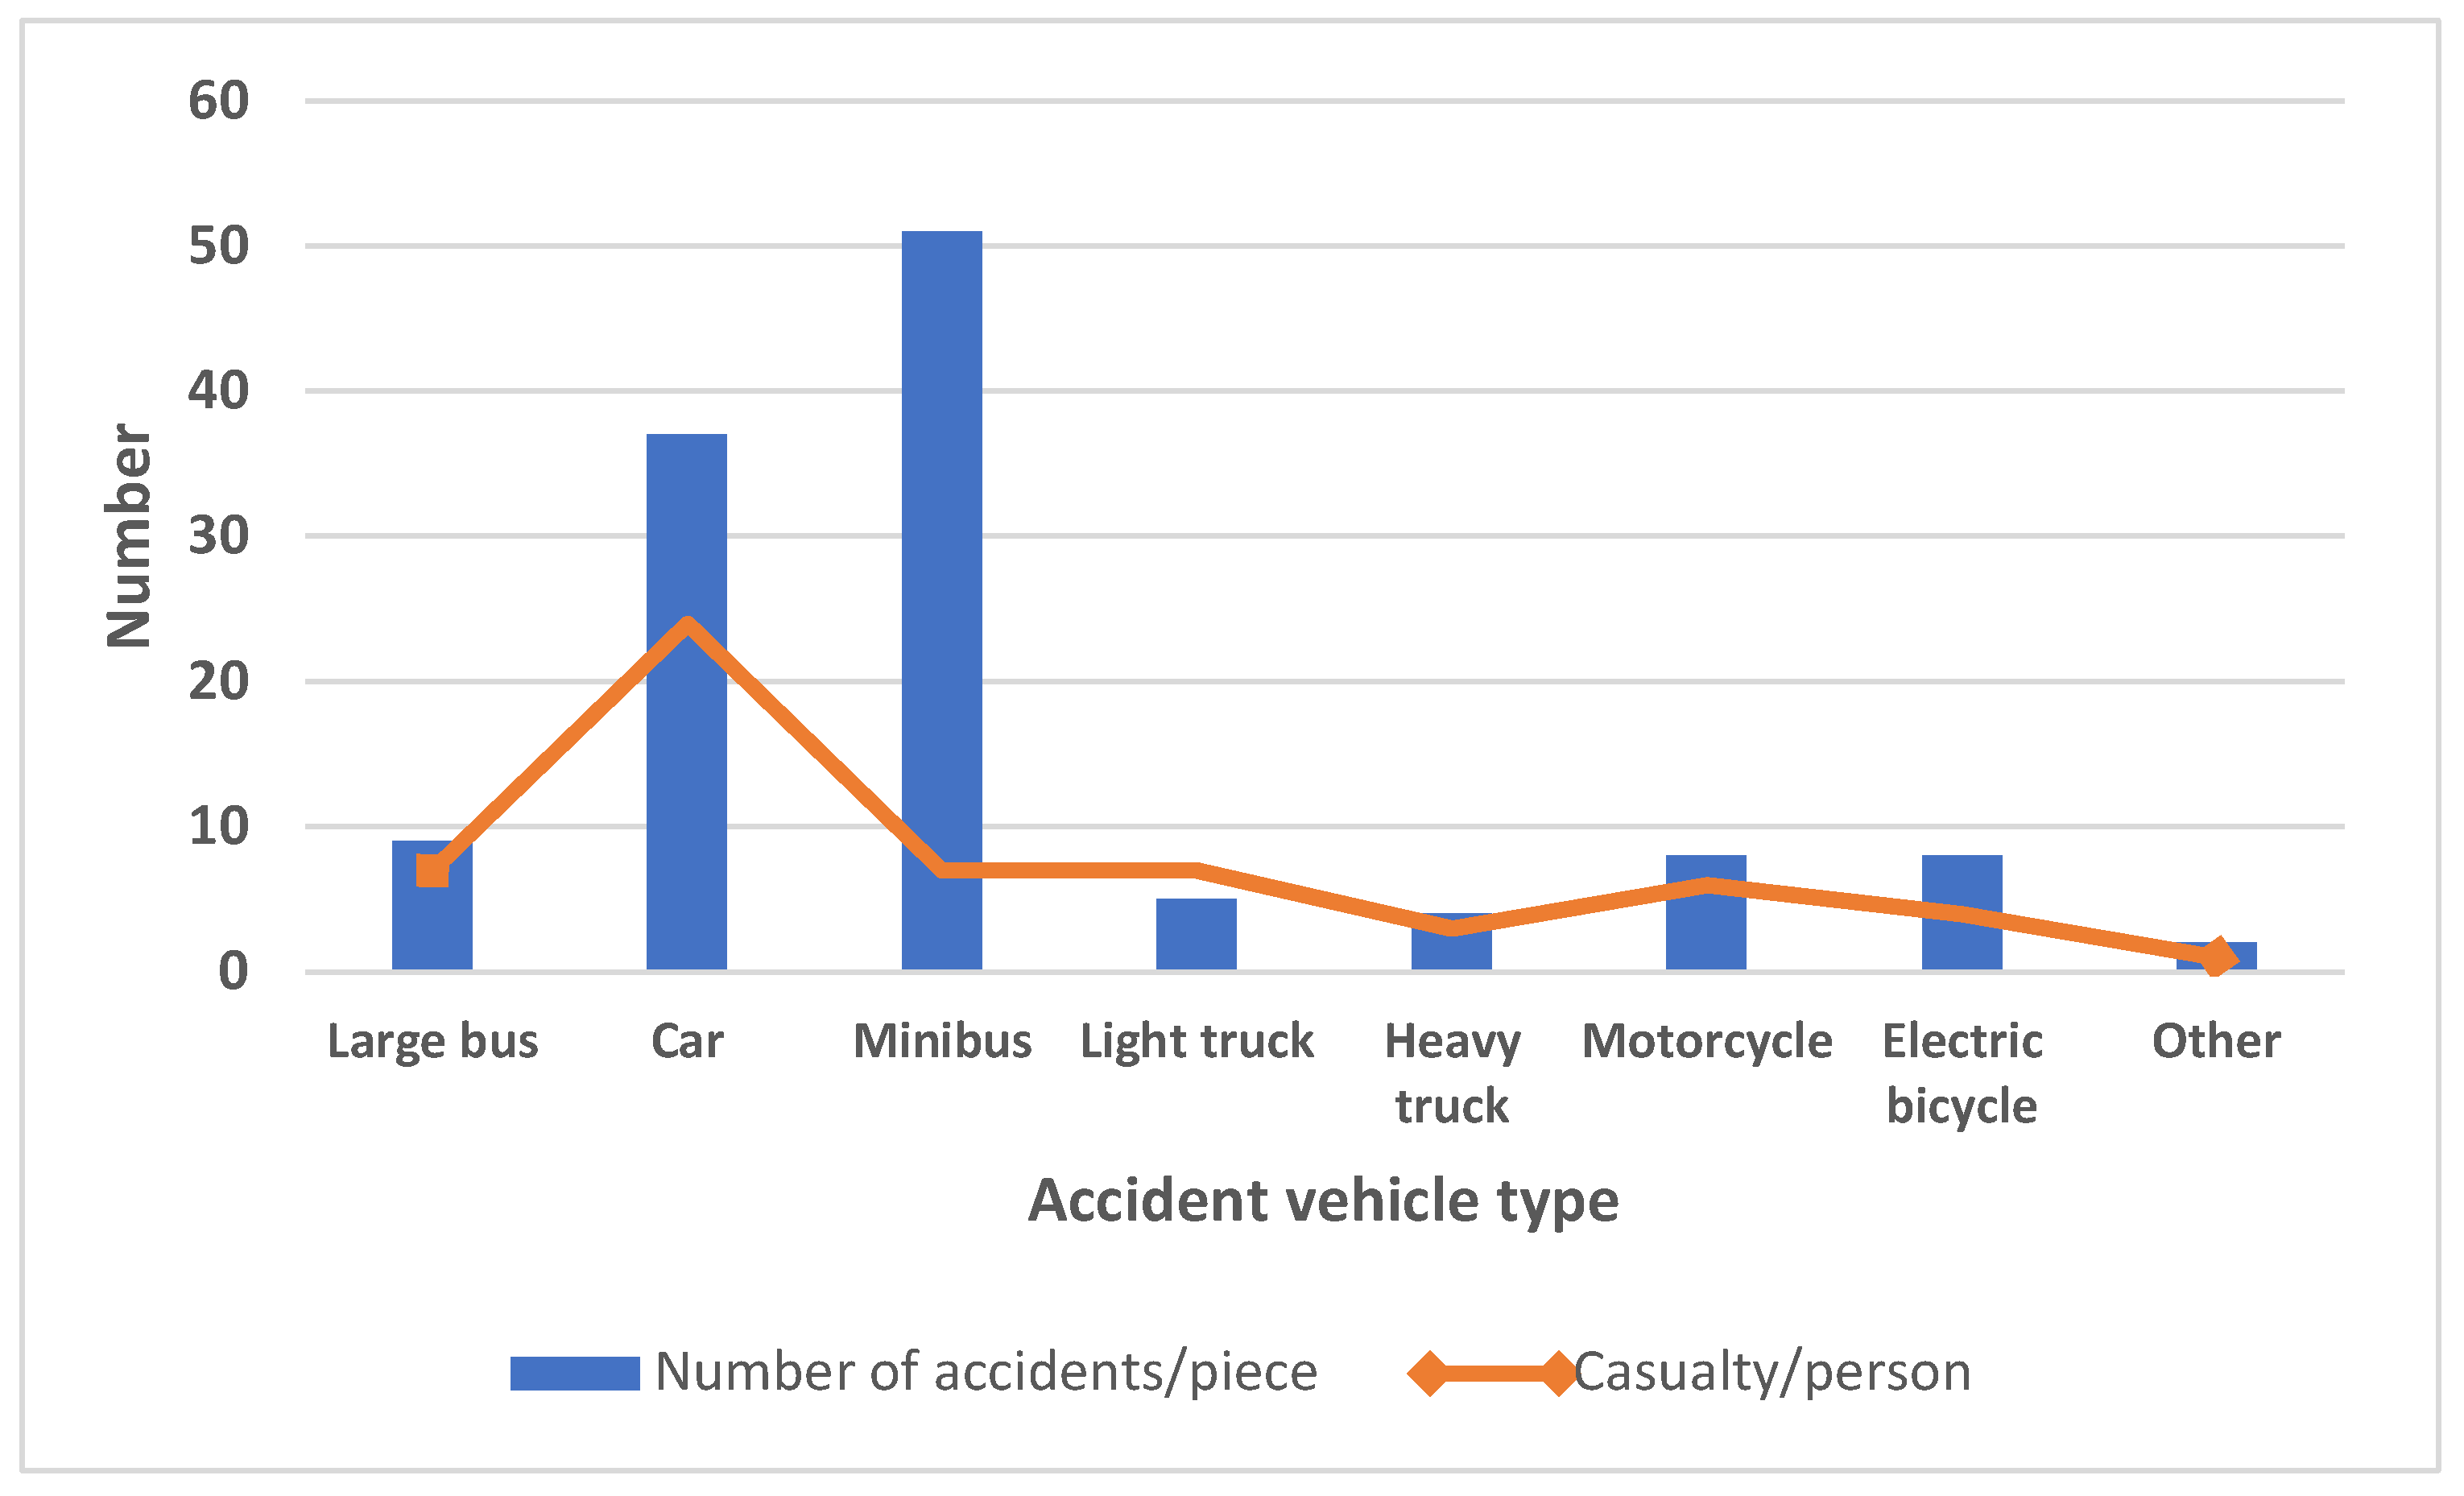
One hundred twenty-four traffic accidents on rainy days were screened out from the traffic accident data of Jingshi Road in Jinan city from 2020 to 2021. The vehicle types distribution of traffic accidents on rainy days is shown in Figure 5.
As shown in Table 6, cars and minibuses were vehicle types that caused accidents easily on rainy days. The number of accidents for minibuses accounted for 41%, and the number for cars accounted for 30%. This phenomenon was related to the composition of traffic flow. In the traffic flow of urban roads, the proportion of minibuses and cars is high, leading to these two models frequently becoming involved in traffic accidents. Additionally, in the case of heavy rain, the drainage of some urban roads is insufficient. There will be a water film between the road surface and the tire, which reduces the friction between the road surface and the tires. Therefore, the “water skiing” phenomenon will occur when the vehicle speed is too fast, resulting in more traffic accidents. The number of casualties in “car” accidents was 24, a ratio of 64.9% to the number of accidents; the number of casualties in “minibus” accidents was 7, with a balance of 13.8%. The latter casualty rate is much lower than the former [32]. The reason is that compared to car drivers, minibus drivers have higher driving skills and safety awareness and better emergency handling capabilities for accidents, reducing the number of accident casualties. Combined with the number of accidents and casualties, the car was the most likely to cause casualties on rainy city roads.
2.
Grade distribution of traffic accidents on rainy days
According to relevant traffic accident regulations, rainy traffic accidents were divided into minor, general, and significant.
It can be seen in Table 7 that the number of minor accidents was the largest among traffic accidents on rainy days, accounting for 32.3%. This phenomenon is because the selected road section was the urban road. Compared with other types of roads, urban roads have a relatively complete traffic infrastructure and a lower speed limit, thus reducing the severity of traffic accidents. In addition, Table 6 presents that the types of vehicles with frequent traffic accidents on rainy days were cars and minibuses. The impact range of the accident is easy to control when these two types of vehicles have a traffic accident, reducing the severity of the casualties.
3.
Time distribution of traffic accidents on rainy days
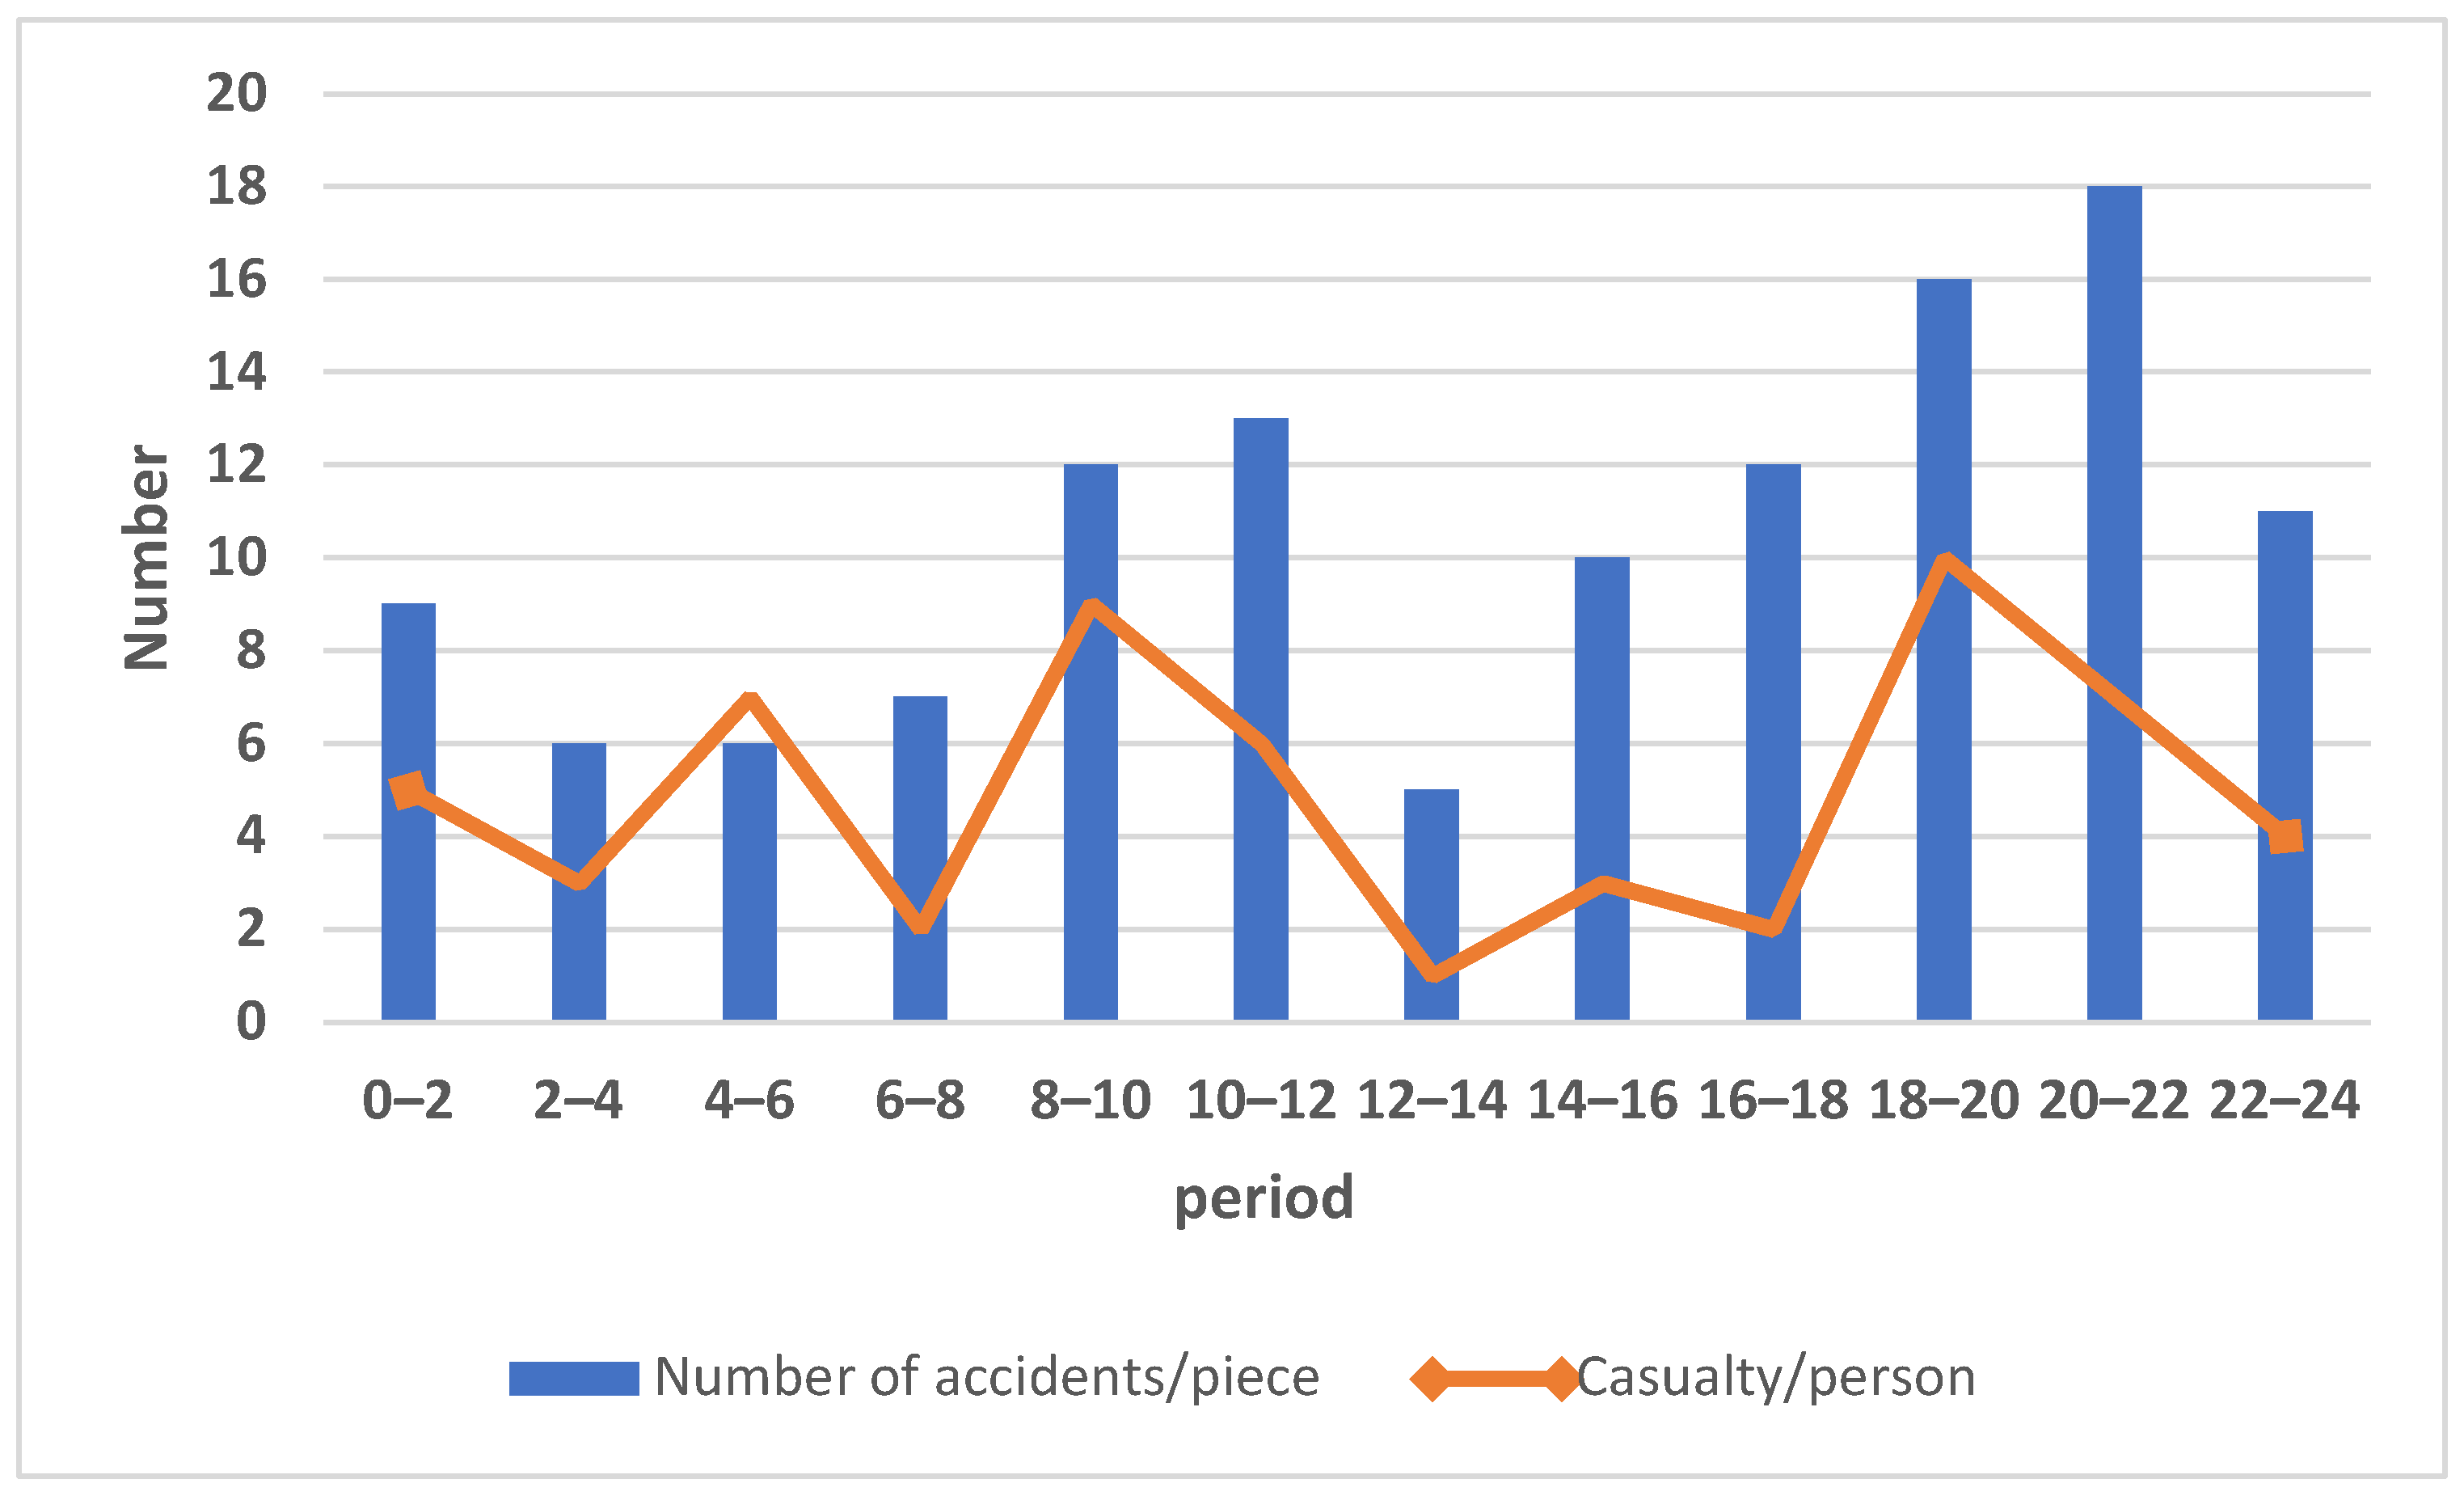
It can be seen in Table 8 that the periods of frequent accidents on rainy days were 8:00–12:00 and 18:00–22:00. The number of accidents accounted for 20.2% and 27.4% of the total number of rainy day accidents in 2020 and 2021, respectively. Fewer vehicles and pedestrians are on the road during this period than during the peak period, and the freedom of cars and pedestrians increases. The traffic police are also slightly less strict during this period. At the same time, the rain interferes with the drivers’ vision. The above reasons will ultimately increase the potential for accidents. Casualties mainly occurred during the periods of 4:00–6:00, 8:00–10:00, and 18:00–20:00. The number of casualties within 8:00–12:00 and 18:00–22:00 accounted for 25.4% and 28.8% of rainy day accident casualties, respectively. According to the above, these two time periods were also accident-prone periods on rainy days. Deaths between 4:00–6:00 accounted for 11.9% of rain-related accident casualties. As the period is early in the morning, vehicles and pedestrians are sparse, vehicles are free and fast, and the impact of the vehicles in the event of an accident is more significant, resulting in more severe accident casualties. From the above analysis, we can see that 8:00–12:00 and 18:00–22:00 were the most likely times to lead to traffic accidents with casualties (Figure 6).

4.4.2. Cause of Accidents on Rainy Days

  • Interference effect of rainy days on drivers
The wiper can only keep the vehicle windshield clear and ensure the drivers’ front line of sight when driving in rainy weather, which leads to the drivers’ poor judgments on the side of the vehicle. After rainfall, dirty water will accumulate on the road, covering the road markings and signs and therefore causing the driver to make a misjudgment. The rain curtain and noise caused by rainfall will affect the drivers’ sight distance and judgment ability when heavy rain occurs.
2.
Influence of road-surface-gathered water
As mentioned above, ponding will form on the road after rainfall. When driving, the water between the vehicle tires and the road surface cannot be eliminated. The water will also exert pressure on the tire when the vehicles impose stress on the road surface, which causes a layer of a water film between the two. The appearance of water film will reduce road friction and the grip effect. Therefore, the possibility of the vehicle going out of control will increase when the cars adopt sharp braking and turning. In rainstorm weather, excessive water accumulation will appear on the road. There may be water in the exhaust pipe or brake friction plate when the vehicle passes through the ponding section, which will lead to the dangerous situation of vehicle ignition failure or brake failure, and further increase the probability of traffic accidents.
3.
Increase in vehicle braking distance
As mentioned in 2, rainy weather would reduce road friction and adhesion coefficient, leading to a change in vehicle braking distance. The braking distance formula is:
L = V 2 254 × ( φ + i )
where V is the speed, φ is the adhesion coefficient, and i represents the upslope and slope.
As expressed in the formula, in the case of the same speed and uphill and downhill conditions, the smaller the friction force, the larger the braking distance. So, the reduction of friction will increase the probability of traffic accidents.
4.
Reduced environmental visibility
On rainy days, rainfall intensity will affect the incidence of traffic accidents because ambient visibility gradually decreases as rainfall increases. Additionally, because most of our roads are made of asphalt, when driving at high speed, the wheels will roll on the water film, thus splashing water droplets and generating water mist of different sizes around the vehicle, which reduce visibility. In the driving process, low visibility will lead to a decrease in the driver’s sight distance and the decrease in the visibility of signs and markings. Driving safety will be affected when the visibility drops to 1000 m.

4.4.3. Governance Measures

  • Drivers’ Preventions
It is suggested that drivers pay attention to weather changes and take preventive measures according to weather forecasts. Specifically, they should strengthen vehicle maintenance, check/replace wipers frequently, pay attention to tire wear, and ensure that the vehicle remains in good technical condition. Moreover, the correct use of lights in every unexpected situation is also advised to prevent transmitting wrong information to the surrounding cars. At the same time, drivers should improve their driving skills and emergency handling ability to avoid traffic accidents and casualties.
2.
Strengthen the drainage capacity of roads
Road surface ponding has a tremendous negative impact on vehicles driving on rainy days. Taking reasonable measures to reduce road surface ponding can effectively reduce traffic accidents on rainy days.
Road drainage mainly includes road surface drainage and road internal drainage. As for the road surface drainage, the drainage capacity of the drainage pipe network can be enhanced by broadening the diameter of the drainage pipe and increasing the outlet and the jet groove. As for the internal drainage of the road surface, new materials can be selected to enhance the drainage capacity of the road, such as adding recycled carbon fiber materials to concrete. This new material ensures the road drainage capacity and road firmness.
3.
Policy management
Government managers should carry out a reasonable regulatory policy for the change of visibility and adhesion coefficient of sight distance markings caused by the decrease in visibility and pavement friction coefficient on rainy days. For example, lane management is carried out to limit lane change and reduce vehicle conflicts according to the road traffic volume distribution. At the same time, traffic flow characteristics also significantly impact the probability of road conflict risk, and government managers should consider the differences between main lanes and lane differences to reduce the occurrence of road conflict [33]. In addition, the traffic management department can also evaluate road traffic conditions, and this assessment uses the following conflict indexes to establish a model: mean time to correct (MTTC), postclosure time (PET), and deceleration rate to void a crash (DRAC). This model predicts real-time safety indicators such as joint return level, concomitant return level, and collision risk, reducing road conflicts [34]. If some roads are crowded and congested, vehicles on the streets can drive to the normal streets according to the guidance methods, such as map navigation and traffic police command, to reduce traffic congestion.
4.
Autopilot technology
Automated driving technology is more efficient and safer than the traditional artificial driving mode. Therefore, connected and autonomous vehicles (CAVs) have always been vital research directions in road traffic safety operations. Some scholars focused on the interaction between autonomous driving trajectory planning and mixed traffic flow. It presented a reinforcement-learning modeling approach to optimize the safety of mixed traffic flow on a single-vehicle road controlled by a signalized intersection [6]. Government managers can develop a coordination policy based on “catch-up” to gradually increase the penetration rate of the CAV market to reduce traffic oscillation and improve road capacity [35]. In addition, a two-level optimization method for CAVs can optimize vehicle scheduling and then carry out optimal trajectory control to reduce vehicle delay and alleviate traffic conflicts [36].

5. Conclusions

This paper studied the traffic accidents on Jingshi Road and its branch roads in Jinan City from 2020 to 2021 as the research object, and 23 subfactors were screened out from the traffic accident data. Then SVM dichotomous classification model, PSO model, and SVM-RFE model were established to rank these 23 subfactors in terms of feature influence degree. The ranking results of feature influence degree indicated that driving in the rain was more likely to cause traffic injuries and deaths, and the type of collision was the least important to the degree of casualties in urban road traffic accidents. In the analysis of urban road traffic accidents on rainy days, it was considered that cars were accident-prone vehicles, and 8:00–12:00 and 18:00–22:00 had the most frequent traffic accidents on rainy days. It was assumed that the leading causes of urban road accidents on rainy days lie in the drivers’ road’s water accumulation, the braking distance of vehicles, and the environmental visibility. Finally, this article put forward some governance measures regarding drivers, road drainage capacity, management policy, and autopilot technology.
The deficiency of this study lies in the excessive number of samples of some category in the data samples adopted, which led to a decrease in model accuracy and unsatisfactory classification results. In addition, the original data obtained were not detailed enough, and the collection of information on some influential factors in urban road traffic accidents not was incomplete, so a more detailed analysis should be carried out further.

Author Contributions

Study conception and design, H.X.; data collection, S.D. and J.K.; data analysis and interpretation of results, Y.W.; draft manuscript preparation, Y.W. and Y.H.; manuscript revision, H.Z. All authors have read and agreed to the published version of the manuscript.

Funding

This research was supported partly by (1) National Natural Science Foundation of China “Driver safety recognition of dangerous goods vehicle based on visual characteristics” (grants Nos. 52102412); (2) Natural Science Foundation of Shandong Province “Key technology research of road traffic accident chain blocking for vehicle networking” (grants Nos. ZR2020MG022).

Institutional Review Board Statement

Not applicable.

Informed Consent Statement

Not applicable.

Data Availability Statement

The data presented in this study are available upon request from the corresponding author. The data are not publicly available due to security and privacy issues.

Acknowledgments

The authors are thankful for the support of Shandong Jiaotong University, the Shandong Key Laboratory of Smart Transportation (preparation), and the Traffic Administration of the Shandong Public Security Department.

Conflicts of Interest

The authors declare that they have no known competing financial interest or personal relationships that could have appeared to influence the work reported in this paper.

References

  1. Hu, Z.; Luo, R.; Yu, S. Analysis of influencing factors of urban fatal traffic accident form. Transp. Technol. Econ. 2022, 24, 25–29+37. [Google Scholar]
  2. Giuffre, T.; Grana, A.; Trubia, S. Safety evaluation of turbo-roundabouts with and without internal traffic separations considering autonomous vehicles operation. Sustainability 2021, 13, 8810. [Google Scholar] [CrossRef]
  3. Macioszek, E.; Sierpinski, G. Analysis of driver behavior at roundabouts in Tokyo and the Tokyo surroundings. In Proceedings of the 16th Scientific and Technical Conference on Transport Systems-Theory and Practice, Katowice, Poland, 16–18 September 2019. [Google Scholar]
  4. Zhang, T.; Gao, K. Will autonomous vehicles improve traffic efficiency and safety in urban road bottlenecks? The penetration rate matters. In Proceedings of the IEEE 5th International Conference on Intelligent Transportation Engineering, Beijing, China, 11–13 September 2020. [Google Scholar]
  5. Wei, Y. Study on the Influence of Self-Driving Vehicles on Urban Road Traffic Flow. Master’s Thesis, Beijing University of Civil Engineering and Architecture, Beijing, China, 2021. [Google Scholar]
  6. Cheng, Y.; Chen, C.; Hu, X.; Chen, K.; Tang, Q.; Song, Y. Enhancing mixed traffic flow safety via connected and autonomous vehicle trajectory planning with a reinforcement learning approach. J. Adv. Transp. 2021, 2021, 6117890. [Google Scholar] [CrossRef]
  7. Lai, F.; Xie, C.; Huang, R. Analysis of the severity of national tourism traffic accidents and its leading factors. World Reg. Stud. 2022, 4, 1–12. [Google Scholar]
  8. Liu, X. Analysis of Factors Influencing the Severity of Rear-End Collision on Freeway and Research on Prevention Measures. Master’s Thesis, Jilin University, Jilin, China, 2016. [Google Scholar]
  9. Meng, X.; Ma, Y.; Sun, J. Cause analysis of traffic accidents at the signalized intersection of urban road plane. Traffic Eng. 2020, 20, 1–6+13. [Google Scholar]
  10. Moslem, S.; Gul, M.; Farooq, D.; Celik, E.; Ghorbanzadeh, O.; Blaschke, T. An integrated approach of best-worst method (BWM) and triangular fuzzy sets for evaluating driver behavior factors related to road safety. Mathematics 2020, 8, 414. [Google Scholar] [CrossRef] [Green Version]
  11. Jeong, H.; Kim, I.; Han, K.; Kim, J. Comprehensive analysis of traffic accidents in seoul: Major factors and types affecting injury severity. Appl. Sci. 2022, 12, 1790. [Google Scholar] [CrossRef]
  12. Iqbal, A.; Rehman, Z.U.; Ali, S.; Ullah, K.; Ghani, U. Road traffic accident analysis and identification of black spot locations on highway. Civ. Eng. J. Tehran. 2020, 6. [Google Scholar] [CrossRef]
  13. Cai, X.; Lei, C.; Peng, B.; Tang, X.; Gao, Z. Road traffic safety risk estimation method based on vehicle onboard diagnostic data. J. Adv. Transp. 2020, 2020, 3024101. [Google Scholar] [CrossRef]
  14. Zhang, D.; Mu, Y.; Wang, C.; Liu, Q.; Sun, Q. Study on the characteristics and severity of urban road traffic accidents. J. Saf. Environ. 2022, 4, 1–9. [Google Scholar]
  15. Li, G.; Lai, W.; Sui, X.; Li, X.; Qu, X.; Zhang, T.; Li, Y. Influence of traffic congestion on driver behavior in post-congestion driving. Accid. Anal. Prev. 2020, 141, 105508. [Google Scholar] [CrossRef] [PubMed]
  16. Gilani, V.N.M.; Hosseinian, S.; Ghasedi, M.; Nikookar, M. Data-driven urban traffic accident analysis and prediction using logit and machine learning-based pattern recognition models. Math. Probl. Eng. 2021, 2021, 9974219. [Google Scholar] [CrossRef]
  17. He, Y.; Zou, J. Impact analysis of urban road traffic accident based on coupling effect of accident characteristics. J. Transp. Inf. Saf. 2021; 39, 45–51+63. [Google Scholar]
  18. Parsa, A.B.; Taghipour, H.; Derrible, S.; Mohammadian, A. Real-time accident detection: Coping with imbalanced data. Accid. Anal. Prev. 2019, 129, 202–210. [Google Scholar] [CrossRef] [PubMed]
  19. Albalate, D.; Fageda, X. Congestion, road safety, and the effectiveness of public policies in urban areas. Sustainability 2019, 11, 92. [Google Scholar] [CrossRef]
  20. Cai, Q. Cause analysis of traffic accidents on an improved association rule mining algorithm. IEEE Access 2020, 8, 75607–75615. [Google Scholar] [CrossRef]
  21. Chen, L.; Li, C.; Zhan, L.; Tan, Q.; Tian, X.; Cheng, H.; Li, K. Analysis and prediction of influencing factors of urban road traffic accident patterns. J. Transp. Inf. Saf. 2022, 42, 98–107. [Google Scholar]
  22. Chen, F.; Chen, S.; Ma, X. Analysis of hourly crash likelihood using unbalanced panel data mixed logit model and real-time driving environmental big data. J. Saf. Res. 2018, 65, 153–159. [Google Scholar] [CrossRef]
  23. Zeng, Q.; Gu, W.; Zhang, X.; Wen, H.; Lee, J.; Hao, W. Analyzing freeway crash severity using a Bayesian spatial generalized ordered logit model with conditional autoregressive priors. Accid. Anal. Prev. 2019, 127, 87–95. [Google Scholar] [CrossRef]
  24. Liu, B.; Yan, H. Analysis of influencing factors of serial rear-end collision based on SVM accident classification. J. Transp. Inf. Saf. 2020, 38, 43–51. [Google Scholar]
  25. Zhang, S. Urban Road Traffic Safety Evaluation and Analysis of Influencing Factors. Master’s Thesis, Lanzhou Jiaotong University, Lanzhou, China, 2016. [Google Scholar]
  26. Santos, D.; Saias, J.; Quaresma, P.; Nogueira, V.B. Machine learning approaches to traffic accident analysis and hotspot prediction. Computers 2021, 10, 157. [Google Scholar] [CrossRef]
  27. Su, K. Severity Prediction of Urban Road Traffic Accidents Based on Interpretable Machine Learning. Master’s Thesis, Chang’an University, Xi’an, China, 2021. [Google Scholar]
  28. Elen, A.; Baş, S.; Közkurt, C. An adaptive gaussian kernel for support vector machine. Arab. J. Sci. Eng. 2022, 47, 10579–10588. [Google Scholar] [CrossRef]
  29. Wang, W.; Pan, Y.; Dong, G. Design and Analysis of Common Computer Algorithms; China Water & Power Press: Beijing, China, 2017. [Google Scholar]
  30. Zhou, W. Research on Speed Limit Raising Technology of Urban Main Road. Master’s Thesis, Chongqing Jiaotong University, Chongqing, China, 2020. [Google Scholar]
  31. Ma, J.; Ren, G.; Li, K.; Cao, Q.; Du, J. Analysis of influencing factors of accident severity between electric bicycle and motor vehicle. J. Transp. Syst. Eng. Inf. Technol. 2022, 22, 337–348. [Google Scholar]
  32. Malin, F.; Norros, I.; Innamaa, S. Accident risk of road and weather conditions on different road types. Accid. Anal. Prev. 2019, 122, 181–188. [Google Scholar] [CrossRef] [PubMed]
  33. Yuan, C.; Li, Y.; Huang, H.; Wang, S.; Sun, Z.; Li, Y. Using traffic flow characteristics to predict real-time conflict risk: A novel method for trajectory data analysis. Anal. Methods Accid. R. 2022, 35, 100217. [Google Scholar] [CrossRef]
  34. Fu, C.; Sayed, T. A multivariate method for evaluating safety from conflict extremes in real time. Anal. Methods Accid. R. 2022, 36, 100244. [Google Scholar] [CrossRef]
  35. Yang, X.; Zou, Y.; Chen, L. Operation analysis of freeway mixed traffic flow based on catch-up coordination platoon. Accid. Anal. Prev. 2022, 175, 106780. [Google Scholar] [CrossRef]
  36. Yao, Z.; Jiang, H.; Cheng, Y.; Jiang, Y.; Ran, B. Integrated schedule and trajectory optimization for connected automated vehicles in a conflict zone. IEEE T Intell. Transp. 2022, 23, 1841–1851. [Google Scholar] [CrossRef]
Figure 1. The map of Jingshi Road.
Sustainability 14 16203 g001
Figure 2. Evolutionary algebra and fitness.
Sustainability 14 16203 g002
Figure 3. Actual and predicted classification diagram of the training set.
Sustainability 14 16203 g003
Figure 4. Actual and predicted classification diagram of a test set.
Sustainability 14 16203 g004
Figure 5. Distribution of traffic accident casualties of different vehicle types.
Sustainability 14 16203 g005
Figure 6. Distribution of traffic accident casualties in different periods.
Sustainability 14 16203 g006
Table 1. The number of accidents.
Accident TypeMinor AccidentSevere Accident
Accident definitionThe number of injured is zeroThe number of injured is one to twoMore than three were wounded, or one died
Number of accidents99054834
Proportion (%)62.9834.862.16
Table 2. Description of influencing factors and proportion distribution.
Influencing FactorAttribute DescriptionFrequencyAccount for/%
SeasonSpring44628.37
Summer44328.18
Autumn40425.70
Winter28917.75
TimeDay103165.59
Night54134.41
Type of collisionCollisions between people and vehicles1519.61
Collisions between moving and stationary vehicles1016.42
Collisions between moving vehicles117774.87
Other1439.10
Accident locationNear the buildings35722.71
Main road35322.46
Secondary road22014
Intersection64240.83
WeatherFine130583.02
Cloudy1278.08
Rain1247.89
Gale20.13
Snow80.51
Fog60.37
Vehicle typeNonmotor vehicles1539.73
Motor vehicle and nonmotor vehicles48730.98
Motor vehicles93259.29
Table 3. Dummy variable coding.
Influencing FactorParameter Coding
SeasonSpring1000--
Summer0100--
Autumn0010--
Winter0001--
TimeDay10----
Night01----
Type of collisionPeople and vehicles1000--
Collisions between moving and stationary vehicles0100--
Collisions between moving vehicles0010--
Other0001--
Accident locationNear the buildings1000--
Main road0100--
Secondary road0010--
Intersection0001--
WeatherFine100000
Cloudy010000
Rain001000
Gale000100
Snow000010
Fog000001
Vehicle typeNonmotor vehicles100---
Motor vehicles and nonmotor vehicles010---
Motor vehicles001---
Table 5. Subfeature importance ranking.
SortSubfeatureSortSubfeature
1Rain13Fine
2Motor vehicles and nonmotor vehicles14Spring
3Main road15Motor vehicles
4Secondary road16Nonmotor vehicles
5Summer17Cloudy
6Intersection18Snow
7Autumn19Fog
8Winter20Collisions between moving and stationary vehicles
9Gale21Collisions between moving vehicles
10Day22Other
11Near the buildings23People and vehicles
12Night
Table 6. Details of vehicle type distribution of traffic accidents on rainy days.
Accident Vehicle TypeNumber of Accidents/PieceCasualty/PersonAccident Vehicle TypeNumber of Accidents/PieceCasualty/Person
Large bus97Heavy truck43
Car3724Motorcycle86
Minibus517Electric bicycle84
Light truck57Other21
Table 7. Details of grade distributions’ traffic accident grade on rainy days.
Accident LevelMinor AccidentsGeneral AccidentsMajor Accidents
Quantity/Cases80404
Table 8. Time distribution of traffic accidents on rainy days.
PeriodNumber of Accidents/PieceCasualty/PersonPeriodNumber of Accidents/PieceCasualty/Person
0:00–2:009512:00–14:0051
2:00–4:006314:00–16:00103
4:00–6:006716:00–18:00122
6:00–8:007218:00–20:001610
8:00–10:0012920:00–22:00187
10:00–12:0013622:00–24:00114
Publisher’s Note: MDPI stays neutral with regard to jurisdictional claims in published maps and institutional affiliations.