Article

Study of an Optimized Micro-Grid’s Operation with Electrical Vehicle-Based Hybridized Sustainable Algorithm

by
Muhammad Shahzad Nazir
1,*,
Zhang Chu
1,
Ahmad N. Abdalla
2,
Hong Ki An
3,
Sayed M. Eldin
4,
Ahmed Sayed M. Metwally
5,
Patrizia Bocchetta
6 and
Muhammad Sufyan Javed
7,*
1
Faculty of Automation, Huaiyin Institute of Technology, Huai’an 223003, China
2
Faculty of Information and Electronic Engineering, Huaiyin Institute of Technology, Huai’an 223003, China
3
Department of Transportation Engineering, Huaiyin Institute of Technology, Huai’an 223003, China
4
Center of Research, Faculty of Engineering, Future University in Egypt, New Cairo 11835, Egypt
5
Department of Mathematics, College of Science, King Saud University, Riyadh 11451, Saudi Arabia
6
Dipartimento di Ingegneria dell’Innovazione, Università del Salento, Via Monteroni, 73100 Lecce, Italy
7
School of Physical Science and Technology, Lanzhou University, Lanzhou 730000, China
*
Authors to whom correspondence should be addressed.
Sustainability 2022, 14(23), 16172; https://doi.org/10.3390/su142316172
Submission received: 5 November 2022 / Revised: 26 November 2022 / Accepted: 1 December 2022 / Published: 3 December 2022
(This article belongs to the Special Issue Smart Grid Analytics for Sustainability and Urbanization in Big Data)

Abstract

:
Recently, the expansion of energy communities has been aided by the lowering cost of storage technologies and the appearance of mechanisms for exchanging energy that is driven by economics. An amalgamation of different renewable energy sources, including solar, wind, geothermal, tidal, etc., is necessary to offer sustainable energy for smart cities. Furthermore, considering the induction of large-scale electric vehicles connected to the regional micro-grid, and causes of increase in the randomness and uncertainty of the load in a certain area, a solution that meets the community demands for electricity, heating, cooling, and transportation while using renewable energy is needed. This paper aims to define the impact of large-scale electric vehicles on the operation and management of the microgrid using a hybridized algorithm. First, with the use of the natural attributes of electric vehicles such as flexible loads, a large-scale electric vehicle response dispatch model is constructed. Second, three factors of micro-grid operation, management, and environmental pollution control costs with load fluctuation variance are discussed. Third, a hybrid gravitational search algorithm and random forest regression (GSA-RFR) approach is proposed to confirm the method’s authenticity and reliability. The constructed large-scale electric vehicle response dispatch model significantly improves the load smoothness of the micro-grid after the large-scale electric vehicles are connected and reduces the impact of the entire grid. The proposed hybridized optimization method was solved within 296.7 s, the time taken for electric vehicle users to charge from and discharge to the regional micro-grid, which improves the economy of the micro-grid, and realizes the effective management of the regional load. The weight coefficients λ1 and λ2 were found at 0.589 and 0.421, respectively. This study provides key findings and suggestions that can be useful to scholars and decisionmakers.

1. Introduction

The concept of smart, environmentally friendly, and sustainable cities is crucial to assessing how well nations have advanced their civilizations and development [1,2,3]. The goal of developed nations’ research and development efforts is to create greener cities and communities that enhance the state of the environment worldwide and reduce pollution from human activity [4]. To accomplish a comprehensive energy solution, it is crucial to control the demand for and distribution of produced energy [3,4]. Furthermore, it is also necessary to implement various forms of renewable energy technology in cities and societies [5]. To enable sustainable energy for cities, a mix of several renewable energy sources, such as solar, wind, geothermal, tidal, etc., is necessary [6]. Intelligent energy management strategies can be implemented at all levels, starting at home and extending to every nook and cranny of the city, including transportation, schools, hospitals, factories, streets, etc. [7]. The increasing penetration of renewables has driven power systems to operate closer to their stability boundaries, increasing the risk of instability [8]. With the upcoming dynamic power generation in many countries, the installed capacity of power generation can gradually and effectively use energy to promote energy conservation, which plays an important role in achieving sustainable energy development [8,9]. The authors discussed the rapid development of power grid technology in the mix with the electric vehicles (EVs) industry (V2G) [10,11]. Using large-scale EV charging piles in the area to realize vehicle network interaction allows large-scale EVs and EVs to take part in economic optimization management, while the use of an energy storage system allows users to create energy arbitrage by discharging during price peaks and charging during off-peak periods if a variable energy price is considered [9].
The control methods of the microgrid (MG) are more diversified, and the development of safety emergency response capabilities has become a current research hotspot. In terms of reducing the valley gap, the literature uses the temporal and spatial characteristics of EVs to construct an orderly charging and discharging load for EVs and a real-time electricity price response model [12]. EVs and other power generation equipment can take part in the economic dispatch of the MG. To study the different strategies between EV power stations and MG, an economic dispatch optimization model was constructed [13]. To solve the increase in the popularity of the complex EV access point network, it has been proposed large-scale EVs be connected to the network, and there is a good deal of optimization scheduling methods. EVs are effectively used to optimize charging and reduce system load peaks and valleys [14]. However, the economic dispatch model of the literature mentioned above considered three factors of an MG, while the user benefits and safety of MG operation do not cogitate the performance of MG management and the participation of EV users [8,15].
These days, smart parking lots are becoming more and more popular since they offer a workable solution to power outages [16]. Systems for managing energy can benefit from heuristic algorithms since they speed up decision-making and develop a novel heuristic algorithm for MG energy management [17]. The principle behind this algorithm is to avoid wasting the available renewable potential at each period. Model predictive control is used to reduce the output power loss caused by converter failure, panel shading, and dirt buildup on wind and PV panels [18].
Authors discussed the dimensional optimization algorithm for optimizing scheduling problems, such as the endless combination of particle swarm optimization (PSO) algorithm and differential evolution algorithm (DE), and the random particle swarm algorithm (RDPSO) [19,20]. Authors proposed that WOANN predicts the required control gain parameters of the hybrid renewable energy systems to maintain the power flow, based on the active and reactive power variation on the load side [19]. The imperialist competition algorithm (ICA) combined mutation, destruction, and selection of a variety of different operators with PSO and other methods studied [21,22]. However, these methods have some shortcomings in finding the optimal solution and the best ability to overcome them [23]. Based on the above analysis, starting from the management side of the MG operator, we comprehensively considered the three factors of MG operation safety, environmental governance, and user participation. A preliminary EV participation in the MG operation management optimization model was established to realize the operating and management costs, environmental pollution control costs, and the lowest mid-term cost [24]. The multi-agent chaotic particle swarm optimization (MACPSO) algorithm combined with the chaotic particle swarm optimization algorithm and chaotic particle swarm optimization (CPSO) algorithm was used to solve the problem [25]. The demand and response characteristics of each power generation unit, large-scale EVs, and electric load in the region were different, and the constraint conditions of each power generation unit presented nonlinear characteristics [26]. A regional MG under the constraints of nonlinear equations is one difficulty for researchers [27]. Furthermore, achieving the best states of management cost, environmental pollution, and load fluctuation variance are another topic of discussion [26]. Authors used the penalty function method to deal with the relevant constraints; this method adds a penalty term to generate a new objective function [20]. Energy conservation has become a long-term strategic policy for global economic and social development [27]. The enhancement of energy management can improve energy efficiency and promote energy conservation and emissions reduction [28]. However, integrating renewable energy and a flexible load makes the integrated energy system a complex dynamic with high uncertainty, bringing great challenges to modern energy management [29]. With the increasing number of vehicle charging piles installed in recent years, load peak periods are brought to the station area, resulting in an insufficient capacity of the station area, in turn resulting in an overload of the distribution transformer in the station area, increased loss of lines and transformers, and other problems [30]. A good auxiliary power supply is the key to the coordinated development between vehicle charging and the power grid in a smart MG [28]. The wind and solar energy generation system can transform the natural resources of the station area into a stable power supply. Authors proposed an energy management method for a grid-connected wind-solar storage MG system with multiple types of energy storage [31]. Authors have researched optimal energy scheduling of MG considering EV charging load [32]. According to the two operation modes of the MG, namely grid-connected and isolated islands and the different access modes of EVs, the MG operation control strategy including EVs was customized [21]. To investigate if solar energy and wind energy are naturally complementary, an energy storage system and an optimized battery energy storage control strategy were combined to put forward a hybrid landscape storage system control strategy considering the charging effect of batteries [33]. The author discussed the operation energy management strategy of the isolated grid of an MG containing hybrid energy storage [33]. However, none of these explored strategies were studied with regard to their application in smart stations/MGs and EVs.
This paper proposes large-scale EVs involved with MG operation and its management optimization method. This method first makes full use of the EV natural flexible load property, and the response of the large-scale EV scheduling model is constructed. Then, considering the system’s operation, user participation, and environmental governance, an optimization model is established. The system operation management cost of the MG, environmental pollution control cost, and load fluctuation variance are integrated to achieve an optimal system. Finally, by comparing the optimization results of multiple scenarios, it is verified that the model can realize effective load management in the region and reduce the management cost of MGs and environmental pollution treatment costs to support a healthy society.
The rest of the study is organized as follows, Section 2 presents the related work, Section 3 describes the proposed model, Section 4 explains the results and discussion and the conclusion is presented in Section 5.

2. Related Work

2.1. Model of Large-Scale EVs

Assume that some users of EVs in the area respond to the dispatching information of the regional grid to charge from and discharge to the MG. In contrast, some users do not respond to dispatching information and randomly access charging [21]. The dispatching structure diagram is shown in Figure 1.
According to the operating characteristics of the EVs in the area, the regional response-dispatching EV cluster is divided into a charging cluster and a discharging cluster [34]. The charging and discharging responsiveness of EV users at time t expressed as:
φ d ( t ) = N d ( t ) N × 100 %
φ c ( t ) = N c ( t ) N × 100 %
φ ( t ) = φ d ( t ) + φ c ( t )
where N is the total number of EVs in the area; N d ( t ) is the number of EVs that respond to discharge information; N c ( t ) is the number of EVs that respond to charging; φ d ( t ) is the discharge responsiveness of EV users; φ c ( t ) is the user’s charging responsiveness; φ ( t ) is the user’s responsiveness. When a user responds to charging, φ d ( t ) = 0 , and when the user responds to discharge, φ c ( t ) = 0 .

2.2. EV Disorderly Charging Model

It is assumed that the charging power of an EV is equal to the power of the connected charging piles and limited by the power of the charging piles installed in the area [35]. The charging power of different types of charging piles is inconsistent. According to the maximum state of charge of the i-th EV S O C i , m a x , the state of charge S O C i at the beginning of charging, the power of the connected charging pile P i , c h , the power battery capacity C , and the charging efficiency η C E V , the charging duration of EVs obtained in the formula is as follows [36]:
t c , i = ( S O C i , max S O C i ) C η C E V P c h , i
The calculation expression is:
P u n o ( t ) = ( 1 φ ( t ) ) i = 1 N P c h , i ( t ) . α t c p , t . α s t a t e , t
where P u n o ( t ) represents the total disordered charging load in the area at time t,  t     1 , 2 , 3 , , 24 ; N is the number of EVs; P c h , i ( t ) is the connection at the charging time t, α s t a t e , i represents the state of the charging pile, α s t a t e , i = 1 represents the charging state, and α t c p , i represents the parking time;   t p , i is greater than the required charging duration. t c , i is used to calculate the charging power that is α t c p , i     1 and the total disordered charging load in the t period area.

2.3. Model of Charging, Discharging, and User Response

EV users respond to dispatched charging and discharging, while users responding to the dispatching information of the regional MG and connect to the regional MG for controllable charging and discharging in an orderly manner. Suppose that when the user of the i-th EV responds to the scheduling information, they also provide feedback on important parameters such as the state of charge of the power battery S O C i , the parking time t p , i , the next trip, and the unit power consumption of the EV to the area of the MG to calculate the energy consumption for the rest of the user’s journey S O C r e s t , i according to the feedback parameter information, the state of charge of comprehensive user anxiety S O C a n x , i , and to protect the battery reserve with capacity margin of not less than 20% to calculate the charging and discharging time of the EV.
The charging duration is consistent with Equation (6), and the discharge duration is expressed as [37]:
t d , i = ( S O C i S O C i , r e s t S O C a n x , i 20 % ) C η d E V P d i s , i
where η d E V is the discharge efficiency of EV; P d i s , i represents the discharge power of the connected charging pile.
The total charge and discharge power P r e s E V ( t ) of EVs in the area at time t can be obtained by:
P d i s L o a d ( t ) = φ d i s ( t ) i = 1 N P d i s , i ( t ) . α t d p , t . α s t a t e , t
P c L o a d ( t ) = φ c ( t ) i = 1 N P c h , i ( t ) . α t c p , t . α s t a t e , t
P r e s E V ( t ) = P d i s L o a d ( t ) + P c L o a d ( t )
where α t d p , i means that the parking time t p , i is greater than the continuous discharge time t d , i to calculate the discharge power, that is, α t d p = 1 , according to the discharge of the connected charging pile power.

3. Proposed Model

3.1. Objective Function

The operating and management costs of the regional MG and pollutant control costs can be collectively referred to as the total operating and management costs of the regional MG, defined as:
m i n F     λ 1 ( F 1 + F 2 ) + λ 2 F 3
where λ 1 and λ 2 are weighting factors, where λ 1 + λ 2 = 1 .
The integrated operation and management cost of an MG with large-scale EVs mainly includes the economic operation cost of the MG and the incentive cost for EVs that respond to dispatching to take part in the dispatch as follows:
F 1 = i = 1 T { [ C n ( P D G ( n , t ) ) + C w , n ( P D G ( n , t ) ) ] } + C g r i d ( t ) P g r i d ( t ) + C e x c i t ( t ) + C d c ( t )
where T is a dispatch cycle; N D G is the type of power generation unit installed in the area; C ( P D G ( n , t ) ) is the power generation cost of the nth type of power generation unit; C W , n ( P D G ( n , t ) ) is the maintenance cost of the nth type of power generation unit; P D G ( n , t ) is the power generation of the n type of power generation unit; c g r i d ( t ) and P g r i d ( t ) are the agreement points of the MG and the power grid company at time t, respectively; C e x c i t ( t ) is the cost of incentivizing EVs to participate in dispatch; C d c ( t ) is the difference between the operation purchase of electricity from users (discharge) and the sale of electricity to EVs (charging), an additional fee is required.
The power generation cost of a distributed generation unit is defined as:
C n ( P D G ( n , t ) ) = α n [ P D G ( n , t ) ] 2 + β n P D G ( n , t ) + γ n
where α n , β n , and γ n are cost constants, which are related to the type of distributed generation (DG) unit.
The maintenance cost of the power-generating unit is approximately proportional to the power generated by the power-generating unit.
C w , n ( P D G ( n , t ) ) = λ n m ( P D G ( n , t )
where λ n m represents the maintenance coefficient of n types of distributed power generation units. Different types of distributed power generation units have different maintenance coefficients. For different types of maintenance coefficients, please refer to the literature.
To use the capacity of the EV’s power battery, the regional MG adopts certain incentives for car owners to attract EV owners to actively respond to the dispatching information of the regional MG, charge/discharge the regional MG, and take incentive measures.
The cost calculation expression is:
C e x c i t ( t ) = φ ( t ) i = 1 ( S O C i , max S O C i , min ) C ρ e x c i t ( t ) i ( t )
where ρ e x c i t ( t ) represents the unit incentive cost at time t, and its value is calculated by referring to the distributed generation kilowatt-hour subsidy standard [38]; Λ i ( t ) is the connection state of the charging pile at time t , Λ i ( t ) = 1 means the charging pile is connected, Λ i ( t ) = 0 means the charging pile is not connected.
The additional cost added by the difference in the electricity price during the charging and discharging period of the user can be calculated by:
C d c ( t ) = i = 1 T i = 1 N { φ d i s ( t ) P d i s , i ( t ) p ( t ) d , t ( 1 φ d i s ( t ) P c h , i ( t ) c ( t ) Δ c , i ) }
where T is a dispatch period; N is the total number of EVs in the area; p ( t ) is the on-grid price of the user for discharging into the regional MG at time t ; c ( t ) is the charging price of the user at time t; t c , i and t d , i , respectively, represent the continuous charging and discharging time of EV users to the regional MG. The pollutant penalty costs for MG operation are as follows:
F 2 = t = 1 T n = 1 N D G m = 1 M C m α m , n P D G ( n , t ) + m = 1 M C m α g r i d , m P g r i d ( t )
where M is the type of pollutant, and the power generation process mainly considers NOx, SO2, and carbon emissions; C m represents the cost per kilogram of treating these m types of pollutants; α n , m represents the first type of power generation unit produced. The emission coefficient of m-type gas pollutants; P D G ( n , t ) is the power generation of the nth type of power generation unit; α g r i d , m represents the emission coefficient of m-type gas pollutants generated when the public large-scale power grid transmits electric energy; P g r i d ( t ) represents the power flowing in both directions between the regional MG and the large public grid.
The power supplied by the grid to the MG is positive, and the power supplied by the regional MG to the large power grid is negative due to the load fluctuation and due to improving the security and stability of the MG’s economic operation.
F 3 = 1 T t = 1 T ( P l o a d ( t ) + P u n o ( t ) + P r e s E V ( t ) n = 1 N D G P D G ( n , t ) P a v ( t ) ) 2
where P l o a d ( t ) represents the basic electricity load in the MG in the period t; P u n o ( t ) represents the disorderly charging load of EVs in the period t; P r e s E V ( t ) represents the EVs response charge and discharge in the period t load.

3.2. Constraints

To achieve a balanced state of power on the supply and demand side in regional MGs, the power balance constraint can be expressed as:
P l o a d ( t ) + ( P u n o ( t ) + P r e s E V ( t ) ) = n = 1 N D G P n ( t ) P b s s ( t ) + P g r i d ( t )
where P n ( t ) is the power supply of the nth type of power generation unit in the area; P b s s ( t ) is the energy storage system’s total charge and discharge power; greater than 0 means discharging, and less than 0 means charging.
EV charging and discharging state constraints:
S O C i ( t + 1 ) = S O C ( t ) i + ( η c , i P c , i ( t ) C α s t a t e , i . c , t + P d i s , i ( t ) η d , i C α s t a t e , i . d , t )
where S O C i ( t + 1 ) and S O C i ( t ) are, respectively, the state of charge of the ith EV power battery during ( t + 1 ) and t periods; η c , i , η d , i represents the charge and discharge efficiency of EV; c , t and d , t represent the duration of charge and discharge.
To meet the user’s next trip needs, the user can set the desired power battery power.
S O C i ( t l e a v e ) S O C d e s i r e d , i
where S O C d e s i r e d , i represents the state of charge of the power battery expected by the user when leaving the charging pile; S O C i ( t l e a v e ) represents the actual state of charge of the power battery when the EV leaves the charging pile.

3.3. Hybridized Algorithm

3.3.1. The GSA Algorithm

The GSA acts on agents as objects whose actions are recorded by the masses [39]. Objects are to display a solution or a portion of a solution. The gravitational pull attracts items to themselves, causing a worldwide movement toward objects with larger masses [40]. Because the heavier masses have higher fitness criteria, achieving a worthy ideal answer is more difficult.
The position is defined with N as:
X i = ( x i 1 x i d x i n ) f o r i = 1 , 2 , , N
First, the agents of the solution have given a solution based on Newton’s gravitational theory [41]. The gravitational force is calculated as follows:
F i j d ( t ) = G ( t ) M i ( t ) x M j ( t ) R i j ( t ) + ε ( x j d ( t ) x i d ( t ) )
The Euclidian distance can be written as:
R i j ( t ) = X i ( t ) , X j ( t ) 2
The total force acting can be presented as:
F i d ( t ) = j k b e s t , j i N r a n d j F i j d ( t )
Moreover, a i d ( t ) can be presented as:
a i d ( t ) = F i d ( t ) M i i ( t )
Furthermore, a technique based on this concept can be described to obtain an agent’s subsequent speed and location. An agent’s subsequent speed can be represented as a function of its current velocity plus its current acceleration. As a result, the improved location and speed provides:
v i d ( t + 1 ) = r a n d i × v i d ( t ) + a i d ( t )
x i d ( t + 1 ) = x i d ( t ) + v i d ( t + 1 )
To appropriately regulate the search procedure, the gravitational constant (G) is set arbitrarily at the start and gradually decreases over time as follows:
G ( t ) = G ( G 0 , t )
G ( t ) = G 0 e α t T
The masses of the agents can be determined via fitness evaluation. The greater an agent’s act mass, the more significant that agent is to obtaining the answer. According to Newton’s laws of gravity and motion, a hefty mass has greater pull-on power and moves slower. The masses can be described as follows:
M a i = M p i = M i i = M i , i = 1 , 2 , , N
m i ( t ) = f i t i ( t ) w o r s t ( t ) b e s t ( t ) w o r s t ( t )
M i ( t ) = m i ( t ) j = 1 N m j ( t )

3.3.2. The RFR Algorithm

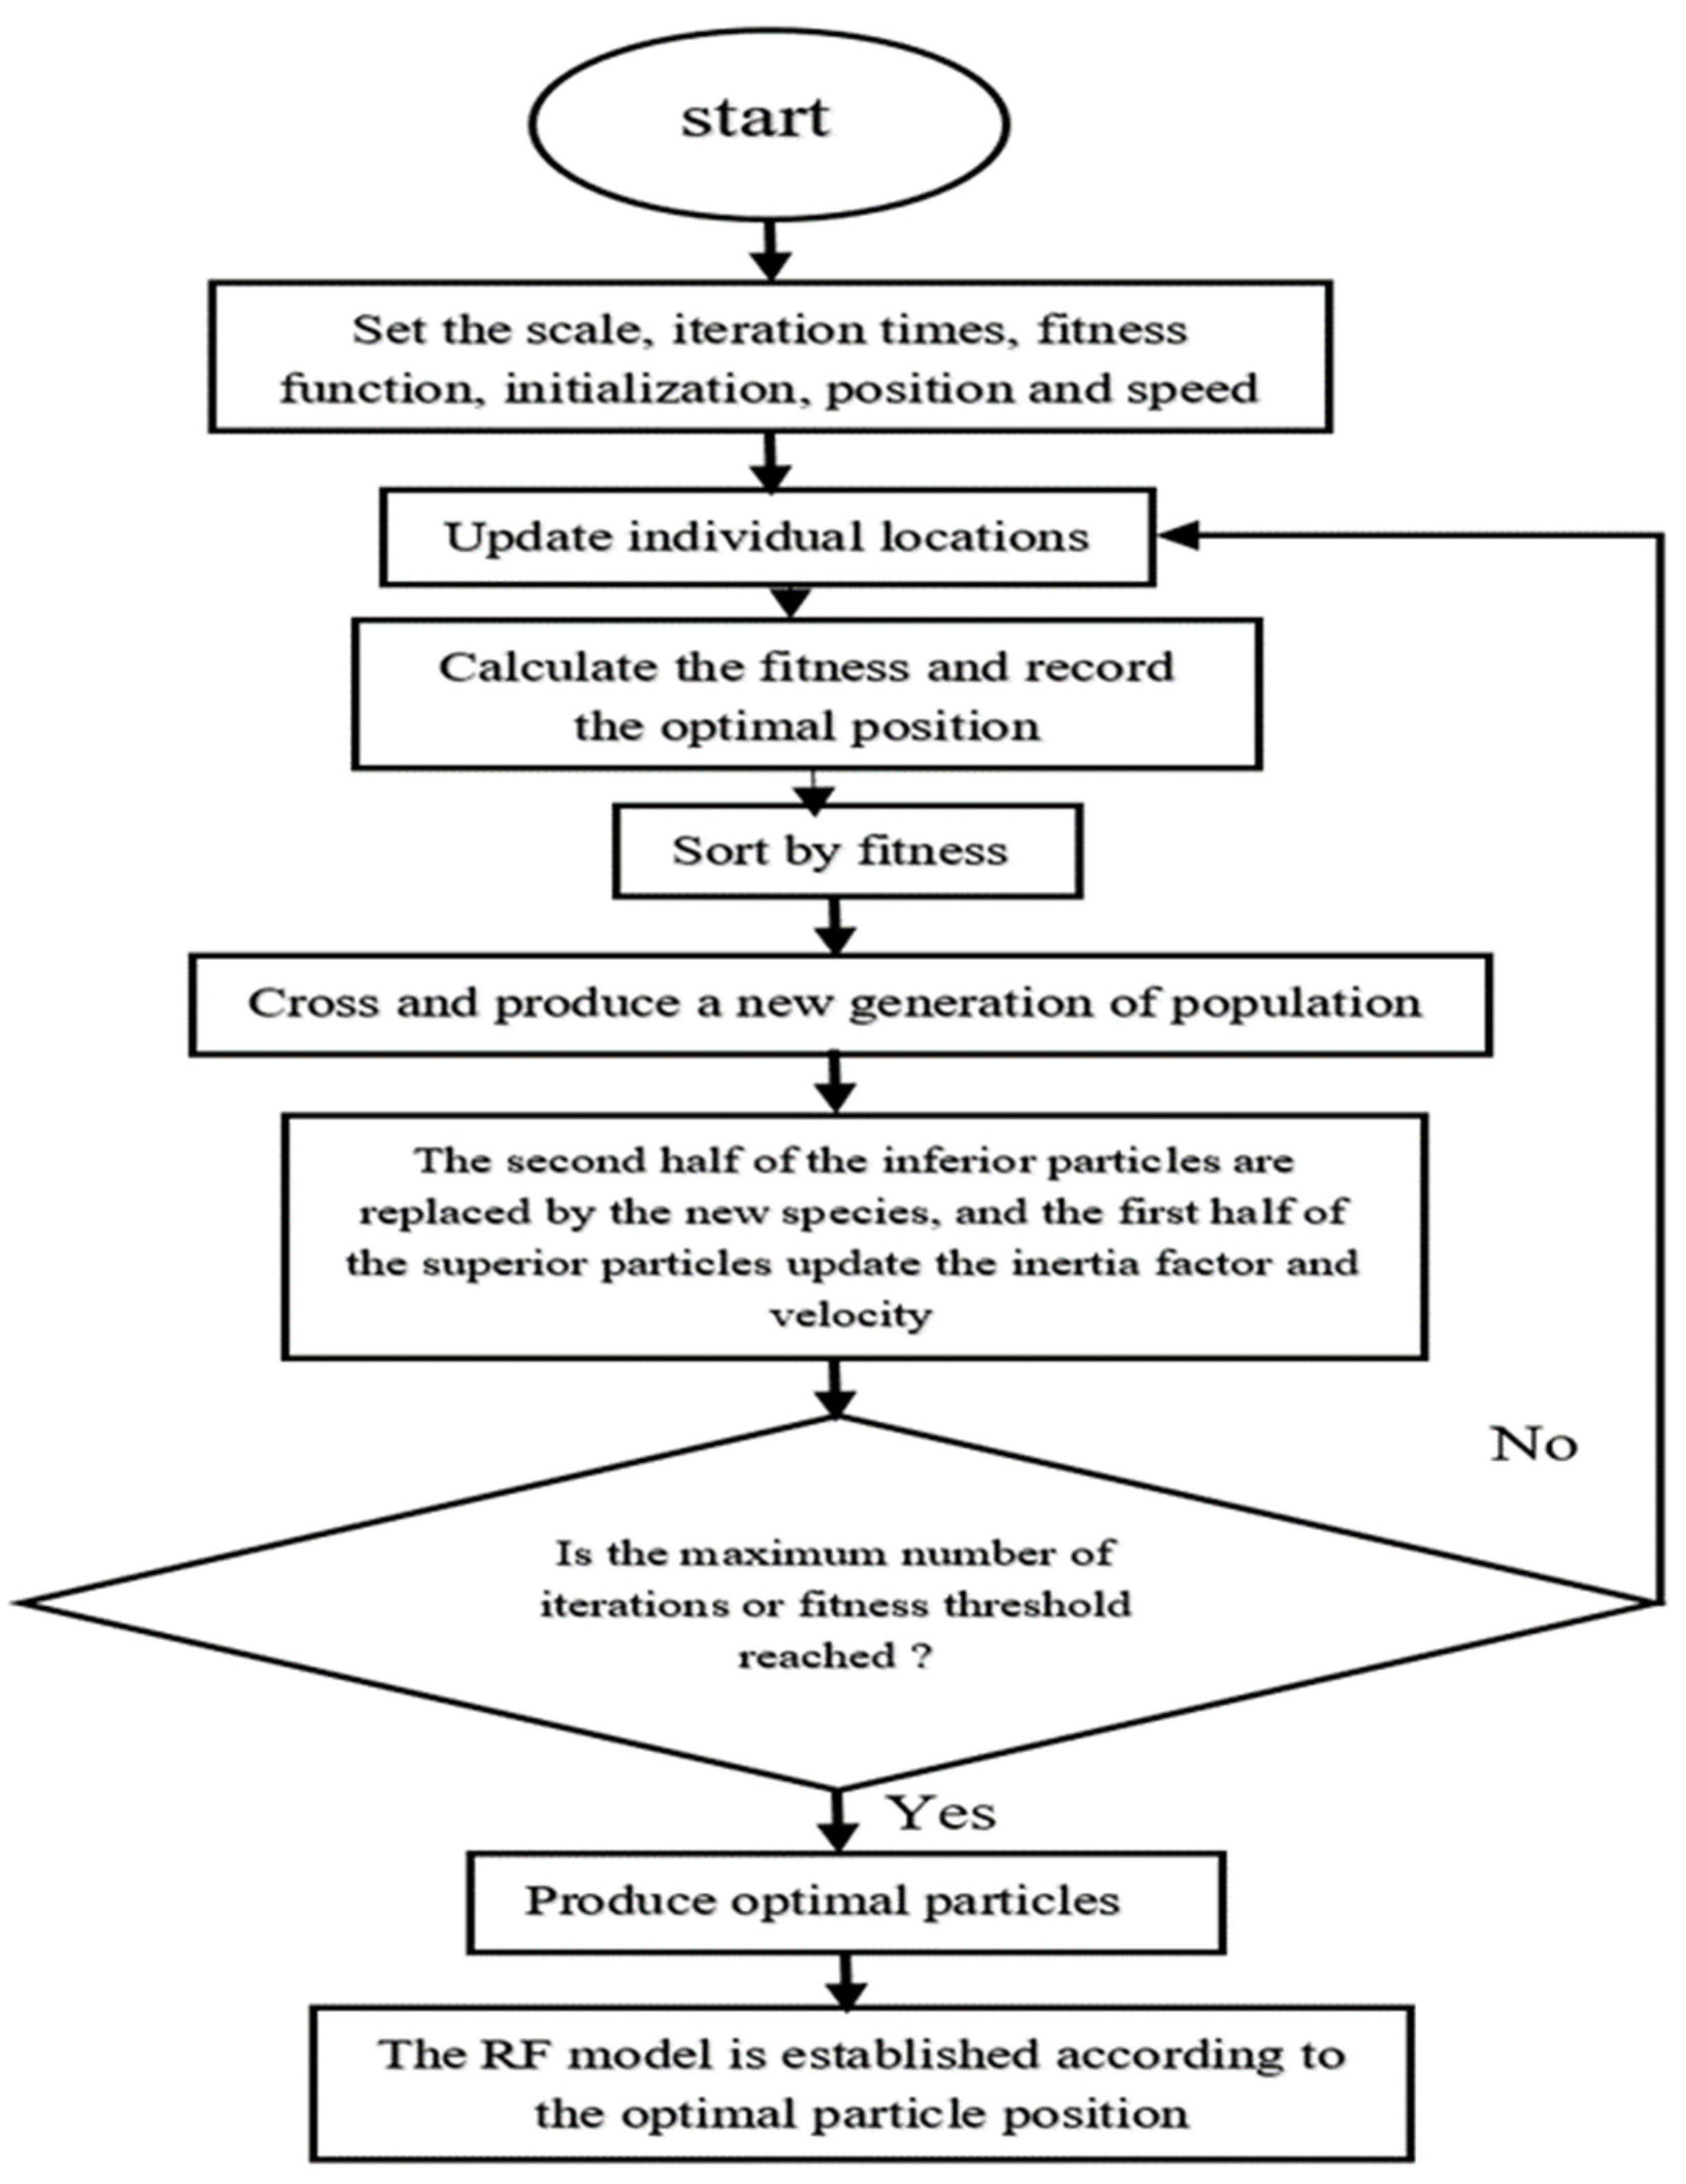
The fitness function for the GSA algorithm must be established to assess the benefits and drawbacks of the RFR model for each node [42]. The following new particle will result from the crossing:
X i n e w k = r X i k + ( 1 r ) X j k
V i n e w k = V i k + V j k | V i k | + | V j k | | V j k |  
where the random number r value is between 0 to 1; the velocities of particles are Vi and Vj, Xi and Xj; Xi and Vi are the new positions and velocities of the different particles, while Xi replaces them.
The method of dynamically adjusting the inertia factor is used for great particles.
In the initial phase, w is nominated to develop global searchability. The slighter w stood in the later phase to attain a more sophisticated search. The efficient formulation of the inertia factor is presented in Equation (33).
w ( t ) = ( w 1 w 2 ) × ( T t ) / T + w 2
The following was chosen for the mean square of the residual:
R R F 2 = 1 M S E o o B σ y 2
where the predicted cost of variance is σ2y; residual error R2RF is the mean square. Each input feature’s significance can be determined by random forest as:
f i = j f e a t u r e i n j k n k
n k = w k M k w k 1 M k 1 w k 2 M k 2  
where node k importance is nk; the feature division is the node with the feature I as nj; the number of samples in node k is wk, w1, and w2, the ratio and its sub-nodes to all the samples, respectively; the node k mean square errors are Mk, M1, and M2 and its sub-nodes.
Figure 2 shows the multi-objective model is weighted into a comprehensive single-objective model. There may be errors in weighting to overcome subjective experience. This paper uses the entropy method for weighting, forming a weighted single-objective optimization model, and implementing specific steps.
(1)
Take the objective function F i ( i = 1 , 2 , , n ) as the optimization target for the single-objective solution.
(2)
According to step (1), a single objective function value and a comprehensive, objective function value can be obtained.
(3)
According to the single objective function value and the comprehensive objective function, the objective function value is unified and dimensionless, and the preprocessed objective function value set is obtained.
(4)
Apply the entropy weight method to obtain the weight coefficient of the objective function.

4. Result and Discussion

4.1. Model Parameter

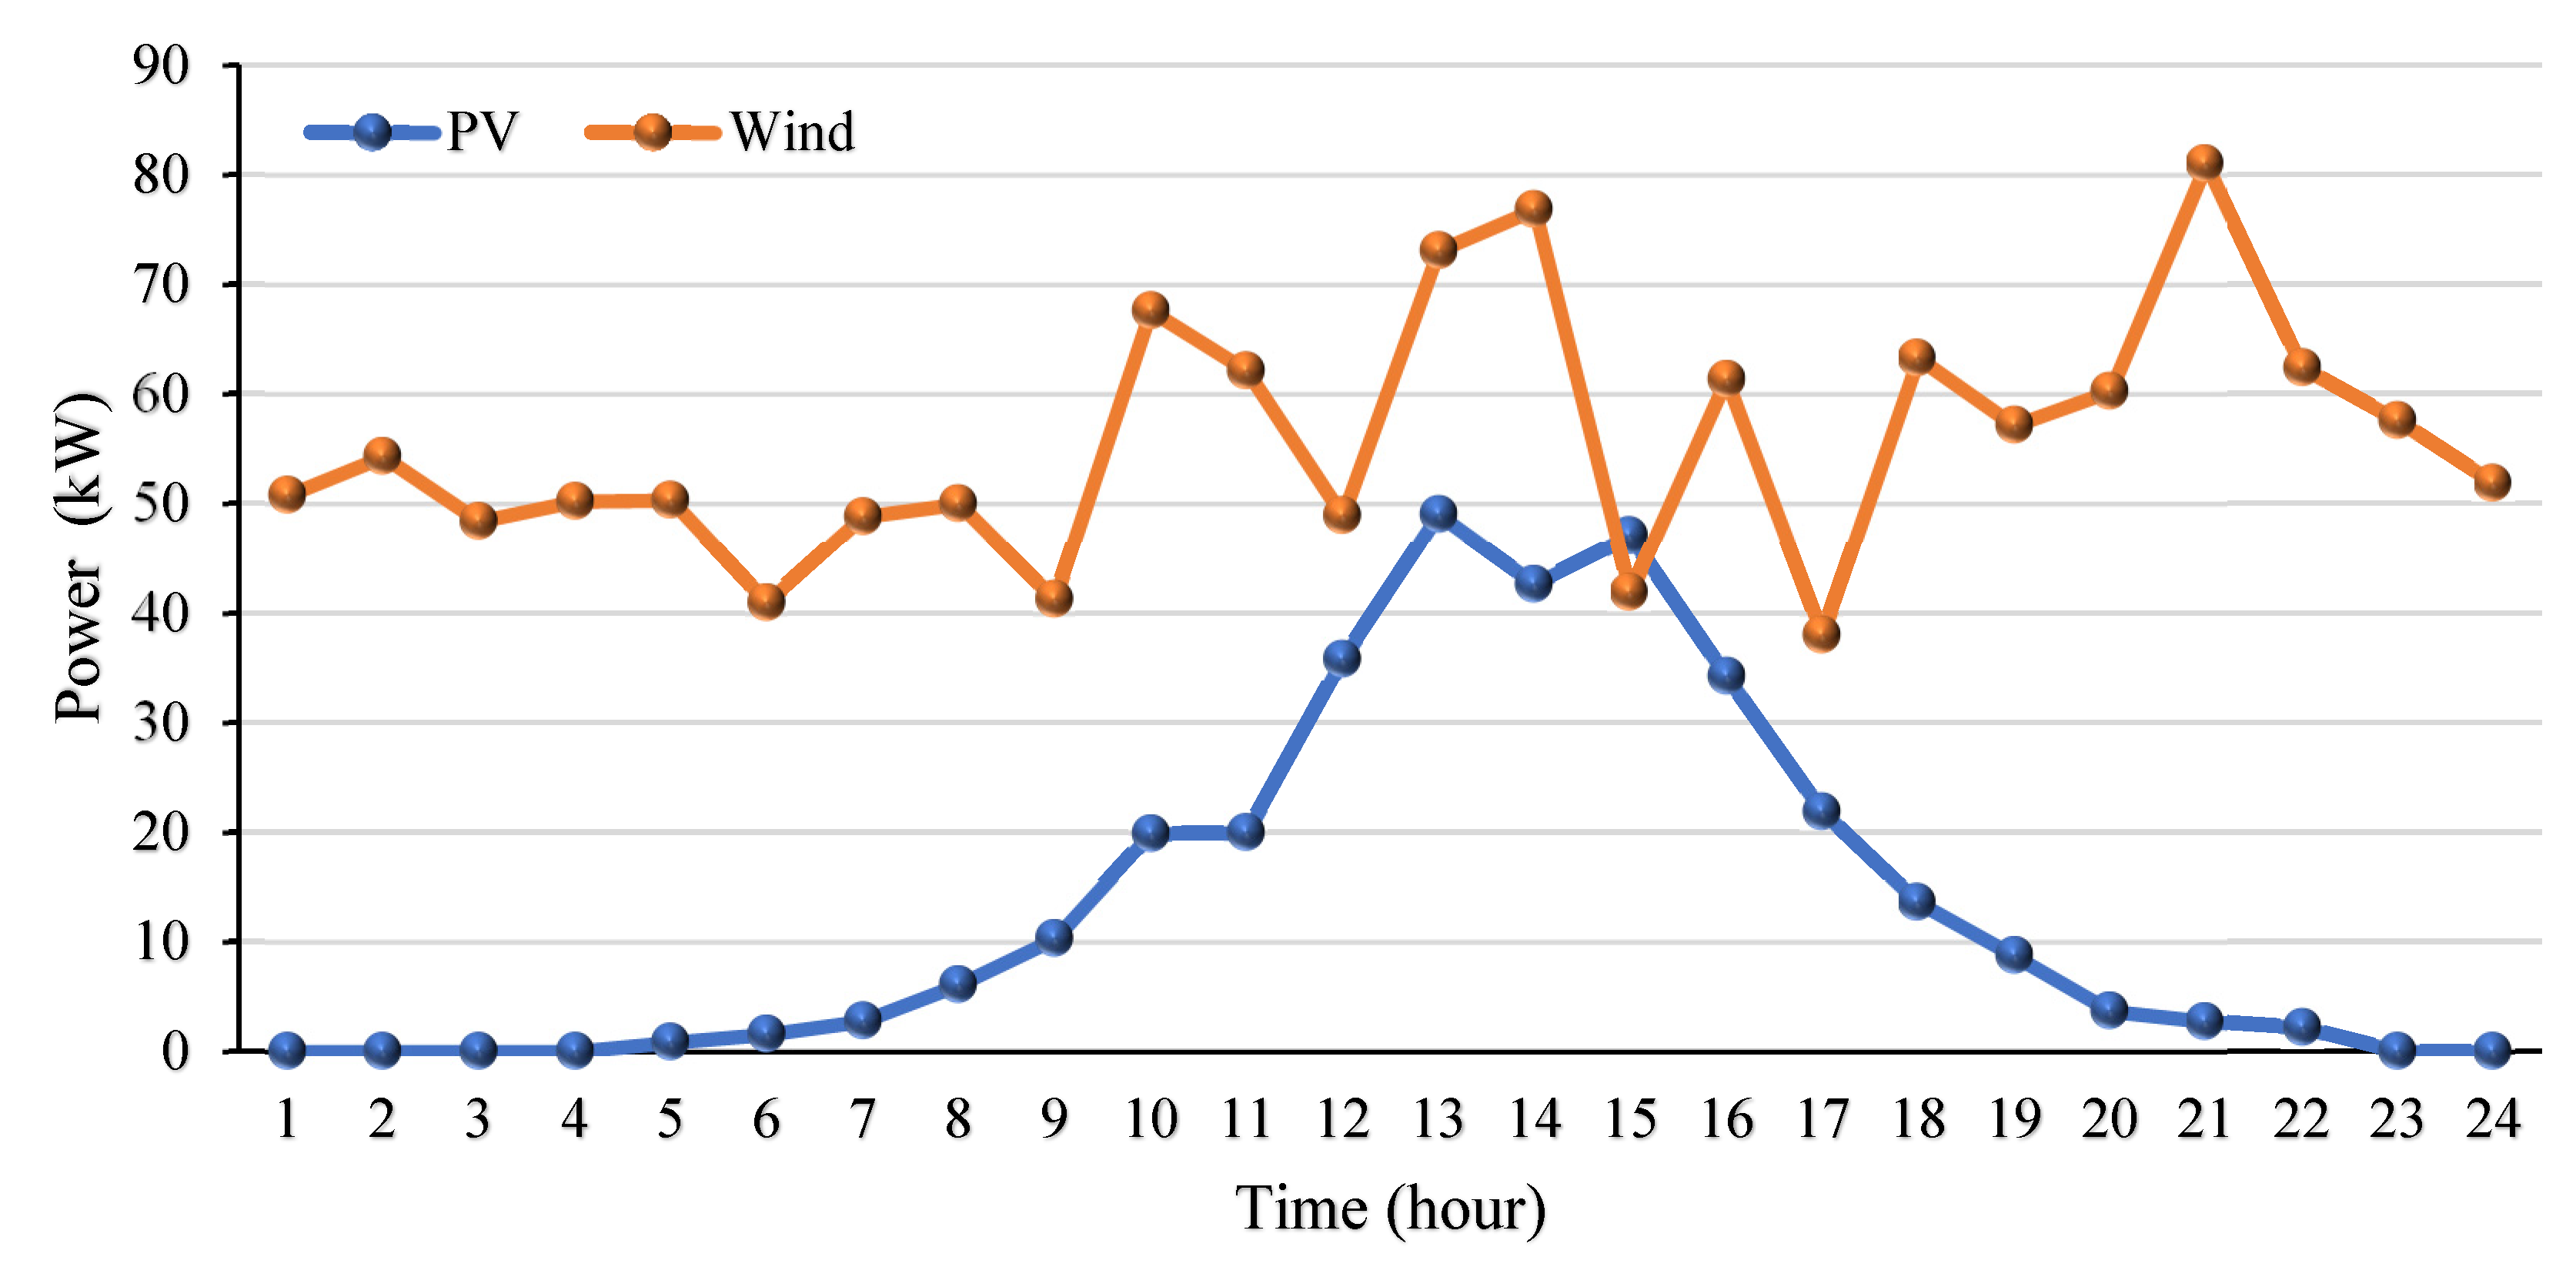
Figure 3 shows a selection of the typical wind and solar power forecast curves in the MG of a park. The charging piles are installed in the park and can be divided into three levels. Table 1 lists the allowable charging power of each level of charging piles. The three-level charging pile proportions are 50%, 30%, and 20%. Due to the limitations of the actual park’s MG installed capacity and transmission power lines, it is assumed that there are 100 EVs in the park. Table 2, Table 3 and Table 4 show the parameters of the power generation units installed in the park, unit power generation costs and maintenance costs, environmental governance cost coefficients, and time-of-use electricity prices of the park [43]. Assuming that all EVs in the park are of the same type, the charging and discharging power and the charging and discharging efficiency are the same. The EV’s parameters are shown in Table 5. The GSA-RFR algorithm parameters; population size is 300, the maximum iteration time M a x T i m e = 350 , the upper limit of inertia weight w m a x = 0.9 , the lower limit of inertia weight w m i n = 0.4 , the initial self-learning factor c i = 2.5 , termination self-learning factor c 1 f = 0.5 , initial social learning factor c i = 20.5 , termination social learning factor c 2 f = 2.5 , environment size l s i z e = 20 , optimal chaotic environment size h s i z e = 3 , the search radius r = 0.5 , the number of iterations of optimal chaos h c i r = 10 .

4.2. Effectiveness of the Large-Scale EV Response Scheduling Model

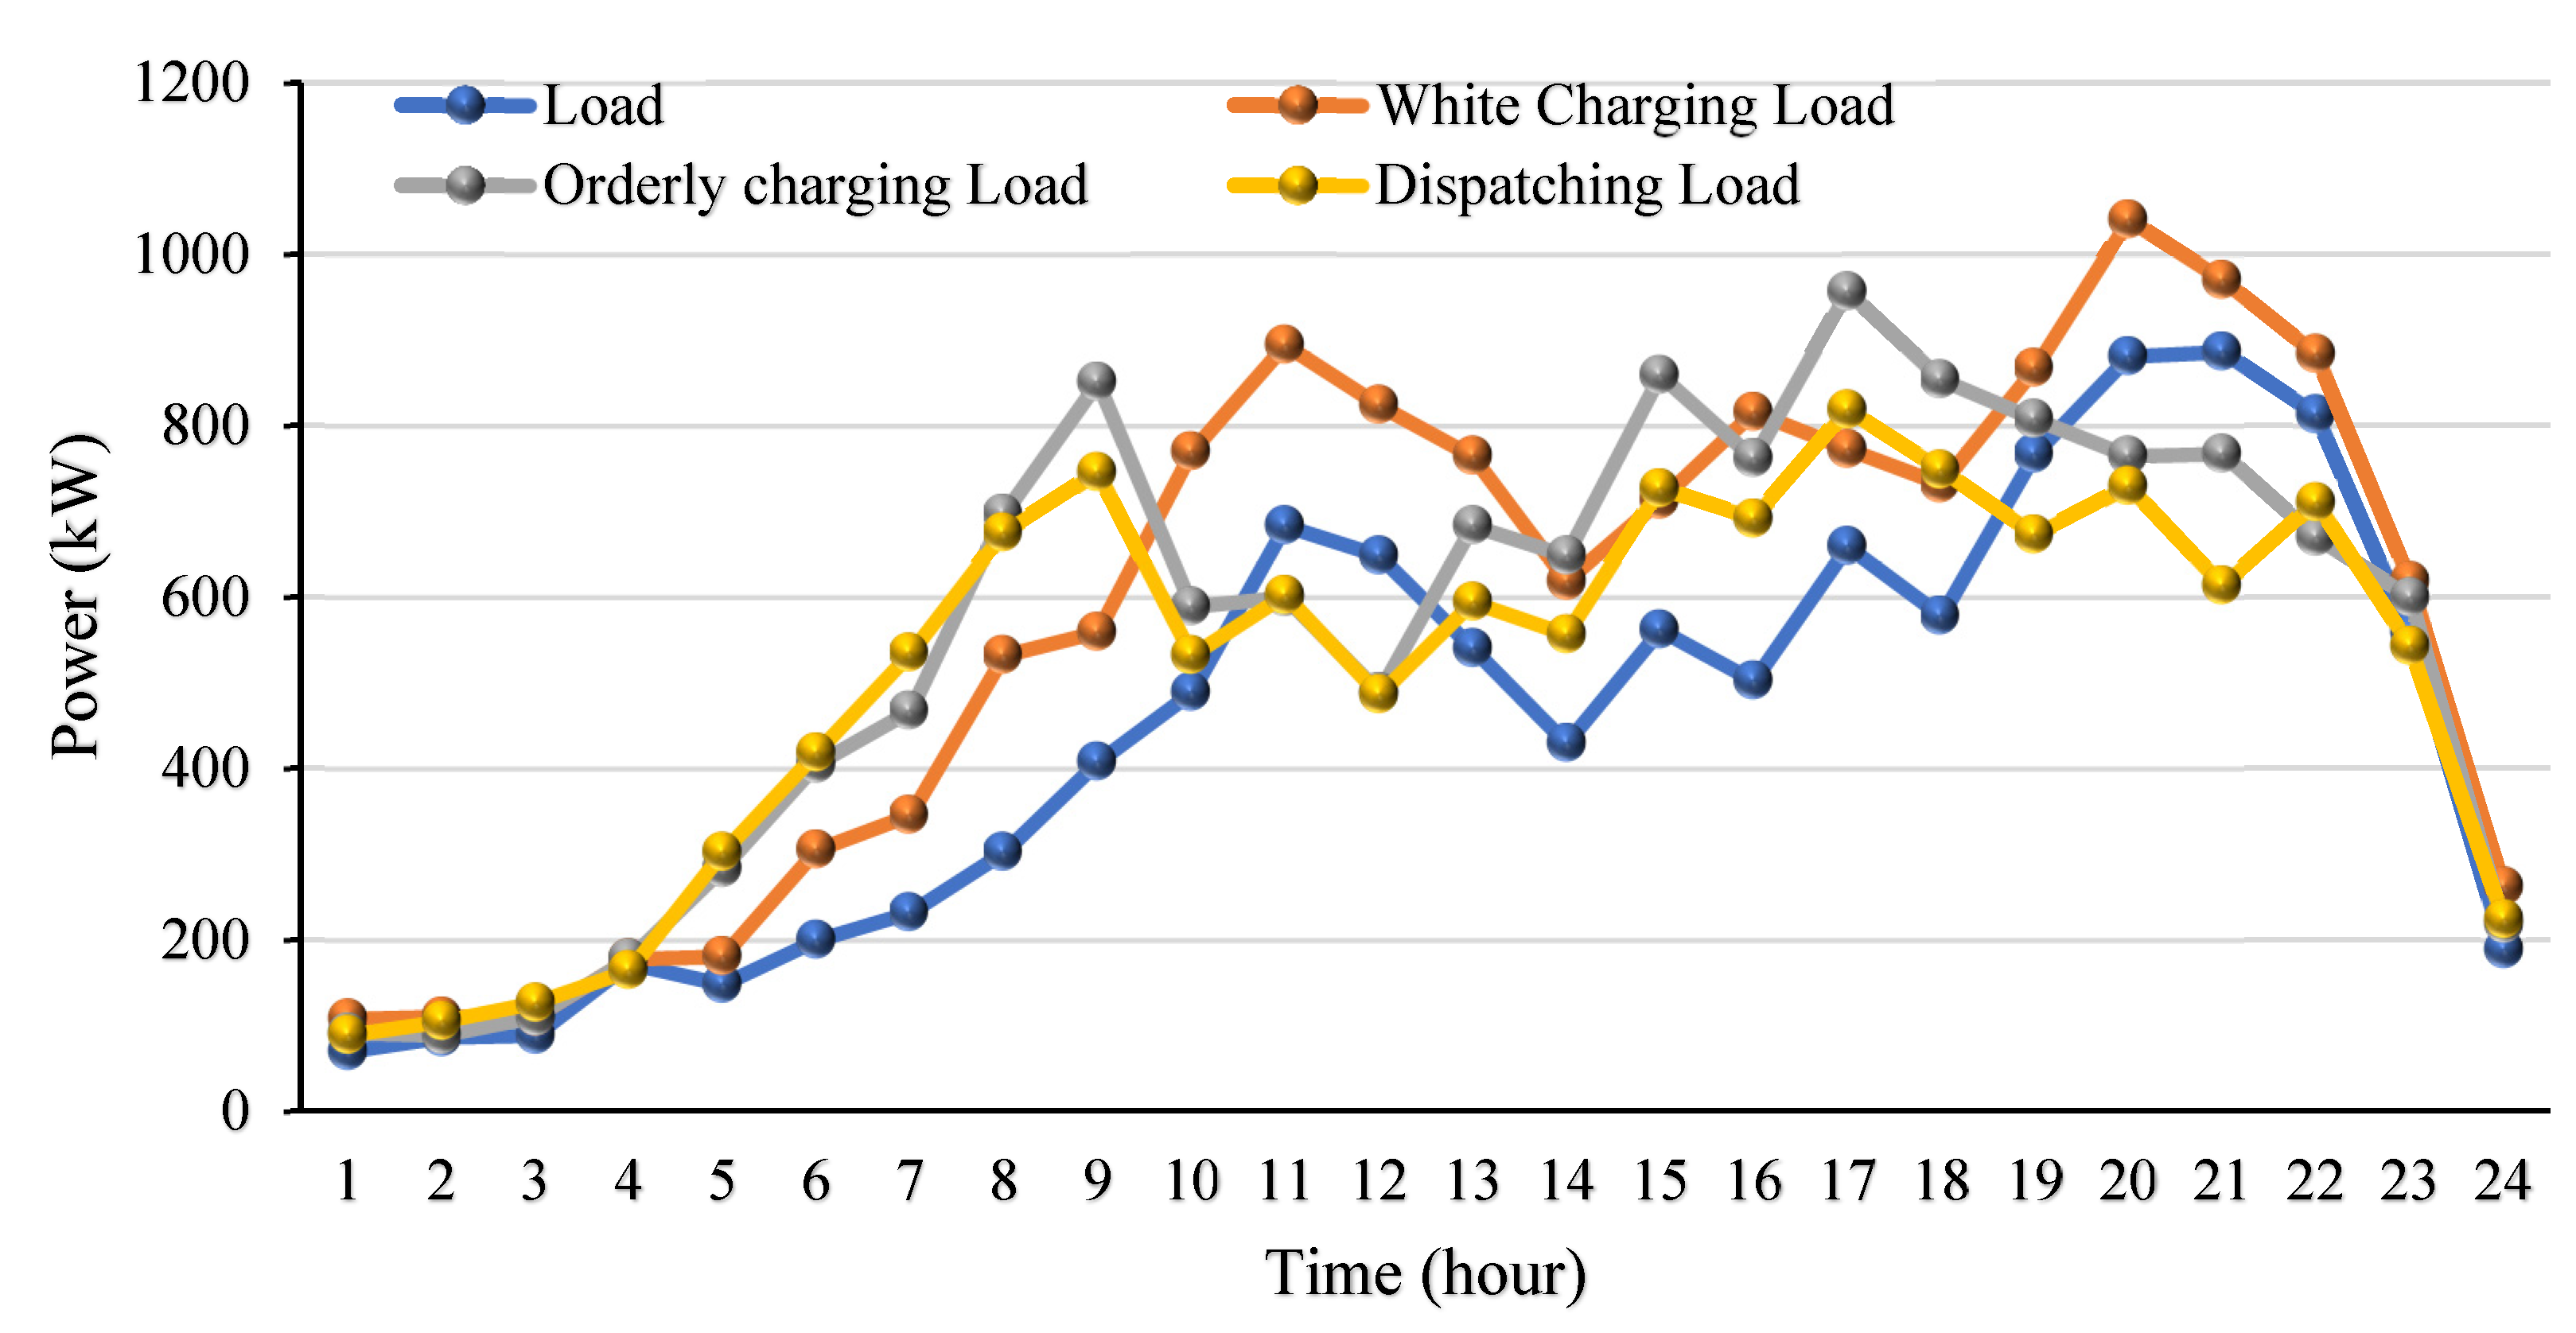
To verify the effectiveness of a large-scale EV response scheduling model in this paper in reducing load volatility, three different EV charging and discharging models are selected: (1) user autonomous charging model; (2) orderly charging and discharging model based on peak-valley time-of-use electricity prices; (3) response scheduling model, using three different charging and discharging models, the total electricity load, including EVs, and the charging and discharging loads were calculated, and the user response degree was set to 100%. The operating results are shown in Figure 4.
In Figure 4, the orderly charge and discharge model based on the peak-valley time-of-use electricity price is shown. The performance of orderly charge and discharge according to the peak-valley time-of-use electricity price information is reduced by 11.6%. Meanwhile, this causes EV users to charge and discharge the MG to generate new electricity (peaks), which makes a new impact on the MG. The response scheduling model guides EVs to charge from and discharge to the MG based on peak-valley time-of-use electricity prices and regional load information. Compared with the user-autonomous charging model and the orderly charge–discharge model of peak-valley time-of-use electricity prices, the variance of load fluctuations is reduced by 25.3% and 15.5%. The response scheduling model improves the smoothness of the regional load.

4.3. Weight Coefficients and Impact of Different Optimization Results

To analyze the influence of different weight coefficients on the optimization results, the table compares the optimization results under five groups of different weight coefficients. Among them, the weight coefficient λ1 in each group has a value of 0, 0.3, 0.5, 0.8, and 1; the weight coefficient λ2 is 1, 0.7, 0.5, 0.2, 0, respectively. According to the optimization results, the statistics of the integrated operation and management costs and load fluctuation variance of the MG in a dispatch period are shown in Table 6.
The MG operation and management, environmental pollution control, load fluctuation variance, and other indicators of cost reach the best operating state to select the appropriate weighting coefficients. Table 6 shows that setting different weight coefficients has an impact on the optimization results. When the weight coefficient λ1 increases, the MG operating costs and environmental pollution cost gradually decrease, and the load fluctuation variance increases with the decrease in the weight coefficient λ2. Table 6 shows the maximum value of MG operation management cost, environmental pollution control cost, and load fluctuation variance as USD 94,099.872 and USD 10,735.098. The minimum values are USD 31,190.257, USD 6976.039, and USD 12.56, respectively. The entropy weight method is used to calculate the weight coefficients of each objective function, and the weight coefficients λ1 and λ2 are 0.589 and 0.421, respectively. Applying the obtained weight coefficients to weigh different objective functions and solving the proposed model, the MG operation management, environmental pollution costs and load fluctuation are USD 31,984.413, USD 76,695.169, and USD 120.236, respectively.

4.4. Controllable Power Generation Unit Output with Different Responsiveness

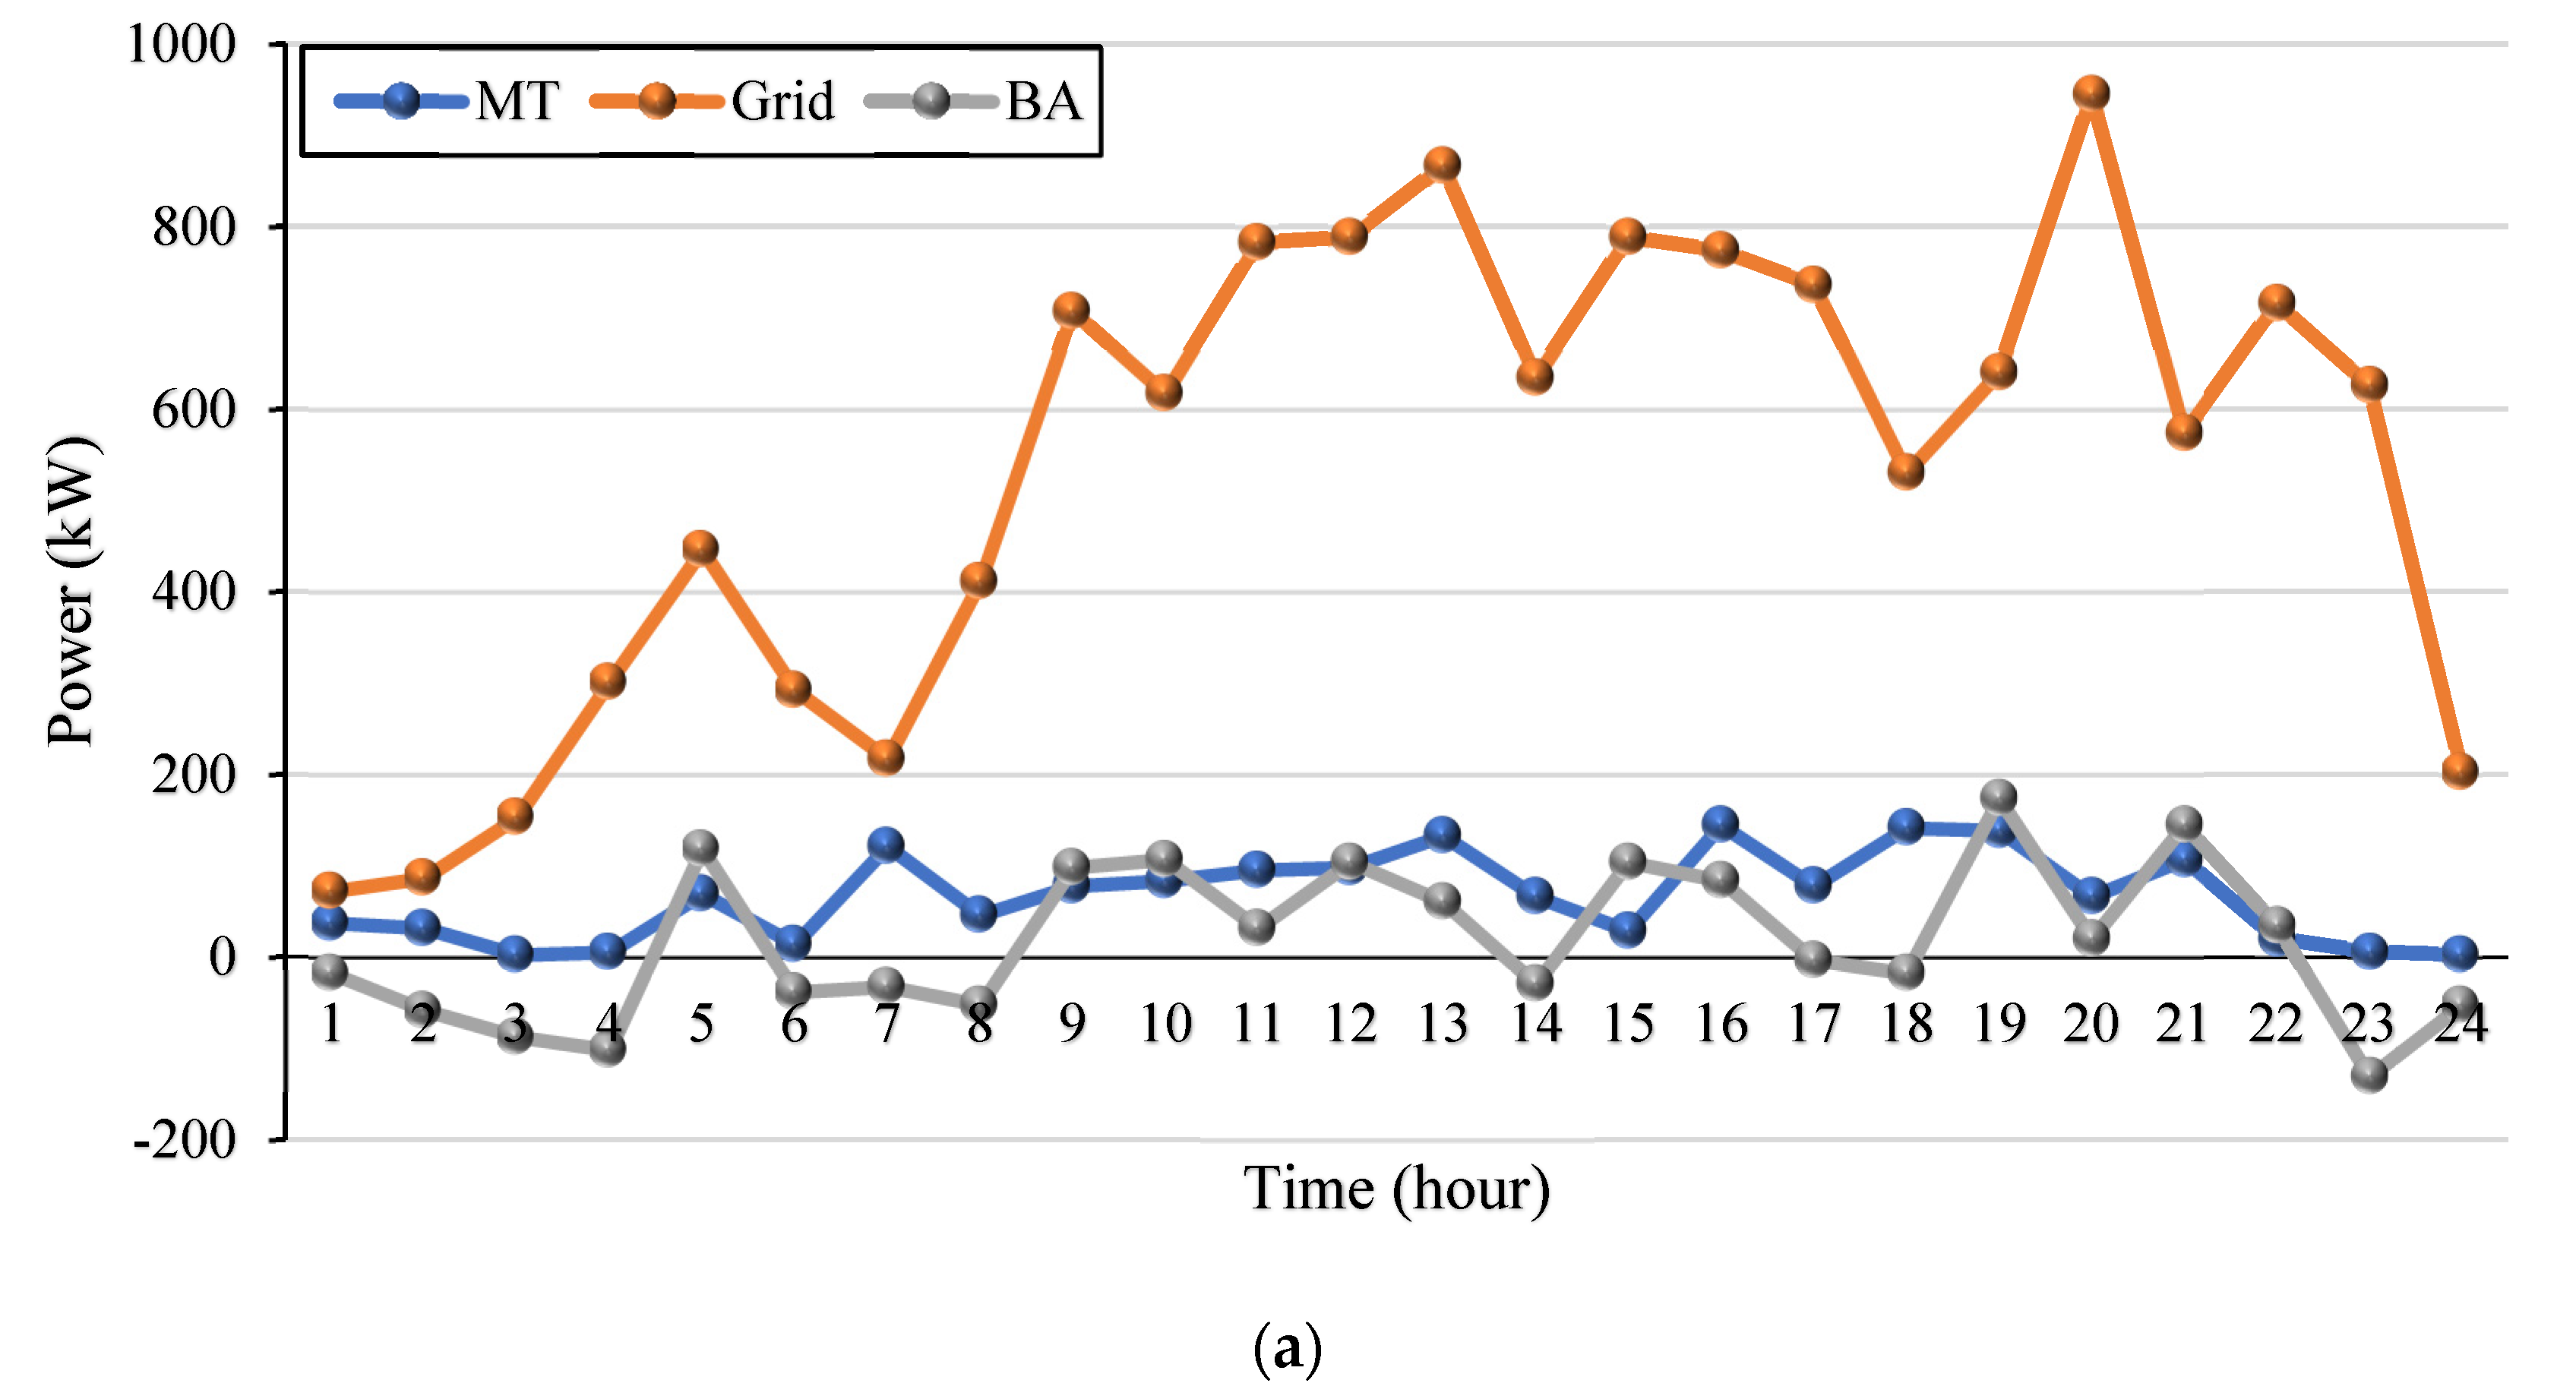
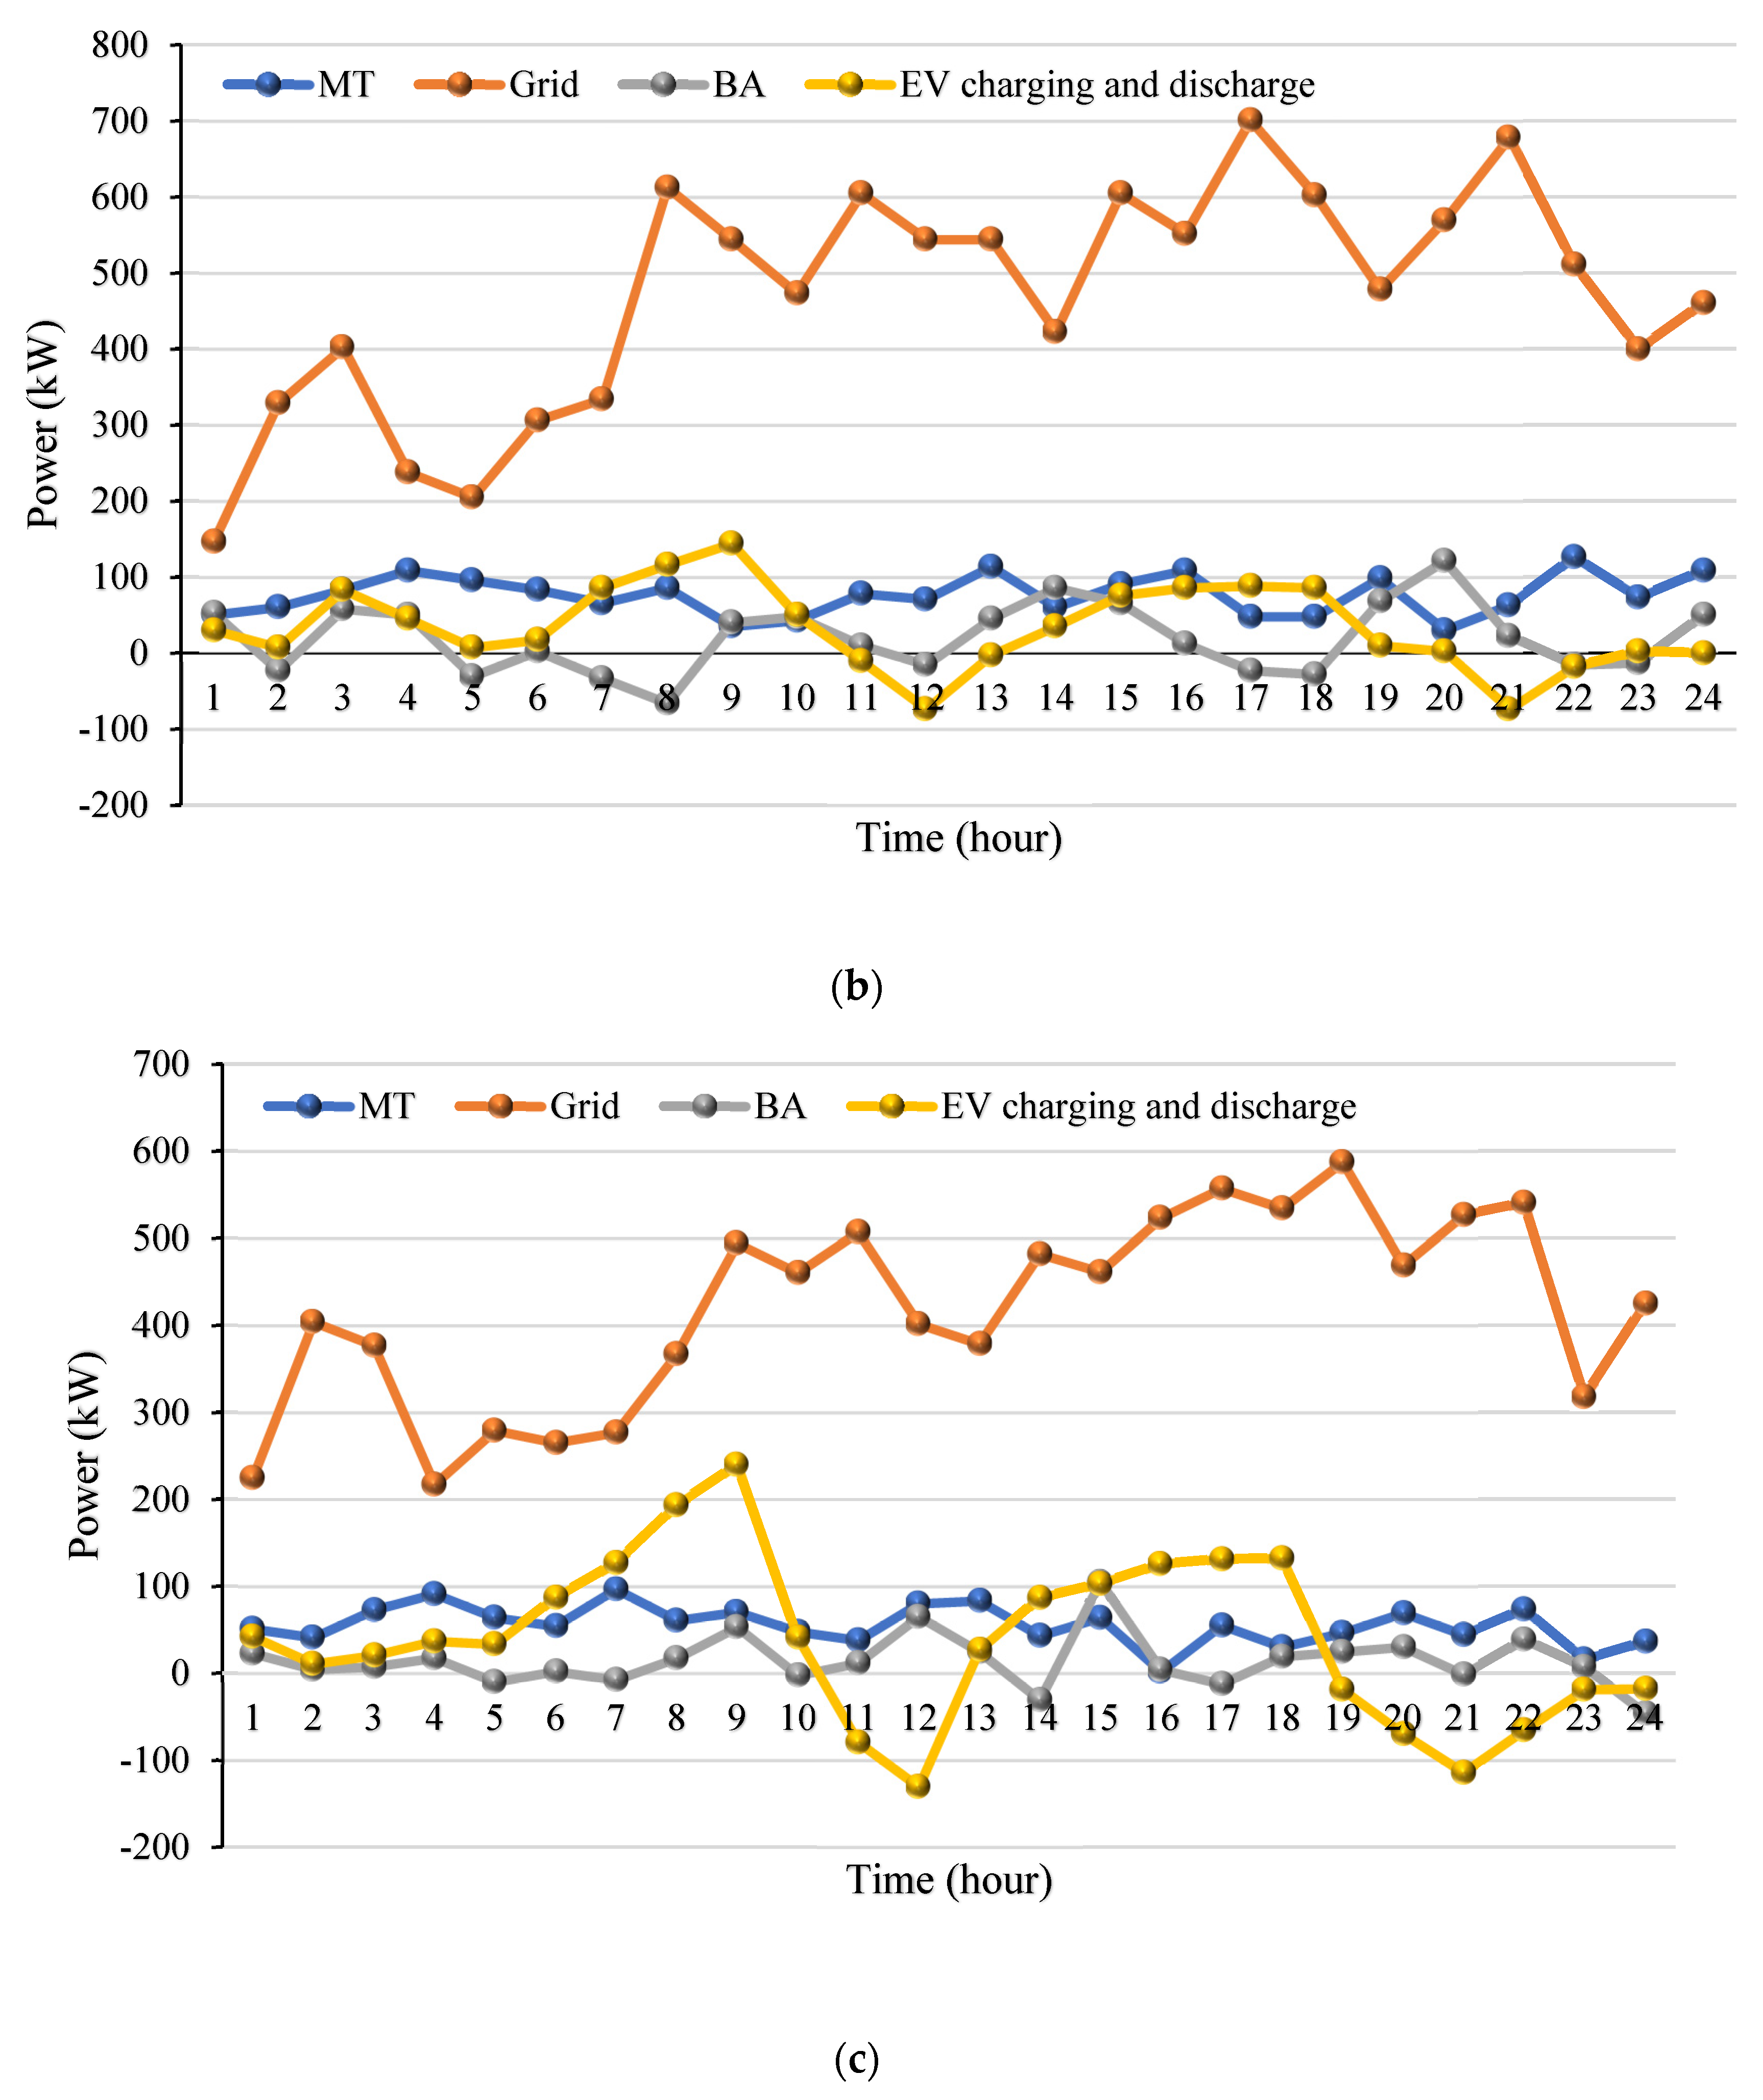
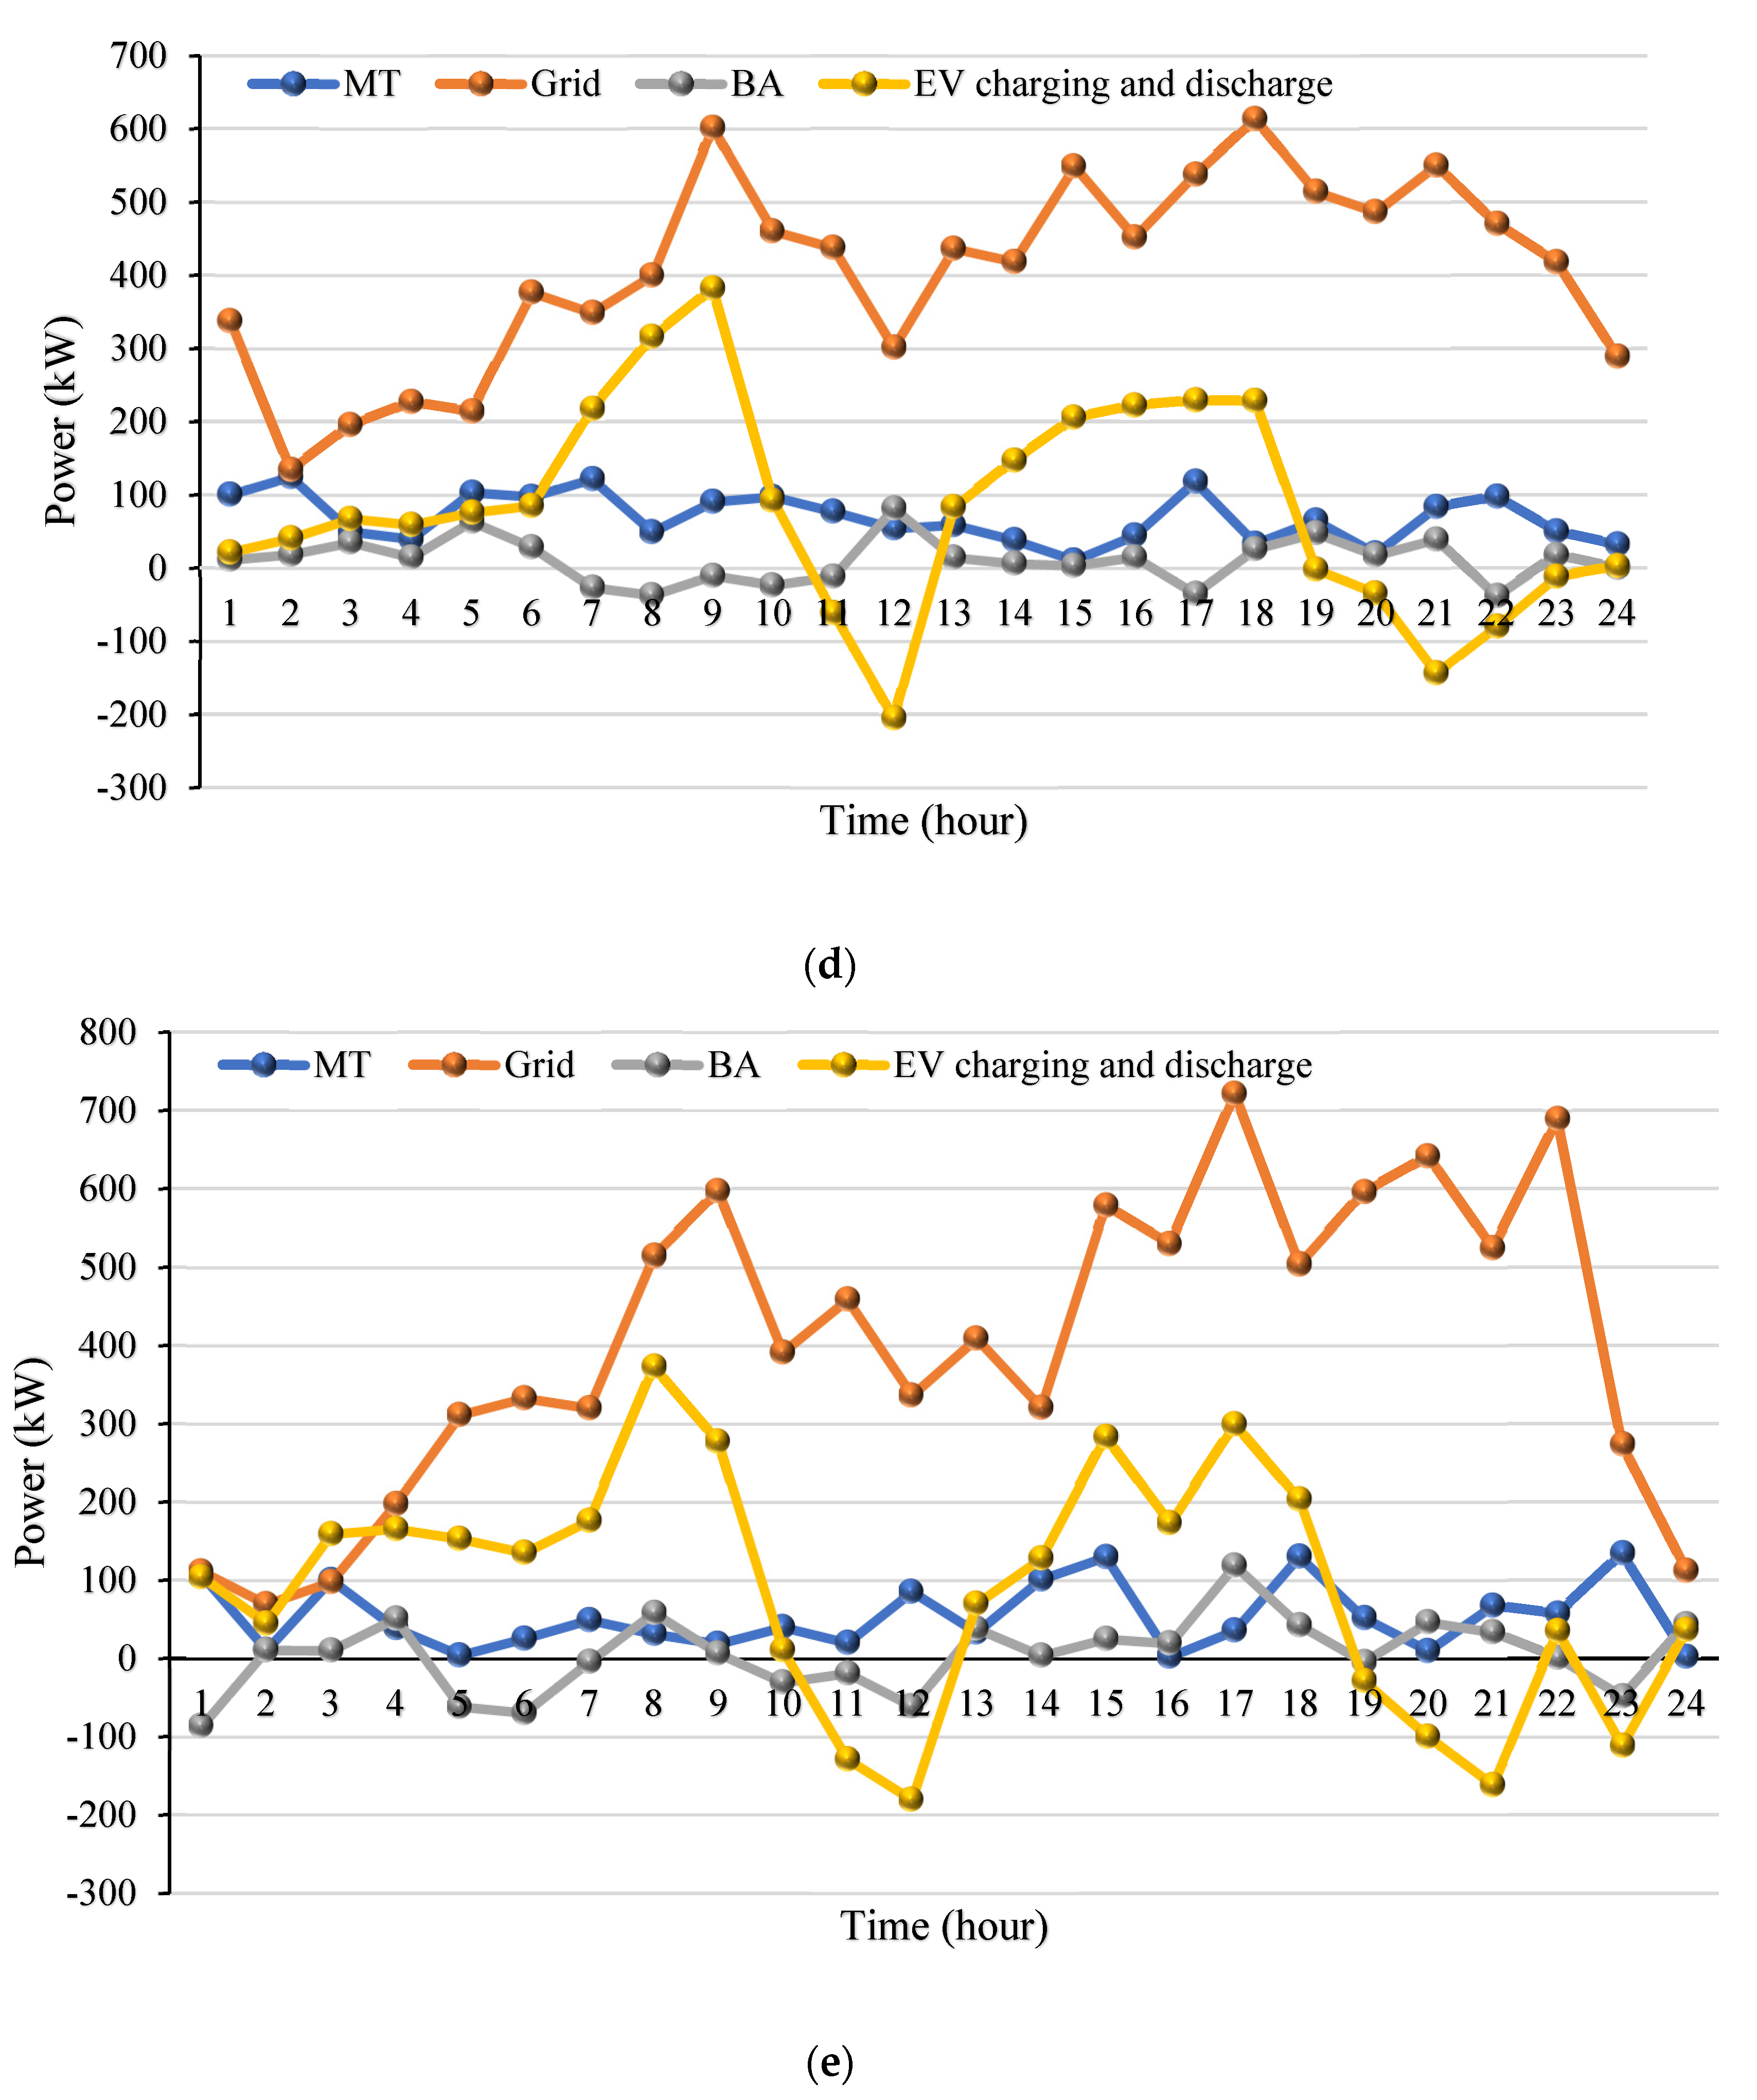
The output of controllable generating units with different responsiveness were studied, and the user responsiveness in the selected area is 0%, 50%, 80%, and 100%, respectively. Figure 5 shows the operation results, and the responses of different users in a dispatch period were counted. The operation management, load fluctuation and the costs of the MG with a high degree are shown in Table 6.
Figure 6 shows the power supply change curve of the large-scale public power grid. During the period 8:00–20:00 large-scale EVs are connected to the MG in disorder, and the power demand of the MG during the peak period of electricity load is sharp. Increasing the amount of power supplied by the large public grid to the MG is likely to cause the large public grid to be overloaded. Figure 6 and Table 7 show the statistical data that when the user responsiveness is between 30% and 80%, as the user responsiveness increases, the operation and management costs of the MG and the environmental pollution control costs are reduced correspondingly, and the variance of load fluctuations is first. Considering the tendency to increase after decreasing when the user response rate is 100%, large-scale EVs are connected to the regional MG for charging and discharging. Due to the limitation of the installed capacity of the regional MG-distributed energy, the demand for electricity in the region increases, leading to the microgrid’s related costs. Correspondingly, at the same time, the variance of load fluctuations increases compared with the variances of load fluctuations with a responsiveness of 50% and 80%.

4.5. Comparison of Different Optimization Algorithms

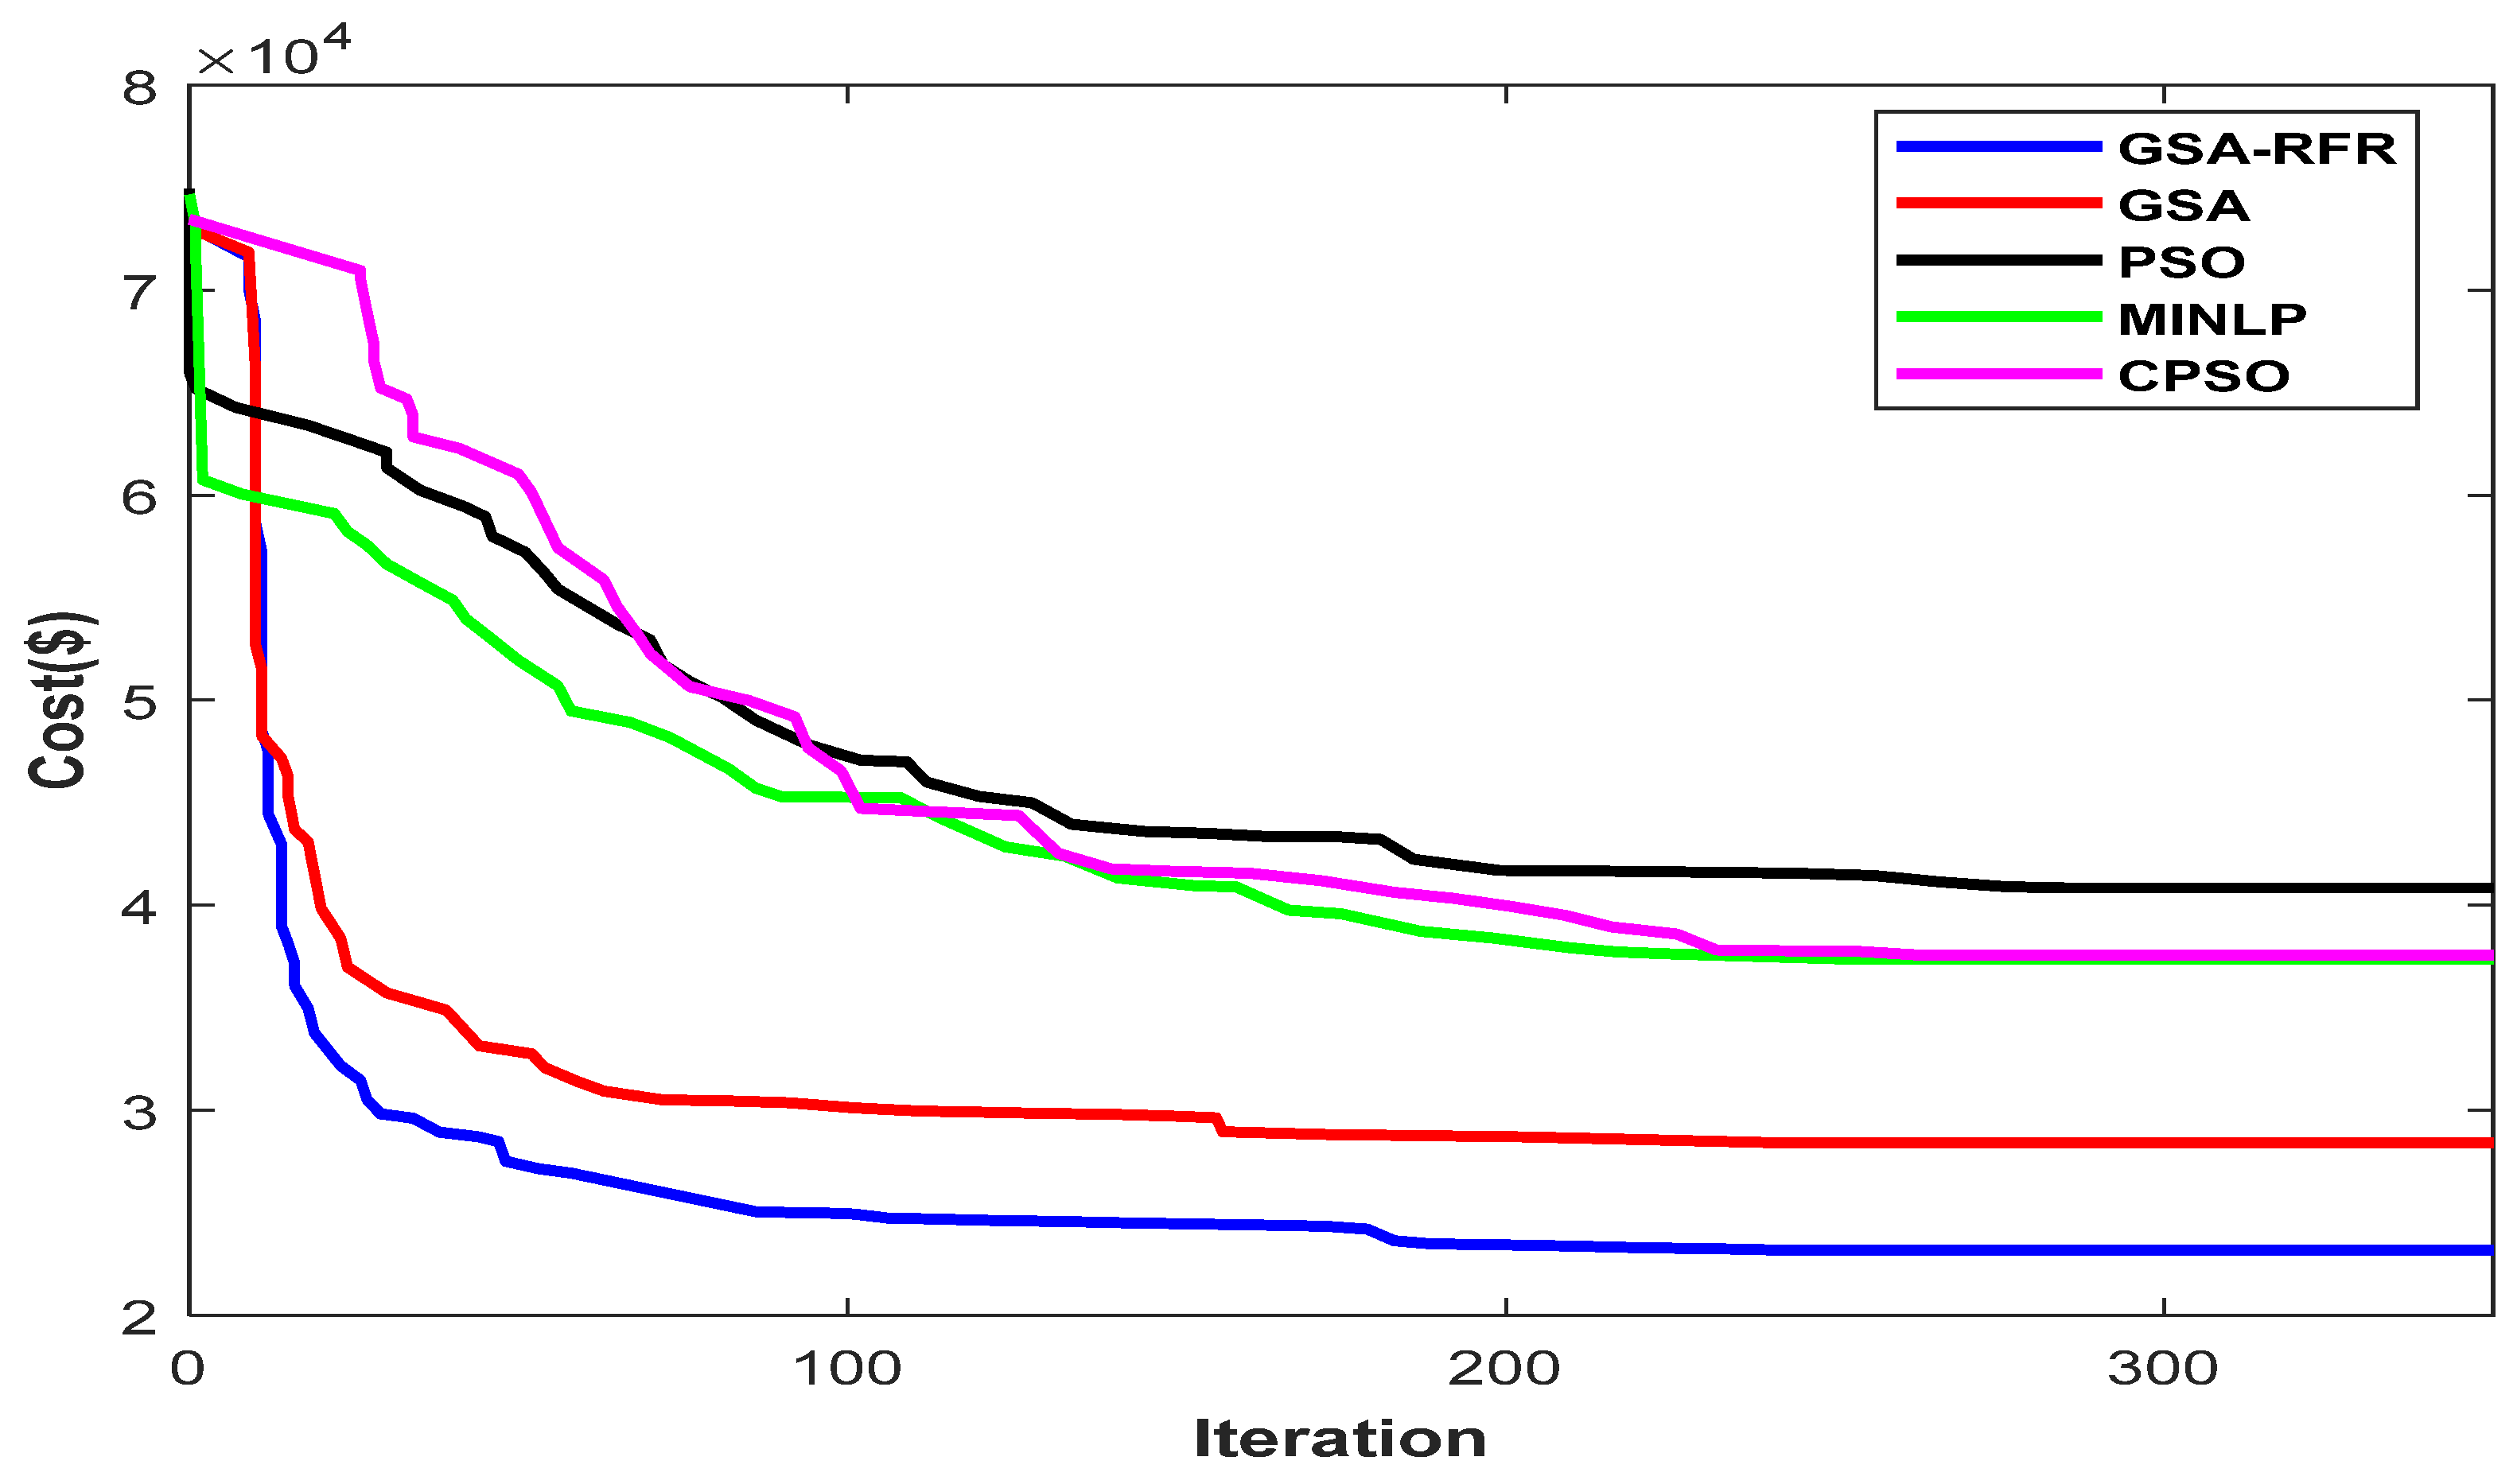
A comparison is made to verify the effectiveness of the GSA-RFR algorithm in solving high-dimensional, non-continuous problems with the multi-constrained optimization problems (MINLP) method, GSA algorithm, CPSO algorithm, and multi-agent PSO algorithm to solve the economic optimization model put forth in this study and contrast the GSA-RFR algorithm’s solution outcomes with the optimization outcomes of various algorithms. The maximum number of iterations is 350, and the population size is 300. Figure 6 depicts the convergence curves of various algorithms.
The PSO method has the fastest convergence speed, as shown in Figure 6, but it is prone to premature phenomena and cannot converge upon the global extreme point. Although the solution time of the MINLP method is not much different from that of the PSO algorithm, its optimization accuracy is better than that of the PSO algorithm. In the CPSO algorithm, the chaotic search strategy is added to improve the global search ability of the algorithm to a certain extent, thereby avoiding falling into local extreme points. Still, its convergence accuracy needs to be improved. The CPSO algorithm requires more iterations and time to achieve convergence in the solution process, but it improves the optimization results. Compared with several optimization methods, the GSA-RFR algorithm integrates a multi-agent system and a chaotic search mechanism to increase its time consumption, but its optimization effect is the best.
Table 8 shows that when the economic optimization model is established, the optimization result’s operating cost, environmental pollution control cost, and load fluctuation variance are minimized. The GSA-RFR algorithm demonstrates good performance in solving high-dimensional, non-continuous, and multi-constrained optimization problems.

5. Conclusions

The goal of developed nations’ research and development efforts is to create greener cities and communities that enhance the state of the environment worldwide and reduce environmental pollution. EVs will play a critical role in energy systems over the coming years, due to their environmental friendliness and capacity to reduce/absorb superfluous power from renewable energy sources. Meanwhile, a large-scale EV charging pile of regional power grids increases the randomness and uncertainty of the load in the concerned area. The proposed study constructed a large-scale EV response dispatch model that significantly improves the load smoothness of the MG after large-scale EVs are connected, and reduces the impact of the entire MG. The weight coefficients λ1 and λ2 were determined as 0.589 and 0.421, respectively, the controllable power generation output scheme unit was best observed, and the operational management, environmental pollution control, and variance of load fluctuations costs were interestingly observed as lowest at USD 31,983.813, USD 76,695.169, and USD 120.236, respectively. The proposed hybridized optimization method directs EV users to charge from and discharge to the regional MG with the presence of renewable energy resources (wind and PV), which improves the economics of the MG and realizes the operation management and environmental pollution regularized to establish a friendly society.
In the future, studies on different scenarios, including the maximum renewable model, the uncoordinated charging model, the load levelling model, and the charging-discharging model, can be used to further enhance EV demand. Additionally, the effects of various electric vehicle (EV) charging/discharging strategies on the costs associated with operation and the removal of pollutants in remote micro-grid (MG) modes are also relevant areas for future study.

Author Contributions

Methodology, writing—original draft preparation, M.S.N.; formal analysis, writing, review and editing, Z.C.; A.N.A., investigation, writing, review and editing, H.K.A., S.M.E., P.B., M.S.J., and A.S.M.M. All authors have read and agreed to the published version of the manuscript.

Funding

This work was funded by the Researchers Supporting Project No.(RSP-2021/363), King Saud University, Riyadh, Saudi Arabia.

Institutional Review Board Statement

Not applicable.

Informed Consent Statement

Not applicable.

Data Availability Statement

Data will be made available on request.

Acknowledgments

The authors would like to acknowledge the technical and related facilities from affiliated institutes/universities. This work was funded by the Researchers Supporting Project No.(RSP-2021/363), King Saud University, Riyadh, Saudi Arabia.

Conflicts of Interest

The authors declare no conflict of interest.

Nomenclature

MGmicro-grid
EVselectric vehicles
MINLPmulti-constrained optimization problems
PSOparticle swarm optimization
DEdifferential evolution algorithm
ICAimperialist competition algorithm
MACPSOmulti-agent chaotic particle swarm optimization
CPSOchaotic particle swarm optimization
DGdistributed generation
N d ( t ) number of EVs that respond to discharge information
N c ( t ) number of EVs that respond to charging information
S O C i , m a x the state of charge
P i , c h the power battery capacity
η C E V charging efficiency
P u n o ( t ) represents the total disordered charging
P r e s E V ( t ) EVs response charge and discharge
P l o a d ( t ) basic electricity load

References

  1. Bibri, S.E. Data-Driven Smart Eco-Cities of the Future: An Empirically Informed Integrated Model for Strategic Sustainable Urban Development. World Futures 2021, 1–44. [Google Scholar] [CrossRef]
  2. Li, J.; Sun, W.; Song, H.; Li, R.; Hao, J. Toward the construction of a circular economy eco-city: An emergy-based sustainability evaluation of Rizhao city in China. Sustain. Cities Soc. 2021, 71, 102956. [Google Scholar] [CrossRef]
  3. Mignoni, N.; Scarabaggio, P.; Carli, R.; Dotoli, M. Control frameworks for transactive energy storage services in energy communities. Control Eng. Pract. 2023, 130, 105364. [Google Scholar] [CrossRef]
  4. Scarabaggio, P.; Carli, R.; Dotoli, M. Noncooperative Equilibrium Seeking in Distributed Energy Systems Under AC Power Flow Nonlinear Constraints. IEEE Trans. Control Netw. Syst. 2022, 1–12. [Google Scholar] [CrossRef]
  5. Nazir, M.S.; Mahdi, A.J.; Bilal, M.; Sohail, H.M.; Ali, N.; Iqbal, H.M.N. Environmental impact and pollution-related challenges of renewable wind energy paradigm—A review. Sci. Total Environ. 2019, 683, 436–444. [Google Scholar] [CrossRef]
  6. Ma, H.; Zhang, C.; Peng, T.; Nazir, M.S.; Li, Y. An integrated framework of gated recurrent unit based on improved sine cosine algorithm for photovoltaic power forecasting. Energy 2022, 256, 124650. [Google Scholar] [CrossRef]
  7. Aziz, S.; Peng, J.; Wang, H.; Jiang, H. ADMM-Based Distributed Optimization of Hybrid MTDC-AC Grid for Determining Smooth Operation Point. IEEE Access 2019, 7, 74238–74247. [Google Scholar] [CrossRef]
  8. Egbue, O.; Uko, C. Multi-agent approach to modeling and simulation of microgrid operation with vehicle-to-grid system. Electr. J. 2020, 33, 106714. [Google Scholar] [CrossRef]
  9. Yao, M.; Molzahn, D.K.; Mathieu, J.L. An optimal power-flow approach to improve power system voltage stability using demand response. IEEE Trans. Control Netw. Syst. 2019, 6, 1015–1025. [Google Scholar] [CrossRef]
  10. Rodrigues, Y.R.; de Souza, A.Z.; Ribeiro, P.F. An inclusive methodology for Plug-in electrical vehicle operation with G2V and V2G in smart microgrid environments. Int. J. Electr. Power Energy Syst. 2018, 102, 312–323. [Google Scholar] [CrossRef]
  11. Suresh, V.; Bazmohammadi, N.; Janik, P.; Guerrero, J.M.; Kaczorowska, D.; Rezmer, J.; Jasinski, M.; Leonowicz, Z. Optimal location of an electrical vehicle charging station in a local microgrid using an embedded hybrid optimizer. Int. J. Electr. Power Energy Syst. 2021, 131, 106979. [Google Scholar] [CrossRef]
  12. Rajamand, S. Vehicle-to-Grid and vehicle-to-load strategies and demand response program with bender decomposition approach in electrical vehicle-based microgrid for profit profile improvement. J. Energy Storage 2020, 32, 101935. [Google Scholar] [CrossRef]
  13. Anastasiadis, A.G.; Konstantinopoulos, S.; Kondylis, G.P.; Vokas, G.A. Electric vehicle charging in stochastic smart microgrid operation with fuel cell and RES units. Int. J. Hydrogen Energy 2017, 42, 8242–8254. [Google Scholar] [CrossRef]
  14. Sattarpour, T.; Nazarpour, D.; Golshannavaz, S. A multi-objective HEM strategy for smart home energy scheduling: A collaborative approach to support microgrid operation. Sustain. Cities Soc. 2018, 37, 26–33. [Google Scholar] [CrossRef]
  15. Tidjani, F.S.; Hamadi, A.; Chandra, A.; Saghir, B.; Mounir, B.; Garoum, M. Energy management of micro grid based electrical vehicle to the building (V2B). In Proceedings of the 2019 7th International Renewable and Sustainable Energy Conference (IRSEC), Agadir, Morocco, 27–30 November 2019. [Google Scholar]
  16. Sadeghian, O.; Oshnoei, A.; Mohammadi-Ivatloo, B.; Vahidinasab, V.; Anvari-Moghaddam, A. A comprehensive review on electric vehicles smart charging: Solutions, strategies, technologies, and challenges. J. Energy Storage 2022, 54, 105241. [Google Scholar] [CrossRef]
  17. Adil, M.; Mahmud, M.P.; Kouzani, A.Z.; Khoo, S. Energy trading among electric vehicles based on Stackelberg approaches: A review. Sustain. Cities Soc. 2021, 75, 103199. [Google Scholar] [CrossRef]
  18. Kumar, A.; Jha, B.K.; Das, S.; Mallipeddi, R. Power flow analysis of islanded microgrids: A differential evolution approach. IEEE Access 2021, 9, 61721–61738. [Google Scholar] [CrossRef]
  19. Venkatesan, K.; Govindarajan, U. Optimal power flow control of hybrid renewable energy system with energy storage: A WOANN strategy. J. Renew. Sustain. Energy 2019, 11, 015501. [Google Scholar] [CrossRef]
  20. Ajithapriyadarsini, S.; Mary, P.M.; Iruthayarajan, M.W. Automatic generation control of a multi-area power system with renewable energy source under deregulated environment: Adaptive fuzzy logic-based differential evolution (DE) algorithm. Soft Comput. 2019, 23, 12087–12101. [Google Scholar] [CrossRef]
  21. Garcia-Guarin, J.; Rodriguez, D.; Alvarez, D.; Rivera, S.; Cortes, C.; Guzman, A.; Bretas, A.; Aguero, J.R.; Bretas, N. Smart microgrids operation considering a variable neighborhood search: The differential evolutionary particle swarm optimization algorithm. Energies 2019, 12, 3149. [Google Scholar] [CrossRef]
  22. Deepa, S.; Selladurai, R.; Chelladurrai, C. Cost minimization in a MicroGrid connected with Wind and PV generations using a hybrid Cat Swarm optimization and micro Differential Evolution. In Proceedings of the 2019 9th International Conference on Power and Energy Systems (ICPES), Perth, WA, Australia, 10–12 December 2019. [Google Scholar]
  23. Moradi, M.H.; Abedini, M.; Hosseinian, S.M. Improving operation constraints of microgrid using PHEVs and renewable energy sources. Renew. Energy 2015, 83, 543–552. [Google Scholar] [CrossRef]
  24. Ikeda, S.; Ooka, R. Application of differential evolution-based constrained optimization methods to district energy optimization and comparison with dynamic programming. Appl. Energy 2019, 254, 113670. [Google Scholar] [CrossRef]
  25. Gholami, K.; Jazebi, S. Multi-objective long-term reconfiguration of autonomous microgrids through controlled mutation differential evolution algorithm. IET Smart Grid 2020, 3, 738–748. [Google Scholar] [CrossRef]
  26. Essiet, I.O.; Sun, Y.; Wang, Z. Optimized energy consumption model for smart home using improved differential evolution algorithm. Energy 2019, 172, 354–365. [Google Scholar] [CrossRef]
  27. Aziz, S.; Wang, H.; Liu, Y.; Peng, J.; Jiang, H. Variable Universe Fuzzy Logic-Based Hybrid LFC Control With Real-Time Implementation. IEEE Access 2019, 7, 25535–25546. [Google Scholar] [CrossRef]
  28. Fattahi, A.; Nahavandi, A.; Jokarzadeh, M. A comprehensive reserve allocation method in a micro-grid considering renewable generation intermittency and demand side participation. Energy 2018, 155, 678–689. [Google Scholar] [CrossRef]
  29. Aslam, S.; Khalid, A.; Javaid, N. Towards efficient energy management in smart grids considering microgrids with day-ahead energy forecasting. Electr. Power Syst. Res. 2020, 182, 106232. [Google Scholar] [CrossRef]
  30. Gholami, K.; Dehnavi, E. A modified particle swarm optimization algorithm for scheduling renewable generation in a micro-grid under load uncertainty. Appl. Soft Comput. 2019, 78, 496–514. [Google Scholar] [CrossRef]
  31. Arcos-Aviles, D.; Pacheco, D.; Pereira, D.; Garcia-Gutierrez, G.; Carrera, E.V.; Ibarra, A.; Ayala, P.; Martínez, W.; Guinjoan, F. A Comparison of Fuzzy-Based Energy Management Systems Adjusted by Nature-Inspired Algorithms. Appl. Sci. 2021, 11, 1663. [Google Scholar] [CrossRef]
  32. Nazari, A.; Keypour, R. Participation of responsive electrical consumers in load smoothing and reserve providing to optimize the schedule of a typical microgrid. Energy Syst. 2020, 11, 885–908. [Google Scholar] [CrossRef]
  33. Mena, R.; Hennebel, M.; Li, Y.-F.; Zio, E. Self-adaptable hierarchical clustering analysis and differential evolution for optimal integration of renewable distributed generation. Appl. Energy 2014, 133, 388–402. [Google Scholar] [CrossRef] [Green Version]
  34. Marzband, M.; Fouladfar, M.H.; Akorede, M.F.; Lightbody, G.; Pouresmaeil, E. Framework for smart transactive energy in home-microgrids considering coalition formation and demand side management. Sustain. Cities Soc. 2018, 40, 136–154. [Google Scholar] [CrossRef]
  35. Garcia-Guarin, J.; Infante, W.; Ma, J.; Alvarez, D.; Rivera, S. Optimal scheduling of smart microgrids considering electric vehicle battery swapping stations. Int. J. Electr. Comput. Eng. 2020, 10, 5093. [Google Scholar]
  36. Cao, Y.; Tang, S.; Li, C.; Zhang, P.; Tan, Y.; Zhang, Z.; Li, J. An optimized EV charging model considering TOU price and SOC curve. IEEE Trans. Smart Grid 2011, 3, 388–393. [Google Scholar] [CrossRef]
  37. Tushar, M.H.K.; Zeineddine, A.W.; Assi, C. Demand-side management by regulating charging and discharging of the EV, ESS, and utilizing renewable energy. IEEE Trans. Ind. Inform. 2017, 14, 117–126. [Google Scholar] [CrossRef]
  38. Bewley, S.K. The Potential Market Applications of Distributed Generation of Electricity; Massachusetts Institute of Technology: Cambridge, MA, USA, 2002. [Google Scholar]
  39. Rashedi, E.; Nezamabadi-Pour, H.; Saryazdi, S. GSA: A gravitational search algorithm. Inf. Sci. 2009, 179, 2232–2248. [Google Scholar] [CrossRef]
  40. Duman, S.; Sönmez, Y.; Güvenç, U.; Yörükeren, N. Optimal reactive power dispatch using a gravitational search algorithm. IET Gener. Transm. Distrib. 2012, 6, 563–576. [Google Scholar] [CrossRef]
  41. Shin, D.-K.; Lee, J.J. Analysis of asymmetric warpage of thin wafers on flat plate considering bifurcation and gravitational force. IEEE Trans. on Compon. Packag. Manuf. Technol. 2014, 4, 248–258. [Google Scholar] [CrossRef]
  42. Johannesen, N.J.; Kolhe, M.L.; Goodwin, M. Smart load prediction analysis for distributed power network of Holiday Cabins in Norwegian rural area. J. Clean. Prod. 2020, 266, 121423. [Google Scholar] [CrossRef]
  43. Midenet, S.; Boillot, F.; Pierrelée, J.-C. Signalized intersection with real-time adaptive control: On-field assessment of CO2 and pollutant emission reduction. Transp. Res. Part D Transp. Environ. 2004, 9, 29–47. [Google Scholar] [CrossRef]
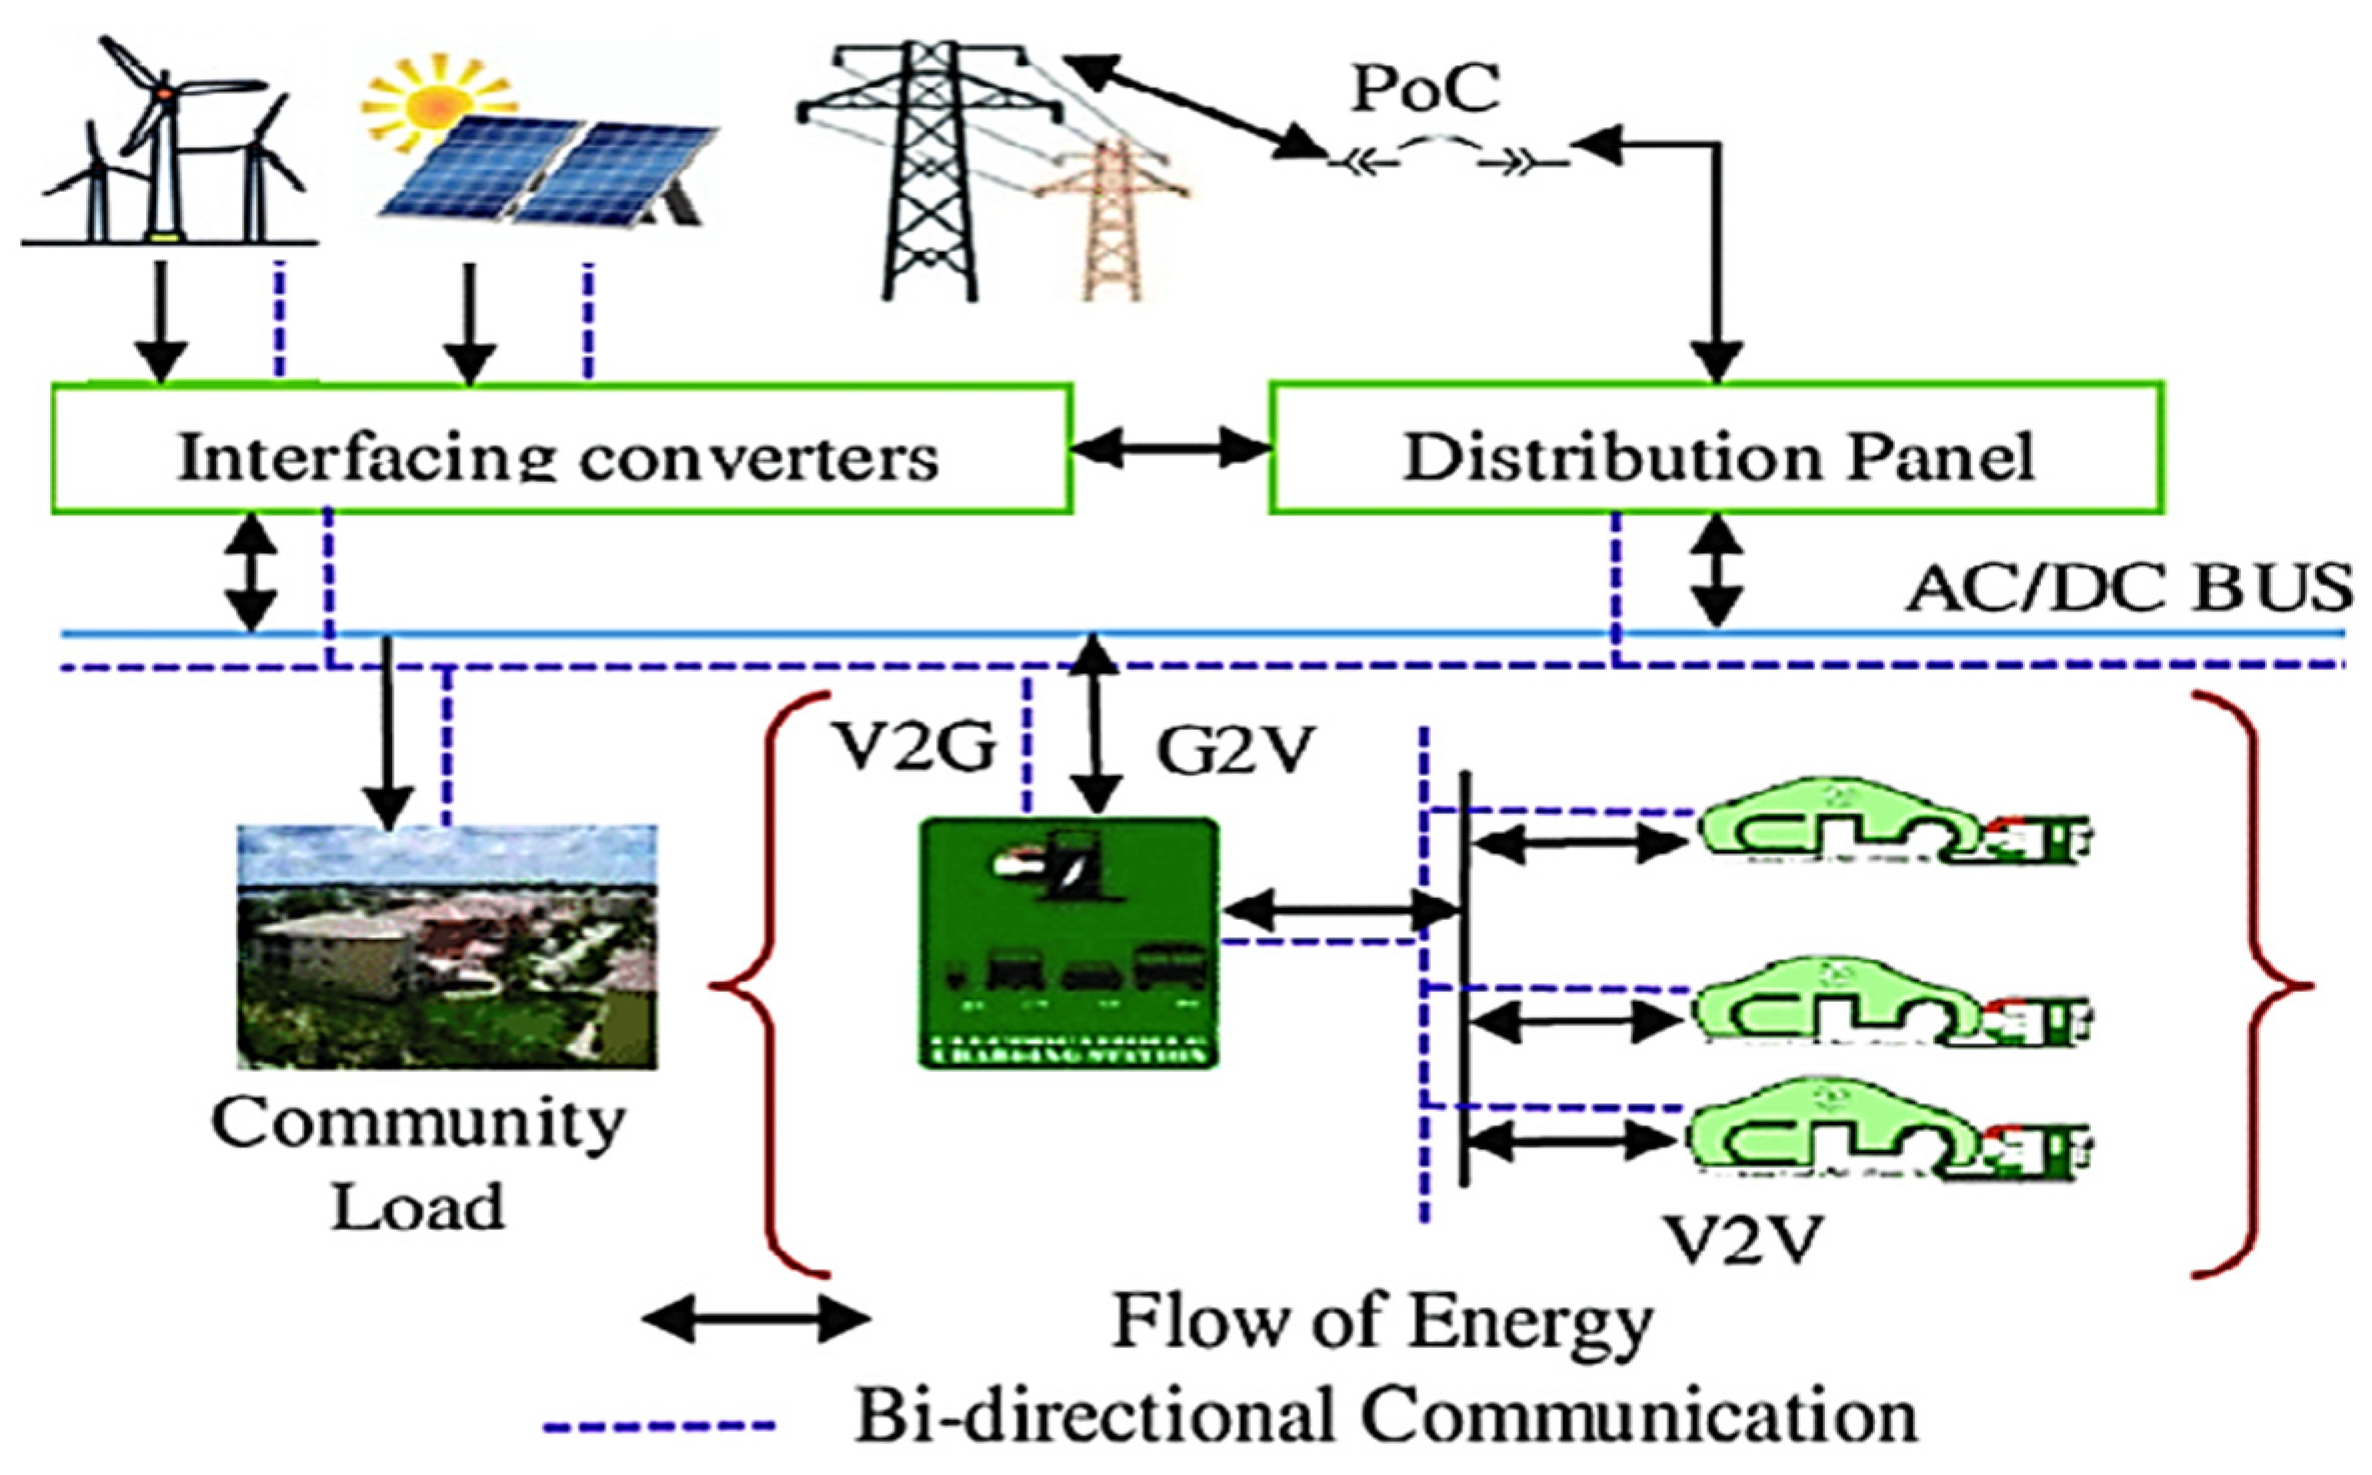
Figure 1. Layout of large-scale EV response to MG dispatch.
Sustainability 14 16172 g001
Figure 2. MG operation-based hybridized GSA-RFR algorithm.
Sustainability 14 16172 g002
Figure 3. Typical wind and PV power generation forecast curve in the area.
Sustainability 14 16172 g003
Figure 4. The operation results of MG with different loads.
Sustainability 14 16172 g004
Figure 5. The planned output of controllable power generation units with different user responsiveness; (a) 0% of the planned output of controllable generating units, (b) 30% of the planned output of controllable power generation units, (c) 50% of the planned output of controllable power generation units, (d) 80% of the planned output of controllable power generation units, (e) 100% controllable power generation unit planned output.
Sustainability 14 16172 g005aSustainability 14 16172 g005bSustainability 14 16172 g005c
Figure 6. Convergence curves of different optimization algorithms.
Sustainability 14 16172 g006
Table 1. Charging power rating of piles.
CasesCase1Case2Direct Current
Power (kW)1.4–35–1025–180
Table 2. Parameters of each power generation unit, generation cost, and maintenance cost.
ResourcePower Range (kW)Generation Cost (USD/kWh)Maintenance Cost (USD/kWh)
BSS−150~1500.680.08439
WT0.100~0.390.0096
PV0.75~0.560.0012
MT20~1500.410.0401
Table 3. Environmental costs and pollutant emission coefficient.
Contaminant TypeControl Costs (USD/kg)Pollutant Emission Factor (kWh)
GridMTWTPV
CO20.2188972400
SO214.8421.80.003600
NOx62.9441.60.200
Table 4. Local time-of-use electricity price list.
Period (Time)PeakNormalValley
10:00–15:00
19:00–22:00
7:00–9:00
16:00–18:00
1:00–6:00
23:00–24:00
Electricity price (USD/kWh)1.560.70.43
Purchase price (USD/kWh)0.750.430.14
Table 5. Electric vehicle parameters.
CategoryBattery Capacity (kWh)SOC Limit (%)Charge and Discharge Power Limit (kW)Charge and Discharge Efficiency (%)
Value52.520/90500.95
Table 6. Comparison of optimization results of different weight coefficients.
Weight CoefficientMG Operation Costs (USD)Environmental Pollution Costs (USD)Load Fluctuation Variance
194,099.87210,735.09812.56
242,739.8698585.70686.68
336,717.1978081.684118.62
431,347.5127632.539126.76
531,190.2576976.039285.38
Table 7. Comparison of MG indicators for different user responsiveness.
ResponsivenessMG Operating Costs (USD)Environmental Pollution Treatment Costs (USD)Load Fluctuation
0%45,454.2159467.724253.71
30%37,967.2858760.162144.13
50%31,690.2067881.186114.24
80%28,655.7597836.853130.19
100%35,750.1627972.188196.15
Table 8. Comparison of optimization results of different optimization algorithms.
AlgorithmsMG Operation Costs (USD)Environmental Pollution Control Expenses (USD)Variance of Load FluctuationSolution Running Time (s)
GSA-RFR48,974.3868986.562236.45296.7
GSA45,499.6858654.639214.32307.5
MINLP43,875.7548579.546196.53314.3
CPSO32,497.1797608.743184.65375.6
PSO28,785.4786937.591132.36509.8
Publisher’s Note: MDPI stays neutral with regard to jurisdictional claims in published maps and institutional affiliations.