Article

Habitat Quality Assessment in the Yellow River Delta Based on Remote Sensing and Scenario Analysis for Land Use/Land Cover

1
School of Geography and Tourism, Qilu Normal University, Jinan 250020, China
2
School of Geography and Environment, Shandong Normal University, Jinan 250014, China
3
Yantai Institute of Coastal Zone Research, Chinese Academy of Sciences, Yantai 264003, China
4
Shandong Provincial Institute of Land Surveying and Mapping, Jinan 250102, China
*
Author to whom correspondence should be addressed.
Sustainability 2022, 14(23), 15904; https://doi.org/10.3390/su142315904
Submission received: 24 October 2022 / Revised: 22 November 2022 / Accepted: 25 November 2022 / Published: 29 November 2022
(This article belongs to the Section Sustainability, Biodiversity and Conservation)

Abstract

:
Land Use/Land Cover (LULC) change is one of the core features of global change. Habitat quality is an essential representation of ecosystem service functioning and ecosystem health. It is of great significance to assess the habitat quality spatiotemporal heterogeneity caused by land-use change in the regional ecological environment for security and sustainable regional management. Based on the interpreted LULC data of the Yellow River Delta (YRD) in 2000, 2010, and 2020, the PLUS model was used to forecast different LULC 2030 scenarios. Specifically, this study aimed to analyze the LULC change in the YRD and use the InVEST model to evaluate the overall habitat quality in the historical period of the region and future scenarios. From 2000 to 2020, the most critical land-use changes within a 20 km radius from the coastline in the study area are mainly the sharp increase in construction land, mariculture and salt pan, and the sharp decline of coastal wetlands, which is mainly due to the high intensity of human development activities and the process of erosion and deposition in coastal zones and estuarine deltas. During the period, the average habitat quality in the YRD decreased yearly, with the overall regional habitat quality classified as intermediate. The habitat quality was the most significant in the 0–20 km range from the coastline because of the high intensity of human development activities in this area. The habitat quality in the YRD varied under different scenarios in 2030. In the baseline scenario (BS) and socio-economic development (SD) scenario, the habitat quality decreased continuously, but the habitat quality increased under the ecological protection (EP) scenario. This research can provide relevant scientific references for optimizing landscape patterns and improving habitat quality in the YRD region.

1. Introduction

Habitat refers to the ecological environment on which species or groups depend for survival, including the necessary living conditions and other environmental factors (i.e., climate, topography, soil, etc.) [1]. Habitat quality refers to the ability of the ecological environment to provide suitable conditions for the sustainable survival and development of individuals, populations, and/or communities. It is an important reflection of biodiversity and the level of its ability depends on the abundance of natural resources provided for the survival, reproduction, and development of organisms [2]. With the increasing human population and rapid economic growth, the breadth and depth of land use by human activities increased, especially with the acceleration of industrialization and urbanization processes. These processes resulted in the gradual deterioration of habitat environments, causing habitat fragmentation and degradation and, eventually, habitat loss. The effects upon the flow of materials and energy between the habitat patches lead to impacts on habitat quality that significantly affect the habitat of organisms [3]. Habitat quality degradation attracts significant attention from the international community, government organizations, and researchers. Therefore, the assessment, simulation, and prediction of the status, trend, and impact of habitat quality on human well-being is now one of the hot topics in current ecological and geographical research [4].
The current research methods on habitat quality can be roughly divided into two categories [4,5]. In the first evaluation method, traditional ground data and habitat quality parameters are acquired through transects or sampling methods to construct an evaluation system index. This method is primarily used in from small to medium spatial scales and was used to evaluate the habitat quality of single species, such as Ailuropoda melanoleuca [6], white-lipped deer [7], Cebus capucinus [8], Grus japonensis [9], and so on. Different land use/land cover (LULC) changes in the world often directly lead to regional habitat quality changes. For example, agricultural expansion [10], urban expansion [11,12], and engineering projects in different regions [13,14,15] of the world lead to the decline of habitat quality caused by the LULC change. The other method is based on model assessment, such as the maximum entropy (MaxEnt) model [7,16] and the InVEST model [17,18]. These methods are based on the LULC data for large spatial scales. They are used to analyze the impact of land-use change, urban expansion areas, coastal zone, watershed, the transition zone of the natural regions, and simulating historical periods or predicting future habitat quality.
Recently, the gradual development and application of mathematical modeling methods and the 3S technology, especially the InVEST model, allowed the development of several studies regarding the habitat quality at national, provincial, and watershed scales, focusing on the influence between land use and habitat quality in diversity hot spots [4]. The land-use change will directly affect the habitat type, which will become a critical factor affecting habitat quality. The study of habitat quality evolution law under land-use changes significantly improves the regional ecological environment and helps construct ecological security patterns.
Located in a land–sea interaction zone, the coastal wetland is one of the global environmental change buffer zones and it is often occupied by several human activities [19]. In the context of environmental change and high-intensity human development, the number of coastal wetlands continues to decrease, their species diversity is reduced, and their ecological functions continue to degrade. Consequently, the ecological security of coastal areas is seriously threatened [20,21]. The Yellow River Delta (YRD) is sensitive to environmental change (i.e., climate change, sea-level rise and fall, river migration, etc.) and prone to environmental disasters (i.e., seawater intrusion, storm surge, etc.). This area is also mineral-rich (i.e., oil and gas, sea salt, etc.) and has a high-intensity human development zone, with the reclamation of offshore fields, port construction, and petroleum and salt chemical exploration, etc. Based on the land-use data and future multi-scenarios simulation results, the InVEST model was used to study and analyze habitat quality changes caused by the LULC change in the YRD. How much habitat quality in the YRD has declined as a result of the LULC change over the past 20 years. Under different scenarios in the future of 2030, which scenario is more conducive to the sustainable development of the YRD.

2. Study Area

The YRD is an alluvial plain formed by the Yellow River, which carries many sediments deposited in the Bo Hai depression, composed of the ancient, modern, and contemporary YRD [22,23]. The YRD is located in the Yellow River estuary, at the south of the Bo Hai Bay, and the west of the Laizhou Bay, between 118°07′–119°23′ E and 36°55′–38°16′ N [24].
The YRD has a warm temperate semi-humid continental monsoon climate with four distinct seasons; it is cold in winter and hot in summer [25]. The average annual temperature is 11.7–12.6 °C and 70% of the rainfall is distributed in summer. The average annual rainfall is 530–630 mm and the average annual sunshine hours range between 2590 and 2830 h. Finally, the average evapotranspiration ranges from 750 to 2400 mm [26,27].
The regular siltation, extension, elevation, swing, and diversion of the Yellow River formed the YRD, with a micro-topography dominated by abandoned riverbeds, overlapping new and old channels, the interweaving of hills, slopes, and depressions. The YRD soil types are dominated by fluvo-aquic and saline soils [28]. The YRD region contains abundant oil, natural gas, brine, salt ore, and geothermal resources, being the second-largest Chinese oil production base and providing powerful resources support for the economic and social development of China [29].
The YRD is one of the most representative estuary wetland areas worldwide with various wetland ecosystems and species, an essential breeding and wintering area for birds [30]. The YRD Nature Reserve form two of the Earth’s warm temperate regions, the most complete, widest, youngest, and most typical new wetland ecosystem internationally recognized as “an important wetland area”.
According to the research needs and the actual situation of the research area, the YRD is defined: its land area is bounded by administrative divisions, including the entire Dongying City and Shouguang City, while the shallow waters are bounded by a negative 6 m isobath (Figure 1).

3. Data and Methods

3.1. Data Sources

There are two remote sensing image interpretation types: visual interpretation and computer interpretation [31]. The computer classification methods of the LULC mainly include supervised/unsupervised classification, decision tree classification, object oriented classification, deep learning, and so on [32]. For the remote sensing images with higher resolutions, the phenomenon of “foreign object homogeneity, homologous heterogeneous spectrum” can easily cause misjudgment [33]. Visual interpretation can intuitively judge the surface features and types of the image and extract and analyze the feature information in remote sensing images through visual observation, comprehensive analysis, logical reasoning, verification, and inspection, according to professional background knowledge [34]. Therefore, this study uses a visual interpretation method to interpret the land use of the YRD. Establishing the YRD LULC classification system and the medium- and high-resolution remote sensing image interpretation marks (GF2, SPOT, Landsat, Sentinel-2, etc.) is crucial for the LULC interpretation. The LULC patterns found in the YRD region were previous classified by institutional organizations, national regions, and classification systems from relevant scholars [35,36,37,38,39]. These previous classification processes combined the environmental characteristics of the region and considered the feasibility of visual interpretation of remote sensing data. Based on those land classification events, the LULC types found in the YRD region are divided into ten categories: construction land, farmland, forest, grassland, inland waters, coastal saltwater, salt pan, mariculture, unused land, and shallow water. Based on the LULC classification system and remote sensing image interpretation marks from the YRD obtained with ArcGIS 10.1 software and a visual interpretation method, the LULC vector data sets of four periods from 2000 to 2020 were obtained. The LULC data accuracy for the four periods is relatively high, the overall accuracy is higher than 91%, and the Kappa coefficient is more than 0.90.

3.2. Forecasting Future LULCs under Multiple Scenarios

The patch-generating land use simulation (PLUS) model [40] is a robust future land-use simulation model that makes land-use changes simulations more convenient and efficient. The latest version of the PLUS software (PLUS v1.4 boxed.exe) and its user’s manual are provided at https://github.com/HPSCIL/Patch-generating_Land_Use_Simulation_Model, accessed on 5 October 2022. The PLUS model has been widely used in land use/cover change simulation [41], carbon storage prediction [42], ecosystem service assessment [43], urban expansion [44], and other fields.
The PLUS model was used to project future LULCs of the YRD region in 2030. The primary process was as follows: for future simulations, three scenarios were established: the baseline scenario (BS), the socio-economic development (SD) scenario, and the ecological protection (EP) scenario. Under the BS scenario, the LULC would develop according to the original trend without any other restrictions. Under the SD scenario, the pursuit of economic interests, rapid social development, and high-intensity development activities have led to the dramatic expansion of construction land and salt pan aquaculture land. Under the EP scenario, the protection of ecological sources has attracted more and more attention and a series of ecological protection measures and projects have been implemented, resulting in the increase in ecological land. The LULC demands were predicted by modifying the probability transition matrix concerning the related research and policies. The LULCs development potential maps were calculated based on the 2010 and 2020 LULC data and the spatial driving factors (i.e., DEM, slope, rainfall, temperature, proximity to a town, proximity to traffic, proximity to a water system, proximity to the coastline) with the use the rule-mining framework, based on the land expansion analysis strategy from the PLUS model. Besides, these LULCs conversion restriction matrices were established according to different scenarios. Finally, the CA based on multiple random seeds (CARS) with the PLUS model was used to simulate the spatial distribution data of LULCs under multiple scenarios in 2030.

3.3. Habitat Quality Assessment

Because the InVEST model has a strong advantage in evaluating habitat quality, this study uses this model to calculate the habitat quality of the YRD based on land-use data. According to the relevant research results, the weight, maximum impact distance, and degradation type of threat factors were determined, including construction land [17,45], salt pan [46,47], mariculture [27,48], cultivated land [49,50], and unused land [27,51] (Table 1). Based on the relevant research results of the relative sensitivity of different habitats to threat sources [3,51,52] and combined with the InVEST model instructions [53], the habitat suitability of different land-use types and the relative sensitivity of each habitat type to each threat were determined (Table 2). The calculated scoring value of the habitat quality ranged from 0 to 1 and the higher value indicated a better habitat quality and more stable ecological structure [53,54].

4. Results

4.1. Characteristics of Land Use/Cover Change

4.1.1. Spatiotemporal Change of LULCs

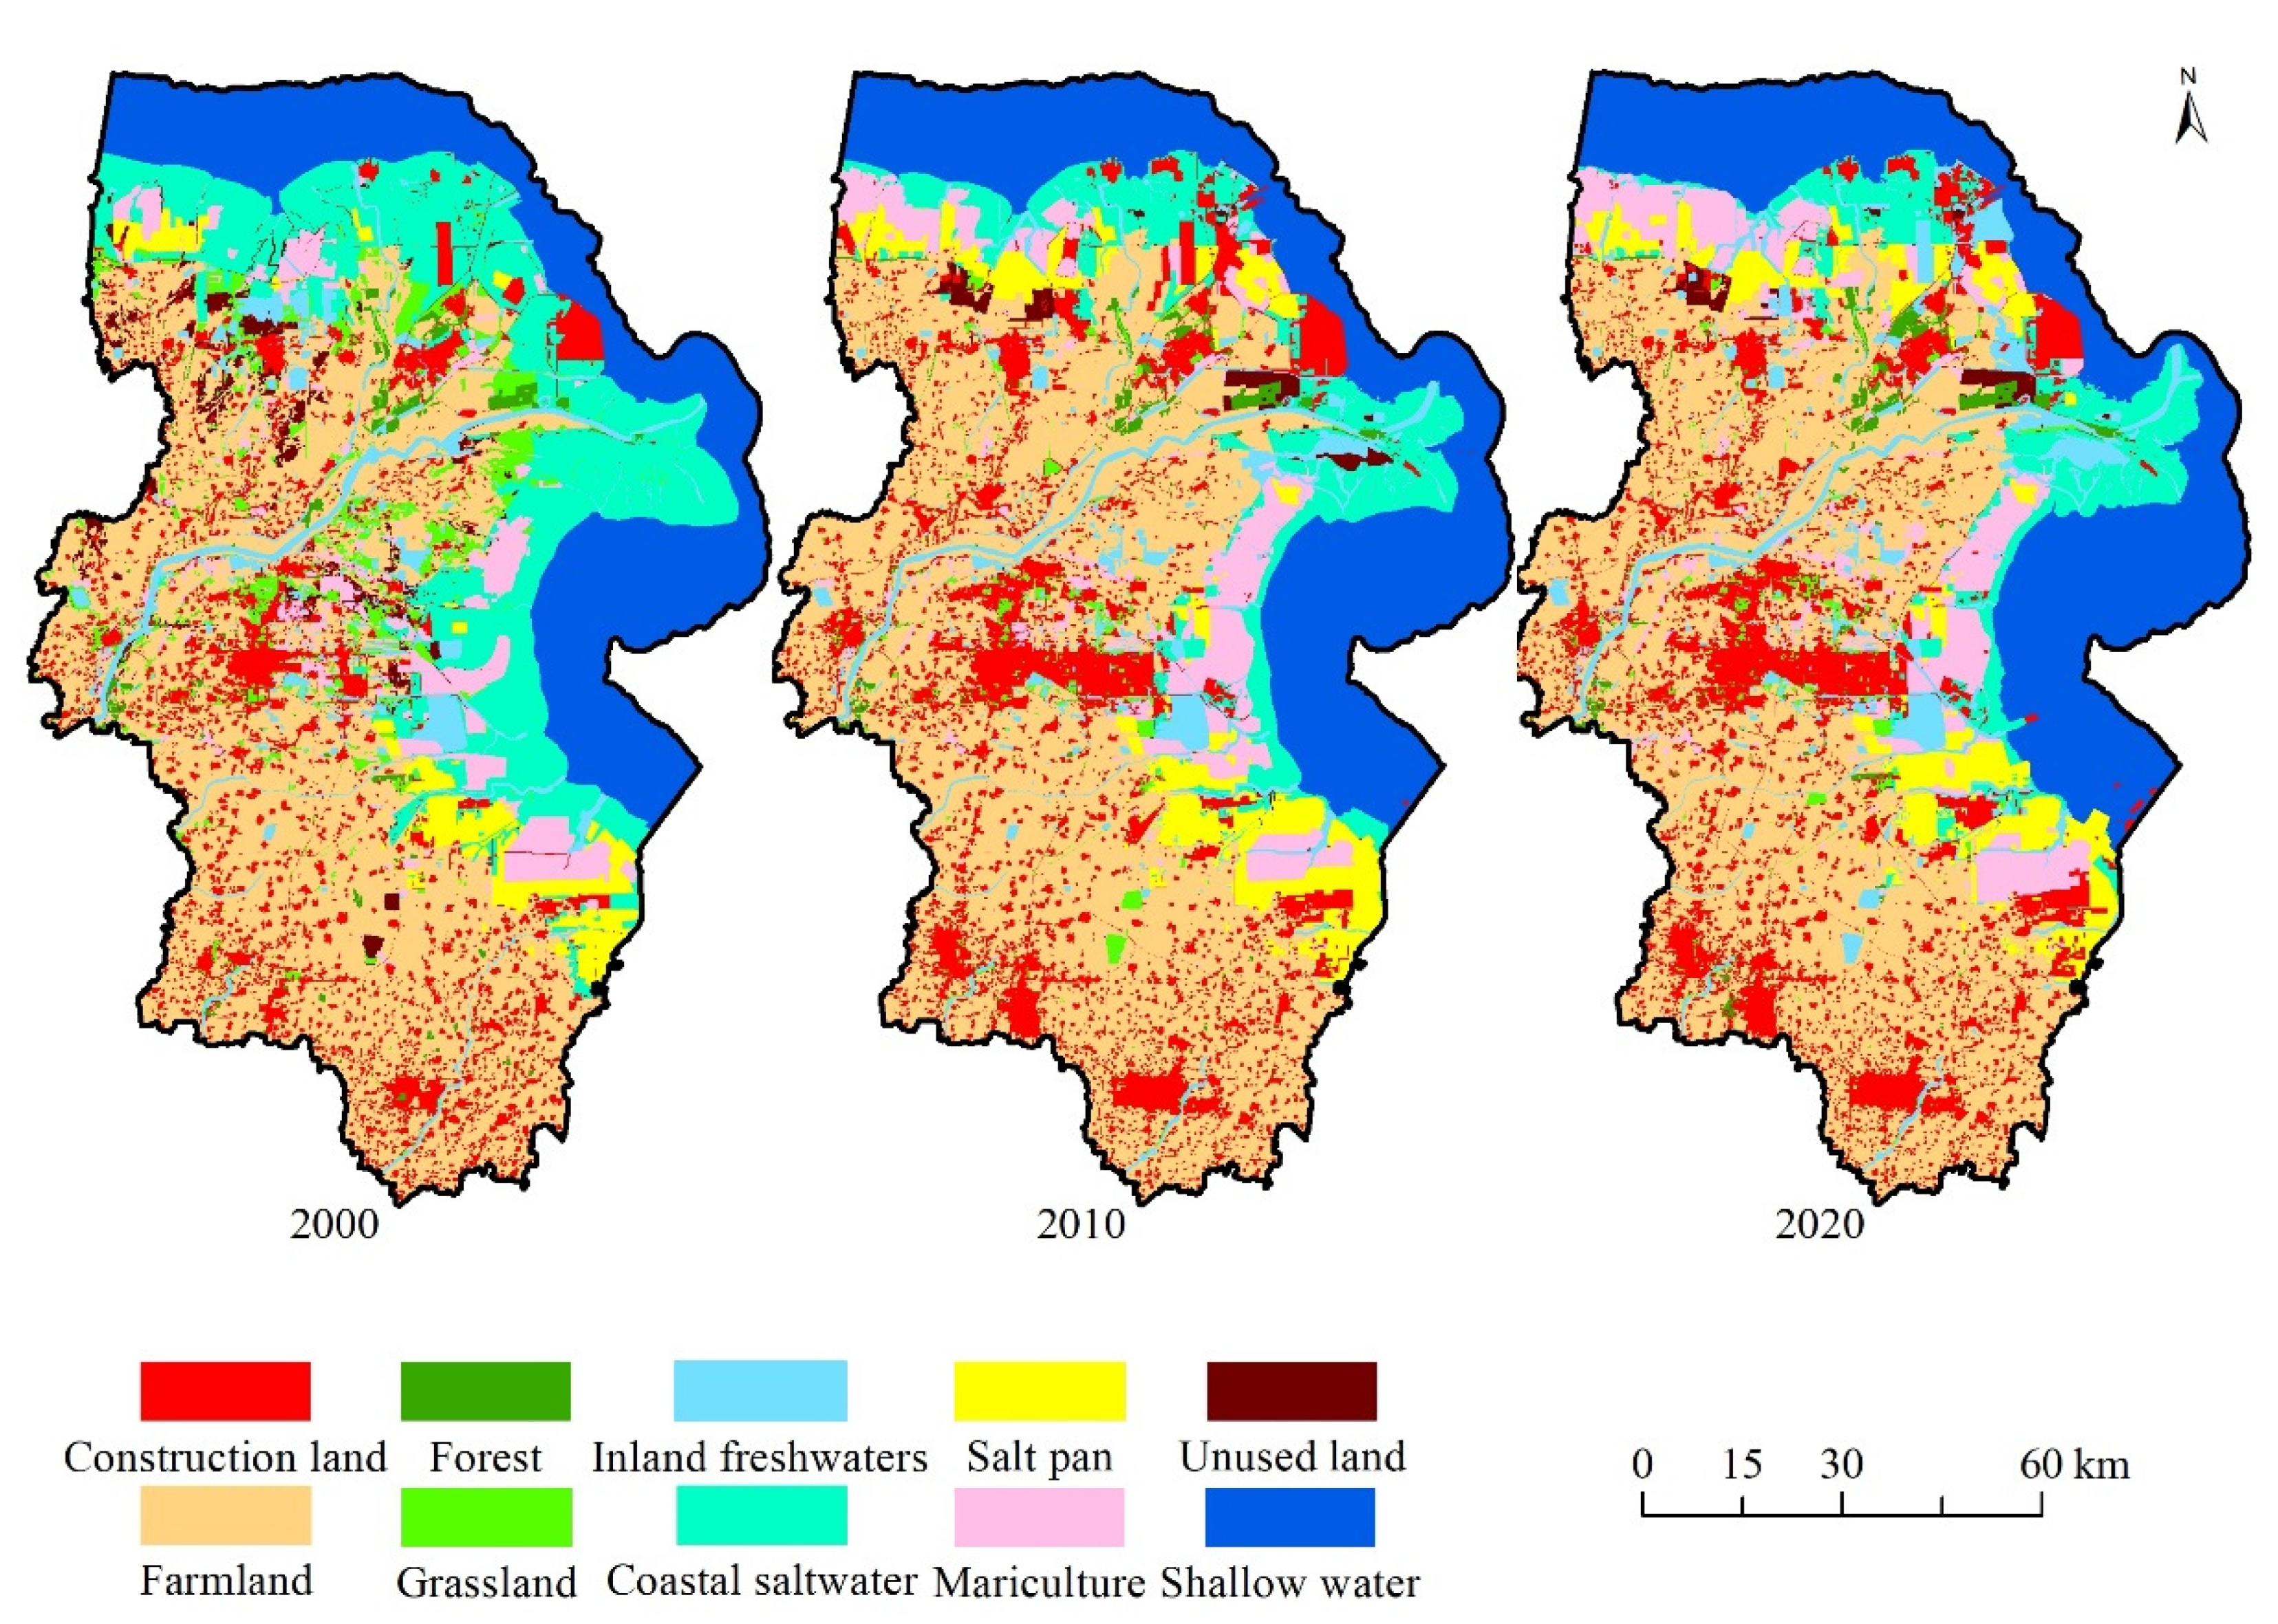
Farmland was the primary LULC category in the YRD from 2000 to 2020, accounting for from 35% to 40%. Moreover, shallow water, construction land, coastal saltwater, and mariculture accounted for a more significant proportion, while inland freshwaters, salt pan, grassland, and forest accounted for a smaller proportion. The unused land accounted for the smallest proportion of all land uses (Table A1 in Appendix A). The LULC in the YRD showed the spatial pattern distribution characteristics of “shallow water, followed by coastal saltwater, human-made wetland, and terrestrial multi-type mixed area” from sea to land (Figure 2). The LULC structure of the land and the sea area had noticeable spatial differences, with increasing distance to the coastline (Table A2 in the Appendix A). The most significant changes occurred within 0–20 km from the coastline. Such change was mainly caused by the high-intensity human development activities and the estuarine delta deposition and erosion activities. Specifically, the coastal saltwater, mariculture, and inland freshwaters decreased significantly with the increasing distance to the coastline. With the increasing distance from the coastline, the construction land and cultivated land gradually increased and decreased, respectively.
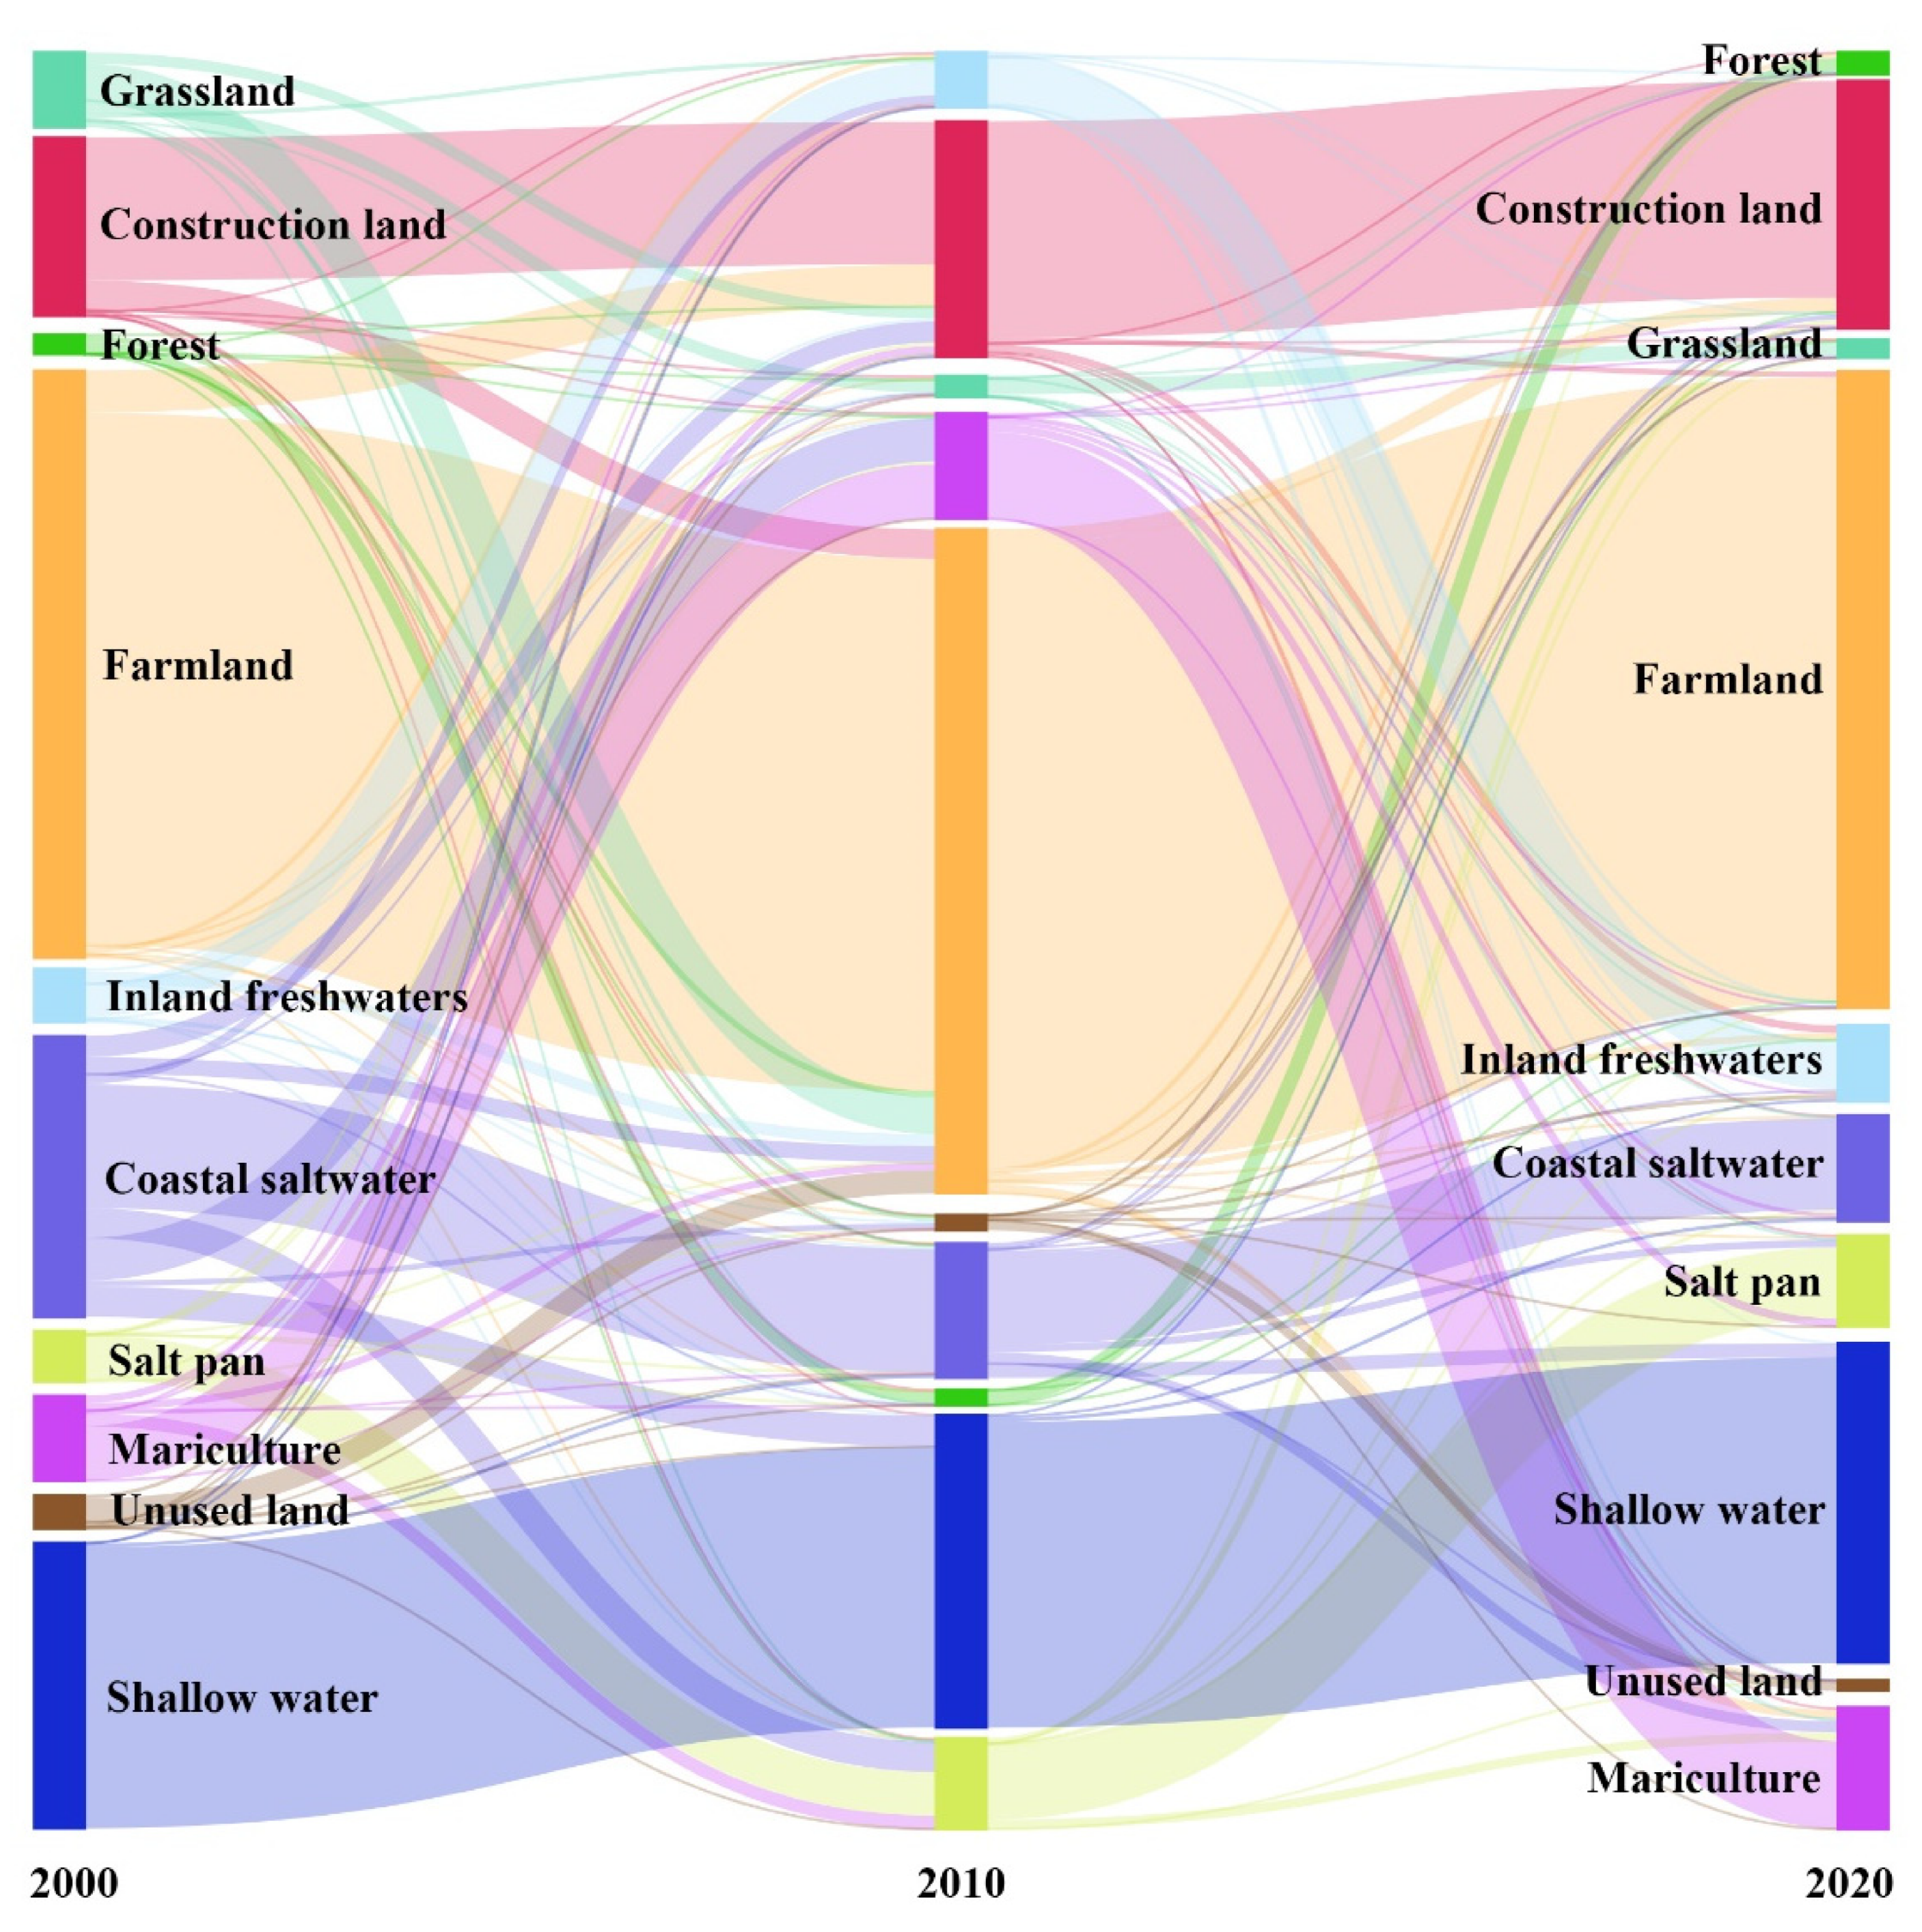
The areas with the most drastic changes in LULC in the different periods were mainly concentrated in the coastal zone. The total transfer change area gradually decreased, indicating that the rate of land-use change in the YRD was slowing down and tending to a stable state (Figure 3). From 2000 to 2020, the total transfer area of LULC in the YRD reached 3465.54 km2. Such a rate was faster before 2010, but it slowed down after 2010. The coastal saltwater decreased sharply, accounting for 40.30% of the total conversion area. The construction land, salt pan, and mariculture expanded rapidly. The coastal saltwater was occupied or eroded in a large area and lost 1396.66 km2, which was mainly transformed into mariculture (360.44 km2), shallow water (320.72 km2), and salt pan (289.35 km2). The newly formed coastal saltwater is 101.10 km2 and it is mainly caused by the land formation of the estuarine delta (46.73 km2) and the transformation of the inland water body. Construction land (i.e., urban areas, rural settlement, roads, and industrial and mining land) increased rapidly, with an area increase of 39.07%, mainly occupying the surrounding farmland (339.59 km2), coastal saltwater (150.69 km2), grassland (86.97 km2), and mariculture (64.81 km2). The grassland was mainly converted to farmland and construction land. The unused land was typically transformed into farmland, inland freshwaters, and construction land. Human activities were the main driving factors of LULC transfer in the YRD region.

4.1.2. Landscape Pattern Index Change

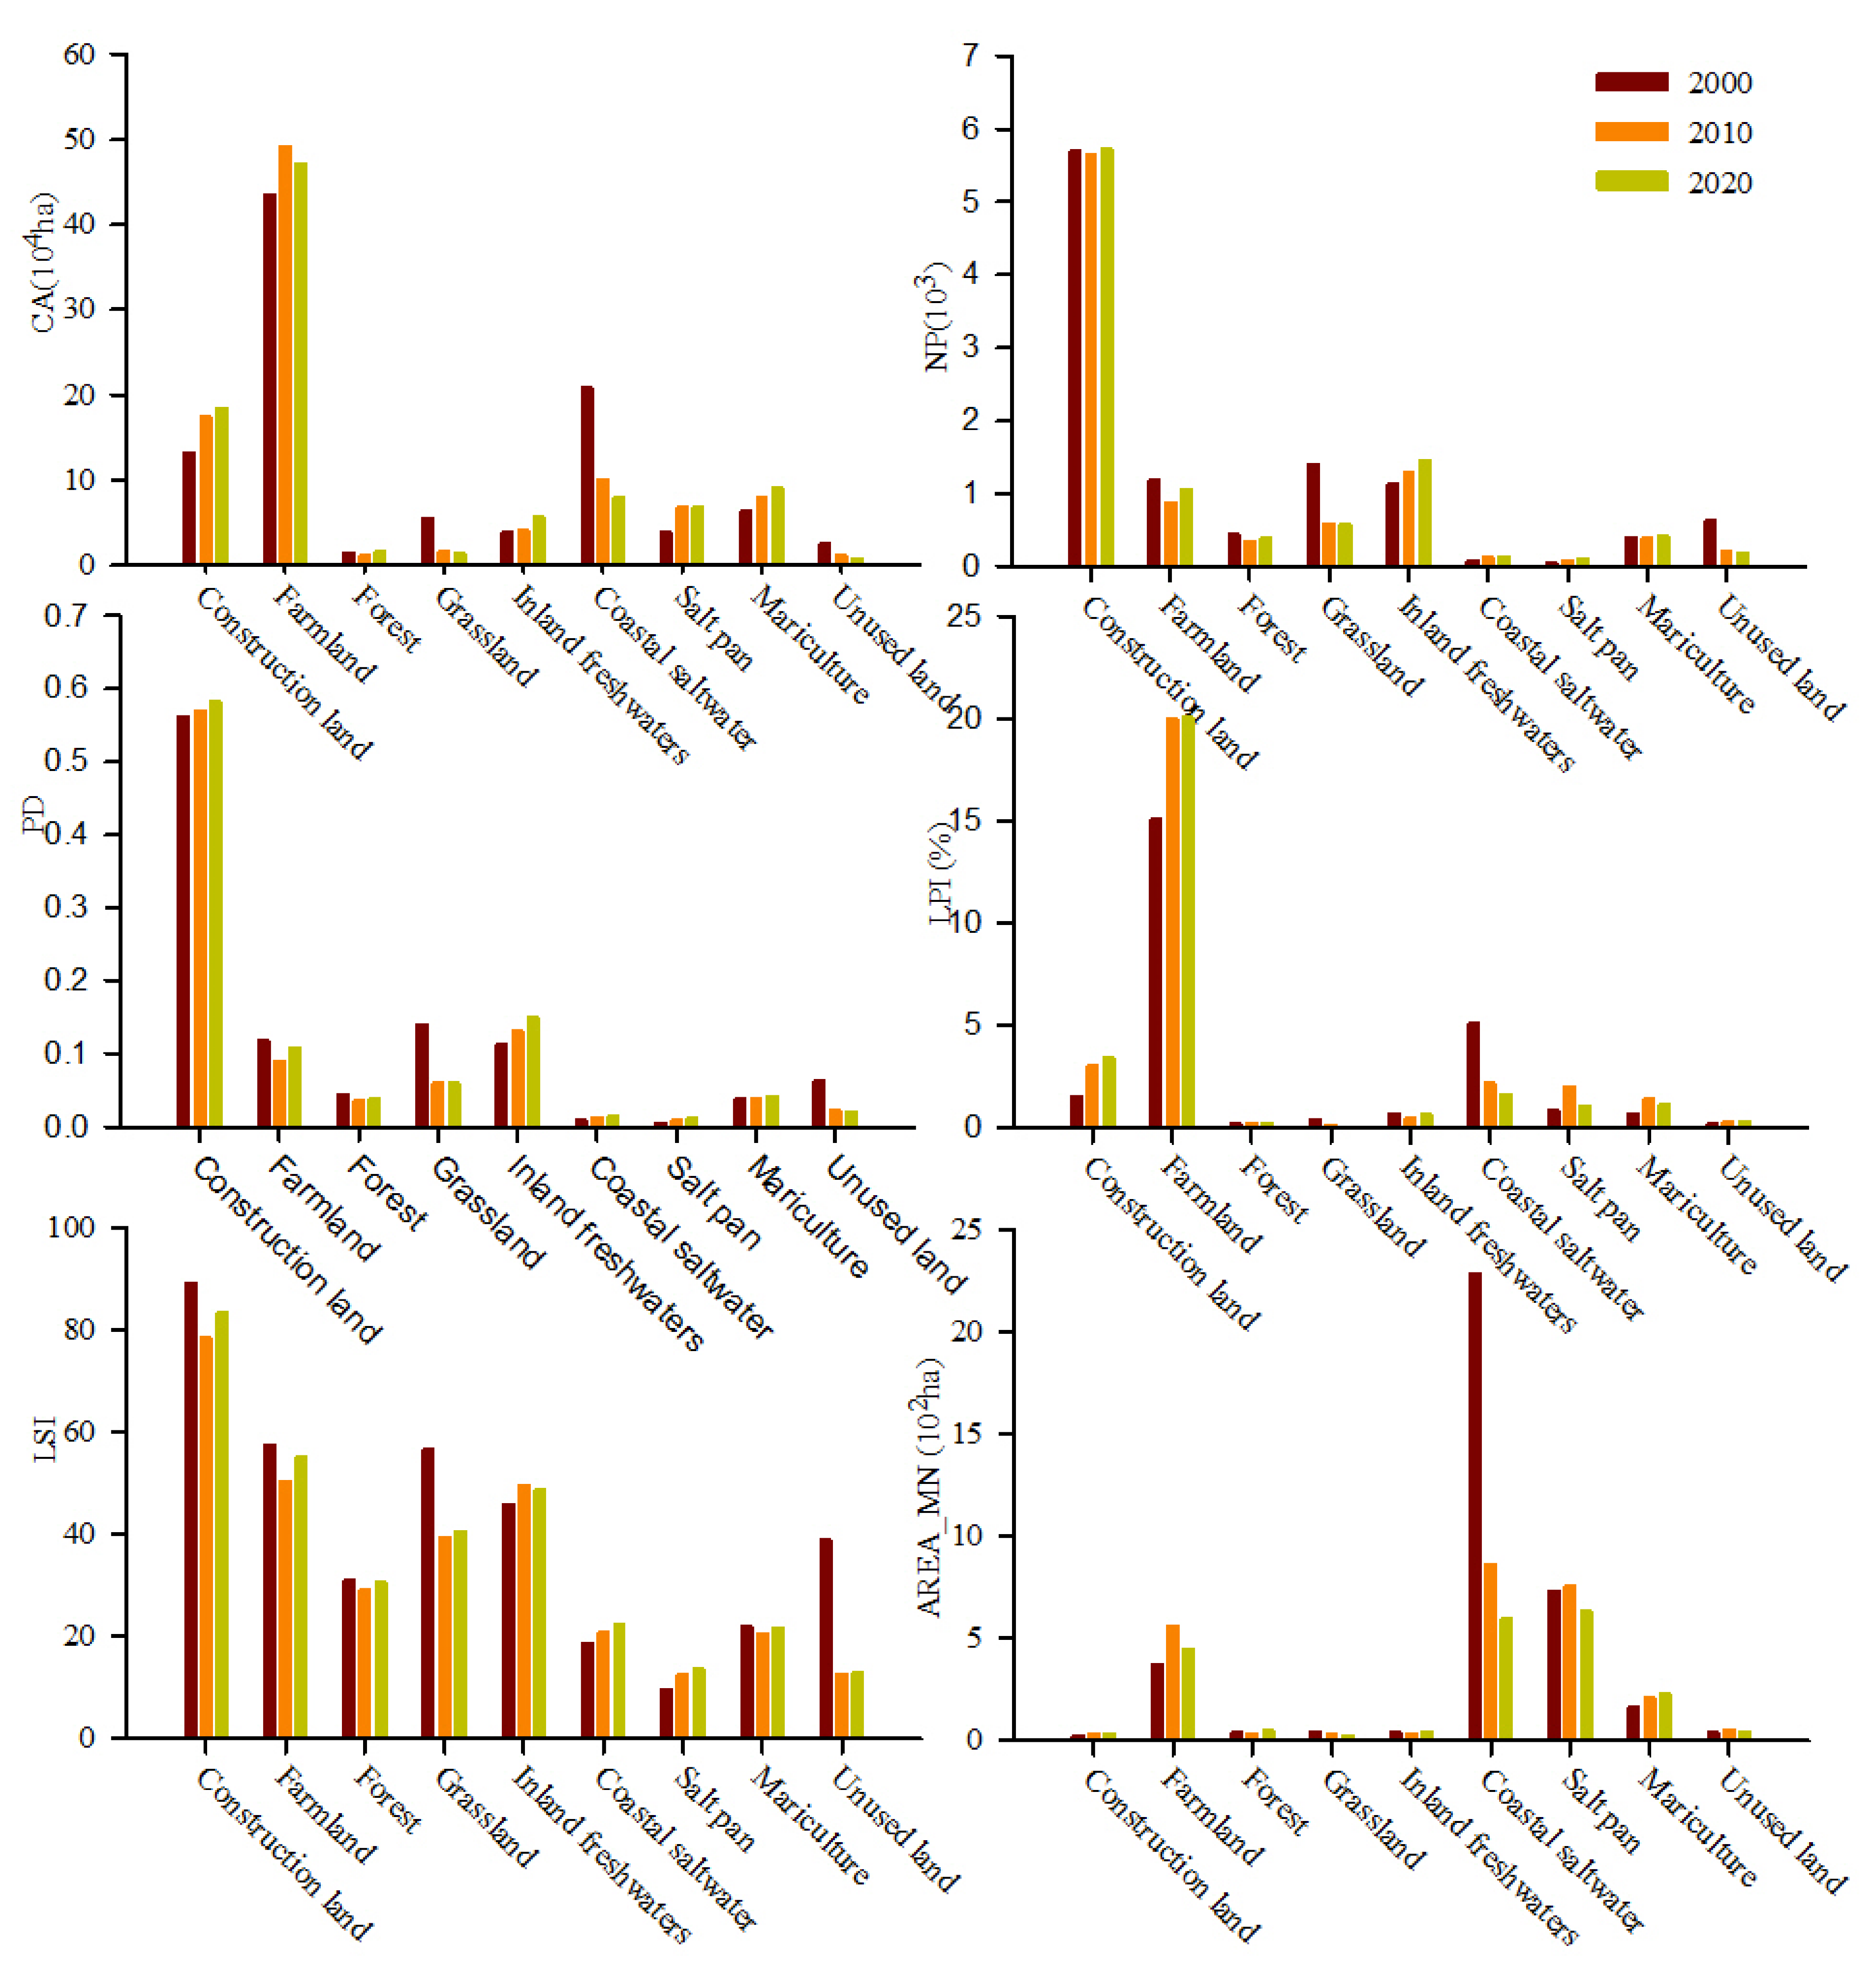
The landscape pattern index of LULC at the type level in the YRD region is shown in Figure 4. During the 2000–2020 time span, the landscape fragmentation in the YRD increased and the types of plaques were more diversified. This process occurred mainly because of the expansion of land resources development, population growth, and the expansion of human settlements, and industrial and mining lands in the YRD, which accelerated the coastal saltwater fragmentation. The farmland class area (CA) is the largest, but the construction land and human-made wetland, for salt pan and mariculture, increased yearly, while coastal saltwater decreased sharply. The number of patches (NP) of construction land, inland freshwaters, and salt pan increased significantly, while the number of plaques in grassland and unused land showed a significant downward trend. The patch density (PD) of inland freshwaters and construction land showed a significant increasing trend, while grassland and unused land showed an opposite direction. The most extensive patch index (LPI) change was farmland and coastal saltwater decreased significantly. The landscape shape index (LSI) of coastal saltwater and salt pan increased significantly, which indicated that large patches were continuously dispersed into small patches and the degree of dispersion and shape complexity of patches increased. The mean patch area (AREA_MN) of coastal saltwater decreased most sharply, from 22.83 km2 in 2000 to 5.88 km2 in 2020, indicating that the high-intensity development activities caused severe fragmentation of coastal saltwater.
The calculated landscape metrics included diversity, fragmentation, and aggregation (Table 3). From 2000 to 2020, Shannon’s diversity index (SHDI) and Shannon’s evenness index (SHEI) of the YRD region showed a fluctuating downward trend. Similarly, the NP and the PD also showed an overall downward trend. The CONTAG showed a fluctuating increasing trend. However, IJI showed a significant downward trend, indicating that the mixing degree of each landscape type decreased.

4.2. Characteristics of Habitat Quality Change

4.2.1. Habitat Quality Spatiotemporal Change from 2000 to 2020

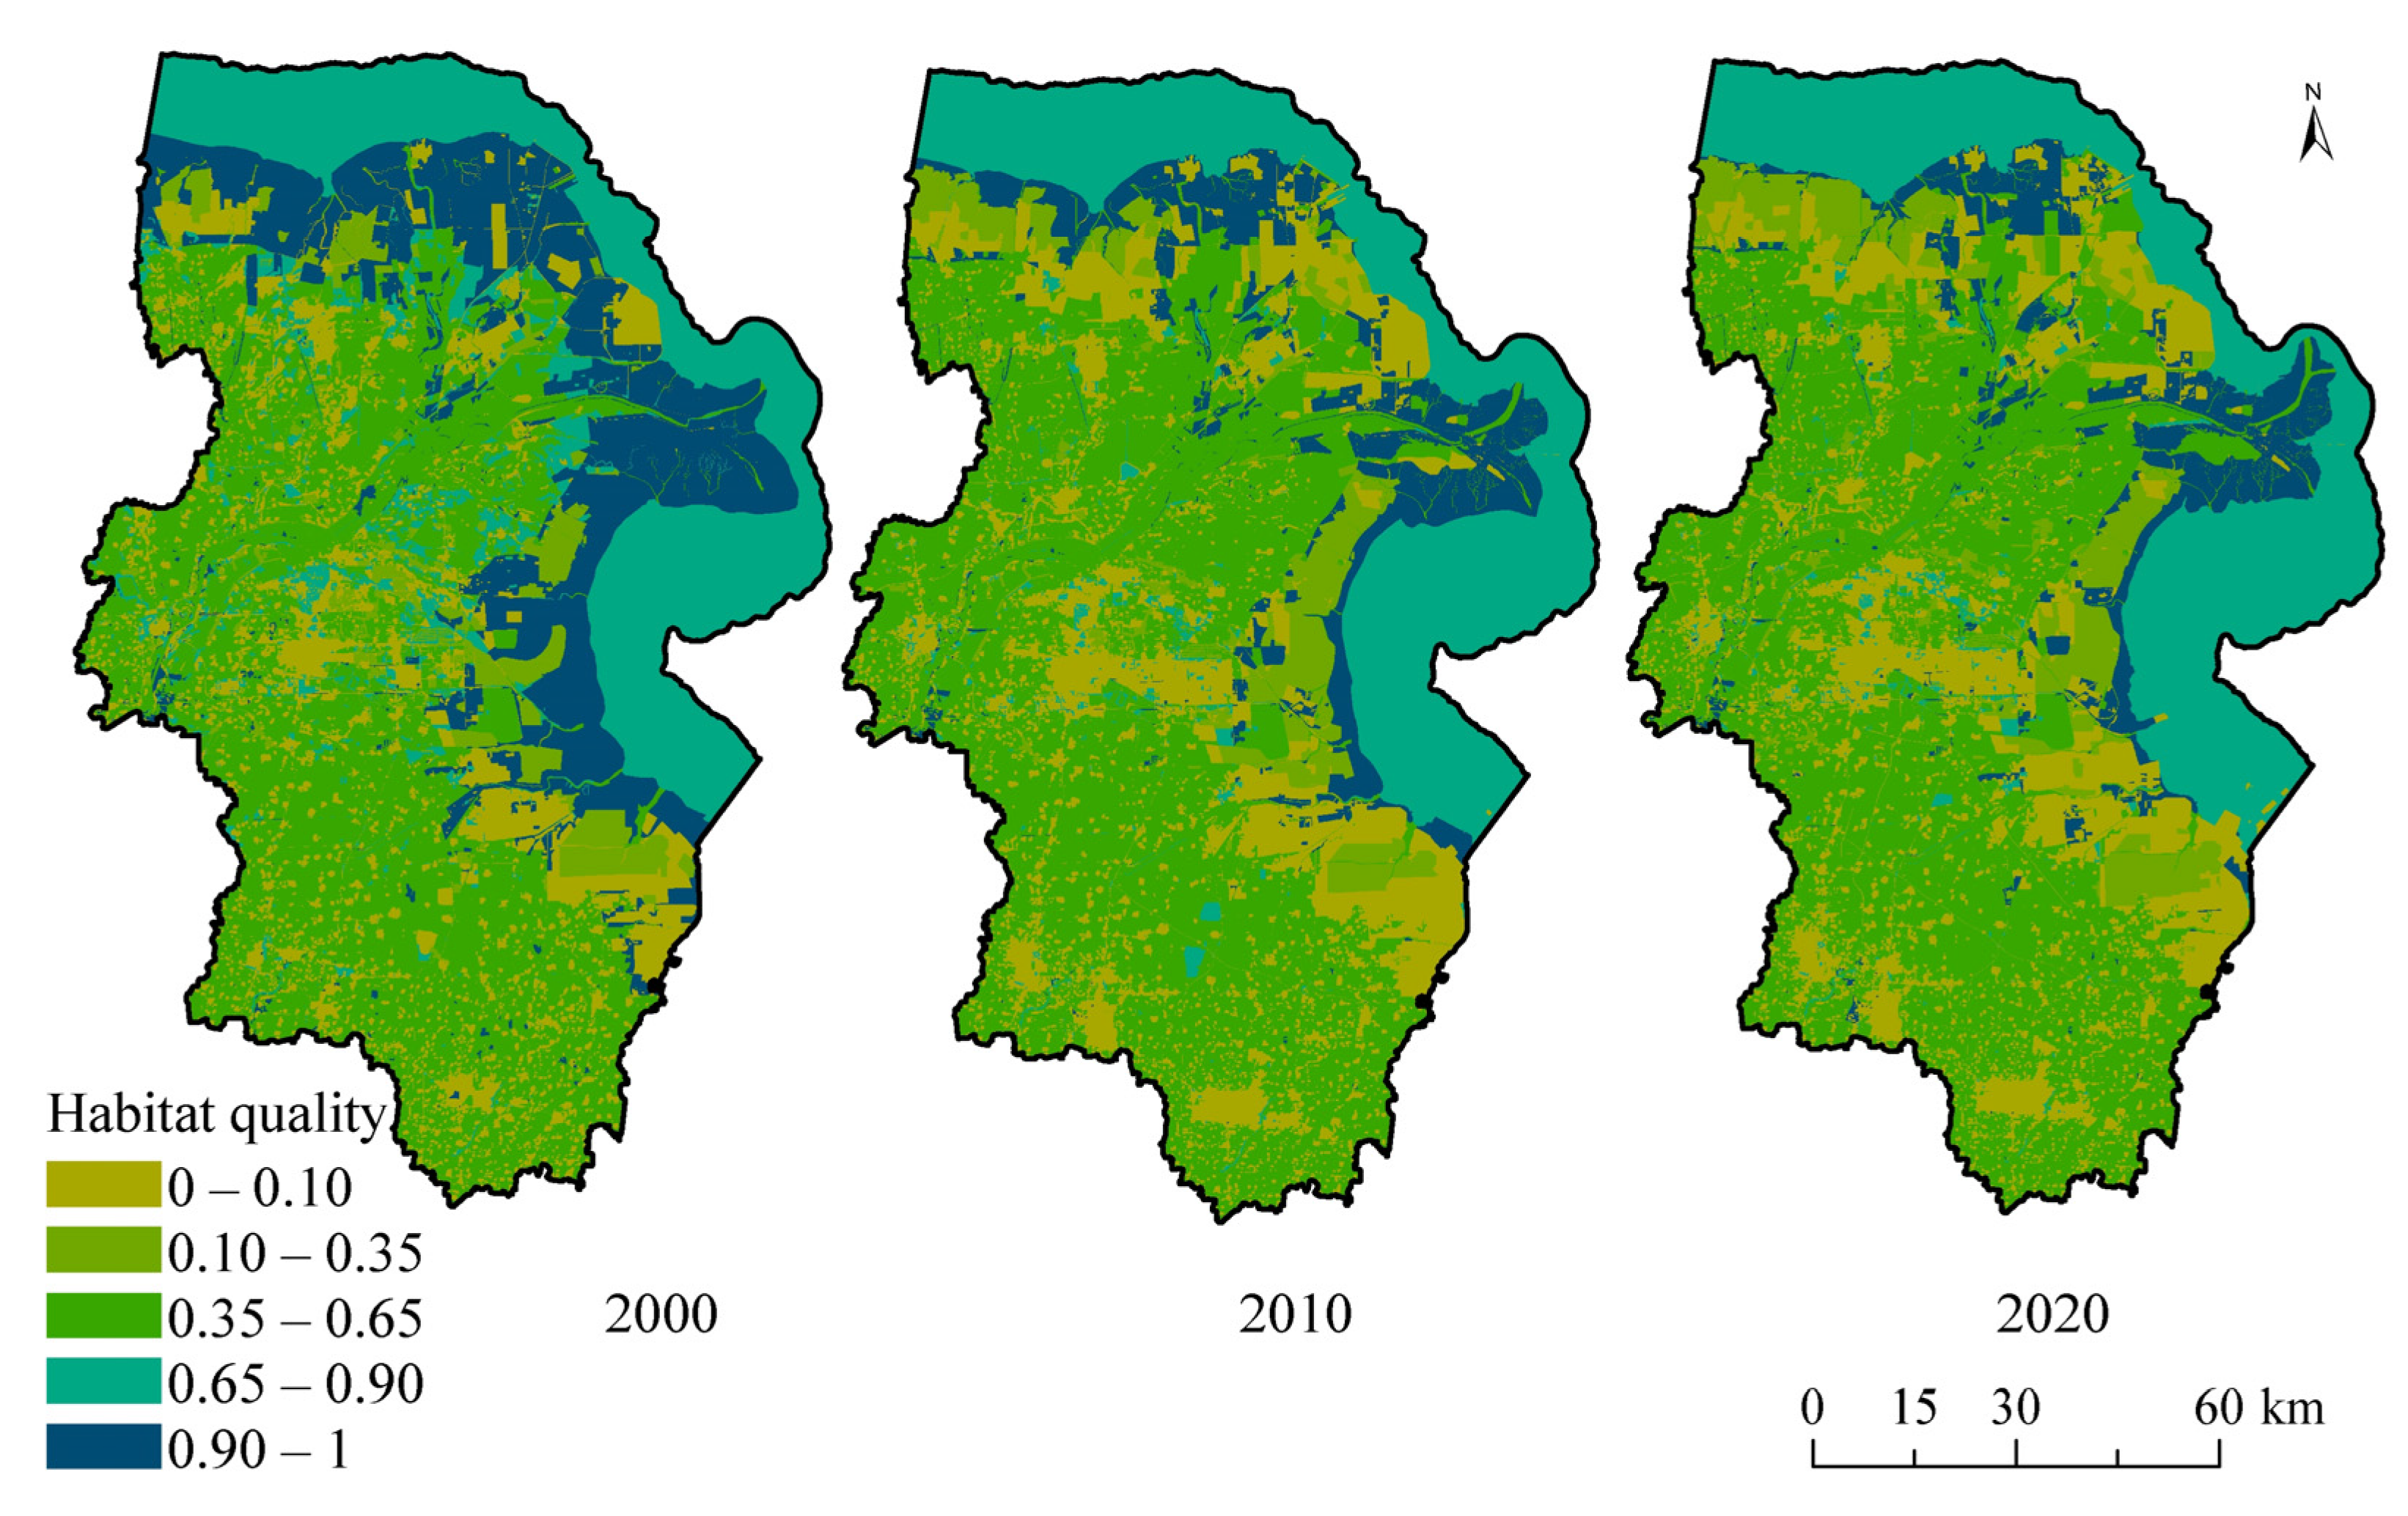
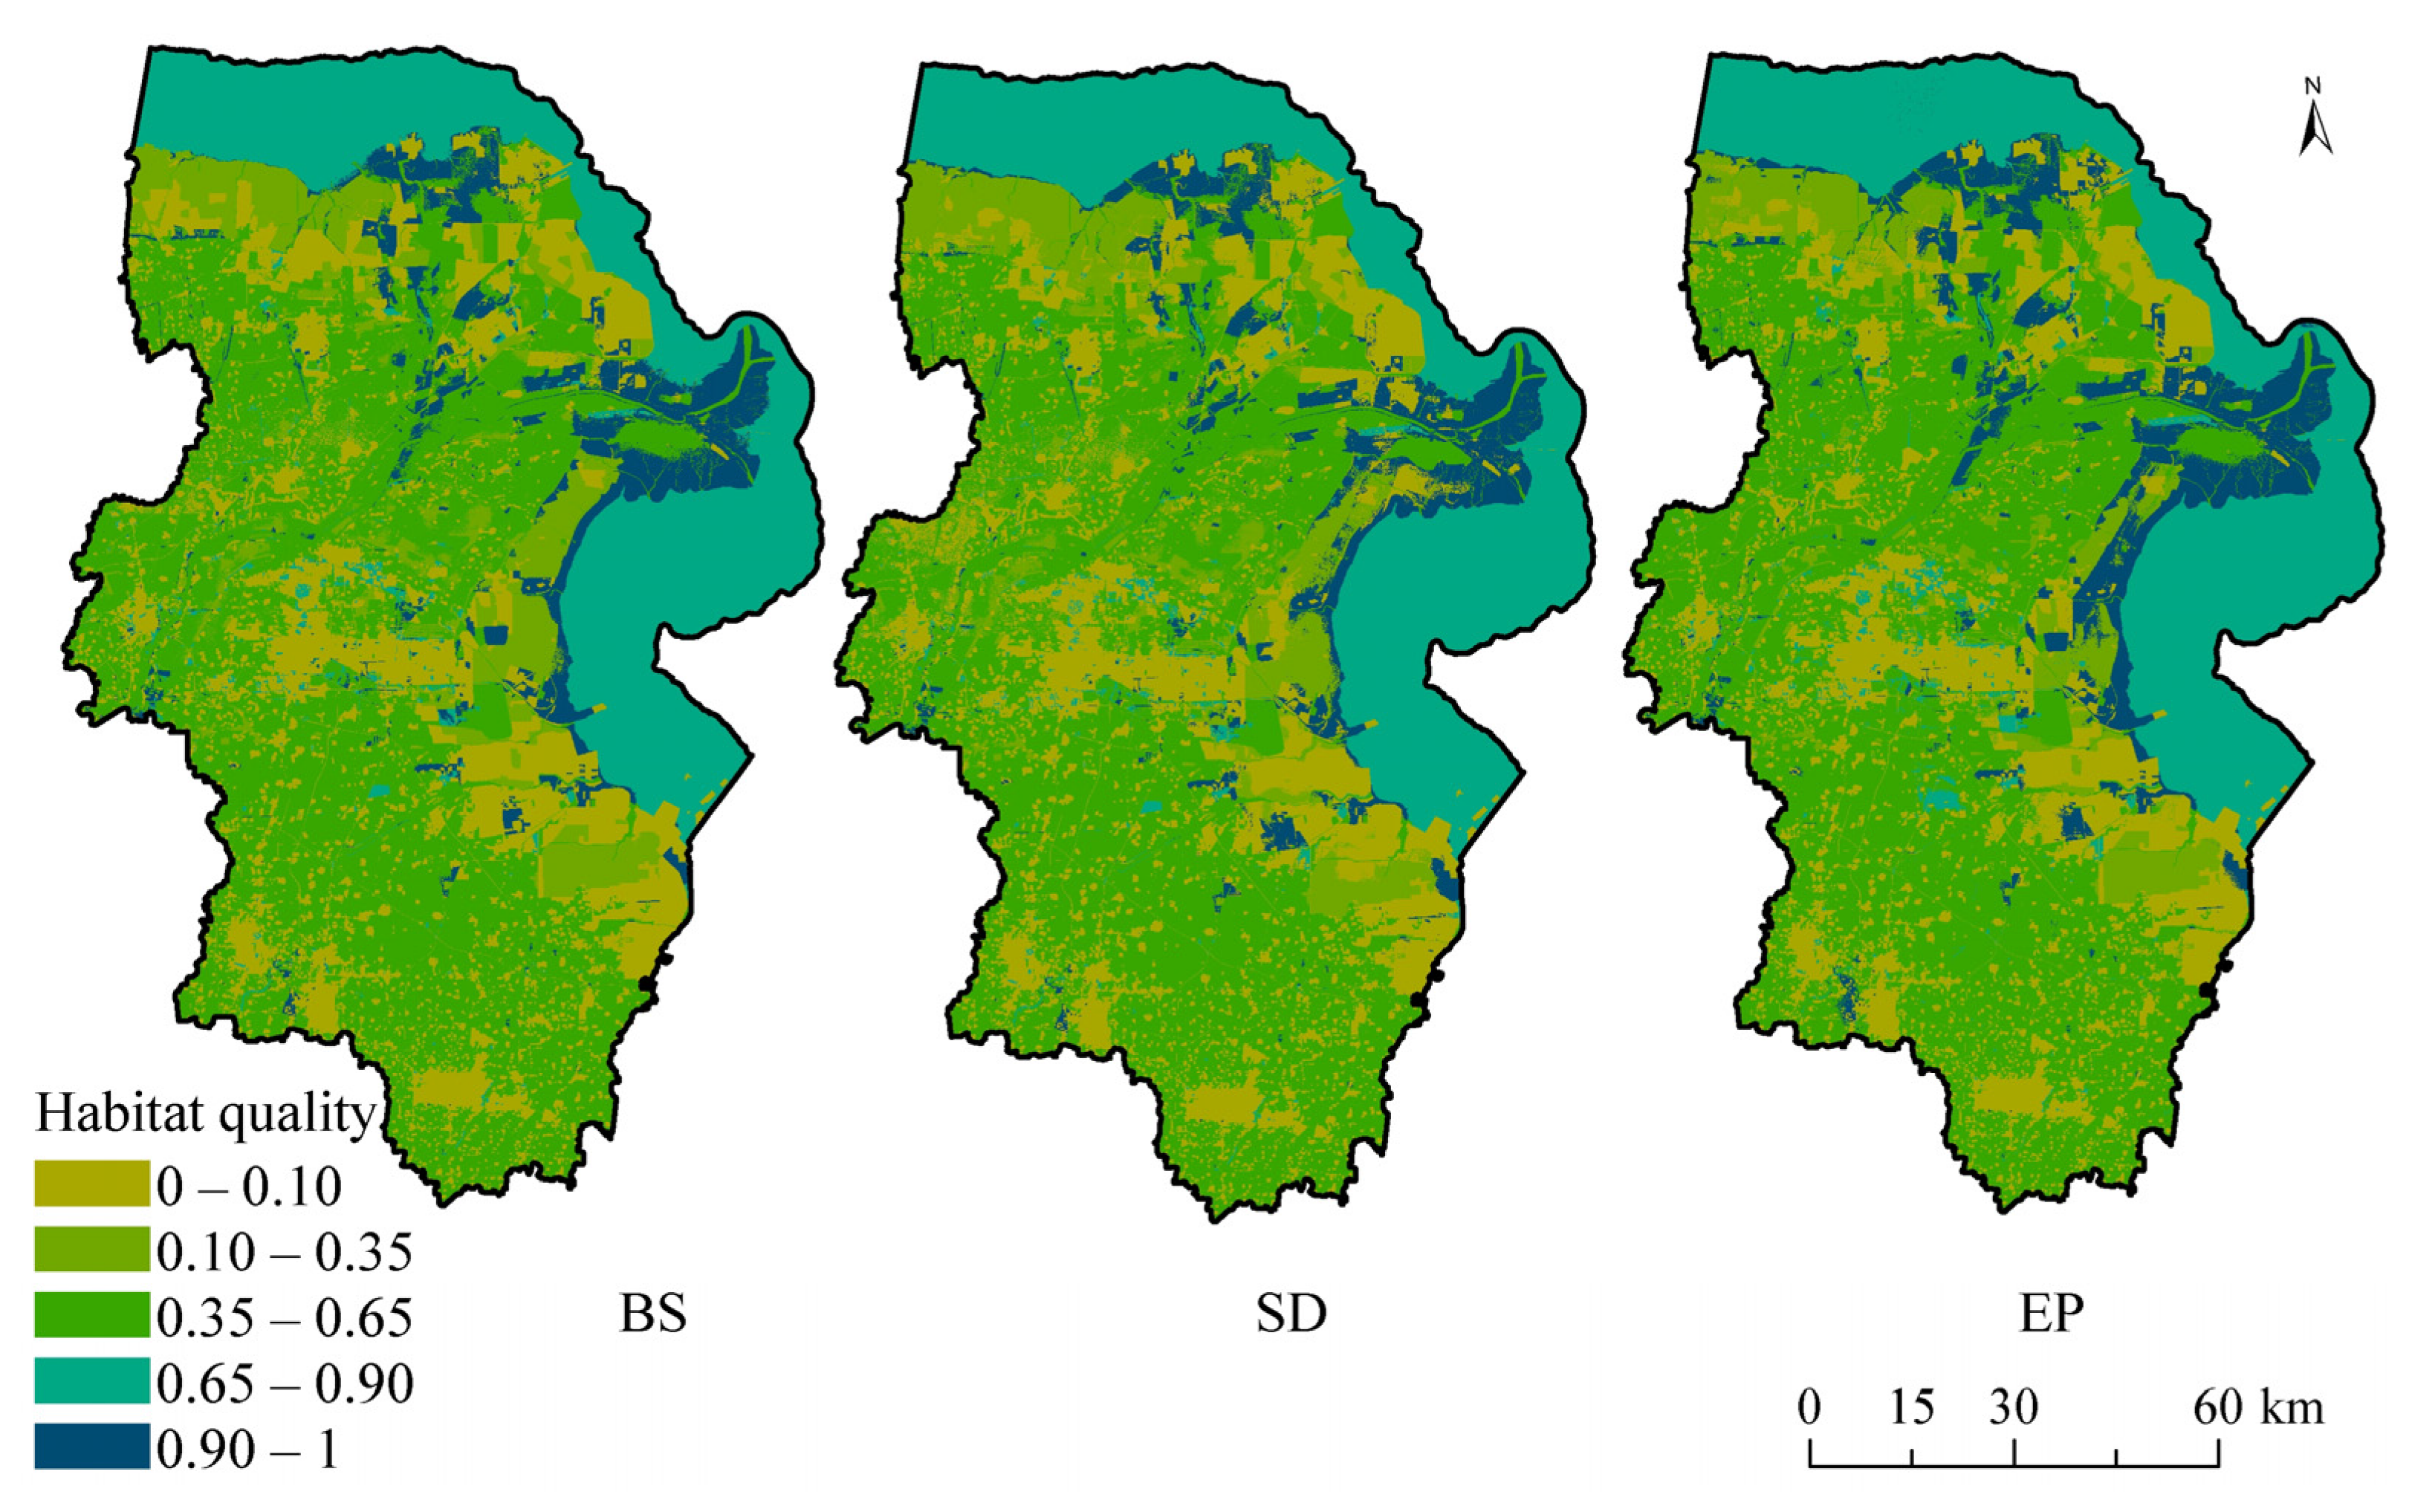
The value of habitat quality represents the level of biodiversity [53]. Generally, the increase in land-use intensity will cause the rise of the threat source area, which will degrade the nearby habitat quality. To better study the habitat quality change in the study area, referring to relevant research criteria [55,56,57], the habitat quality index was divided into five grades: low (0‒0.10), relatively low (0.10‒0.35), medium (0.35‒0.65), relatively high (0.65‒0.90), and high (0.90‒1). The results showed that the average habitat quality of the YRD in the 2000–2020 time span was 0.545, 0.465, and 0.459, respectively. Overall, the habitat quality in the study area was at an intermediate level and gradually declined. High habitat quality was mainly distributed in coastal tidal flats, small, and scattered in the inland area. The high habitat quality was mainly concentrated in shallow water. The relatively low habitat quality was mainly distributed in salt pan areas. The low habitat quality was concentrated primarily on urban, industrial, and mining lands (Figure 5). The areas with high habitat quality were distributed in a continuous strip near the coastal zone, but there was a discontinuity in the Gudong Oilfield. Moreover, with time, the continuity of the space was further weakened by the construction of the port and the construction of salt pan and mariculture ponds, and its spatial distribution was fragmented by 2020.
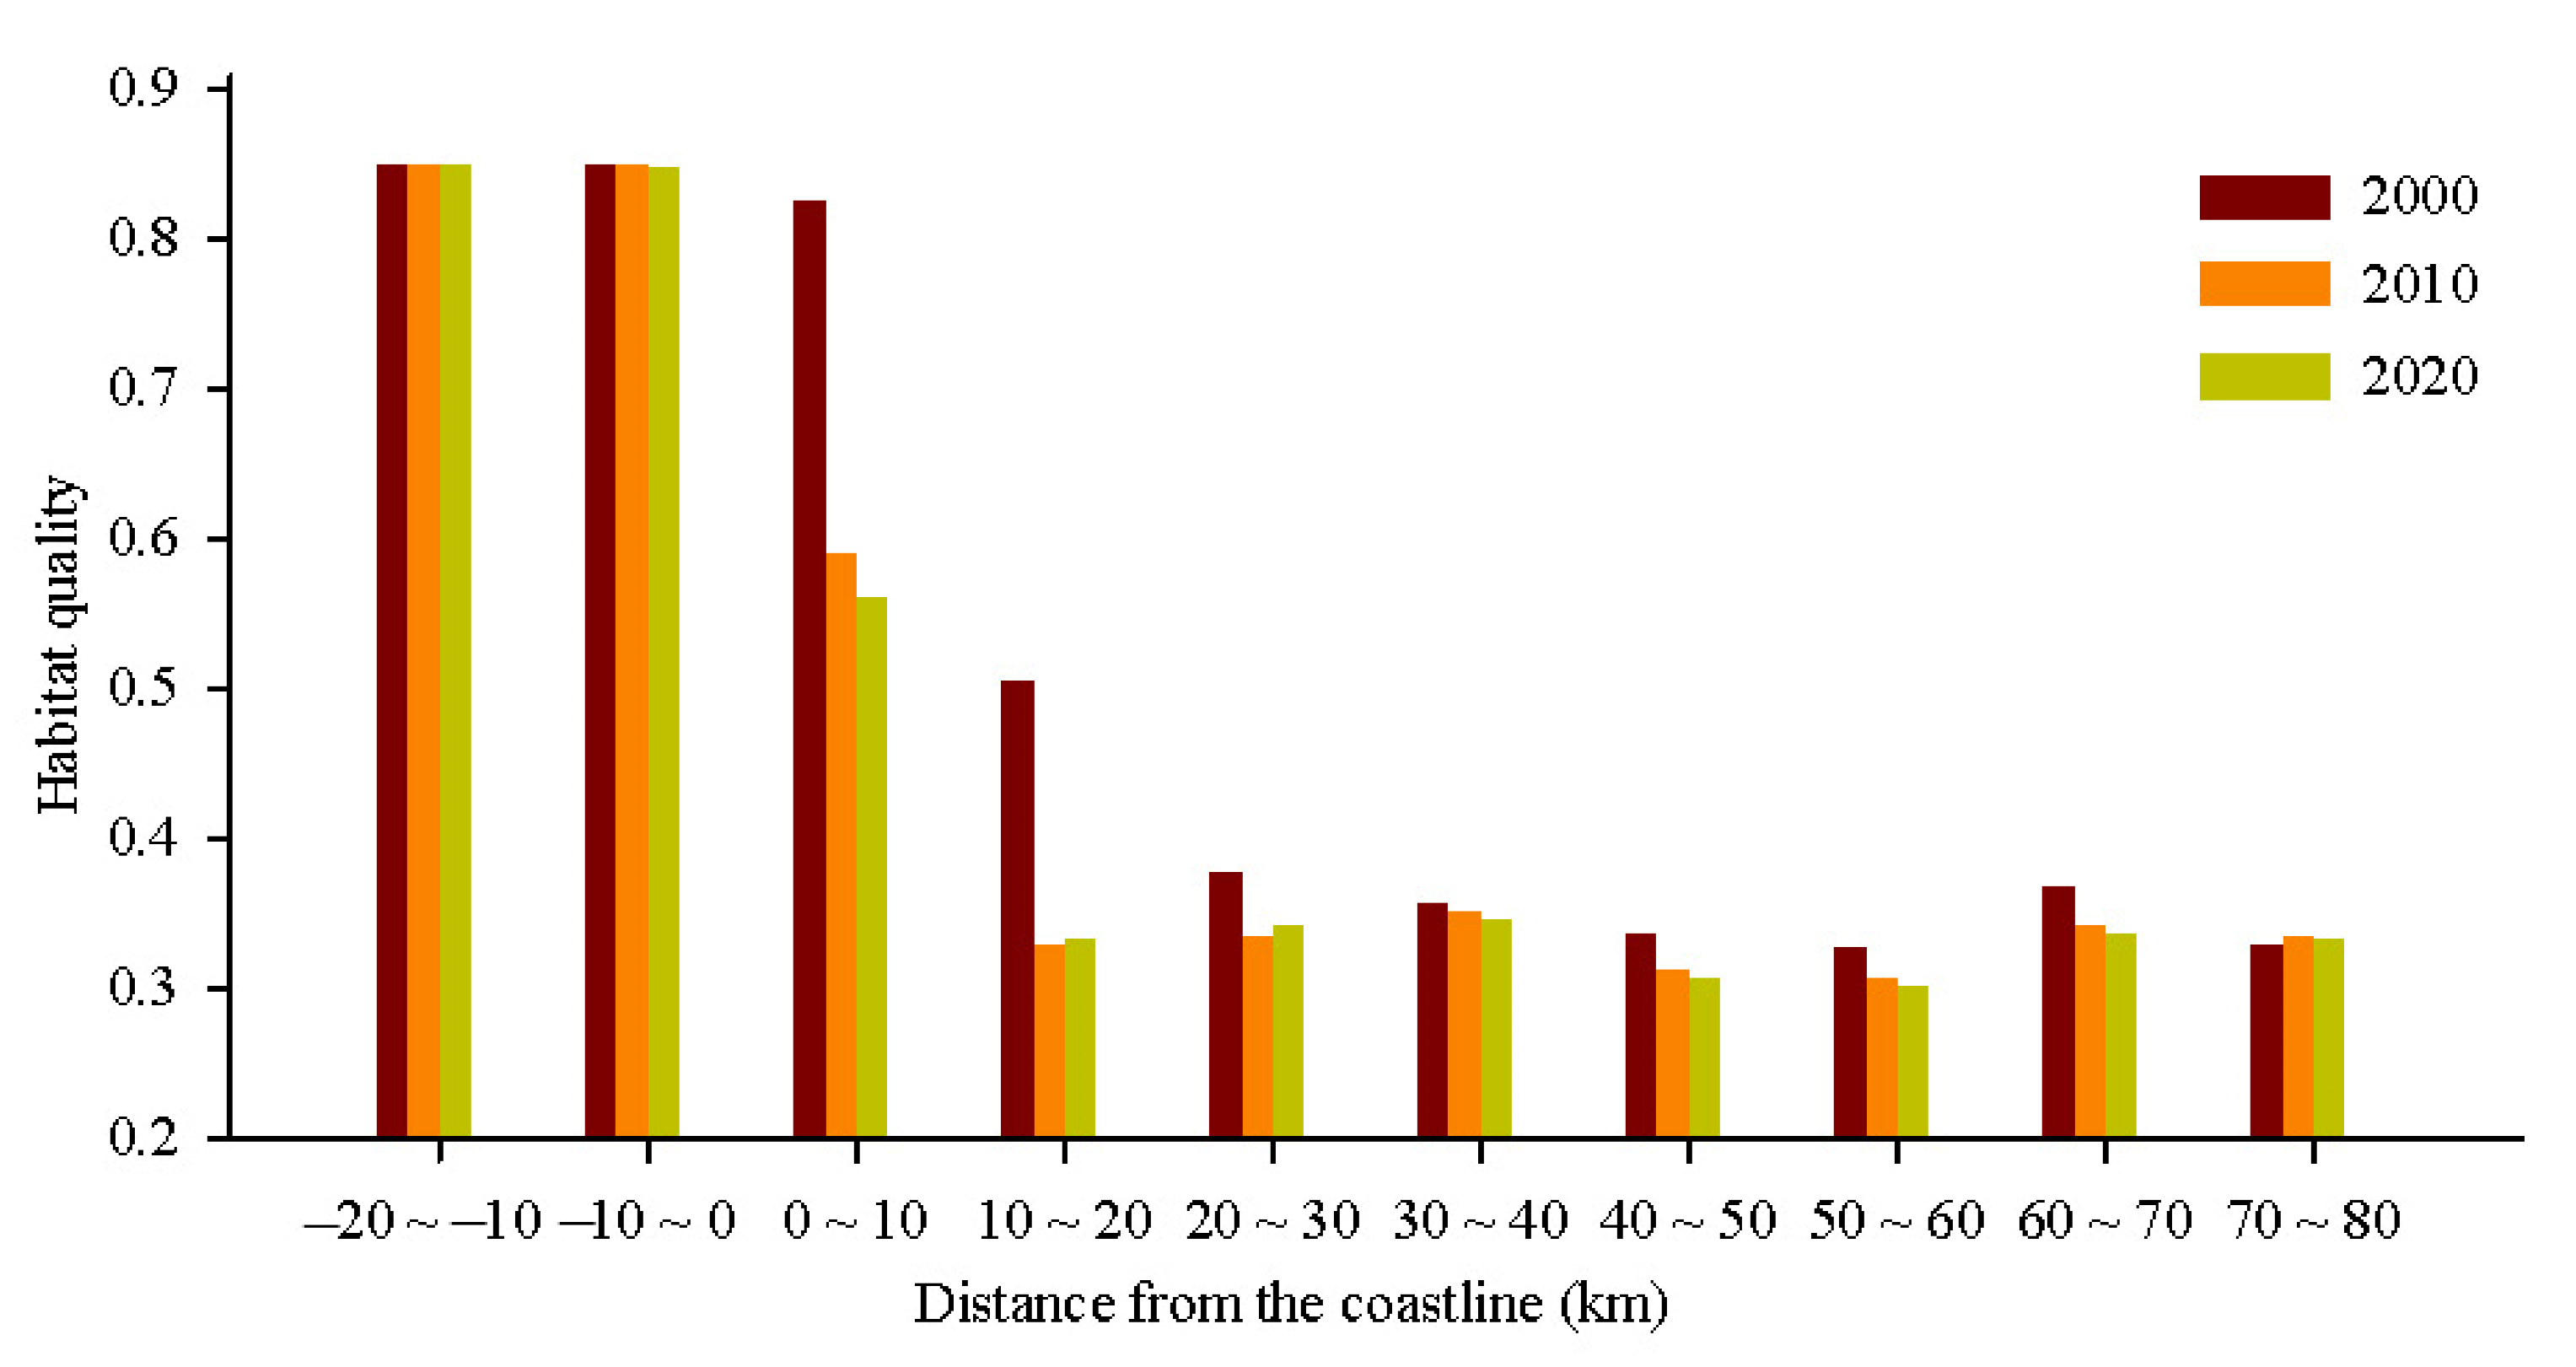
The habitat quality of the YRD was characterized by a marked gradient change from the land to the sea (Figure 6). In other words, it gradually declined with increasing distance to the coastline, i.e., the closer the distance to the coastline, the more dramatic the change. The habitat quality within a 0‒10 km radius from the coastline decreased most significantly, and the reasons were as follows: a large number of coastal wetlands were reclaimed and aquaculture and salt fields increased rapidly. Furthermore, the degradation of habitat quality in the range of 10–20 km was more significant because of the increase in human-made wetland and the expansion of construction land. However, the decline of habitat quality in other inland areas was mainly due to increased construction land patches. With the rapid urbanization, forest, grassland, and cultivated land were occupied as construction land, resulting in the fragmentation of the original concentrated natural habitat landscape and the original habitat becoming a new stress factor, which seriously threatens the surrounding habitat quality. Overall, the YRD is dominated by medium habitat quality and the area of high-quality habitat has decreased significantly, which indicates that relevant environmental protection policies and measures are urgently needed in this region.

4.2.2. Habitat Quality Change Characteristics in 2030

The habitat quality simulation results showed that the habitat quality indexes under the BS, the SD, and the EP scenarios in 2030 were 0.455, 0.447, and 0.470, respectively. Under the BS and the SD scenarios, the habitat quality continued to decline and, in the SD scenario, it decreased most significantly, while it increased under the EP scenario. The high-quality habitat areas were mainly distributed in coastal wetland areas and the low-quality habitat areas were primarily concentrated in urban residential areas and industrial and mining land (Figure 7). Under the BS and the SD scenarios, the high habitat quality areas were further eroded and fragmented. However, due to the protection policy of forbidden development, the habitats at the north and south of the YRD National Nature Reserve were not threatened or damaged, and their habitat quality was high.
The land–sea gradient changes of habitat quality in the YRD under different scenarios in 2030 have certain similarities and differences (Figure 8). Overall, the YRD habitat quality under the BS, the SD, and the EP scenarios decreased with the increasing distance from the coastline. Compared with 2020, the habitat quality under the BS and the SD scenarios showed a downward trend in different buffer zones, contrary to under the EP scenario. The decline was most significant within 0–10 km from the coastline under the BS and the SD scenarios, while the increase was most pronounced under the EP scenario. In a word, the change of habitat quality in the YRD was the most significant in this range. The main reason for the decline of habitat quality in the YRD is expanding construction land, salt pan, and mariculture. On the contrary, the main reason for the rise of habitat quality is the slow expansion of threat factors and increased habitat source areas.

5. Discussion and Conclusions

5.1. Discussion

In the research of habitat quality, domestic and overseas scholars have produced re-markable achievements by using model methods. Scholars pay more attention to the changes of terrestrial habitat quality caused by urbanization [44], industrialization [13], agriculture [10], and other factors. However, little attention has been paid to the habitat quality of coastal zone areas [58]. In this study, the YRD was taken as an example to study the changes of its habitat quality, focusing on the land–sea gradient changes. The spatial patterns of habitat quality in the YRD were affected by natural geographical factors and socio-economic activities [17]. The influence of natural elements on the habitat quality of the YRD cannot be ignored, especially the interaction between the river and the sea. The Yellow River carries a large amount of silt to create land to form new wetlands, which improves the habitat quality in the estuary area. On the other hand, the erosion of the ocean reduces and degrades the terrestrial wetlands, which in turn reduces the habitat quality in some areas. Natural factors such as rainfall, altitude, and vegetation coverage also impact the habitat quality. In previous studies [59,60], it was found that LULC change is an essential factor causing habitat quality change and habitat fragmentation and the transformation of its area directly affected the shift in habitat quality [57].
With the acceleration of urbanization, economic development, and population growth, the land use structure of the YRD drastically changed. In this study, construction land, salt pan, and mariculture were the main threats to the habitats in the YRD. The nearby habitats were degraded remarkably and their quality decreased dramatically.
Due to the rapid expansion of construction land (urban land, transportation land, industrial, and mining lands), many cultivated lands, forests, and grassland were invaded. The demand for salt pan and mariculture increased rapidly, occupying a significant number of coastal wetlands. This research supports previous findings that urban housing, industrial and mining areas, and agricultural breeding areas are threats to natural ecosystems and biodiversity [27,61]. The policy of government agencies has a significant impact on the habitat quality of the YRD, especially the establishment of the YRD Nature Reserve, which prohibits development and construction in reserve. Therefore, the reserve maintained a high level of habitat quality around it.
Based on multi-scenarios, the spatial pattern changes of the LULC of the study area in 2030 were predicted and the habitat quality was calculated. In particular, the pursuit of rapid economic development under the SD scenario encroached on many coastal wetlands, forest, grasslands, and cultivated lands, resulting in a rapid decline in habitat quality. However, under the EP scenario, instead of pursuing rapid economic development excessively, the YRD region would have implemented ecological protection policies, mainly focused on coastal wetland restoration, causing the habitat quality to be improved rapidly. To promote the harmonious development of society, economy, and ecology, the government or relevant institutions should strengthen the protection of cultivated lands, limit the blind and uncontrolled construction on cultivated lands, strengthen the ecological conservation of wetlands, and control the development of wetlands [50].

5.2. Conclusions

Based on the land-use data of interpretation in the YRD, the PLUS model simulates future multi-scenarios. The InVEST model was used to evaluate habitat quality, analyze its spatiotemporal variation characteristics, and study the evolution of land-use patterns and habitat quality change. The main conclusions are as follows:
(1)
From 2000 to 2020, construction land, salt pan, and mariculture expanded at high speed, whereas the proportion of coastal wetlands shrunk drastically. On the whole, the LULC had a spatial distribution pattern characteristic of “shallow water, followed by coastal wetlands, constructed wetlands, lands with the multi-type mixed region” from sea to land. The LULC pattern within a 20 km radius from the coastline varied most significantly due to the high intensity of human development activities and the process of erosion and deposition in coastal zones and estuarine deltas.
(2)
From 2000 to 2020, the habitat quality was generally at an intermediate level but with a downward trend. The high habitat quality was mainly distributed along the beaches, and the low habitat quality was distributed primarily on urban land and industrial and mining land. As the distance from the coastline becomes closer, the habitat quality declines more significantly. In the range of 0–20 km, many coastal wetlands were reclaimed, and mariculture and salt pan increased rapidly, which caused the habitat quality to decline most significantly.
(3)
In 2030, the habitat quality index under the BS, the SD, and the EP scenarios are 0.455, 0.447, and 0.470, respectively. The habitat quality decreases under the BS and the SD scenarios but increases under the EP scenario. Land use planning and ecological protection work should be coordinated and rationally arranged for various land types to improve the YRD habitat quality.

Author Contributions

Conceptualization, M.H., Y.L. and M.W.; Data curation, Y.L.; Methodology, Y.L., C.F. and H.Z.; Supervision M.H. and M.W.; Writing—original draft, Y.L.; Writing—review and editing, M.H. and Y.L. All authors have read and agreed to the published version of the manuscript.

Funding

This research was funded by the National Social Science Foundation of China (No. 21BGL026).

Institutional Review Board Statement

Not applicable.

Informed Consent Statement

Not applicable.

Data Availability Statement

Not applicable.

Acknowledgments

The authors thank Xiyong Hou, Xiaoli Wang, Xiaowei Li (Yantai Institute of Coastal Zone Research, Chinese Academy of Sciences), and Yunlong Li (Qilu Normal University) for their insightful comments and helpful suggestions.

Conflicts of Interest

The authors declare no conflict of interest.

Appendix A

Table A1. Structural characteristics of different LULC types in the study area from 2000 to 2020.
LULC Category2000201020202000–20102010–20202000–2020
Area (km2)Area Change (km2)
Proportion (%)Rate of Change (%)
Construction land1320.641742.981836.59422.3493.61515.95
10.8114.2715.0331.985.3739.07
Farmland4351.334917.274713.34565.94−203.93362.01
35.6240.2538.5813.01−4.158.32
Forest146.43112.65163.00−33.7850.3516.57
1.200.921.33−23.0744.7011.32
Grassland555.34155.58135.31−399.76−20.27−420.03
4.551.271.11−71.98−13.03−75.63
Inland freshwaters396.27407.60564.2411.33156.64167.97
3.243.344.622.8638.4342.39
Coastal saltwater2078.17996.10782.62−1082.07−213.48−1295.55
17.018.156.41−52.07−21.43−62.34
Salt pan376.77675.13676.93298.361.80300.16
3.085.535.5479.190.2779.67
Mariculture630.24784.79902.97154.55118.18272.73
5.166.427.3924.5215.0643.27
Unused land252.59111.8877.80−140.71−34.08−174.79
2.070.920.64−55.71−30.46−69.20
Shallow water2109.102312.902364.08203.8051.18254.98
17.2618.9319.359.662.2112.09
Table A2. Characteristics of land–sea gradient structure of different LULC types in the study area during 2000–2020 (km2).
YearDistance from the Coastline LULC Types
(km)12345678910
2000−20–−10---------307.56
−10–00.09---0.030.94---1798.69
0–1092.4422.516.4828.6654.351625.7062.50251.2216.281.77
10–20142.49356.8339.44223.72131.27395.82234.75209.0169.02-
20–30232.53895.8337.34133.7183.2254.3179.1073.1883.08-
30–40217.82946.3525.3161.8152.19--54.4951.51-
40–50270.81908.959.7548.1630.59-0.2314.347.56-
50–60254.86809.909.6235.9823.071.22-17.5118.77-
60–7093.87352.0617.9322.2320.55--9.846.24-
70–8015.5956.780.520.980.84--0.63--
2010−20–−10---------308.11
−10–01.17---3.2126.66---1769.20
0–10188.6246.3610.393.34111.85812.80244.02469.4740.75234.33
10–20243.69630.4640.3418.97104.61154.65345.25194.1370.26-
20–30306.251075.3426.5642.6478.741.9785.7754.630.40-
30–40256.471020.9616.0646.6038.68--30.680.03-
40–50316.43913.071.9519.5527.92--11.240.28-
50–60302.63812.824.8914.5320.52--15.490.16-
60–70113.88357.6211.939.7221.07--8.50--
70–8013.7759.340.520.230.93--0.63--
2020−20–−10---------307.95
−10–07.00---18.3946.74---1727.85
0–10189.0928.1116.966.37185.81616.21291.56477.5622.74327.53
10–20254.02569.4951.4218.50148.44116.24310.72279.3754.17-
20–30318.381035.2948.0340.0384.743.4274.5967.490.40-
30–40276.24999.7321.1830.4953.71--28.140.04-
40–50333.00892.222.4318.0328.74--15.730.30-
50–60323.40777.429.9313.2720.48--26.510.16-
60–70121.16350.6112.508.4022.76--7.49--
70–8014.2158.900.520.221.00--0.63--
Note: in the table, 1—Construction land, 2—Farmland, 3—Forest, 4—Grassland, 5—Inland freshwaters, 6—Coastal saltwater, 7—Salt pan, 8—Mariculture, 9—Unused land, 10—Shallow water.

References

  1. Stamps, J. Habitat. In Encyclopedia of Ecology; Jørgensen, S.E., Fath, B.D., Eds.; Academic Press: Oxford, UK, 2008; pp. 1807–1810. [Google Scholar]
  2. Hillard, E.M.; Nielsen, C.K.; Groninger, J.W. Swamp rabbits as indicators of wildlife habitat quality in bottomland hardwood forest ecosystems. Ecol. Indic. 2017, 79, 47–53. [Google Scholar] [CrossRef]
  3. Wang, C.; Chang, Y.; Hou, X.Y.; Liu, Y.B. Temporal and Spatial Evolution Characteristics of Habitat Quality in Jiaodong Peninsula based on Changes of Land Use Pattern. J. Geo-Inf. Sci. 2021, 23, 1809–1822. [Google Scholar]
  4. Liu, C.F.; Wang, C. Spatio-temporal evolution characteristics of habitat quality in the Loess Hilly Region based on land use change: A case study in Yuzhong county. Acta Ecol. Sin. 2018, 38, 7300–7311. [Google Scholar]
  5. Liu, F.T.; Xu, E.Q. Comparison of spatial-temporal evolution of habitat quality between Xinjiang corps and non-corps region based on land use. Chin. J. Appl. Ecol. 2020, 31, 2341–2351. [Google Scholar]
  6. Zhang, J.D.; Hull, V.; Huang, J.Y.; Yang, W.; Zhou, S.Q.; Xu, W.H.; Huang, Y.; Ouyang, Z.Y.; Zhang, H.M.; Liu, J.G. Natural recovery and restoration in giant panda habitat after the Wenchuan earthquake. For. Ecol. Manag. 2014, 319, 1–9. [Google Scholar] [CrossRef]
  7. Cui, S.P.; Luo, X.; Li, C.W.; Jiang, Z.G. Predicting the potential distribution of white-lipped deer using the MaxEnt model. Biodivers. Sci. 2018, 26, 171–176. [Google Scholar] [CrossRef]
  8. Ohnson, E.T.; Benitez, M.E.; Fuentes, A.; McLean, C.R.; Norford, A.B.; Ordonez, J.C.; Beehner, J.C.; Bergman, T.J. High density of white-faced capuchins (Cebus capucinus) and habitat quality in the Taboga Forest of Costa Rica. Am. J. Primatol. 2020, 82, e23096. [Google Scholar]
  9. Wang, J.; Liu, H.Y.; Li, Y.F.; Liu, L.; Xie, F.F.; Lou, C.R.; Zhang, H.B. Effects of Spartina alterniflora invasion on quality of the red-crowned crane (Grus japonensis) wintering habitat. Environ. Sci. Pollut. Res. 2019, 26, 21546–21555. [Google Scholar] [CrossRef]
  10. Morton, D.C.; Defries, R.S.; Shimabukuro, Y.E.; Anderson, L.O.; Arai, E.; Del, B.; Morisette, J. Cropland expansion changes deforestation dynamics in the southern Brazilian Amazon. Proc. Natl. Acad. Sci. USA 2006, 103, 14637–14641. [Google Scholar] [CrossRef] [Green Version]
  11. Macedo, M.N.; Defries, R.S.; Morton, D.C.; Stickler, C.M.; Galford, G.L.; Shimabukuro, Y.E. Decoupling of deforestation and soy production in the southern Amazon during the late 2000s. Proc. Natl. Acad. Sci. USA 2018, 109, 1341–1346. [Google Scholar] [CrossRef] [Green Version]
  12. Xu, X.; Xie, Y.J.; Ke, Q.; Luo, Z.K.; Wang, X.R. Detecting the response of bird communities and biodiversity to habitat loss and fragmentation due to urbanization. Sci. Total Environ. 2018, 624, 1561–1576. [Google Scholar] [CrossRef]
  13. Llerena-Montoya, S.; Velastegui-Montoya, A.; Zhirzhan-Azanza, B.; Herrera-Matamoros, V.; Adami, M.; Lima, A.D.; Moscoso-Silva, F.; Encalada, L. Multitemporal analysis of land use and land cover within an oil block in the Ecuadorian Amazon. Int. J. Geo-Eng. 2021, 10, 191. [Google Scholar] [CrossRef]
  14. Velastegui-Montoya, A.; Lima, A.D.; Adami, M. Multitemporal analysis of deforestation in response to the construction of the Tucuruí Dam. Int. J. Geosci. 2020, 9, 583. [Google Scholar] [CrossRef]
  15. Parihar, S.M.; Pandey, V.K.; Shree, K.; Moin, K.; Ali, M.B.; Narasimhan, K.; Rai, J.; Kamil, A. Land use dynamics and impact on regional climate Post-Tehri Dam in the Bhilangana Basin, Garhwal Himalaya. Sustainability 2022, 14, 10221. [Google Scholar] [CrossRef]
  16. Qi, Z.X.; Xu, W.H.; Xiong, X.Y.; Ouyang, Z.Y. Assessment of potential habitat for Ursus thibetanus in the Qinling Mountains. Biodivers. Sci. 2011, 19, 343–352. [Google Scholar]
  17. Sun, X.Y.; Jiang, Z.; Liu, F.; Zhang, D.Z. Monitoring spatio-temporal dynamics of habitat quality in Nansihu Lake basin, eastern China, from 1980 to 2015. Ecol. Indic. 2019, 102, 716–723. [Google Scholar] [CrossRef]
  18. Antomi, Y. Model Habitat Quality in the Future in Padang City. Int. J. GEOMATE 2018, 16, 99–107. [Google Scholar] [CrossRef]
  19. Ye, X.; Li, J.; Wang, A.J. Sedimentary environment and its response to anthropogenic impacts in the coastal wetland of the Qi’ao Island, Zhujiang River Estuary. Haiyang Xuebao 2018, 40, 79–89. [Google Scholar]
  20. Li, H.D.; Gao, J.X. Management strategy for biodiversity conservation to adapt to climate change in China. Acta Ecol. Sin. 2020, 40, 3844–3850. [Google Scholar]
  21. Aretano, R.; Semeraro, T.; Petrosillo, I.; De Marco, A.; Pasimeni, M.R.; Zurlini, G. Mapping ecological vulnerability to fire for effective conservation management of natural protected areas. Ecol. Model. 2015, 295, 163–175. [Google Scholar] [CrossRef]
  22. Chen, J.; Wang, S.Y.; Mao, Z.P. Monitoring wetland changes in Yellow River Delta by remote sensing during 1976–2008. Prog. Geogr. 2011, 30, 585–592. [Google Scholar]
  23. Li, Y.L.; Kong, X.L.; Han, M.; Wang, M.; Pan, B.; Huang, S.P. Analysis of surface water changes and driving force in Yellow River Delta from 1986 to 2016. Trans. Chin. Soc. Agric. Eng. 2019, 35, 105–113. [Google Scholar] [CrossRef]
  24. Kong, D.X.; Miao, C.Y.; Borthwick, A.G.L.; Duan, Q.Y.; Liu, H.; Sun, Q.H.; Ye, A.Z.; Di, Z.H.; Gong, W. Evolution of the Yellow River Delta and its relationship with runoff and sediment load from 1983 to 2011. J. Hydrol. 2015, 520, 157–167. [Google Scholar] [CrossRef] [Green Version]
  25. Duan, X.F.; Xu, X.G. Emergy Analysis for Sustainable Development of Resources-Environment-Economy System in the Yellow River Delta. Prog. Geogr. 2006, 25, 45–55. [Google Scholar]
  26. Qi, Y.; Li, J.S.; Ma, Y.W.; He, J.; Fu, G.; Shen, Q.; Zhao, C.Y.; Cao, M. Distribution and risk assessment of heavy metals of surface sediments in intertidal flats of the Yellow River Delta, China. Res. Environ. Sci. 2020, 33, 1488–1496. [Google Scholar]
  27. Li, X.W.; Hou, X.Y.; Song, Y.; Shan, K.; Zhu, S.Y.; Yu, X.B.; Mo, X.Q. Assessing Changes of Habitat Quality for Shorebirds in Stopover Sites: A Case Study in Yellow River Delta, China. Wetlands 2018, 39, 67–77. [Google Scholar] [CrossRef]
  28. Wang, H. Study on Spatial-Temporal Variation of Soil Salt in the Yellow River Delta; Nanjing University: Nanjing, China, 2005. [Google Scholar]
  29. Li, R.S. Primary study on the superiorities, problems and countermeasures of the recent deposited delta of the Yellow River. J. Nat. Resour. 1990, 5, 149–155. [Google Scholar]
  30. Liu, Y.L. Strengthen the protection of Yellow River Delta Wetland. Green China 2013, 20, 36–41. [Google Scholar]
  31. Li, B.L.; Xu, X.G.; Lin, H.P. A method of investigating natural resources by computer-based interpretation of remote sensing images. Geogr. Territ. Res. 2002, 18, 34–37. [Google Scholar]
  32. Xie, X.L.; Ye, L.; Kang, X.Q.; Zeng, L.Q.; Farouk, A. Land Use Classification Using Improved U-Net in Remote Sensing Images of Urban and Rural Planning Monitoring. Sci. Program. 2022, 2022, 3125414. [Google Scholar] [CrossRef]
  33. Tan, Q.L. Urban building extraction from VHR multi-spectral images using object-based classification. Acta Geod. Et Cartogr. Sin. 2010, 39, 618–623. [Google Scholar]
  34. Dang, Y.M.; Yang, M.H.; Chang, Z.K. Research on the application of SPOT5 image visual interpretation in the updating of Land-Use types. Geomat. Spat. Inf. Technol. 2009, 32, 125–127. [Google Scholar]
  35. Cao, Y.; Mo, L.J.; Li, Y.; Zhang, W.M. Wetland landscape ecological classification: Research progress. Chin. J. Appl. Ecol. 2009, 20, 3084–3092. [Google Scholar]
  36. Konarska, K.M.; Sutton, P.C.; Castellon, M. Evaluating scale dependence of ecosystem service valuation: A comparison of NOAA-AVHRR and Landsat TM datasets. Ecol. Econ. 2002, 41, 491–507. [Google Scholar] [CrossRef]
  37. Suo, A.N.; Yu, Y.H.; Han, F.W. Response of ecosystem service value to wetland landscape pattern change in Panjin region of Liaohe Delta. Ecol. Econ. 2011, 6, 147–151. [Google Scholar]
  38. Costanza, R.; d’Arge, R.; de Groot, R.; Farber, S.; Grasso, M.; Hannon, B.; Limburg, K.; Naeem, S.; O’Neill, R.V.; Paruelo, J.; et al. The value of the world’s ecosystem services and natural capital. Nature 1997, 387, 253–260. [Google Scholar] [CrossRef]
  39. Di, X.H.; Hou, X.Y.; Wu, L. Land use classification system for China’s coastal zone based on remote sensing. Resour. Sci. 2014, 36, 463–472. [Google Scholar]
  40. Liang, X.; Guan, Q.; Clarke, K.C.; Liu, S.; Wang, B.; Yao, Y. Understanding the drivers of sustainable land expansion using a patch-generating land use simulation (PLUS) model: A case study in Wuhan, China. Comput. Environ. Urban Syst. 2021, 85, 101569. [Google Scholar] [CrossRef]
  41. Wang, J.N.; Wang, W.C.; Hai, M.M. Simulation analysis of land use change in Shandong Province based on PLUS model. Territ. Nat. Resour. Study 2022, 6, 1–8. [Google Scholar]
  42. Lin, T.; Yang, M.Z.; Wu, D.F.; Liu, F.; Yang, J.H.; Wang, Y.J. Spatial correlation and prediction of land use carbon storage based on the InVEST-PLUS model-a case study in Guangdong Province. China Environ. Sci. 2022, 42, 4827–4839. [Google Scholar]
  43. Yang, S.; Su, H.; Zhao, G.P. Multi-cenario simulation of urban ecosystem service value based on PLUS model: A case study of Hanzhong city. J. Arid Land Res. Environ. 2022, 36, 86–95. [Google Scholar]
  44. Yang, W.J.; Du, J.G.; He, H.G.; Yang, W.J.; Chen, L.Y. Urban growth boundary delimitation in Guangzhou city based on PLUS-UGB multi-scenarios simulation. Geospat. Inf. 2022, 20, 38–42. [Google Scholar]
  45. Deng, Y.; Jiang, W.G.; Wang, W.J.; Lu, J.X.; Chen, K. Urban expansion led to the degradation of habitat quality in the Beijing-TianjinHebei Area. Acta Ecol. Sin. 2018, 38, 4516–4525. [Google Scholar]
  46. Chu, L.; Huang, C.; Liu, Q.S.; Liu, G.H. Changes of coastal zone landscape spatial patterns and ecological quality in Liaoning Province from 2000 to 2010. Resour. Sci. 2015, 37, 1962–1972. [Google Scholar]
  47. Wang, H.; Zhang, H.Y.; Zhang, R.F.; Zhang, A.J.; Zhou, D.M. Effects of salt pan construction on surrounding soil and vegetation in coastal saline-alkaline area. Ecol. Environ. Sci. 2010, 19, 1242–1245. [Google Scholar]
  48. Wang, C. Biodiversity Assessment Spatiotemporal Characteristics of Jiaodong Peninsula Based on LUCC; Shandong Normal University: Jinan, China, 2020. [Google Scholar]
  49. Bai, L.M.; Feng, X.H.; Sun, R.F.; Gao, H. Spatial and temporal responses of habitat quality to urbanization: A case study of Changchun City, Jilin Province, China. Chin. J. Appl. Ecol. 2020, 31, 1267–1277. [Google Scholar]
  50. Chu, L.; Zhang, X.R.; Wang, T.W.; Li, Z.X.; Cai, C.F. Spatial-temporal evolution and prediction of urban landscape pattern and habitat quality based on CA-Markov and InVEST model. Chin. J. Appl. Ecol. 2018, 29, 4106–4118. [Google Scholar]
  51. Wu, J.S.; Cao, Q.W.; Shi, S.Q.; Lu, Z.Q. Spatio-temporal variability of habitat quality in Beijing-Tianjin-Hebei Area based on land use change. Chin. J. Appl. Ecol. 2015, 26, 3457–3466. [Google Scholar]
  52. Zhang, W.J.; Sun, X.Y.; Shan, R.F. Effects of land use change on habitat quality based on InVEST model in Shandong Peninsula. Environ. Ecol. 2019, 1, 15–23. [Google Scholar]
  53. Sharp, R.; Tallis, H.T.; Ricketts, T.; Guerry, A.D.; Wood, S.A.; Chaplin-Kramer, R.; Nelson, E.; Ennaanay, D.; Wolny, S.; Olwero, N.; et al. InVEST +VERSION+ User’s Guide; The Natural Capital Project; Stanford University; University of Minnesota; The Nature Conservancy; World Wildlife Fund: Stanford, CA, USA, 2016. [Google Scholar]
  54. Feng, S.; Sun, R.H.; Chen, L.D. Spatio-temporal variability of habitat quality based on land use pattern change in Beijing. Acta Ecol. Sin. 2018, 38, 4167–4179. [Google Scholar]
  55. Xu, L.T.; Chen, S.S.; Xu, Y.; Li, G.Y.; Su, W.Z. Impacts of Land-Use Change on Habitat Quality during 1985–2015 in the Taihu Lake Basin. Sustainability 2019, 11, 3513. [Google Scholar] [CrossRef] [Green Version]
  56. He, J.H.; Huang, J.L.; Li, C. The evaluation for the impact of land use change on habitat quality: A joint contribution of cellular automata scenario simulation and habitat quality assessment model. Ecol. Model. 2017, 366, 58–67. [Google Scholar] [CrossRef]
  57. Zhang, X.R.; Zhou, J.; Li, G.N.; Chen, C.; Li, M.M.; Luo, J.M. Spatial pattern reconstruction of regional habitat quality based on the simulation of land use changes from 1975 to 2010. J. Geogr. Sci. 2020, 30, 601–620. [Google Scholar] [CrossRef]
  58. Ding, Q.L.; Chen, Y.; Bu, L.T.; Ye, Y.M. Multi-Scenario analysis of habitat quality in the Yellow River Delta by coupling FLUS with InVEST model. Int. J. Environ. Res. Public Health 2021, 18, 2389. [Google Scholar] [CrossRef] [PubMed]
  59. Martinuzzi, S.; Januchowski-Hartley, S.R.; Pracheil, B.M.; McIntyre, P.B.; Plantinga, A.J.; Lewis, D.J.; Radeloff, V.C. Threats and opportunities for freshwater conservation under future land use change scenarios in the United States. Glob. Chang. Biol. 2014, 20, 113–124. [Google Scholar] [CrossRef] [PubMed]
  60. Nematollahi, S.; Fakheran, S.; Kienast, F.; Jafari, A. Application of InVEST habitat quality module in spatially vulnerability assessment of natural habitats (case study: Chaharmahal and Bakhtiari province, Iran). Env. Monit Assess 2020, 192, 487. [Google Scholar] [CrossRef] [PubMed]
  61. Evans, M.C.; Watson, J.E.M.; Fuller, R.A.; Venter, O.; Bennett, S.C.; Marsack, P.R.; Possingham, H.P. The Spatial Distribution of Threats to Species in Australia. BioScience 2011, 61, 281–289. [Google Scholar] [CrossRef]
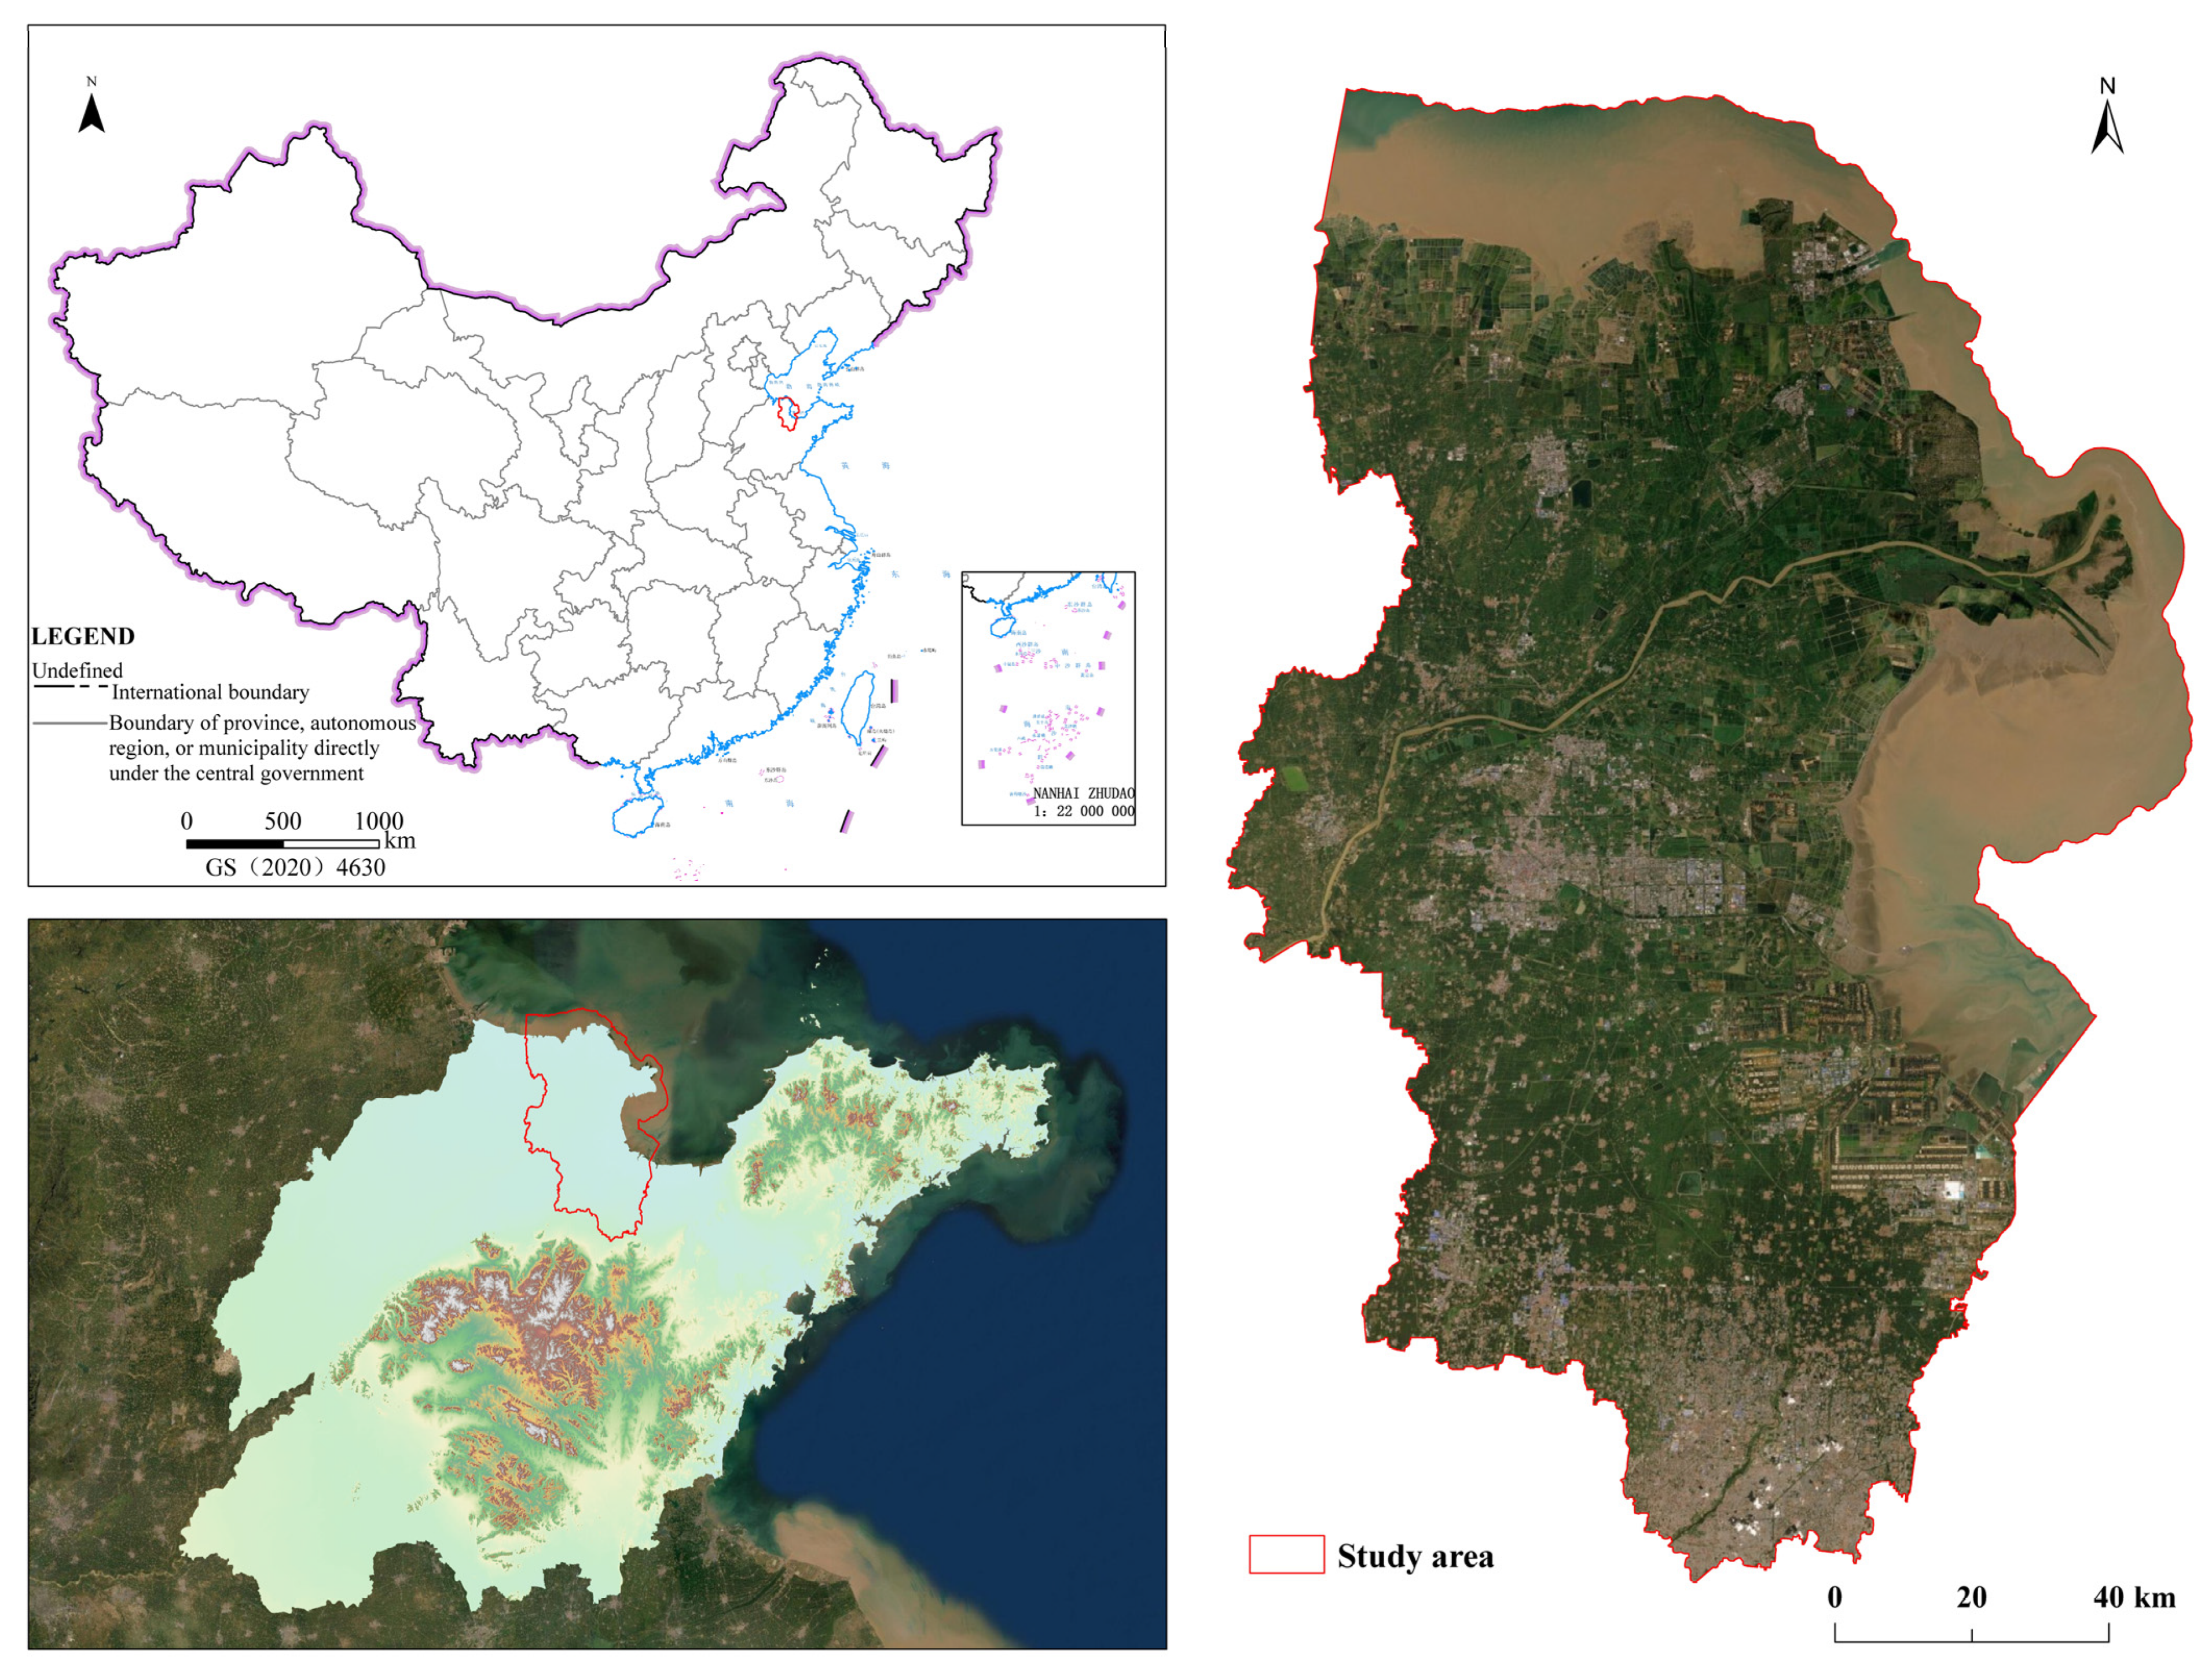
Figure 1. Location and extent map of study area.
Sustainability 14 15904 g001
Figure 2. Distribution of different LULC types in the study area from 2000 to 2020.
Sustainability 14 15904 g002
Figure 3. Transformation distribution of different LULC types in the study area during 2000–2020.
Sustainability 14 15904 g003
Figure 4. Changes of class metrics in the study area from 2000 to 2020.
Sustainability 14 15904 g004
Figure 5. Spatial distribution of habitat quality in the study area from 2000 to 2020.
Sustainability 14 15904 g005
Figure 6. Land and sea gradient changes of habitat quality in the study area during 2000–2020.
Sustainability 14 15904 g006
Figure 7. Spatial pattern of habitat quality in the study area under different scenarios in 2030.
Sustainability 14 15904 g007
Figure 8. Land and sea gradient changes of habitat quality in the study area under different scenarios in 2030 (compared with that in 2020).
Sustainability 14 15904 g008
Table 1. Threat factors and weight in the study area.
THREATMAX_DISTWEIGHTDECAY
Construction land101exponential
Farmland30.6linear
Salt pan50.8exponential
Mariculture20.5linear
Unused land10.4linear
Table 2. Habitat suitability of different LULC types and relative sensitivity to each threat factor in the study area.
Sl.
No.
LULC CategoryHABITATLand Use/Cover
Construction LandFarmlandSalt PanMaricultureUnused Land
1Construction land000000
2Farmland0.40.900.550.50.3
3Forest110.80.30.30.5
4Grassland0.810.850.50.550.5
5Inland freshwaters0.650.750.60.30.80.2
6Coastal saltwater10.950.80.750.850.35
7Salt pan000000
8Mariculture0.350.80.30.4500.2
9Unused land000000
10Shallow water0.850.950.70.80.850.1
Table 3. Changes of landscape metrics in the study area during 2000–2020.
YearDiversity IndexFragmentation IndexAggregation and Dispersion Index
SHDISHEINPPDCONTAGIJI
20001.68950.768910,9921.087557.181271.5178
20101.56650.712995560.964960.520262.6021
20201.59880.727710,0291.017959.498462.2804
Publisher’s Note: MDPI stays neutral with regard to jurisdictional claims in published maps and institutional affiliations.