

Microplastics in Kuwait’s Wastewater Streams

 ,
, 
 ,
,
Abstract
1. Introduction
2. Materials and Methods
3. Results
3.1. Microplastic Concentrations
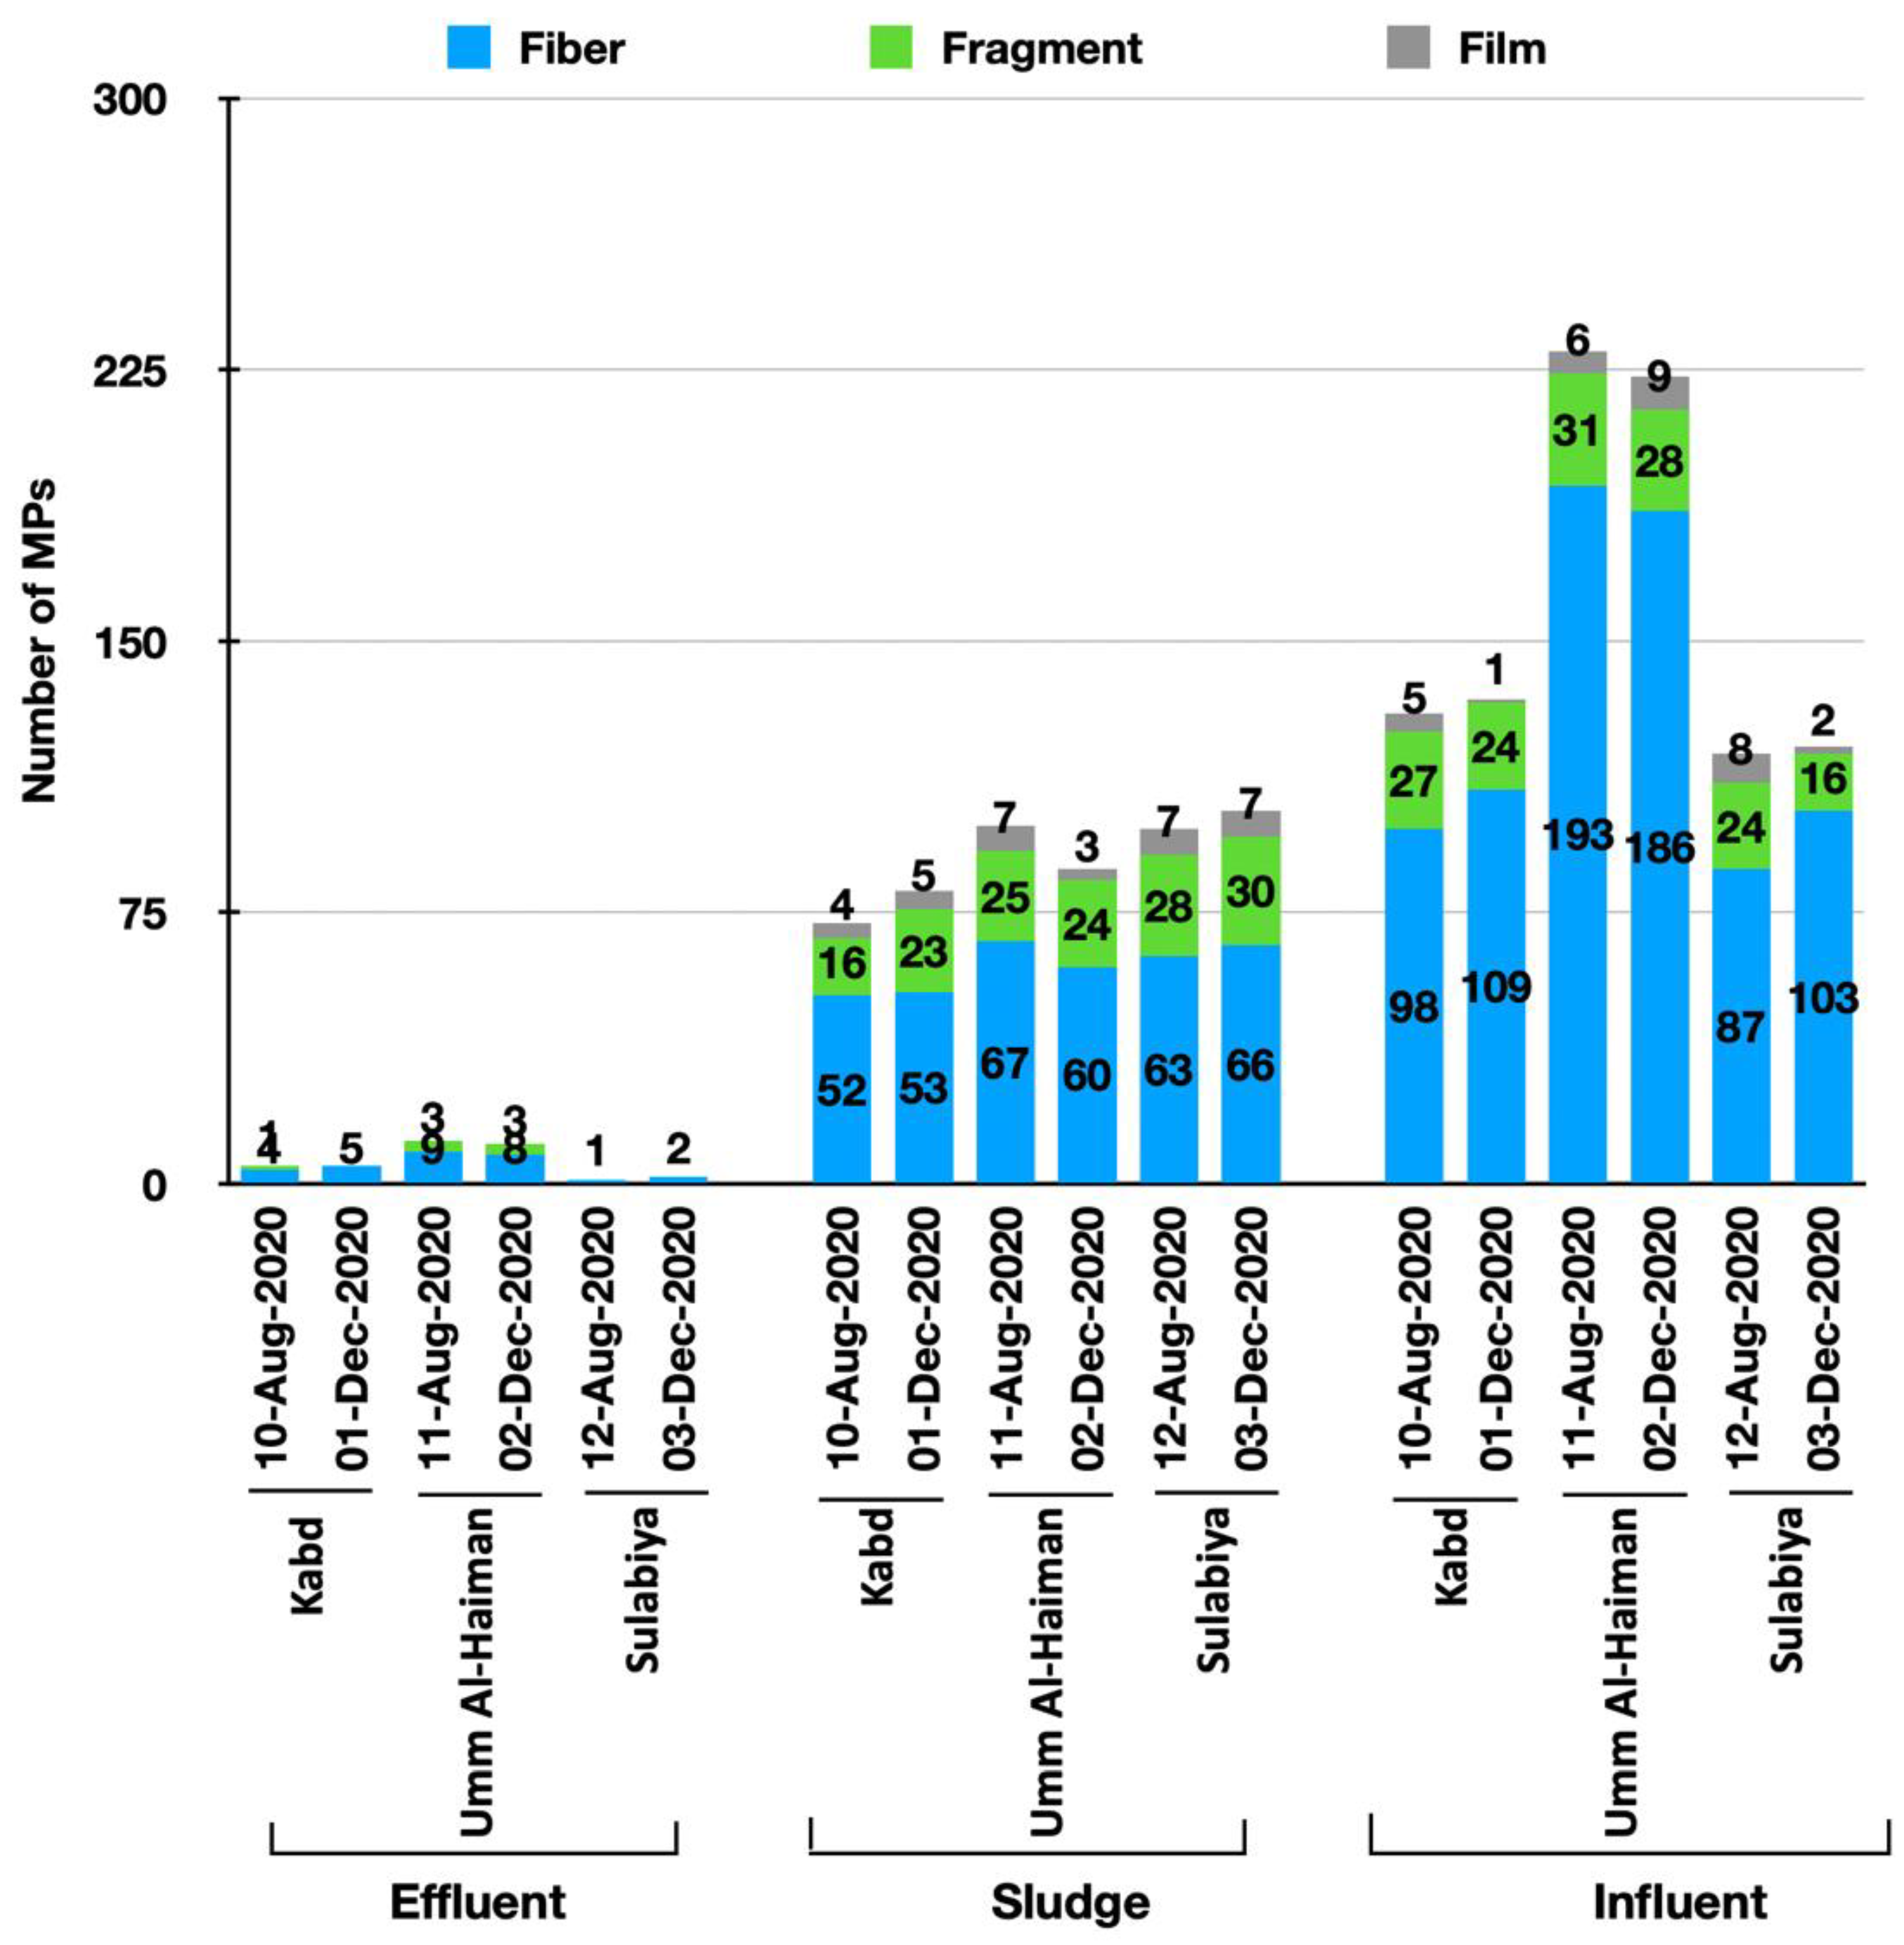
3.2. Characteristics of Microplastics
3.3. Microplastic Polymer Identification
3.4. Microplastics in Wastewater Streams from Other Studies

| Loc | Plant | Matrix | Concentration | References |
|---|---|---|---|---|
| Kuwait | Kabd WWTP—treating approximately 270,000 m3 d−1 | Influent | 130 ± 4–134 ± 5 MP/L | This Study |
| Effluent | 5 ± 1 MP/L | |||
| Sludge | 72 ± 3–81 ± 4 MP/g | |||
| Umm Al-Haiman WWTP treats about 20,000 m3 d−1 | Influent | 223 ± 4–230 ± 3 MP/L | ||
| Effluent | 11 ± 2–12 ± 3 MP/L | |||
| Sludge | 87 ± 5–99 ± 6 MP/g | |||
| Sulabiya WWTP treats about 450,000 m3 d−1 | Influent | 119 ± 2–121 ± 3 MP/L | ||
| Effluent | 1 ± 1–2 ± 1 MP/L | |||
| Sludge | 98 ± 5–103 ± 6 MP/g | |||
| Sydney, Australia | WWTP—A: Serving >1,000,000 inhabitants; receiving 308 million liters influent per day | Effluent post Primary Wastewater Treatment | 12 particles total (10 PET and 2 PE). 1.5 MP/L making a total discharge of 4.6 × 10⁸ MP/day discharged to the ocean via a deep pipeline | [70] |
| WWTP—B: Secondary treatment of 17 million liters wastewater | Effluent post Secondary Treatment | 0.48 MP/L; likely to discharge 8.16 × 10⁶ MP/day from a cliff into the ocean. | ||
| WWTP—C | Primary | 81 MP identified; 2.2 MP/L | ||
| Tertiary (13 × 106 L d−1) | 59 MP identified; 0.28 MP/L 3.6 × 10⁶ MP/day discharged | |||
| RO (40 × 106 L d−1) | 42 MP identified; 0.21 MP/L, 1.0 × 10⁷ MP/day discharged | |||
| British Colombia, Canada | Major WWTP, Vancouver | Influent | 31.1 ± 6.7 MP/L | [71] |
| Primary Effluent | 2.6 ± 1.4 MP/L | |||
| Secondary Effluent | 0.5 ± 0.2 MP/L | |||
| Primary Sludge | 14.9 ± 6.3 MP/g | |||
| Secondary Sludge | 4.4 ± 2.8 MP/g | |||
| China | 6031 WWTP, China | Estimates from Effluent disposal | Average microbeads discharge 170.5 × 10¹² MP/year; 249.5 t y−1 | [72] |
| 28 WWTPs | Sludge | 22.7 ± 12.1 × 10³ MP/kg dw | [73] | |
| Denmark (10 largest WWTPs managing 26% of Denmark’s wastewater) | WWTP1 | Influent | 10,044 MP/L, 181 µg/L | [74] |
| Effluent | 127 MP/L, 3.6 µg/L | |||
| WWTP2 | Influent | 8762 MP/L, 407 µg/L | ||
| Effluent | 447 MP/L, 11.9 µg/L | |||
| WWTP3 | Influent | 6830 MP/L, 268 µg/L | ||
| Effluent | 42 MP/L, 0.6 µg/L | |||
| WWTP4 | Influent | 6021 MP/L, 193 µg/L | ||
| Effluent | 29 MP/L, 0.5 µg/L | |||
| WWTP5 | Influent | 18,285 MP/L, 482 µg/L | ||
| Effluent | 214 MP/L, 5.4 µg/L | |||
| WWTP6 | Influent | 4994 MP/L, 1189 µg/L | ||
| Effluent | 182 MP/L, 11.6 µg/L | |||
| WWTP7 | Influent | 2223 MP/L, 212 µg/L | ||
| Effluent | 35 MP/L, 0.7 µg/L | |||
| WWTP8 | Influent | 8149 MP/L, 407 µg/L | ||
| Effluent | 19 MP/L, 1.4 µg/L | |||
| WWTP9 | Influent | 7601 MP/L, 118 µg/L | ||
| Effluent | 43 MP/L, 4.8 µg/L | |||
| WWTP10 | Influent | 5362 MP/L, 61 µg/L | ||
| Effluent | 65 MP/L, 3.8 µg/L | |||
| Mikkeli, Finland | Kenkaveronniemi WWTP, treating 10,000 m3/day | Influent | 57.6 ± 12.4 MP/L | [69] |
| Effluent | 1.0 ± 0.4 MP/L | |||
| Pilot membrane bioreactor, Mikkeli WWTP 3 m3/day | Permeate | 0.4 ± 0.1 MP/L | ||
| MBR Sludge | 27.3 ± 4.7 MP/g dw | |||
| Kenkaveronniemi WWTP | Activated Sludge | 23.0 ± 4.2 MP/g dw | ||
| Digested Sludge | 170.9 ± 28.7 MP/g dw | |||
| Helsinki, Finland | Viikinmaki WWTP | Influent | 180 MP/L (textile fibers); 430 MP/L (synthetic particles | [67] |
| Marine Sediment | 1.7 ± 1.0 MP/Kg (fibers), 1220 ± 160 MP/kg black carbon, 7.2 ± 4.9 MP/kg synthetic particles; 70 ± 20 MP/kg ring-shaped | |||
| Suomenoja WWTP | Effluent | 4.9 ± 1.4 MP/L (fibers) 8.6 ± 2.5 MP/L (synthetic fibers) | ||
| Marine Sediment | 4.7 ± 3.5 MP/Kg (fibers), 1060 ± 471 MP/kg black carbon, 10 ± 14 MP/kg synthetic particles; 3.8 ± 2.3 MP/kg ring-shaped | |||
| Helsinki archipelago | Seawater | 0.01–0.24 MP/L (fibers) 0.5–9.4 MP/L (particles) | ||
| Viikinmaki Discharge site | 0.06 MP/L (fibers) 2.4 MP/L (particles) | |||
| Suomenoja Discharge site | 0.17 MP/L (fibers) 3.1 MP/L (particles) | |||
| Vanhakaupunki Bay | 0.65 MP/L (fibers) 0.5 MP/L (particles) | |||
| Viikinmaki WWTP: discharges an average of 270,000 m3 treated water into the Gulf of Finland | Influent | 380 ± 52.2–686.7 ± 155.0 MP/L | [75] | |
| Post Pre-treatment | 9.9 ± 1.0–14.2 ± 4.0 MP/L | |||
| After AS | 1.0 ± 0.6–2.0 ± 0.2 MP/L | |||
| Effluent | 0.7 ± 0.6–3.5 ± 1.3 MP/L | |||
| Reject water | 12,866.7 ± 275.4 MP/L; 12.9 ± 0.3 MP/g 2.74 × 10⁶ L/day | |||
| Recess + Raw Sludge | 63,611.1 ± 3543.7 MP/L 76.3 ± 4.3 MP/g; 2.92 × 10⁶ L/day | |||
| Dry Sludge | 186.7 ± 26.0 MP/g; 1.84 × 10⁵ L/day | |||
| France | Seine-Centre WWTP | Influent | 293,000 MP/m3 | [76] |
| Settled wastewater | 90,000 MP/m3 | |||
| Effluent | 35,000 MP/m3 | |||
| Germany | Jade Bight, Wilhelmshaven WWTP | Effluent | 32.7 ± 16.7 MP/L (granular) 23.7 ± 1.1 MP/L (fragments) | [77] |
| 12 WWTPs in Saxony | Wastewater Effluent | 10 MP m−3 (Oldenburg); 80 MP m−3 (Neuharlingersiel); 700 MP m−3 (Essen); 9000 MP m−3 in Holdorf | [78] | |
| Sludge | 1000 MP kg−1 Dw in Oldenbury to 24,000 MP kg−1 dw in Scharrel | |||
| India | Influent | 17.88 MP/L | [79] | |
| Effluent | 2.75 MP/L | |||
| Iran | Bandar Abbas WWTP | Effluent | 2.02 MP/L | [7] |
| Sludge | 6070 MP kg−1 dw | |||
| Italy | Northern Italy WWTP | Influent | 2.0 ± 0.3 MP/L | [80] |
| Settler | 0.6 ± 0.2 MP/L | |||
| Effluent | 0.3 ± 0.1 MP/L | |||
| Sludge | 59.5 MP/gram | |||
| Netherlands | Westpoort WWTP | Influent | 910 MP/L | [81] |
| Effluent | 39 MP/L | |||
| Amsterdam West WWTP | Effluent | 60 ± 45 MP/L | ||
| Amstelveen WWTP | Influent | 73 ± 13 MP/L | ||
| Effluent | 65 ± 67 MP/L | |||
| Blaricum WWTP | Influent | 238 ± 289 MP/L | ||
| Effluent | 81 ± 56 MP/L | |||
| Horstermeer WWTP | Influent | 91 ± 116 MP/L | ||
| Effluent | 56 ± 43 MP/L | |||
| Houtrust WWTP | Effluent | 55 ± 15 MP/L | ||
| Heenvliet WWTP | Influent | 68 ± 27 MP/L | ||
| Effluent | 58 ± 29 MP/L | |||
| MBR, Heenvliet WWTP | Effluent | 51 ± 14 MP/L | ||
| Heenvliet WWTP | Sludge | 660 ± 410 MP/kg ww | ||
| Westpoort WWTP | Sludge | 510 MP/kg ww | ||
| Amsterdam West WWTP | Sludge | 760 MP/kg ww | ||
| Scotland | Glasgow WWTP producing 260,954 m3 treated water per day | Influent (coarse screening) | 15.70 ± 5.23 MP/L 4097 ± 1365 million MP/day | [82] |
| Effluent (grit and grease) | 8.70 ± 1.56 MP/L 2270 ± 406 million MP/day | |||
| Primary effluent | 3.40 ± 0.28 MP/L 887 ± 74 million MP/day | |||
| Final effluent | 0.25 ± 0.04 MP/L 65 ± 11 million MP/day | |||
| Spain | Influent | 4.40 MP/L | [83] | |
| Effluent | 0.92–1.08 MP/L | |||
| Effluent | 12.8 MP/L | [84] | ||
| Effluent | 0.44 MP/L | [85] | ||
| Effluent | 0.31 MP/L | [86] | ||
| Cadiz | Influent | 574.92 (274.7–1567.5 MP/L) | [87] | |
| Effluent | 41.77 (7.15–131.55 MP/L) | |||
| Influent | 645–1567 MP/L | [88] | ||
| Effluent | 16.4–13.35 MP/L | |||
| Sludge | 112 MP/g | [85] | ||
| Sludge | 165 MP/g | [84] | ||
| Sludge | 50.1 MP/g | [89] | ||
| Sweden | Langeviksverket WWTP | Influent | 15.1 ± 0.89 × 10³ MP/m3 | [90] |
| Effluent | 8.25 ± 0.85 MP/m3 | |||
| Sludge | 720 ± 112 MP/kg ww 16.7 ± 1.96 × 10³ MP/kg dw | |||
| Thailand | Influent | 12.2 MP/L | [91] | |
| Effluent | 2.0 MP/L | |||
| Sludge | 103.4 MP/kg dw | |||
| Turkiye | W1–W2 | Influent | 1.5–3.1 MP/L | [92,93] |
| Effluent | 4.11–7.00 MP/L | |||
| Influent | 23.44–26.56 MP/L | |||
| Effluent | 0.6–1.6 MP/L | |||
| United Kingdom | Influent | 7011 (955–17,214 MP/L) | [94] | |
| Effluent | 15.7 (2–54 MP/L) | |||
| Sludge | 301–10,380 MP/g | |||
| United States of America | Detroit, Michigan WWTP | Influent | 797.8 MP/L | [95] |
| Effluent | 5.88 MP/L | |||
| Northfield, Minnesota WWTP | Influent | 367 M/L | ||
| Effluent | 6.2 MP/L | |||
| Northfield Pilot AnMBR | Influent | 367 MP/L | ||
| Effluent | 0.53 MP/L | |||
| Northern California SFB1 | Effluent | 0.195 MP/L; 456,691 MP/day | [96] | |
| Northern California SFB2 | Effluent | 0.064 MP/L; 2,045,092 MP/day | ||
| Northern California SFB3 | Effluent | 0.092 MP/L; 4,134,574 MP/day | ||
| Northern California SFB4 | Effluent | 0.127 MP/L; 9,625,335 MP/day | ||
| Northern California SFB5 | Effluent | 0.072 MP/L; 8,086,115 MP/day | ||
| Northern California SFB6 | Effluent | 0.071 MP/L; 12,433,886 MP/day | ||
| Northern California SFB7 | Effluent | 0.022 MP/L; 4,105,857 MP/day | ||
| Northern California SFB8 | Effluent | 0.047 MP/L; 14,916,649 MP/day | ||
| Western New York LE1 | Effluent | 0.01 MP/L; 64,487 MP/day | ||
| Western New York LE2 | Effluent | 0.009 MP/L; 101,365 MP/day | ||
| Western New York LE3 | Effluent | 0.047 MP/L; 1,237,402 MP/day | ||
| Eastern New York, LC | Effluent | 0.004 MP/L; 52,773 MP/day | ||
| Central New York FL1 | Effluent | 0.008 MP/L; 118,706 MP/day | ||
| Central New York FL2 | Effluent | 0.019 MP/L; 4,078,889 MP/day | ||
| Northern Ohio LE4 | Effluent | 0.042 MP/L; 4,769,334 MP/day | ||
| Eastern Wisconsin LM1 | Effluent | 0.0007 MP/L; 2,251,990 MP/day | ||
| Eastern Wisconsin LM2 | Effluent | 0.017 MP/L; 6,055,005 MP/day | ||
| Los Angeles, WRP1 | Effluent | 0.082 MP/m3 | [97] | |
| Los Angeles, WRP2 | Effluent | 0.039 MP/m3 | ||
| Los Angeles, WRP3 | Effluent | 0.018 MP/m3 | ||
| Los Angeles, WRP4 | Effluent | 0.022 MP/m3 | ||
| Los Angeles, WRP5 | Effluent | 0.136 MP/m3 | ||
| Los Angeles, WRP6 | Effluent | 0.020 MP/m3 | ||
| Los Angeles, WRP7 | Effluent | 0.005 MP/m3 | ||
| East Bay Main Wastewater Treatment Plant, San Francisco Bay | 0.09 MP/gallon | [98] |
4. Discussion
5. Conclusions
Author Contributions
Funding
Institutional Review Board Statement
Informed Consent Statement
Conflicts of Interest
References
- Alimi, O.S.; Farner Budarz, J.; Hernandez, L.M.; Tufenkji, N. Microplastics and nanoplastics in aquatic environments: Aggregation, deposition, and enhanced contaminant transport. Environ. Sci. Technol. 2018, 52, 1704. [Google Scholar] [CrossRef] [PubMed]
- Eerkes-Medrano, D.; Thompson, R.C.; Aldridge, D.C. Microplastics in freshwater systems: A review of the emerging threats, identification of knowledge gaps and prioritisation of research needs. Water Res. 2015, 75, 63. [Google Scholar] [CrossRef]
- Habib, R.; Thiemann, T.; Kendi, R. Microplastics and Wastewater Treatment Plants—A Review. J. Water Resour. Prot. 2020, 12, 1–35. [Google Scholar] [CrossRef]
- Ivar do Sul, J.A.; Costa, M.F. The present and future of microplastic pollution in the marine environment. Environ. Pollut. 2014, 185, 352–364. [Google Scholar] [CrossRef] [PubMed]
- United Nations. The State of Plastics. World Environment Day Outlook; United Nations: New York, NY, USA, 2018. [Google Scholar]
- Uddin, S.; Fowler, S.W.; Behbehani, M. An assessment of microplastic inputs into the aquatic environment from wastewater streams. Mar. Pollut. Bull. 2020, 160, 111538. [Google Scholar] [CrossRef]
- Naji, A.; Azadkhah, S.; Farahani, H.; Uddin, S.; Khan, F.R. Microplastics in wastewater outlets of Bandar Abbas city (Iran): A potential point source of microplastics into the Persian Gulf. Chemosphere 2021, 262, 128039. [Google Scholar] [CrossRef] [PubMed]
- Uddin, S.; Fowler, S.W.; Uddin, M.F.; Behbehani, M.; Naji, A. A review of microplastic distribution in sediment profiles. Mar. Pollut. Bull. 2021, 163, 111973. [Google Scholar] [CrossRef]
- Jinadasa, B.K.K.K.; Uddin, S.; Fowler, S.W. Microplastics (MPs) in marine food chains: Is it a food safety issue? In Advances in Food and Nutrition Research; Academic Press: New York, NY, USA, 2022; Volume 103. [Google Scholar]
- Baztan, J.; Bergmann, M.; Booth, A.; Broglio, E.; Carrasco, A.; Chouinard, O.; Clüsener-Godt, M.; Cordier, M.; Cozar, A.; Devrieses, L.; et al. Breaking Down the Plastic Age. In Fate and Impact of Microplastics in Marine Ecosystems; Baztan, J., Jorgensen, B., Pahl, S., Thompson, R.C., Vanderlinden, J.-P., Eds.; Elsevier: Amsterdam, The Netherlands, 2017; pp. 177–181. [Google Scholar] [CrossRef]
- Bergmann, M.; Wirzberger, V.; Krumpen, T.; Lorenz, C.; Primpke, S.; Tekman, M.B.; Gerdts, G. High Quantities of Microplastic in Arctic Deep-Sea Sediments from the HAUSGARTEN Observatory. Environ. Sci. Technol. 2017, 51, 11000. [Google Scholar] [CrossRef] [PubMed]
- Eriksen, M.; Lebreton, L.C.M.; Carson, H.S.; Thiel, M.; Moore, C.J.; Borerro, J.C.; Galgani, F.; Ryan, P.G.; Reisser, J. Plastic Pollution in the World’s Oceans: More than 5 Trillion Plastic Pieces Weighing over 250,000 Tons Afloat at Sea. PLoS ONE 2014, 9, e111913. [Google Scholar] [CrossRef]
- van Sebille, E.; Wilcox, C.; Lebreton, L.; Maximenko, N.; Hardesty, B.D.; van Franeker, J.A.; Eriksen, M.; Siegel, D.; Galgani, F.; Law, K.L. A Global Inventory of Small Floating Plastic Debris. Environ. Res. Lett. 2015, 10, 124006. [Google Scholar] [CrossRef]
- Freeman, S.; Booth, A.; Sabbah, I.; Tiller, R.; Dierking, J.; Klun, K.; Rotter, A.; Ben David, E.; Javidpour, J.; Angel, D. Between source and sea: The role of wastewater treatment in reducing marine microplastics. J. Environ. Manag. 2020, 266, 110642. [Google Scholar] [CrossRef]
- Jambeck, J.R.; Geyer, R.; Wilcox, C.; Siegler, T.R.; Perryman, M.; Andrady, A.; Narayan, R.; Law, K.L. Plastic waste inputs from land into the ocean. Science 2015, 347, 768–771. [Google Scholar] [CrossRef]
- Seltenrich, N. New Link in the Food Chain? Marine Plastic Pollution and Seafood Safety. Environ. Health Perspect. 2015, 123, A34–A41. [Google Scholar] [CrossRef]
- Al-Salem, S.M.; Uddin, S.; Al-Yamani, F. An assessment of microplastics threat to the marine environment: A short review in context of the Arabian/Persian Gulf. Mar. Environ. Res. 2020, 159, 104961. [Google Scholar] [CrossRef]
- Mintenig, S.; Int-Veen, I.; Löder, M.G.; Primpke, S.; Gerdts, G. Identification of microplastic in effluents of waste water treatment plants using focal plane array-based micro-Fourier-transform infrared imaging. Water Res. 2017, 108, 365–372. [Google Scholar] [CrossRef] [PubMed]
- Al-Salem, S.M.; Uddin, S.; Lyons, B. Evidence of microplastics (MP) in gut content of major consumed marine fish species in the State of Kuwait (of the Arabian/Persian Gulf). Mar. Pollut. Bull. 2020, 154, 111052. [Google Scholar] [CrossRef] [PubMed]
- Conley, K.; Clum, A.; Deepe, J.; Lane, H.; Beckingham, B. Wastewater treatment plants as a source of microplastics to an urban estuary: Removal efficiencies and loading per capita over one year. Water Res. X 2019, 3, 100030. [Google Scholar] [CrossRef] [PubMed]
- Boucher, J.; Friot, D. Primary Microplastics in the Oceans: A Global Evaluation of Sources; IUCN: Gland, Switzerland, 2017. [Google Scholar]
- Uddin, S.; Fowler, S.W.; Saeed, T. Microplastic particles in the Persian/Arabian Gulf—A review on sampling and idenification. Mar. Pollut. Bull. 2020, 154, 111100. [Google Scholar] [CrossRef] [PubMed]
- Browne, M.A.; Crump, P.; Niven, S.J.; Teuten, E.; Tonkin, A.; Galloway, T.; Thompson, R. Accumulation of microplastic on shorelines woldwide: Sources and sinks. Environ. Sci. Technol. 2011, 45, 9175–9179. [Google Scholar] [CrossRef]
- De Falco, F.; Di Pace, E.; Cocca, M.; Avella, M. The contribution of washing processes of synthetic clothes to microplastic pollution. Sci. Rep. 2019, 9, 6633. [Google Scholar] [CrossRef]
- Devriese, L.I.; van der Meulen, M.D.; Maes, T.; Bekaert, K.; Paul-Pont, I.; Frère, L.; Robbens, J.; Vethaak, A.D. Microplastic contamination in brown shrimp (Crangon crangon, Linnaeus 1758) from coastal waters of the Southern North Sea and Channel area. Mar. Pollut. Bull. 2015, 98, 179–187. [Google Scholar] [CrossRef] [PubMed]
- Li, J.N.; Lusher, A.L.; Rotchell, J.M.; Deudero, S.; Turra, A.; Brate, I.L.N.; Sun, C.J.; Hossain, M.S.; Li, Q.P.; Kolandhasamy, P.; et al. Using mussel as a global bioindicator of coastal microplastic pollution. Environ. Pollut. 2019, 244, 522. [Google Scholar] [CrossRef]
- Lusher, A.L.; Welden, N.A.; Sobral, P.; Cole, M. Sampling, isolating and identifying microplastics ingested by fish and invertebrates. Anal. Methods 2017, 9, 1346. [Google Scholar] [CrossRef]
- Alimba, C.G.; Faggio, C. Microplastics in the marine environment: Current trends in environmental pollution and mechanisms of toxicological profile. Environ. Toxicol. Pharmacol. 2019, 68, 61–74. [Google Scholar] [CrossRef]
- Rodrigues, J.P.; Duarte, A.C.; Santos-Echeandía, J.; Rocha-Santos, T. Significance of interactions between microplastics and POPs in the marine environment: A critical overview. TrAC Trends Anal. Chem. 2019, 111, 252–260. [Google Scholar] [CrossRef]
- Prinz, N.; Korez, Š. Understanding How Microplastics Affect Marine Biota on the Cellular Level Is Important for Assessing Ecosystem Function: A Review. In YOUMARES 9—The Oceans: Our Research, Our Future: Proceedings of the 2018 Conference for YOUng MArine RESearcher, Oldenburg, Germany, 11–14 September 2018; Jungblut, S., Liebich, V., Bode-Dalby, M., Eds.; Springer International Publishing: Cham, Switzerland, 2020; pp. 101–120. [Google Scholar] [CrossRef]
- Lusher, A.; McHugh, M.; Thompson, R. Occurrence of microplastics in the gastrointestinal tract of pelagic and demersal fish from the English Channel. Mar. Pollut. Bull. 2013, 67, 94–99. [Google Scholar] [CrossRef] [PubMed]
- Rochman, C.M. The complex mixture, fate and toxicity of chemicals associated with plastic debris in the marine environment. In Marine Anthropogenic Litter; Springer: Cham, Switzerland, 2015; pp. 117–140. [Google Scholar]
- Naji, A.; Nuri, M.; Vethaak, A.D. Microplastics contamination in molluscs from the northern part of the Persian Gulf. Environ. Pollut. 2018, 235, 113–120. [Google Scholar] [CrossRef]
- Zakeri, M.; Naji, A.; Akbarzadeh, A.; Uddin, S. Microplastic ingestion in important commercial fish in the southern Caspian Sea. Mar. Pollut. Bull. 2020, 160, 111598. [Google Scholar] [CrossRef]
- Zhao, Y.; Bao, Z.; Wan, Z.; Fu, Z.; Jin, Y. Polystyrene microplastic exposure disturbs hepatic glycolipid metabolism at the physiological, biochemical, and transcriptomic levels in adult zebrafish. Sci. Total Environ. 2020, 710, 136279. [Google Scholar] [CrossRef]
- De Felice, B.; Sabatini, V.; Antenucci, S.; Gattoni, G.; Santo, N.; Bacchetta, R.; Ortenzi, M.A.; Parolini, M. Polystyrene microplastics ingestion induced behavioral effects to the cladoceran Daphnia magna. Chemosphere 2019, 231, 423–431. [Google Scholar] [CrossRef]
- Khan, F.R.; Syberg, K.; Shashoua, Y.; Bury, N.R. Influence of polyethylene microplastic beads on the uptake and localization of silver in zebrafish (Danio rerio). Environ. Pollut. 2015, 206, 73–79. [Google Scholar] [CrossRef] [PubMed]
- Sussarellu, R.; Suquet, M.; Thomas, Y.; Lambert, C.; Fabioux, C.; Pernet, M.E.J.; Le Goïc, N.; Quillien, V.; Mingant, C.; Epelboin, Y.; et al. Oyster reproduction is affected by exposure to polystyrene microplastics. Proc. Natl. Acad. Sci. USA 2016, 113, 2430–2435. [Google Scholar] [CrossRef] [PubMed]
- Leslie, H.A.; van Velzen, M.J.M.; Brandsma, S.H.; Vethaak, A.D.; Garcia-Vallejo, J.J.; Lamoree, M.H. Discovery and quantification of plastic particle pollution in human blood. Environ. Int. 2022, 163, 107199. [Google Scholar] [CrossRef] [PubMed]
- Abbasi, S.; Keshavarzi, B.; Moore, F.; Turner, A.; Kelly, F.J.; Dominguez, A.O.; Jaafarzadeh, N. Distribution and potential health impacts of microplastics and microrubbers in air and street dusts from Asaluyeh County, Iran. Environ. Pollut. 2019, 244, 153–164. [Google Scholar] [CrossRef]
- Barboza, L.G.A.; Lopes, C.; Oliveira, P.; Bessa, F.; Otero, V.; Henriques, B.; Raimundo, J.; Caetano, M.; Vale, C.; Guilhermino, L. Microplastic in wild fish from North East Atlantic Ocean and its potential for causing neurotoxic effects, lipid oxidative damage, and human health risks associated with ingestion exposure. Sci. Total Environ. 2020, 717, 134625. [Google Scholar] [CrossRef] [PubMed]
- Besseling, E.; Redondo-Hasselerharm, P.; Foekema, E.M.; Koelmans, A.A. Quantifying ecological risks of aquatic micro- and nanoplastic. Crit. Rev. Environ. Sci. Technol. 2019, 49, 32–80. [Google Scholar] [CrossRef]
- Browne, M.A.; Niven, S.J.; Galloway, T.S.; Rowland, S.J.; Thompson, R.C. Microplastic moves pollutants and additives to worms, reducing functions linked to health and biodiversity. Curr. Biol. 2013, 23, 2388–2392. [Google Scholar] [CrossRef]
- Browne, M.A. Sources and Pathways of Microplastics to Habitats. In Marine Anthropogenic Litter; Bergmann, M., Gutow, L., Klages, M., Eds.; Springer International Publishing: Cham, Switzerland, 2015; pp. 229–244. [Google Scholar] [CrossRef]
- Mohsen, M.; Wang, Q.; Zhang, L.; Sun, L.; Lin, C.; Yang, H. Microplastic ingestion by the farmed sea cucumber Apostichopus japonicus in China. Environ. Pollut. 2019, 245, 1071–1078. [Google Scholar] [CrossRef]
- Vroom, R.J.E.; Koelmans, A.A.; Besseling, E.; Halsband, C. Aging of microplastics promotes their ingestion by marine zooplankton. Environ. Pollut. 2017, 231, 987–996. [Google Scholar] [CrossRef] [PubMed]
- Zhang, J.; Wang, L.; Kannan, K. Microplastics in house dust from 12 countries and associated human exposure. Environ. Int. 2020, 134, 105314. [Google Scholar] [CrossRef]
- Smith, M.; Love, D.C.; Rochman, C.M.; Neff, R.A. Microplastics in Seafood and the Implications for Human Health. Curr. Environ. Health Rep. 2018, 5, 375–386. [Google Scholar] [CrossRef] [PubMed]
- Sun, J.; Dai, X.; Wang, Q.; van Loosdrecht, M.C.M.; Ni, B.-J. Microplastics in wastewater treatment plants: Detection, occurrence and removal. Water Res. 2019, 152, 21–37. [Google Scholar] [CrossRef] [PubMed]
- Sundt, P.; Schulze, P.-E.; Syversen, F. Sources of Microplastics-Pollution to the Marine Environment; Report No. M-321|2015; Norwegian Environment Agency: Oslo, Norway, 2014; p. 86.
- Naser, H.A. Assessment and management of heavy metal pollution in the marine environment of the Persian Gulf: A review. Mar. Pollut. Bull. 2013, 72, 6–13. [Google Scholar] [CrossRef]
- Al Enezi, G.; Hamoda, M.F.; Fawzi, N. Heavy metals content of municipal wastewater and sludges in Kuwait. J. Environ. Sci. Health Part A Toxic/Hazard. Subst. Environ. Eng. 2004, 39, 397–407. [Google Scholar] [CrossRef] [PubMed]
- Gaston, E.; Woo, M.; Steele, C.; Sukumaran, S.; Anderson, S. Microplastics Differ Between Indoor and Outdoor Air Masses: Insights from Multiple Microscopy Methodologies. Appl. Spectrosc. 2020, 74, 1079–1098. [Google Scholar] [CrossRef] [PubMed]
- Maes, T.; Jessop, R.; Wellner, N.; Haupt, K.; Mayes, A.G. A rapid-screening approach to detect and quantify microplastics based on fluorescent tagging with Nile Red. Sci. Rep. 2017, 7, 44501. [Google Scholar] [CrossRef] [PubMed]
- Van Cauwenberghe, L.; Devriese, L.; Galgani, F.; Robbens, J.; Janssen, C.R. Microplastics in sediments: A review of techniques, occurrence and effects. Mar. Environ. Res. 2015, 111, 5–17. [Google Scholar] [CrossRef] [PubMed]
- Uddin, S.; Fowler, S.W.; Saeed, T.; Naji, A.; Al-Jandal, N. Standardized protocols for microplastics determinations in environmental samples from the Gulf and marginal seas. Mar. Pollut. Bull. 2020, 158, 111374. [Google Scholar] [CrossRef] [PubMed]
- Naji, A.; Esmaili, Z.; Khan, F.R. Plastic debris and microplastics along the beaches of the Strait of Hormuz, Persian Gulf. Mar. Pollut. Bull. 2017, 114, 1057–1062. [Google Scholar] [CrossRef] [PubMed]
- Naji, A.; Esmaili, Z.; Mason, S.; Vethaak, D. The occurrence of microplastics contamination in littoral sediments of the Persian Gulf, Iran. Environ. Sci. Pollut. Res. 2017, 24, 20459–20468. [Google Scholar] [CrossRef]
- Naji, A.; Nuri, M.; Amiri, P.; Niyogi, S. Small microplastic particles (S-MPPs) in sediments of mangrove ecosystem on the northern coast of the Persian Gulf. Mar. Pollut. Bull. 2019, 146, 305–311. [Google Scholar] [CrossRef] [PubMed]
- Aliabad, M.K.; Nassiri, M.; Kor, K. Microplastics in the surface seawaters of Chabahar Bay, Gulf of Oman (Makran coasts). Mar. Pollut. Bull. 2019, 143, 125–133. [Google Scholar] [CrossRef]
- Avio, C.G.; Gorbi, S.; Regoli, F. Experimental development of a new protocol for extraction and characterization of microplastics in fish tissues: First observations in commercial species from Adriatic Sea. Mar. Environ. Res. 2015, 111, 18–26. [Google Scholar] [CrossRef] [PubMed]
- Li, J.; Yang, D.; Li, L.; Jabeen, K.; Shi, H. Microplastics in commercial bivalves from China. Environ. Pollut. 2015, 207, 190–195. [Google Scholar] [CrossRef] [PubMed]
- Velzeboer, I.; Kwadijk, C.; Koelmans, A. Strong sorption of PCBs to nanoplastics, microplastics, carbon nanotubes, and fullerenes. Environ. Sci. Technol. 2014, 48, 4869–4876. [Google Scholar] [CrossRef] [PubMed]
- GESAMP (IMO/FAO/UNESCO-IOC/UNIDO/WMO/IAEA/UN/UNEP/UNDP Joint Group of Experts on the Scientific Aspects of Marine Environmental Protection). Sources, Fate and Effects of Microplastics in the Marine Environment: A Global Assessment; IMO: London, UK, 2016; 220p. [Google Scholar]
- Ziajahromi, S.; Neale, P.A.; Rintoul, L.; Leusch, F.D. Wastewater treatment plants as a pathway for microplastics: Development of a new approach to sample wastewater-based microplastics. Water Res. 2017, 112, 93–99. [Google Scholar] [CrossRef] [PubMed]
- Michielssen, M.R.; Michielssen, E.R.; Ni, J.; Duhaime, M.B. Fate of microplastics and other small anthropogenic litter (SAL) in wastewater treatment plants depends on unit processes employed. Environ. Sci. Water Res. Technol. 2016, 2, 1064–1073. [Google Scholar] [CrossRef]
- Talvitie, J.; Heinonen, M.; Pääkkönen, J.-P.; Vahtera, E.; Mikola, A.; Setälä, O.; Vahala, R. Do wastewater treatment plants act as a potential point source of microplastics? Preliminary study in the coastal Gulf of Finland, Baltic Sea. Water Sci. Technol. 2015, 72, 1495–1504. [Google Scholar] [CrossRef]
- Leslie, H.; Brandsma, S.; Van Velzen, M.; Vethaak, A. Microplastics en route: Field measurements in the Dutch river delta and Amsterdam canals, wastewater treatment plants, North Sea sediments and biota. Environ. Int. 2017, 101, 133–142. [Google Scholar] [CrossRef] [PubMed]
- Lares, M.; Ncibi, M.C.; Sillanpää, M.; Sillanpää, M. Occurrence, identification and removal of microplastic particles and fibers in conventional activated sludge process and advanced MBR technology. Water Res. 2018, 133, 236–246. [Google Scholar] [CrossRef] [PubMed]
- Gevao, B.; Uddin, S.; Behbehani, M.; Fowler, S.W. Temporal trend of polychlorinated biphenyls contamination in the northwestern Arabian Gulf—Evidence from sediment records. Mar. Pollut. Bull. 2022, 174, 113265. [Google Scholar] [CrossRef]
- Gies, E.A.; LeNoble, J.L.; Noël, M.; Etemadifar, A.; Bishay, F.; Hall, E.R.; Ross, P.S. Retention of microplastics in a major secondary wastewater treatment plant in Vancouver, Canada. Mar. Pollut. Bull. 2018, 133, 553–561. [Google Scholar] [CrossRef] [PubMed]
- Cheung, P.K.; Fok, L. Characterisation of plastic microbeads in facial scrubs and their estimated emissions in Mainland China. Water Res. 2017, 122, 53–61. [Google Scholar] [CrossRef]
- Li, X.; Chen, L.; Mei, Q.; Dong, B.; Dai, X.; Ding, G.; Zeng, E.Y. Microplastics in sewage sludge from the wastewater treatment plants in China. Water Res. 2018, 142, 75–85. [Google Scholar] [CrossRef] [PubMed]
- Simon, M.; van Alst, N.; Vollertsen, J. Quantification of microplastic mass and removal rates at wastewater treatment plants applying Focal Plane Array (FPA)-based Fourier Transform Infrared (FT-IR) imaging. Water Res. 2018, 142, 1–9. [Google Scholar] [CrossRef] [PubMed]
- Talvitie, J.; Mikola, A.; Setälä, O.; Heinonen, M.; Koistinen, A. How well is microlitter purified from wastewater?—A detailed study on the stepwise removal of microlitter in a tertiary level wastewater treatment plant. Water Res. 2017, 109, 164–172. [Google Scholar] [CrossRef] [PubMed]
- Dris, R.; Gasperi, J.; Rocher, V.; Mohamed, S.; Tassin, B. Microplastic contamination in an urban area: A case study in Greater Paris. Environ. Chem. 2015, 12, 592–599. [Google Scholar] [CrossRef]
- Dubaish, F.; Liebezeit, G. Suspended Microplastics and Black Carbon Particles in the Jade System, Southern North Sea. Water Air Soil Pollut. 2013, 224, 1352. [Google Scholar] [CrossRef]
- Gevao, B.; Uddin, S.; Fowler, S.W.; Behbehani, M.; Aba, A. Depositional time trends of phosphorous accumulation in a dated sediment core from the northwestern Arabian Gulf: Can phosphorous be used to support 210Pb chronologies in coastal aquatic sediments. Mar. Pollut. Bull. 2021, 166, 112213. [Google Scholar] [CrossRef] [PubMed]
- Sarkar, D.J.; Das Sarkar, S.; Das, B.K.; Praharaj, J.K.; Mahajan, D.K.; Purokait, B.; Mohanty, T.R.; Mohanty, D.; Gogoi, P.; Kumar, V.S.; et al. Microplastics removal efficiency of drinking water treatment plant with pulse clarifier. J. Hazard. Mater. 2021, 413, 125347. [Google Scholar] [CrossRef] [PubMed]
- Magni, S.; Binelli, A.; Pittura, L.; Avio, C.G.; Della Torre, C.; Parenti, C.C.; Gorbi, S.; Regoli, F. The fate of microplastics in an Italian Wastewater Treatment Plant. Sci. Total Environ. 2019, 652, 602–610. [Google Scholar] [CrossRef] [PubMed]
- Gevao, B.; Uddin, S.; Khrishnan, D.; Rajgopalan, S.; Habibi, M. Antibiotics in Wastewater: Baseline of the Influent and Effluent Streams in Kuwait. Toxics 2022, 10, 174. [Google Scholar] [CrossRef]
- Murphy, F.; Ewins, C.; Carbonnier, F.; Quinn, B. Wastewater Treatment Works (WwTW) as a source of microplastics in the aquatic environment. Environ. Sci. Technol. 2016, 50, 5800. [Google Scholar] [CrossRef] [PubMed]
- Bayo, J.; López-Castellanos, J.; Olmos, S. Membrane bioreactor and rapid sand filtration for the removal of microplastics in an urban wastewater treatment plant. Mar. Pollut. Bull. 2020, 156, 111211. [Google Scholar] [CrossRef] [PubMed]
- Edo, C.; González-Pleiter, M.; Leganés, F.; Fernández-Piñas, F.; Rosal, R. Fate of microplastics in wastewater treatment plants and their environmental dispersion with effluent and sludge. Environ. Pollut. 2020, 259, 113837. [Google Scholar] [CrossRef] [PubMed]
- Bretas Alvim, C.; Bes-Piá, M.A.; Mendoza-Roca, J.A. Separation and identification of microplastics from primary and secondary effluents and activated sludge from wastewater treatment plants. Chem. Eng. J. 2020, 402, 126293. [Google Scholar] [CrossRef]
- Bayo, J.; Olmos, S.; López-Castellanos, J. Microplastics in an urban wastewater treatment plant: The influence of physicochemical parameters and environmental factors. Chemosphere 2020, 238, 124593. [Google Scholar] [CrossRef] [PubMed]
- Franco, A.A.; Arellano, J.M.; Albendín, G.; Rodríguez-Barroso, R.; Zahedi, S.; Quiroga, J.M.; Coello, M.D. Mapping microplastics in Cadiz (Spain): Occurrence of microplastics in municipal and industrial wastewaters. J. Water Process Eng. 2020, 38, 101596. [Google Scholar] [CrossRef]
- Franco, A.A.; Arellano, J.M.; Albendín, G.; Rodríguez-Barroso, R.; Quiroga, J.M.; Coello, M.D. Microplastic pollution in wastewater treatment plants in the city of Cádiz: Abundance, removal efficiency and presence in receiving water body. Sci. Total Environ. 2021, 776, 145795. [Google Scholar] [CrossRef]
- van den Berg, P.; Huerta-Lwanga, E.; Corradini, F.; Geissen, V. Sewage sludge application as a vehicle for microplastics in eastern Spanish agricultural soils. Environ. Pollut. 2020, 261, 114198. [Google Scholar] [CrossRef]
- Magnusson, K.; Norén, F. Screening of Microplastic Particles in and Down-Stream a Wastewater Treatment Plant; IVL Swedish Environmental Research Institute: Stockholm, Sweden, 2014; 22p. [Google Scholar]
- Hongprasith, N.; Kittimethawong, C.; Lertluksanaporn, R.; Eamchotchawalit, T.; Kittipongvises, S.; Lohwacharin, J. IR microspectroscopic identification of microplastics in municipal wastewater treatment plants. Environ. Sci. Pollut. Res. 2020, 27, 18557–18564. [Google Scholar] [CrossRef]
- Akarsu, C.; Kumbur, H.; Gökdağ, K.; Kıdeyş, A.E.; Sanchez-Vidal, A. Microplastics composition and load from three wastewater treatment plants discharging into Mersin Bay, north eastern Mediterranean Sea. Mar. Pollut. Bull. 2020, 150, 110776. [Google Scholar] [CrossRef]
- Gündoğdu, S.; Çevik, C.; Güzel, E.; Kilercioğlu, S. Microplastics in municipal wastewater treatment plants in Turkey: A comparison of the influent and secondary effluent concentrations. Environ. Monit. Assess. 2018, 190, 626. [Google Scholar] [CrossRef]
- Horton, A.A.; Cross, R.K.; Read, D.S.; Jürgens, M.D.; Ball, H.L.; Svendsen, C.; Vollertsen, J.; Johnson, A.C. Semi-automated analysis of microplastics in complex wastewater samples. Environ. Pollut. 2021, 268, 115841. [Google Scholar] [CrossRef]
- Uddin, S.; Fowler, S.W.; Habibi, N.; Sajid, S.; Dupont, S.; Behbehani, M. A Preliminary Assessment of Size-Fractionated Microplastics in Indoor Aerosol—Kuwait’s Baseline. Toxics 2022, 10, 71. [Google Scholar] [CrossRef]
- Mason, S.A.; Garneau, D.; Sutton, R.T.; Chu, Y.; Ehmann, K.; Barnes, J.; Fink, P.; Papazissimos, D.; Rogers, D.L. Microplastic pollution is widely detected in US municipal wastewater treatment plant effluent. Environ. Pollut. 2016, 218, 1045–1054. [Google Scholar] [CrossRef]
- Carr, S.A.; Liu, J.; Tesoro, A.G. Transport and fate of microplastic particles in wastewater treatment plants. Water Res. 2016, 91, 174–182. [Google Scholar] [CrossRef]
- Dyachenko, A.; Mitchell, J.; Arsem, N. Extraction and identification of microplastic particles from secondary wastewater treatment plant (WWTP) effluent. Anal. Methods 2017, 9, 1412–1418. [Google Scholar] [CrossRef]


| Sampling Date | Influent (MPs L−1) | Effluent (MPs L−1) | Sludge (MPs 10 g−1) | |
|---|---|---|---|---|
| Kabd | 10 August 2020 | 130 ± 4 | 5 ± 1 | 72 ± 3 |
| 1 December 2020 | 134 ± 5 | 5 ± 1 | 81 ± 4 | |
| Umm Al-Haiman | 11 August 2020 | 230 ± 3 | 12 ± 1 | 99 ± 6 |
| 2 December 2020 | 223 ± 4 | 11 ± 2 | 87 ± 5 | |
| Sulabiya | 12 August 2020 | 119 ± 2 | 1 ± 1 | 98 ± 5 |
| 3 December 2020 | 121 ± 3 | 2 ± 1 | 103 ± 6 | |
| Blank | NIL |
Publisher’s Note: MDPI stays neutral with regard to jurisdictional claims in published maps and institutional affiliations. |
© 2022 by the authors. Licensee MDPI, Basel, Switzerland. This article is an open access article distributed under the terms and conditions of the Creative Commons Attribution (CC BY) license (https://creativecommons.org/licenses/by/4.0/).
Share and Cite
Uddin, S.; Behbehani, M.; Habibi, N.; Faizuddin, M.; Al-Murad, M.; Martinez-Guijarro, K.; Al-Sarawi, H.A.; Karam, Q. Microplastics in Kuwait’s Wastewater Streams. Sustainability 2022, 14, 15817. https://doi.org/10.3390/su142315817
Uddin S, Behbehani M, Habibi N, Faizuddin M, Al-Murad M, Martinez-Guijarro K, Al-Sarawi HA, Karam Q. Microplastics in Kuwait’s Wastewater Streams. Sustainability. 2022; 14(23):15817. https://doi.org/10.3390/su142315817
Chicago/Turabian StyleUddin, Saif, Montaha Behbehani, Nazima Habibi, Mohammed Faizuddin, Mohammad Al-Murad, Karell Martinez-Guijarro, Hanan A. Al-Sarawi, and Qusaie Karam. 2022. "Microplastics in Kuwait’s Wastewater Streams" Sustainability 14, no. 23: 15817. https://doi.org/10.3390/su142315817
APA StyleUddin, S., Behbehani, M., Habibi, N., Faizuddin, M., Al-Murad, M., Martinez-Guijarro, K., Al-Sarawi, H. A., & Karam, Q. (2022). Microplastics in Kuwait’s Wastewater Streams. Sustainability, 14(23), 15817. https://doi.org/10.3390/su142315817