Article

Effect of Indoor Environment on Occupant Air Comfort and Productivity in Office Buildings: A Response Surface Analysis Approach

by
Amit Kant Kaushik
1,*,
Mohammed Arif
2,
Matt M. G. Syal
3,
Muhammad Qasim Rana
4,
Olugbenga Timo Oladinrin
5,
Ahlam Ammar Sharif
6 and
Ala’a Saleh Alshdiefat
7
1
Department of Architecture and Built Environment, Faculty of Engineering & Environment, Northumbria University, Newcastle Upon Tyne NE1 8ST, UK
2
School of Architecture, Technology and Engineering, University of Brighton, C50523 Cockroft Building, Lewes Road, Brighton BN2 4GJ, UK
3
Department of Civil and Environmental Engineering, School of Planning, Design & Construction, Michigan State University, Human Ecology Building, 552 W, Circle Drive, Room 213, East Lansing, MI 4882, USA
4
School of Built Environment, University College of Estate Management, Reading RG1 4BS, UK
5
School of Architecture & Built Environment, University of Plymouth, Plymouth PL4 8AA, UK
6
Department of Architectural Engineering, Faculty of Engineering, The Hashemite University, Zarqa 13133, Jordan
7
Department of Civil Engineering, Faculty of Engineering and Technology, Philadelphia University, Amman 19392, Jordan
*
Author to whom correspondence should be addressed.
Sustainability 2022, 14(23), 15719; https://doi.org/10.3390/su142315719
Submission received: 18 October 2022 / Revised: 15 November 2022 / Accepted: 22 November 2022 / Published: 25 November 2022

Abstract

:
Indoor air quality is a significant factor influencing occupant comfort, health and productivity. Indoor air comfort and its relationship to occupant comfort and productivity are widely documented. Statistical correlation between the two has been highlighted in scientific literature. This paper investigates any unique correlations between non-air quality parameters (such as lux level, temperature, and noise level) and indoor air comfort and presents a study investigating the effect of indoor environmental quality on occupant air comfort and productivity. This study was conducted by collecting data on indoor environmental parameters using remote sensors and an online survey for occupant responses for twelve months. Data analysis was performed using Response Surface Analysis to present mathematical relationships between indoor environmental quality parameters and occupant air comfort. Results show that carbon dioxide up to 600 ppm, VOC up to 25% (by volume) and humidity up to 60% have a positive impact on occupant air comfort and productivity. Our research highlighted that some non-air quality parameters, such as outdoor temperature and lux levels, affect occupant air comfort. These results would enable built environment professionals to design and operate offices (subtropical desert climate) conducive to occupant comfort and productivity.

1. Introduction

Indoor environmental quality is fundamental to occupants’ performance, productivity, health and well-being in an office building. Awareness of the impact of the indoor environment on occupants is not recent; small-scale research and case studies began to emerge in the early 1920s [1,2]. Indoor environmental quality comprises several physical parameters such as thermal environment, indoor air quality, sound and lux levels, and office layout. These factors influence occupant comfort and productivity [3]. It is necessary to clarify what productivity means, and it can be broadly defined as the ratio of output over input [4]. However, measurement of both input and output should be conducted using the same parameters. According to Haynes, employees’ productivity in offices can be calculated using the return on employee salary and operation cost [5].
Nevertheless, self-reported employee surveys can also record productivity [5]. Productivity is generally seen as strongly related to the occupant’s comfort. Comfort can be defined as the absence of any unpleasant condition, and it encompasses any physical and functional comfort in the office environment. Physical comfort includes physical environmental parameters such as thermal, visual, air and aural comfort; functional comfort refers to disturbances, interruptions and resources [6].
As noted, comfort significantly influences productivity and lies within the broader range of physical indoor environmental parameters, as shown in Figure 1.
Comfort is necessary for humans to work and be productive. However, this does not indicate that comfort will always lead to productivity [7]. The productivity range in this study is outlined by using five-scale responses from the occupants, and it is further explained in the methodology section.
Indoor air comfort is a critical parameter in indoor environmental elements and significantly affects occupant health and productivity [8,9,10]. Several studies have elaborated on the effect of air quality on short-term and long-term illnesses and problems [11,12]. However, there are not many studies that present a statistical explanation between indoor air quality parameters and occupant productivity in an office building, specifically for a building in a subtropical desert climate. Furthermore, research on indoor air quality is becoming more critical in the current and post-COVID-19 world [13,14,15,16].
This paper presents an experiment designed to establish mathematical relationships between indoor environmental quality and occupant air comfort and productivity. The study collected various indoor environmental parameters and occupants’ responses to different types of comforts (Figure 1). This paper only focuses on air comfort and presents direct and indirect impacts of the indoor environment on occupant air comfort and productivity.
The remainder of the manuscript is divided into five main sections. The first section reviews the literature on indoor air comfort and its measurements. The second section presents the structure and design of the study. The third section presents the outcomes, including Analysis of Variance (ANOVA), Regression Analysis and twelve unique response surface relationships along with their contour graphs. The fourth section analyses the results and discusses the study’s practical implications. The final section presents the conclusions.

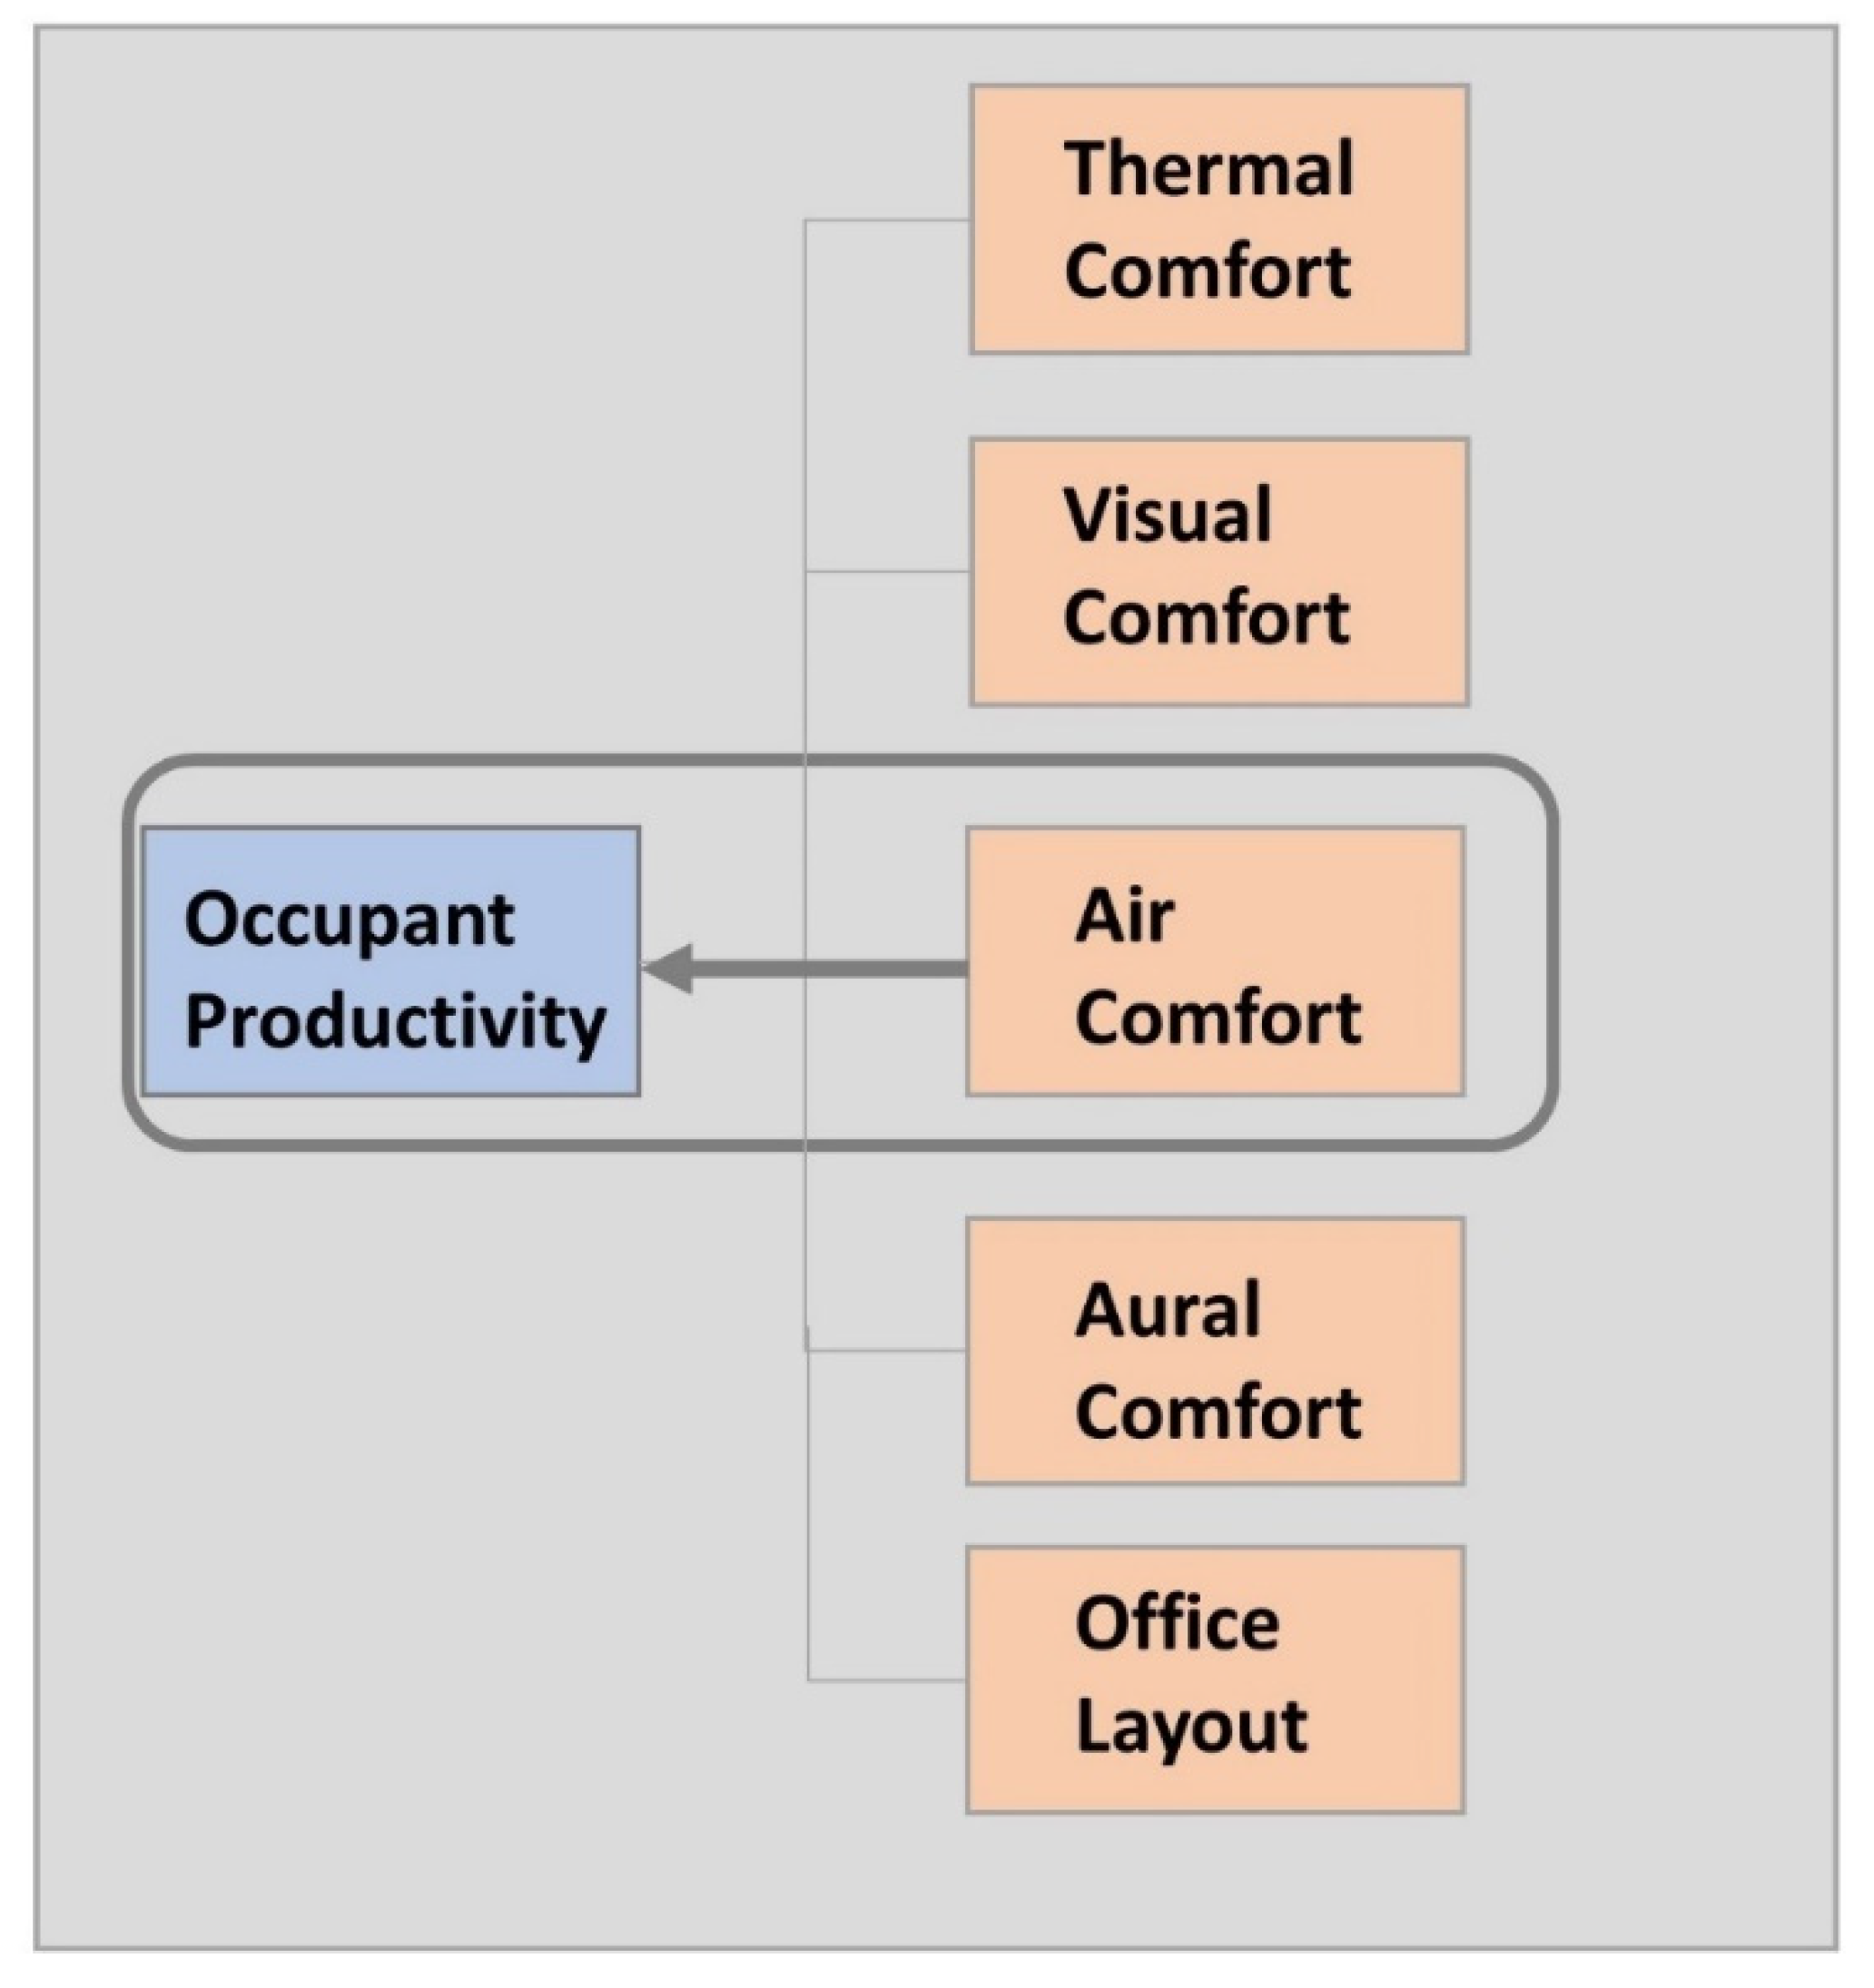
2. Indoor Air Comfort
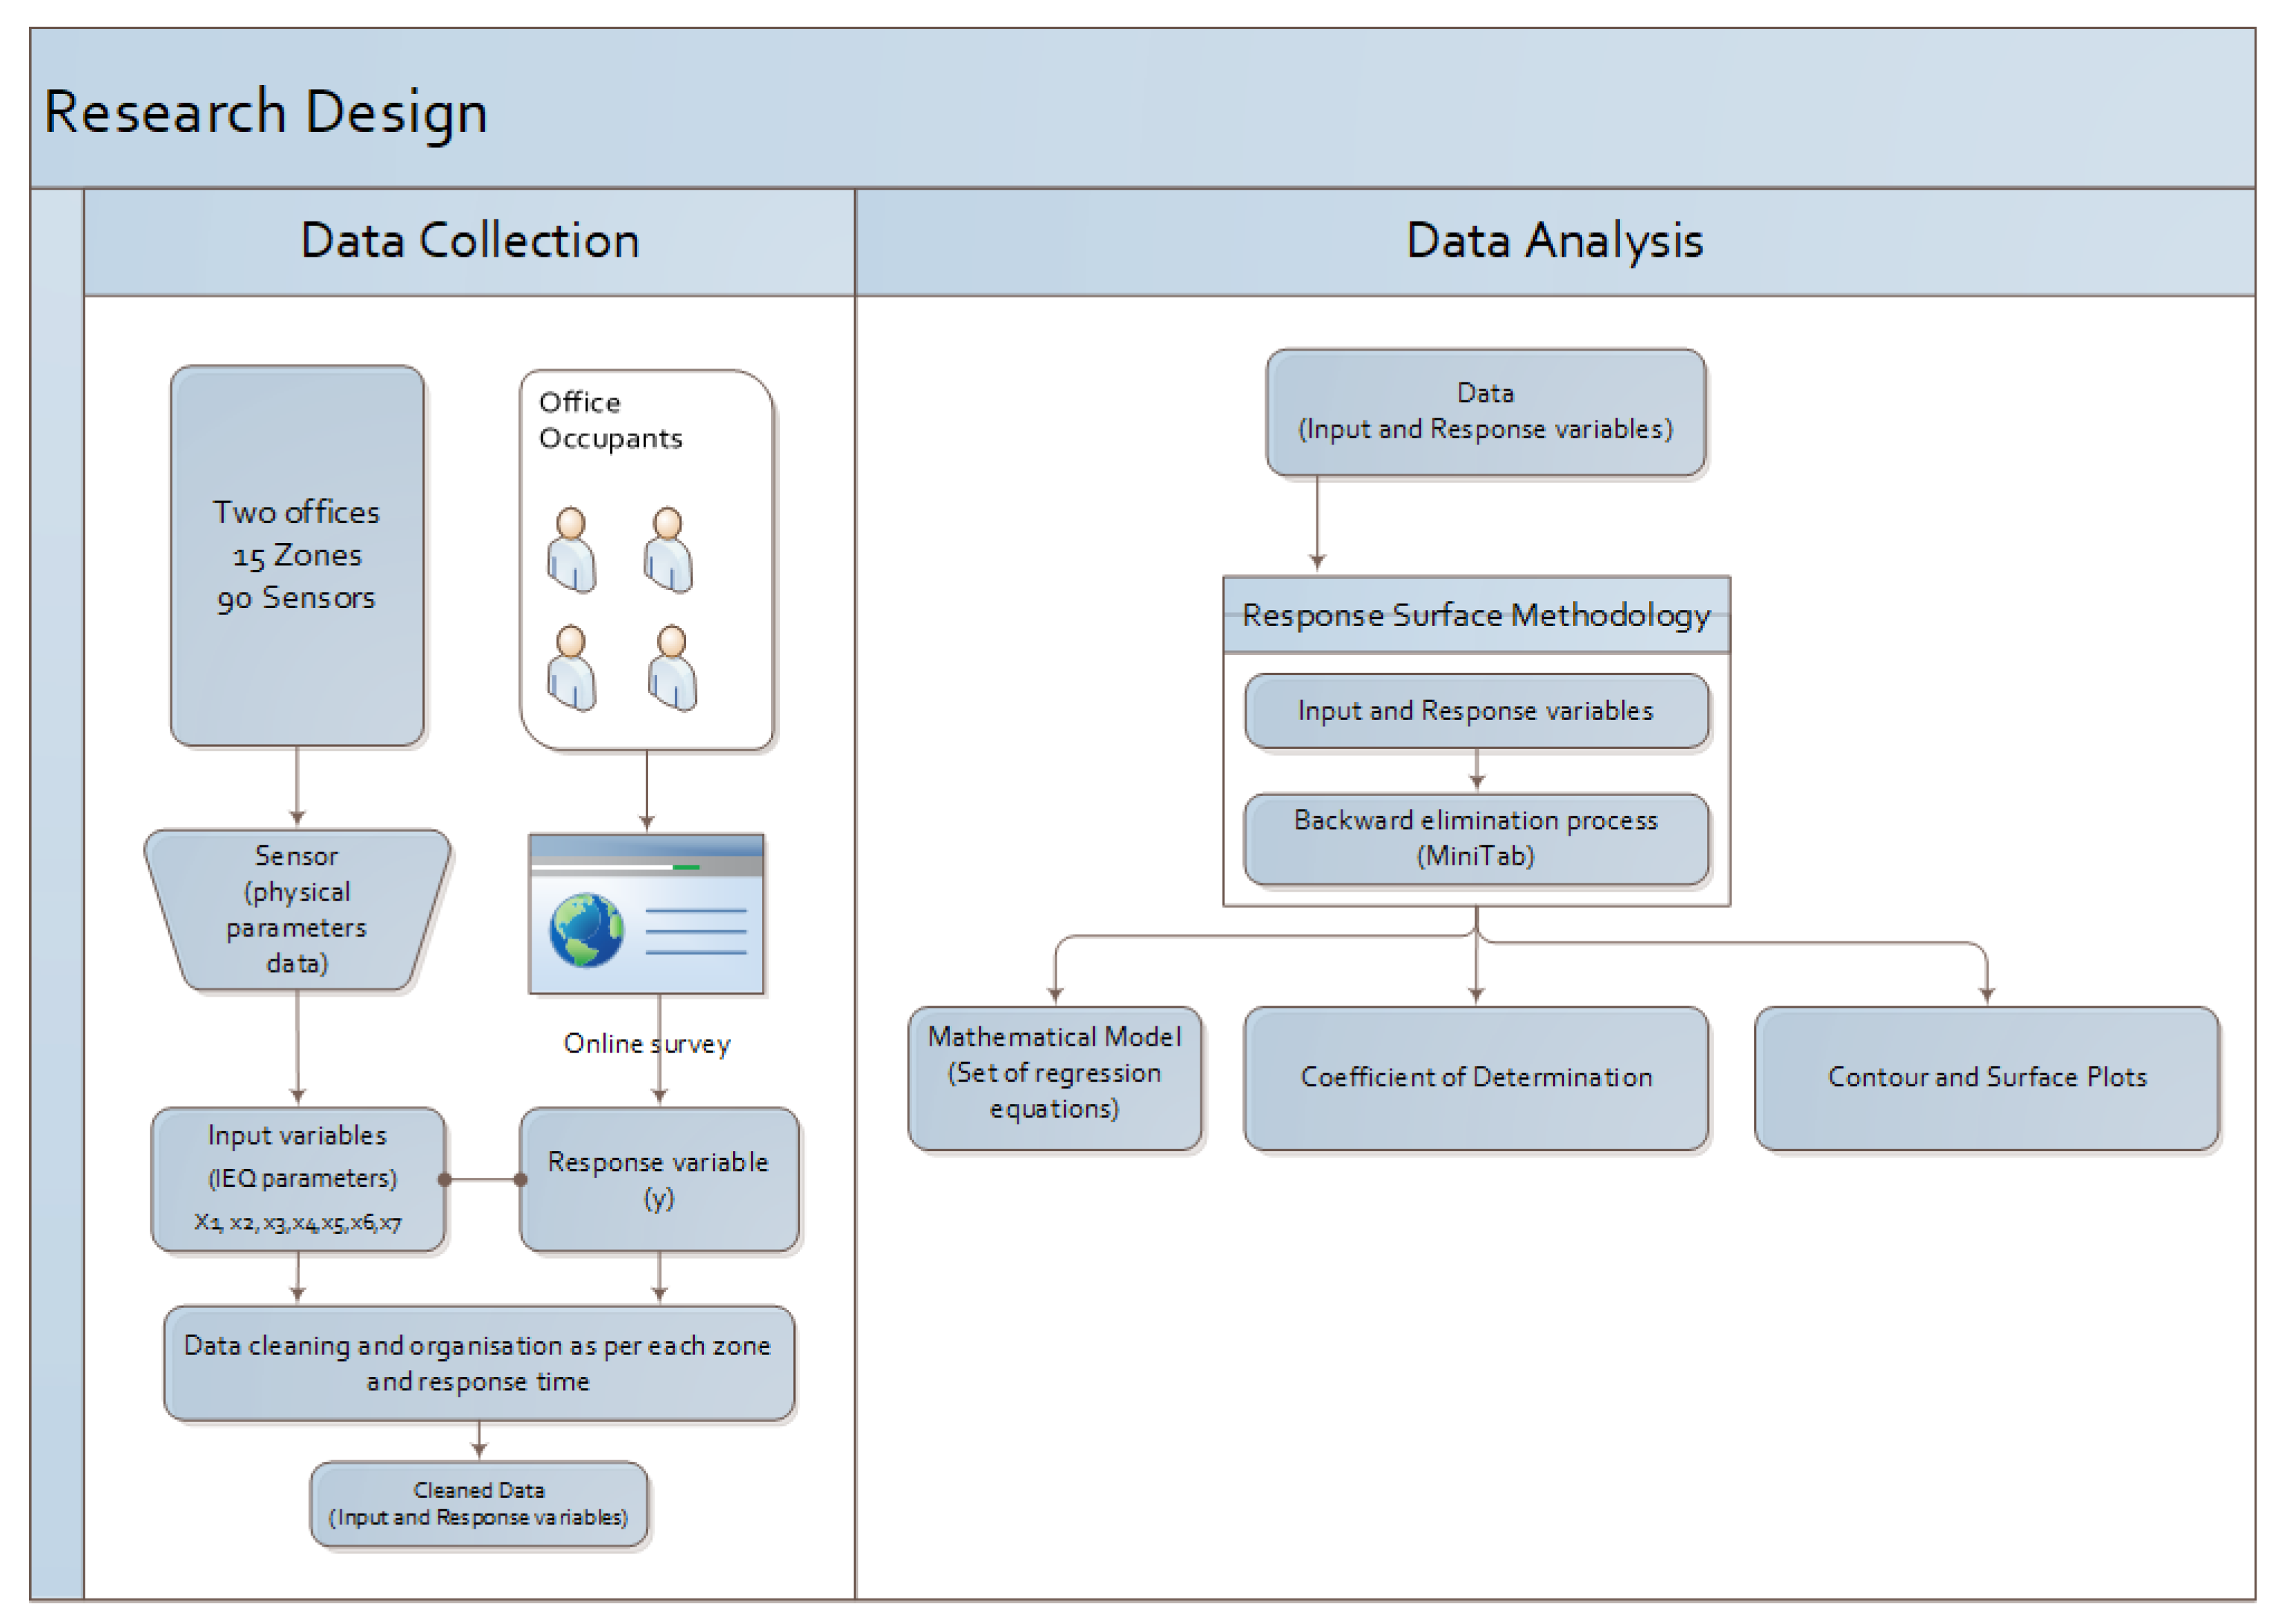
The air quality of an indoor environment influences occupant comfort; higher quality of indoor air reflects better comfort and productivity [17,18,19,20]. Low air quality in buildings leads to occupant dissatisfaction and health problems [21,22,23]. Some major health problems are asthma, Sick Building Syndrome (SBS) and allergy symptoms related to respiration [24,25,26]. SBS is a serious problem with low air quality in the current building stock. The main symptoms are itchy, dry eyes and nose discomfort; other problems recorded are headaches and mental fatigue [27,28]. Air contamination, humidity and temperature directly influence the quality of indoor air [17,29,30]. They are dependent on outdoor conditions, building materials, heating, ventilation and air conditioning systems, room layouts, heat and pollutants from occupants and mechanical equipment. The complexity of the impact surges because of several explicit and implicit interplay and changes in these interdependent factors [31]. For instance, a bad internal layout can lead to inefficient occupant seating and machine locations, leading to thermal discomfort [32,33,34]. The thermal environment also affects the indoor air environment. Studies show that higher humidity can be detrimental to air quality and leads to air discomfort [35,36]. Indoor air levels are managed by regularly changing the air in the building. Air changes are done using a ventilation system or natural ventilation, which helps to reduce the air pollutants in the air and increases its quality and occupant comfort. Carbon dioxide is one of the main pollutants in indoor air. It is measured in PPM (Particles Per Million) and removed to ensure good air quality [11,20,37]. Ventilation rate is a critical factor affecting indoor air quality, occupant comfort and productivity. A higher ventilation rate is associated with better indoor air comfort and increased productivity, while lower rates of ventilation are associated with SBS and lower productivity [38,39,40,41]. Research on building operations indicates that an organisation’s financial gains from increasing employee comfort and productivity are several times more than the yearly operation bill of HVAC (Heating, Ventilation, Air-Conditioning) at a higher ventilation rate. For example, a study found that an increase in air change from 8 to 10 L/s per person could achieve approximately 13 billion dollars in savings by higher productivity and reduced absenteeism in the office [7,42]. There are multiple HVAC systems that work efficiently to maintain a balance between a higher ventilation rate and reduced environmental impact [43]. Building designers should be looking to find a balance between an adequate amount of air circulation and energy efficiency and conservation.
There are primarily three types of building ventilation systems: mechanical, naturally ventilated and hybrid ventilation. A hybrid ventilation system uses both mechanical and natural ventilation to provide air changes in the system. Research also suggests that hybrid systems achieve better air quality and higher comfort and productivity [44]. However, each building and its usage pattern are unique, and the ventilation system should be considered based on the type of building, climatic conditions and occupancy rate predictions [45,46,47]. Thus, there are multiple design strategies that can be used to influence the selection of a ventilation system.
Chemical and Microbiological Volatile Organic Compounds (MVOCs) present in the air also affect indoor air quality and occupant comfort. High levels of VOC presence in the air leads to increased toxicity, odour and irritant properties [48,49,50]. There are multiple national and international guidelines that prescribe safe levels of contaminants in the air to maintain a healthy indoor environment for occupants [51,52,53]. VOC has chemical and physical properties that complicate design measures and suggest values for analysis [54,55]. Fanger proposed two units for measuring indoor and outdoor air pollution sources, the Olf and the decipol. Decipol is based on the rate of pollution by one occupant, while ventilation operates at 10 L/s of fresh air [56]; this exhibits air quality [8]. Using Fanger’s olf-decipol method, indoor air quality is evaluated depending on the temperature, humidity and air pollution produced by human effluents [57]. High levels of VOC in the air are associated with new furniture, paints and specific materials [58,59,60]. Hence, newer buildings are found to have higher levels of VOC.
The literature review for this research can be compiled in three strands, as summarised in Table 1.
The first strand focuses on indoor air components, describing the impacts of air temperature, contaminants and carbon dioxide on air quality. The main elements that can enhance air quality are VOC and carbon dioxide. The second strand concentrates on improvement of air quality using ventilation by presenting the course of research on ventilation from the early 20th century. Ventilation research progressed towards defining building ventilation standards and recognizing the need for ventilation for various types of buildings and activities within a building. The third strand converges on the impacts of air quality on the inhabitant’s activity and well-being. Inhabitants’ well-being and health are the fundamental motives of this indoor air research. During the late 20th century, various health issues were documented relating to Building Related Illness (BRI), Sick Building Syndrome (SBS) and Occupational Asthma (OA).
These strands are strongly interconnected and must be understood to develop a thorough understanding of indoor air quality and its impact on well-being and productivity.
This study measures VOC carbon dioxide and accumulates the occupant’s response to the research (Table 2).

3. Research Design

The fundamental factors in planning the indoor environment of a building should be based on its plan and orientation, occupant behaviour and material and contextual weather conditions. Field investigations suggest that Post Occupancy Evaluation (POE) is an adequate method of calculating the impact of indoor environmental quality elements on occupant productivity and comfort [67,68,69]. This research utilized POE to obtain occupants’ feedback and used sensors to measure indoor environmental quality. The experiment was carried out in two offices of the same organization divided into 15 zones in one of the Gulf Cooperation Council (GCC) countries, as seen in Figure 2. Forty employees from this office were recruited for this study. The sample was diverse concerning their backgrounds and the range of seating layouts within the office area, including single and double occupancy rooms and open-plan settings. The overall local climate can be classified as climate zone 1B, which is very hot and dry and has low annual rainfall. These conditions push inhabitants to spend most of their time indoors and have created enveloped buildings to maintain the indoor environment and provide comfort to occupants.
People tend to spend most of their time indoors in controlled environmental conditions, which can serve as a working/live laboratory for this trial. An office facility with 40 employees was utilized for this trial and was divided into 12 zones to install sensors correspondingly. The office layout plan is attached in Appendix A. Response Surface Methodology in MiniTab was used to analyse the findings [70]. The result was a regression equation that defined the numerical correlation between dependent (occupant productivity) and independent (indoor parameters) variables. It also created an R-square value describing the correlation between dependent and independent variables and outlined the surface plots. These surface plots present the multinomial connection between occupant productivity and indoor environmental parameters.

3.1. Survey Design

This research included requesting an online survey of employees fortnightly by the company’s Human Resources department. The collection and storage of data was encrypted to ensure the anonymity and safety of employees. The responses from the respondents were also timestamped according to the local time zone. The research team developed an online questionnaire (Table 3) for occupants to collect biological data and occupant responses, and other indoor environmental quality factors. The research team also conducted a workshop to explain the experiment to the employees. This paper is part of an experiment investigating the effect of temperature, relative humidity, carbon dioxide, volatile organic compound, lux, sound and desktop background on various occupant comfort areas such as thermal, aural and visual. However, this paper only considers the responses to the air comfort question and identifies the effects of all parameters on it.
Indoor environment parameters are the underlying factors that affect occupant productivity and comfort. Comfort and productivity are different; however, they are both affected by the indoor physical environment, and productivity lies within the comfort range. A human can be comfortable but not productive; however, humans must be comfortable and productive, especially in office tasks and work scenarios. Therefore, this experiment was designed to treat indoor environmental parameters as independent factors and occupant comfort and productivity as the dependent variable. Since the experiment focused on outlining the degree of the effect of the indoor environment on occupant productivity and comfort, it does not need to measure individual occupant productivity; it only needs to measure the degree of effect that indoor environmental parameters have on occupant comfort and productivity. This was achieved using an occupant survey (questionnaire) to outline that relationship. The questionnaire asked inhabitants how various indoor environmental parameters influenced their productivity. Productivity levels mentioned in this study are related to occupant responses that ranged from very negative to very positive using the Likert scale [71]. The responses “very negative” and “negative” captured the occupant’s discomfort, and “positive” and “very positive” captured the occupant’s comfort. “Neutral” response captured the occupant’s neutral comfort or indecision. Each response was timestamped with its zones to ensure that all measurements were precisely determined (average of the past hour). Timestamping also ensured that the responses could be associated with the data collected from sensors with environment data, which were also termed as runs in the response surface methodology.
The runs would facilitate determining and generating different relationship equations between seven input variables (temperature, relative humidity, carbon dioxide, volatile organic compound, lux, sound, desktop background) and the performance variable (y). Data collection was conducted for 12 months. Sensors remained switched on throughout, and a survey request was sent every two weeks via email on working days (weekdays). The survey question and options are shown in Table 3, which provided 500 data points, reduced to 368 after cleaning and adjusting data. Cleaning was conducted to remove any outliers, any response with all answers as ‘neutral’ and half-answered surveys. Data collection over a year ensured that the captured data reflected all the climatic conditions.

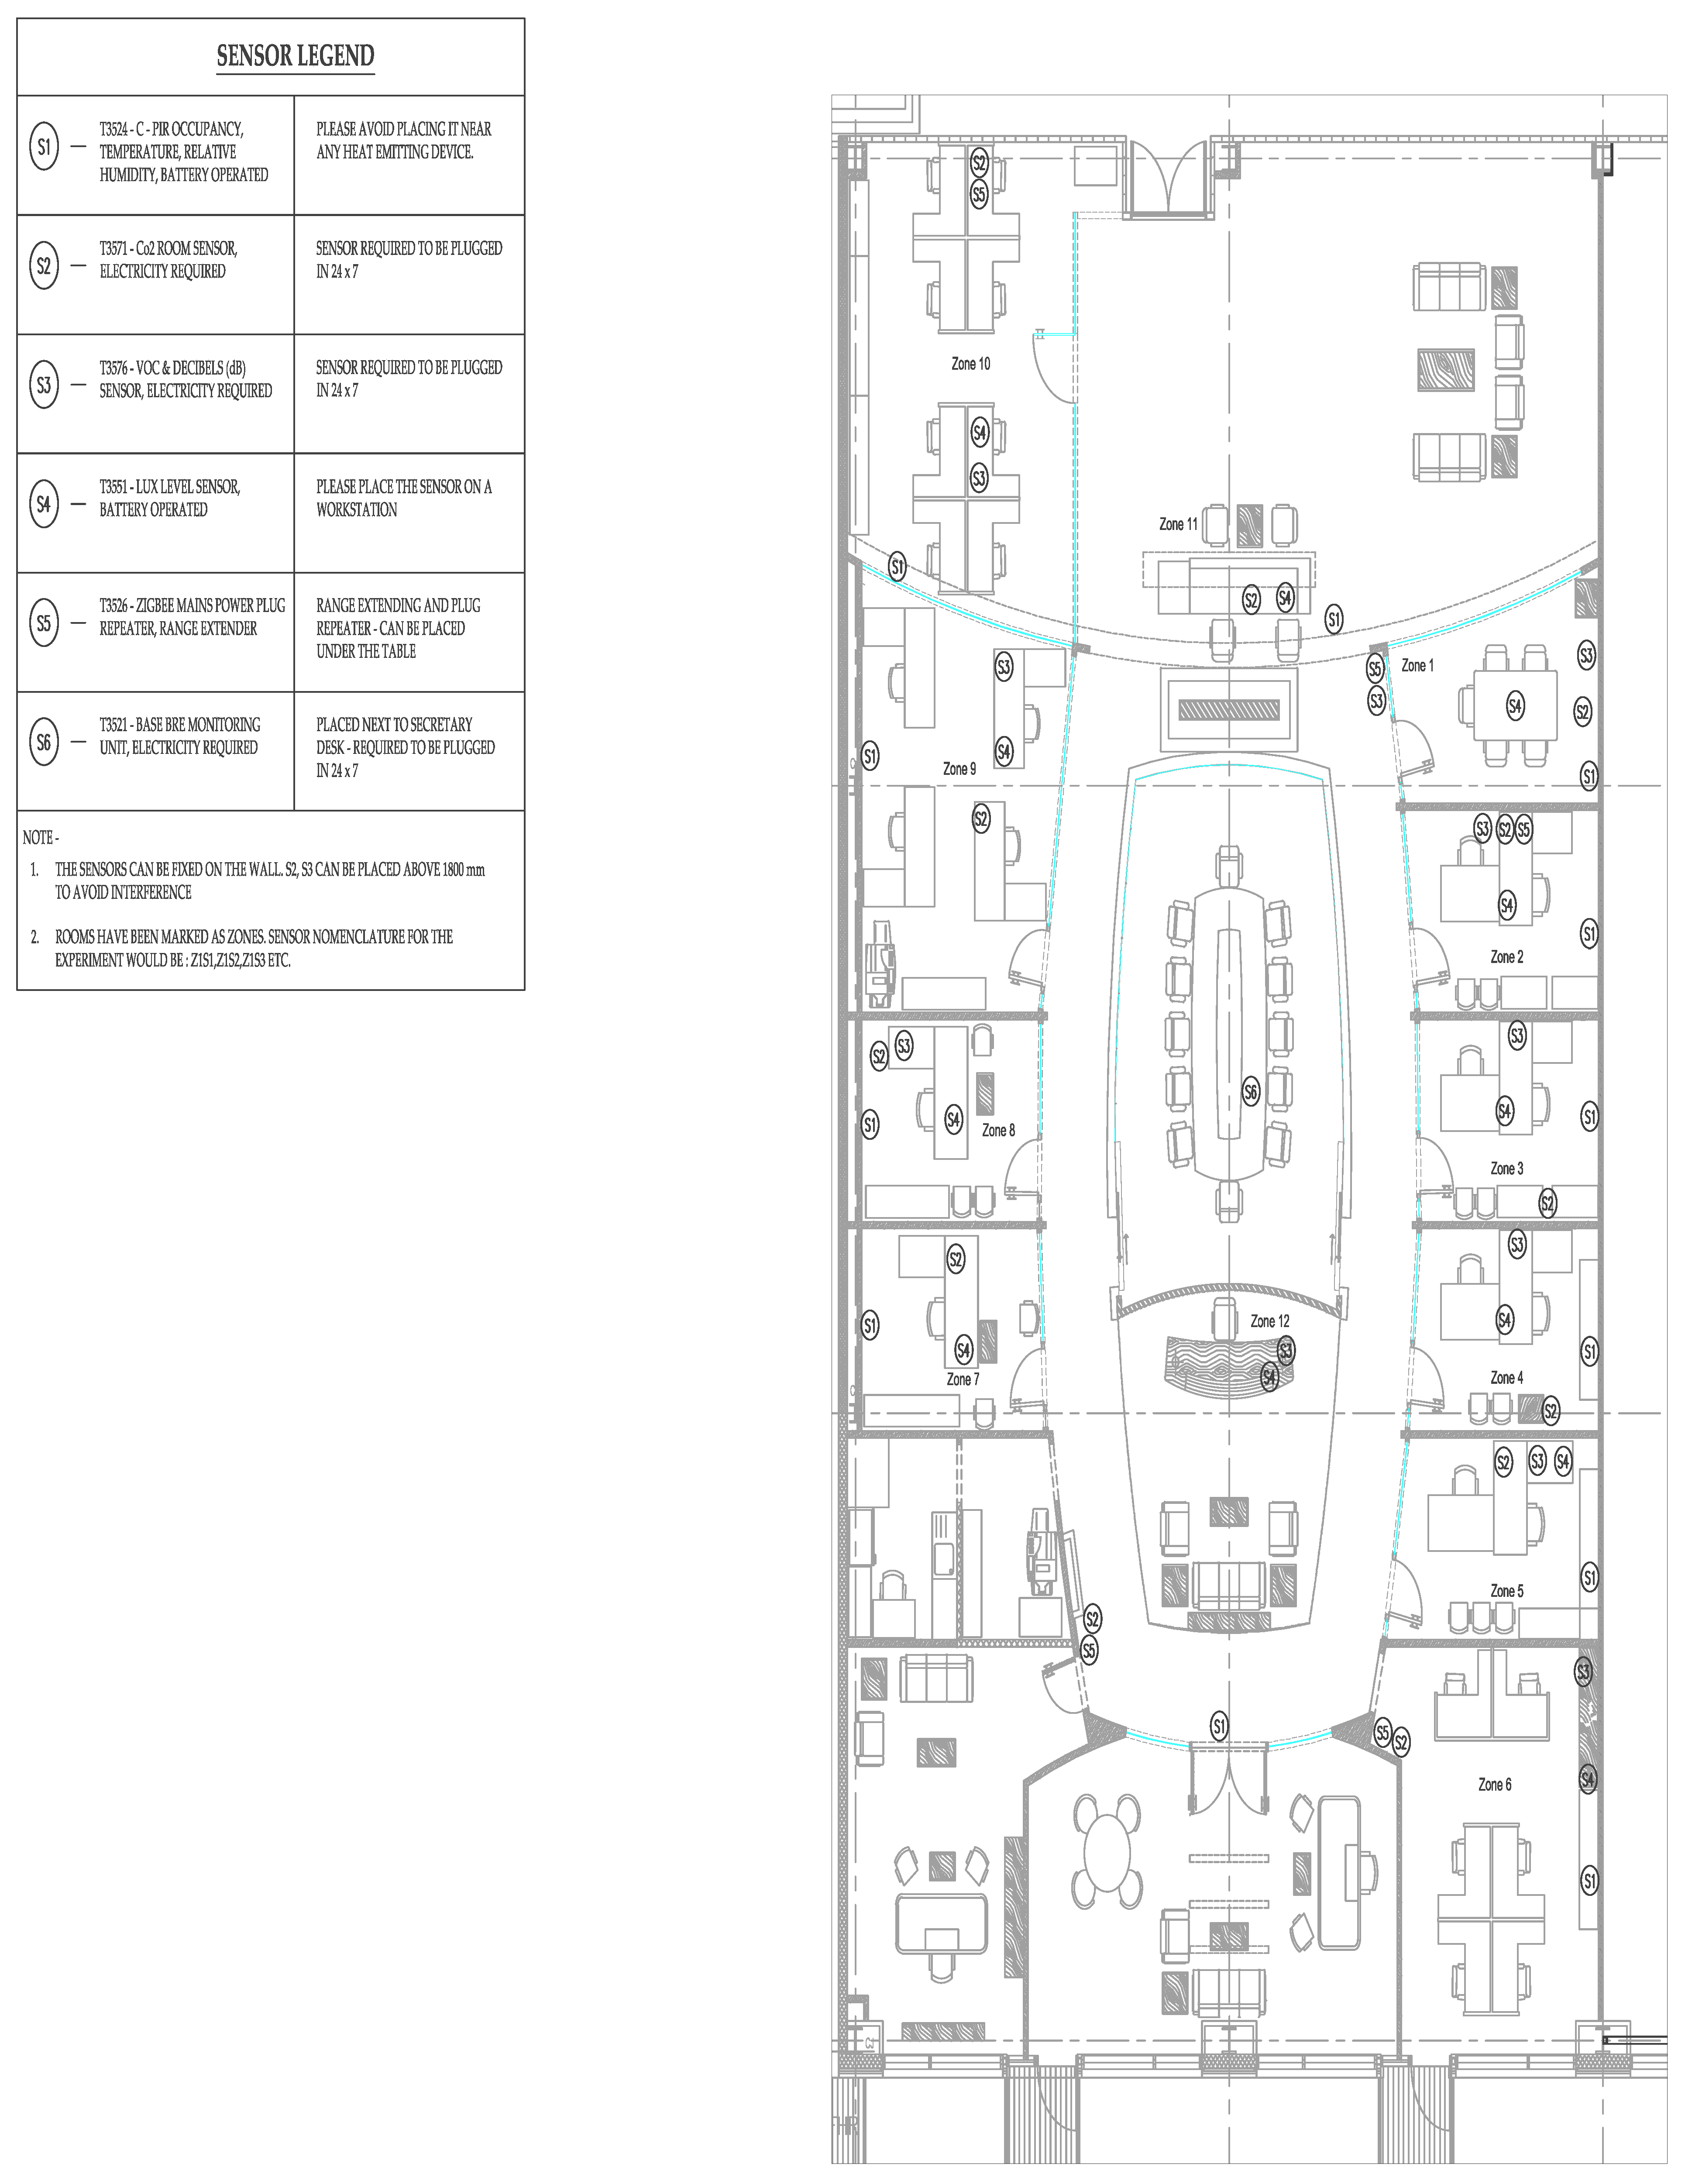
3.2. Physical Parameters Measurement

Sensors were deployed to collect the physical environmental data in each zone through sensors for all environmental parameters. The literature review suggested that carbon dioxide and volatile organic compounds are prime factors influencing indoor air quality and productivity [72,73]. It also suggested that outside temperature and relative humidity indirectly influence occupant productivity and comfort in mechanically ventilated structures [74,75]. Therefore, outside temperature and relative humidity sensors were also placed to gauge any impact of outdoor thermal conditions on occupant productivity and indoor air comfort. These sensors were linked to a base unit (BRE base unit) that uploaded the information to an online storehouse, allowing the download of data in excel formats. A total of 90 sensors placed in 15 zones collected 58.9 million data points throughout the year. All sensors were calibrated before deployment and monitored to ensure efficient and accurate functionality. Table 4 provides an overview of IEQ factors and their measurement parameters.

3.3. Data Analysis: Response Surface Methodology

Response Surface Methodology (RSM) was used for data analysis to provide a framework for analysing the IEQ data and data of the occupant survey. It produced different statistical models to outline each IEQ’s level of influence on occupant productivity. RSM combines mathematical and statistical methods to create and interpret polynomial equations [76,77,78]. Its primary purpose is to examine independent variables and experiment with empirical models to develop an appropriate relationship between the response and the input variables. It also optimises estimating values of x1, x2,…, xk that produce the most desirable value of y [79,80,81].
RSM encapsulated direct relationships between indoor air quality parameters and occupant productivity. It also helped to identify any indirect relationships with other environmental parameters. It helped produce the response profile of dependent variables due to the interaction with independent variables. It is highly applicable in this experiment as there are multiple independent variables. Researchers used MiniTab to conduct RSM analysis to reveal the correlation between the nine parameters collected and used as independent variables against the survey response of air quality (dependent variable). This helped to map the direct and indirect influence of non-indoor air parameters on air comfort and productivity.
This research applied a backward elimination procedure to administer response surface analysis. This procedure is typically used for the elimination of the independent variable with a minimum impact on the dependent variable in multiple regression analysis. The process starts with including all independent variables in the model and eventually eliminates one input variable in each run with a minimum impact on the model. This stepwise procedure continues until no independent variables in the model have a p-value greater than the value specified (alpha to remove). This experiment used 0.1 as the alpha to remove the value in this experiment and produced results with 90% confidence.

4. Results

Response Surface Analysis identified the various independent variables influencing the occupants’ perception of indoor air and its effect on their productivity. This section is divided into three sections: ANOVA, regression and response surface analysis.

4.1. Analysis of Variance

The Analysis of Variance (ANOVA) test outlines the relationship between the dependent and independent variables [82]. In this study, the independent variables were the nine indoor environmental parameters, and occupant response was the dependent variable. ANOVA was conducted using a = 0.1 (90% accuracy). Results show that carbon dioxide, volatile organic compounds, outside temperature, and illumination levels (availability of interior/exterior windows) significantly impact (p < 0.005) occupant productivity and air comfort. It also showed a two-way interaction of air quality parameters (carbon dioxide, volatile organic compound) with non-air quality parameters (sound, light, temperature), indicating a strong effect on occupant air comfort. More details are in the Supplementary File.

4.2. Regression Analysis

Regression analysis was also conducted as part of the Response Surface Analysis. The coefficient of determination (adjusted R-square) value is 76.95%, indicating that 77% of the data fits the regression. This analysis suggests that there is a significant relationship between dependent and independent variables.
It also produced a regression equation (presented only up to three decimal places).
Air Comfort and Productivity = 1.27 − 0.00785 CO2 + 0.0319 VOC + 0.00913 Relative Humidity
−0.370 Temperature + 0.1035 Outside Temperature
+0.0353 Outside Relative Humidity + 0.1930 Sound +
−0.863 Kind of Workspace_1 − 0.306 Kind of Workspace_2
+1.322 Kind of Workspace_3 + 0.47 Kind of Workspace_4
−0.621 Kind of Workspace_5 + 1.658 Do you sit near (wall type):_1
+0.241 Do you sit near (wall type):_2
−0.448 Do you sit near (wall type):_3
−1.451 Do you sit near (wall type):_4
The regression equation shows various variables that affect occupant indoor air comfort productivity. Results show that carbon dioxide, temperature, sound and wall type influence occupant indoor air comfort levels and productivity.
As part of the analysis, unique relationship graphs were produced to show the impact of different independent parameters on the dependent variable.

4.3. Response Surface Analysis

Response Surface Analysis produced contour and surface plots that present the influence of two indoor environmental parameters on indoor air comfort and productivity. These plots are used to identify optimal results by showing the effect of variations of two independent variables on the dependent variable [76,83]. These graphs also present any interdependencies of independent variables, and they would help outline any latent effects of different indoor environmental factors on indoor air comfort and productivity. The analysis produced 15 relationships; however, only 12 were considered due to the high p-value of indoor environmental quality. The relationships listed below are the outcome of the RSM (Table 5).

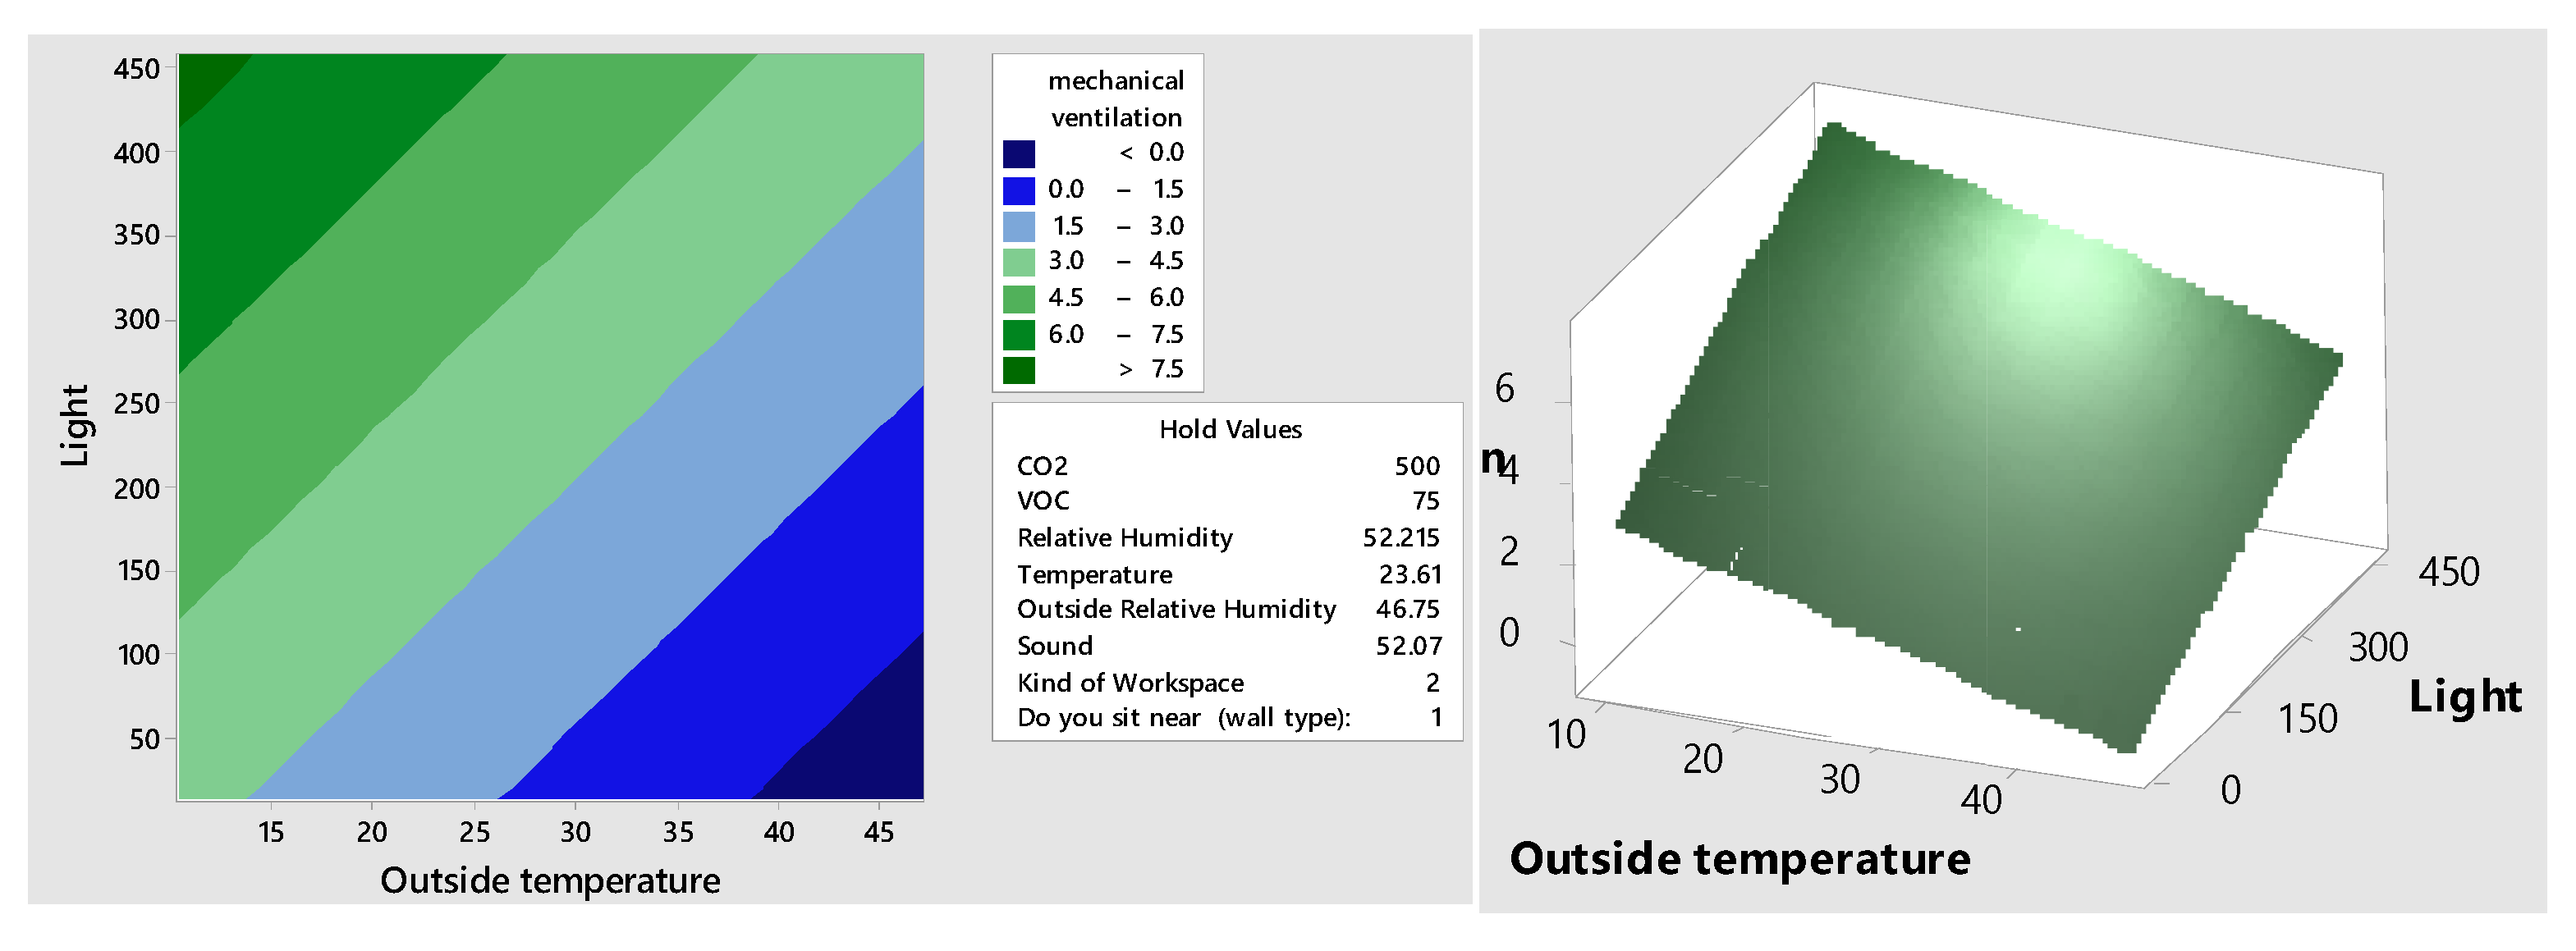
4.3.1. Relationship between Outside Temperature, Illumination and Indoor Air Comfort and Productivity

The plots shown in Figure 3 outline the interaction between illumination and outside temperature. Both illumination and outside temperature impact indoor air comfort and productivity. Higher lux levels have a positive impact on occupant indoor air comfort and productivity. However, higher outside temperature has a negative impact, which shows that the occupant’s perception of air quality improves with the lux levels. Illumination above 150 lux has a positive impact on air comfort and productivity. This relationship also demonstrates that outside temperature influences indoor air quality through mechanical ventilation.

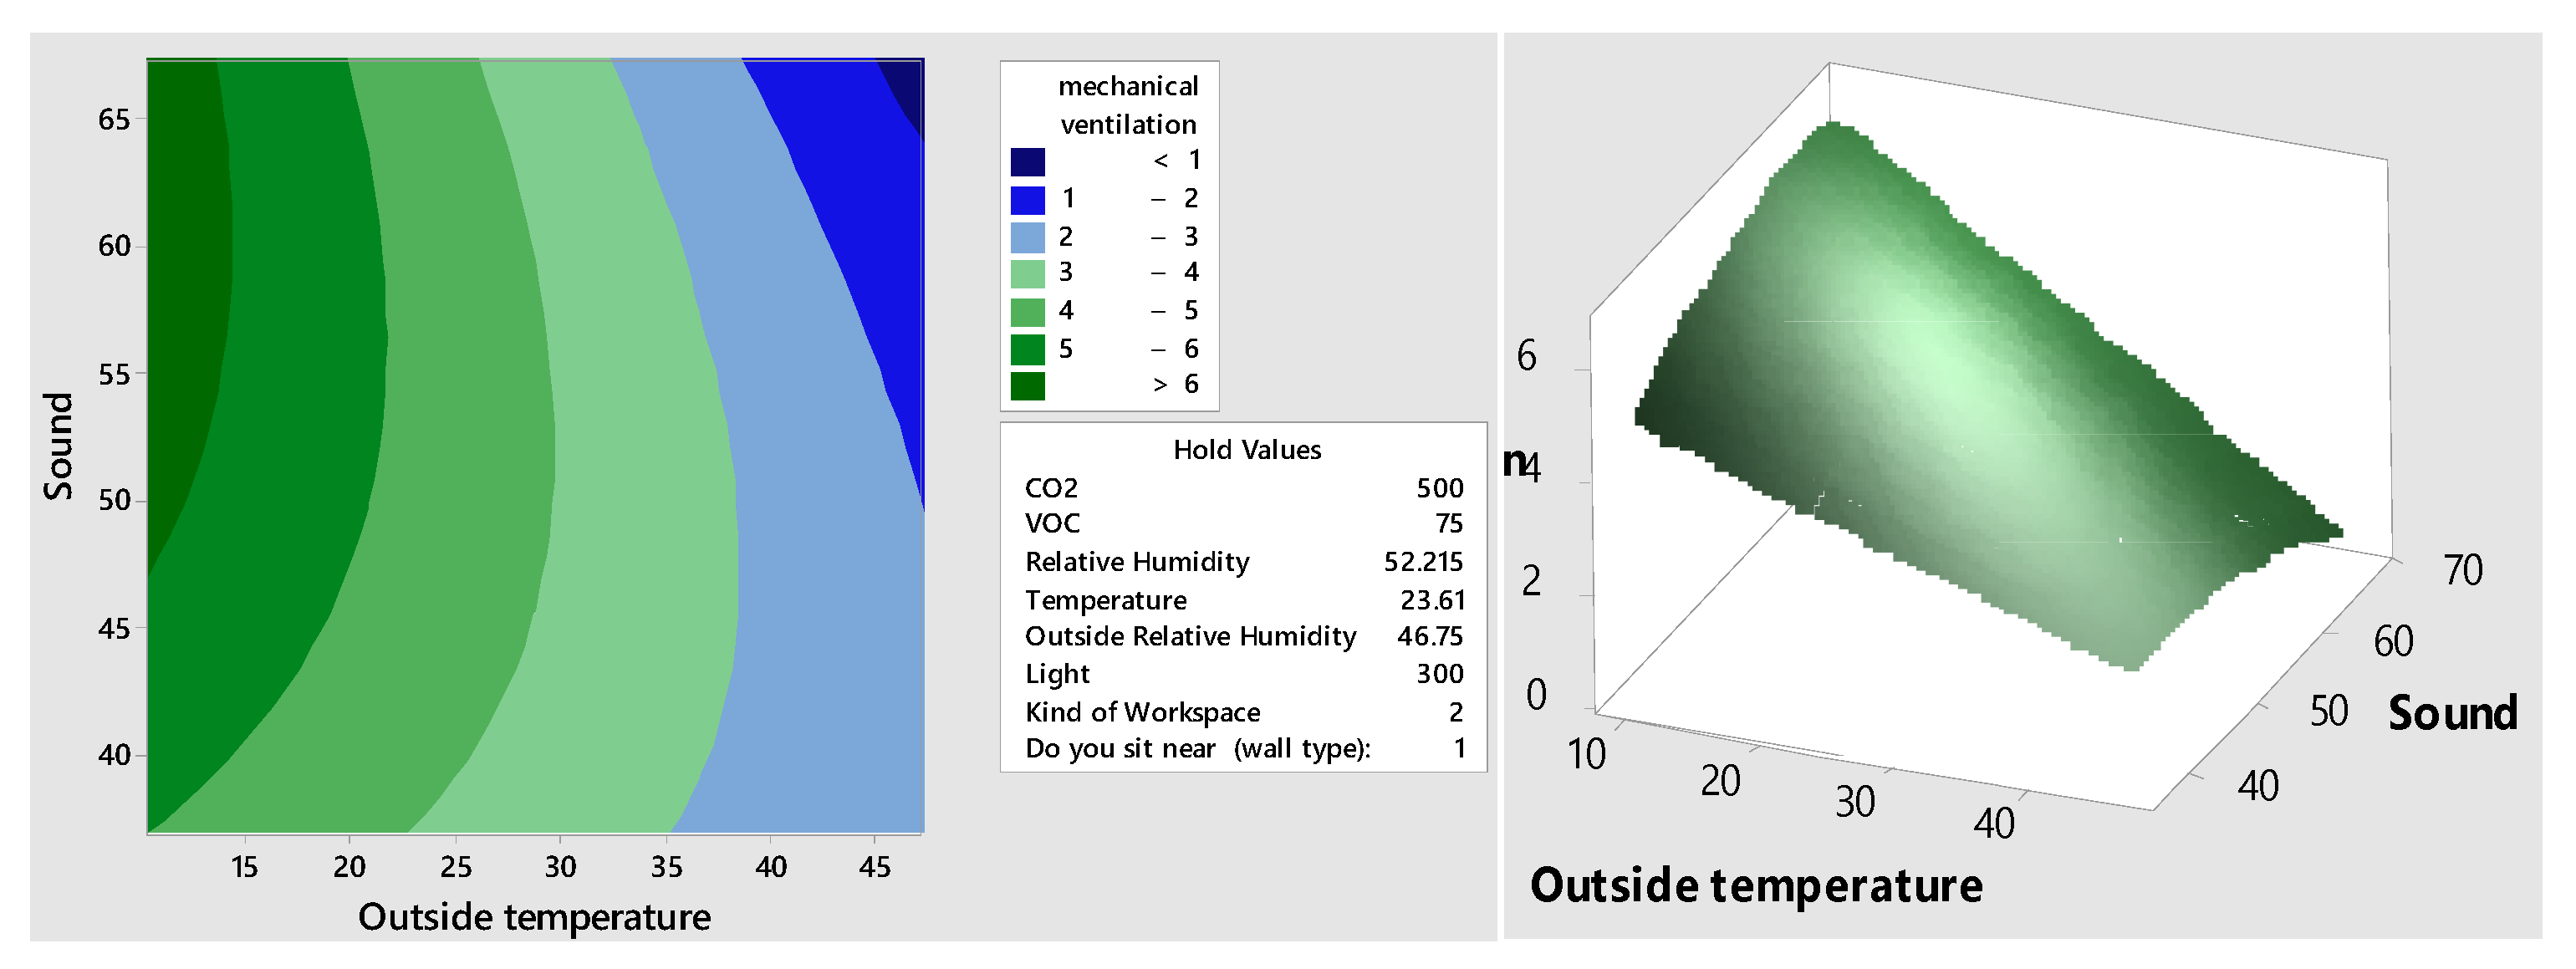
4.3.2. Relationship between Outside Temperature, Sound and Indoor Air Comfort and Productivity

The plots shown in Figure 4 outline the interaction between sound and outside temperature on indoor air comfort and productivity. Outside temperature negatively correlates with indoor air comfort and productivity in this interaction, and the outside temperature has a positive effect below 35 °C, which confirms previous findings that outside temperature negatively impacts indoor air comfort and productivity, and also indicates that sound does not affect indoor air comfort and productivity.

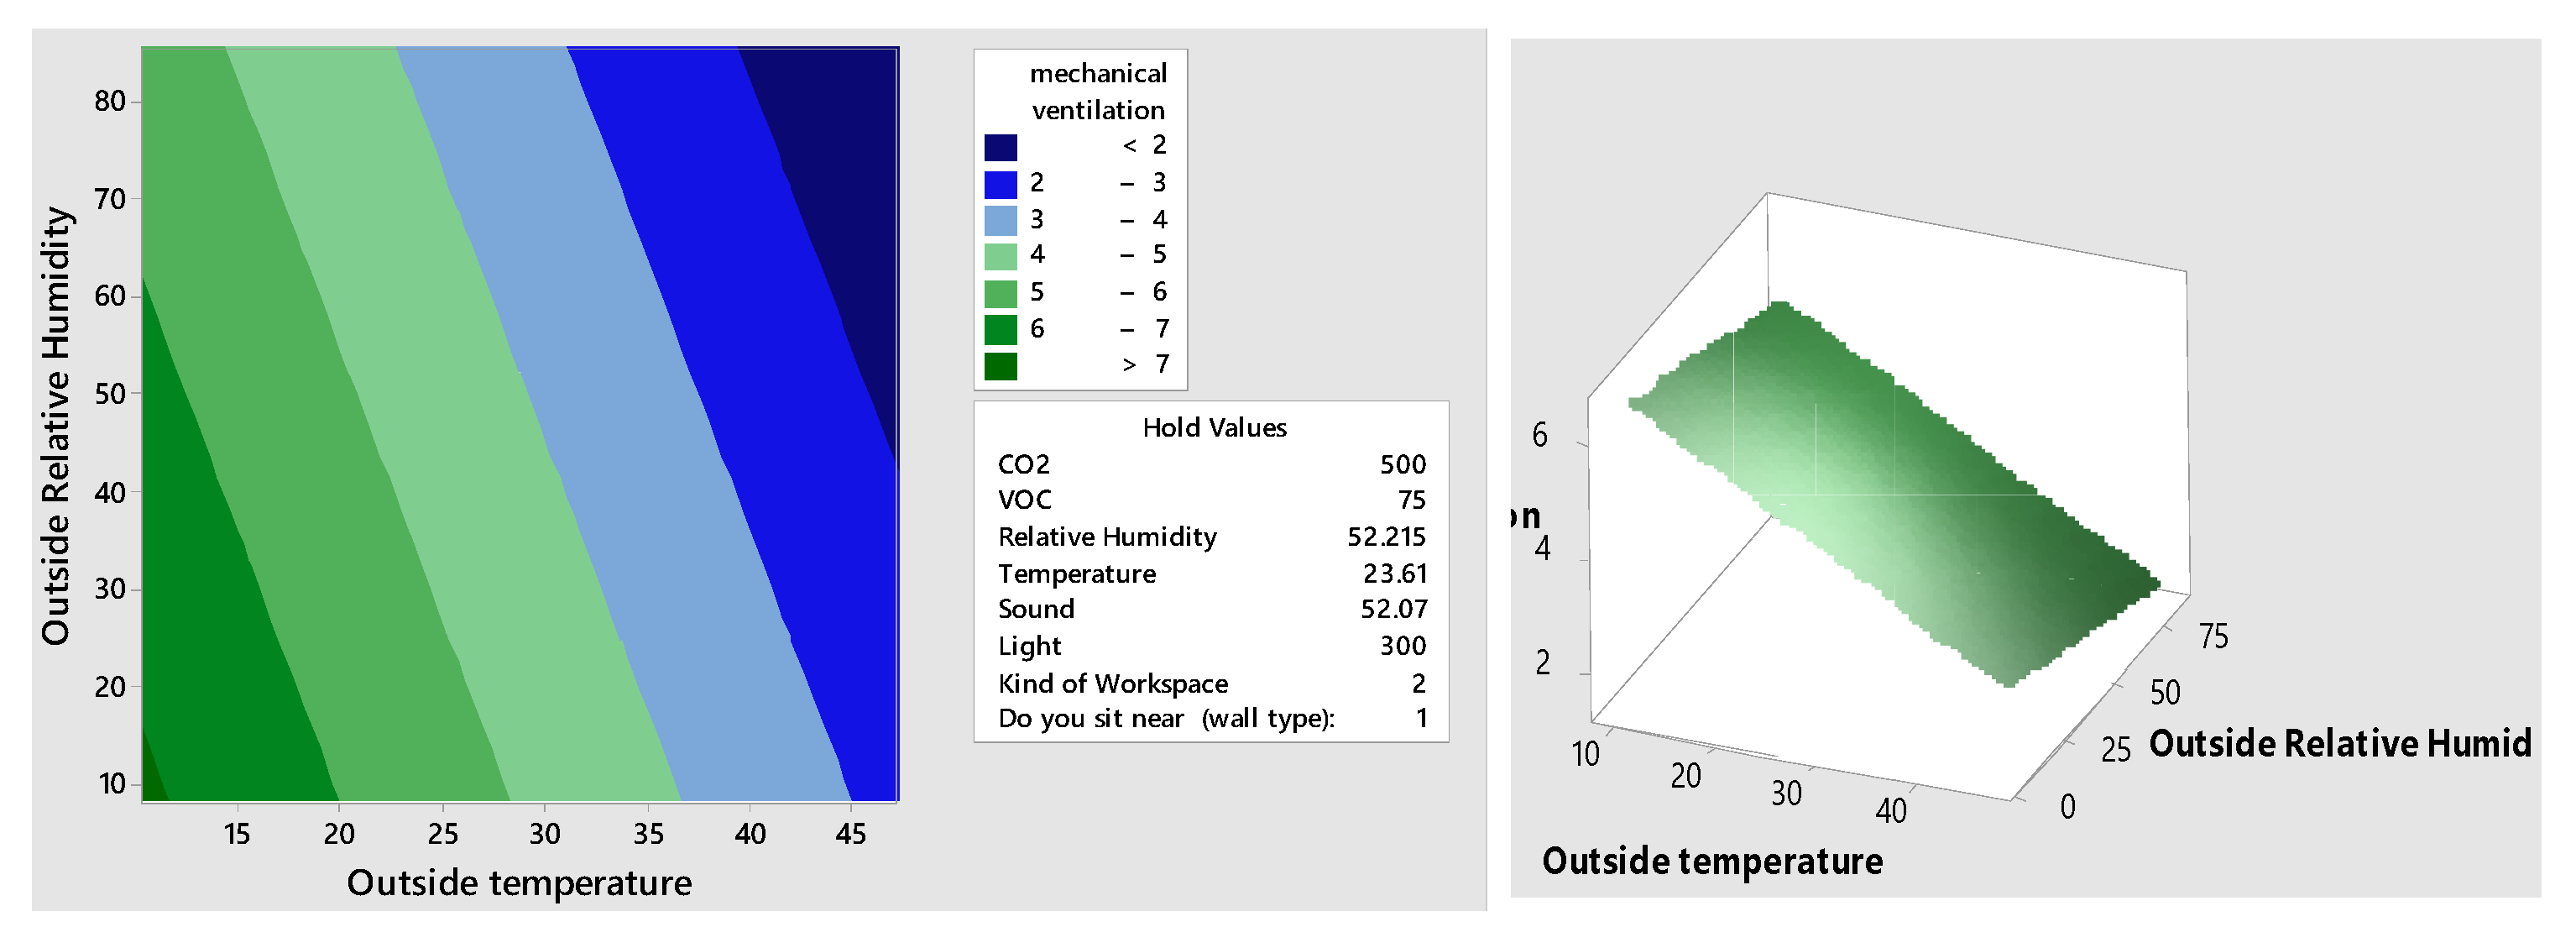
4.3.3. Relationship between Outside Temperature, Outside Relative Humidity and Indoor Air Comfort and Productivity

The plots shown in Figure 5 outline the relationship between outside relative humidity, outdoor temperature and indoor air comfort. Both outside temperature and relative humidity have an adverse effect on occupant indoor air comfort and productivity. An increase in outside temperature and relative humidity leads to a reduction in indoor air comfort and productivity. Plots indicate that outside temperature below 35 °C has a positive effect on indoor air comfort and productivity.

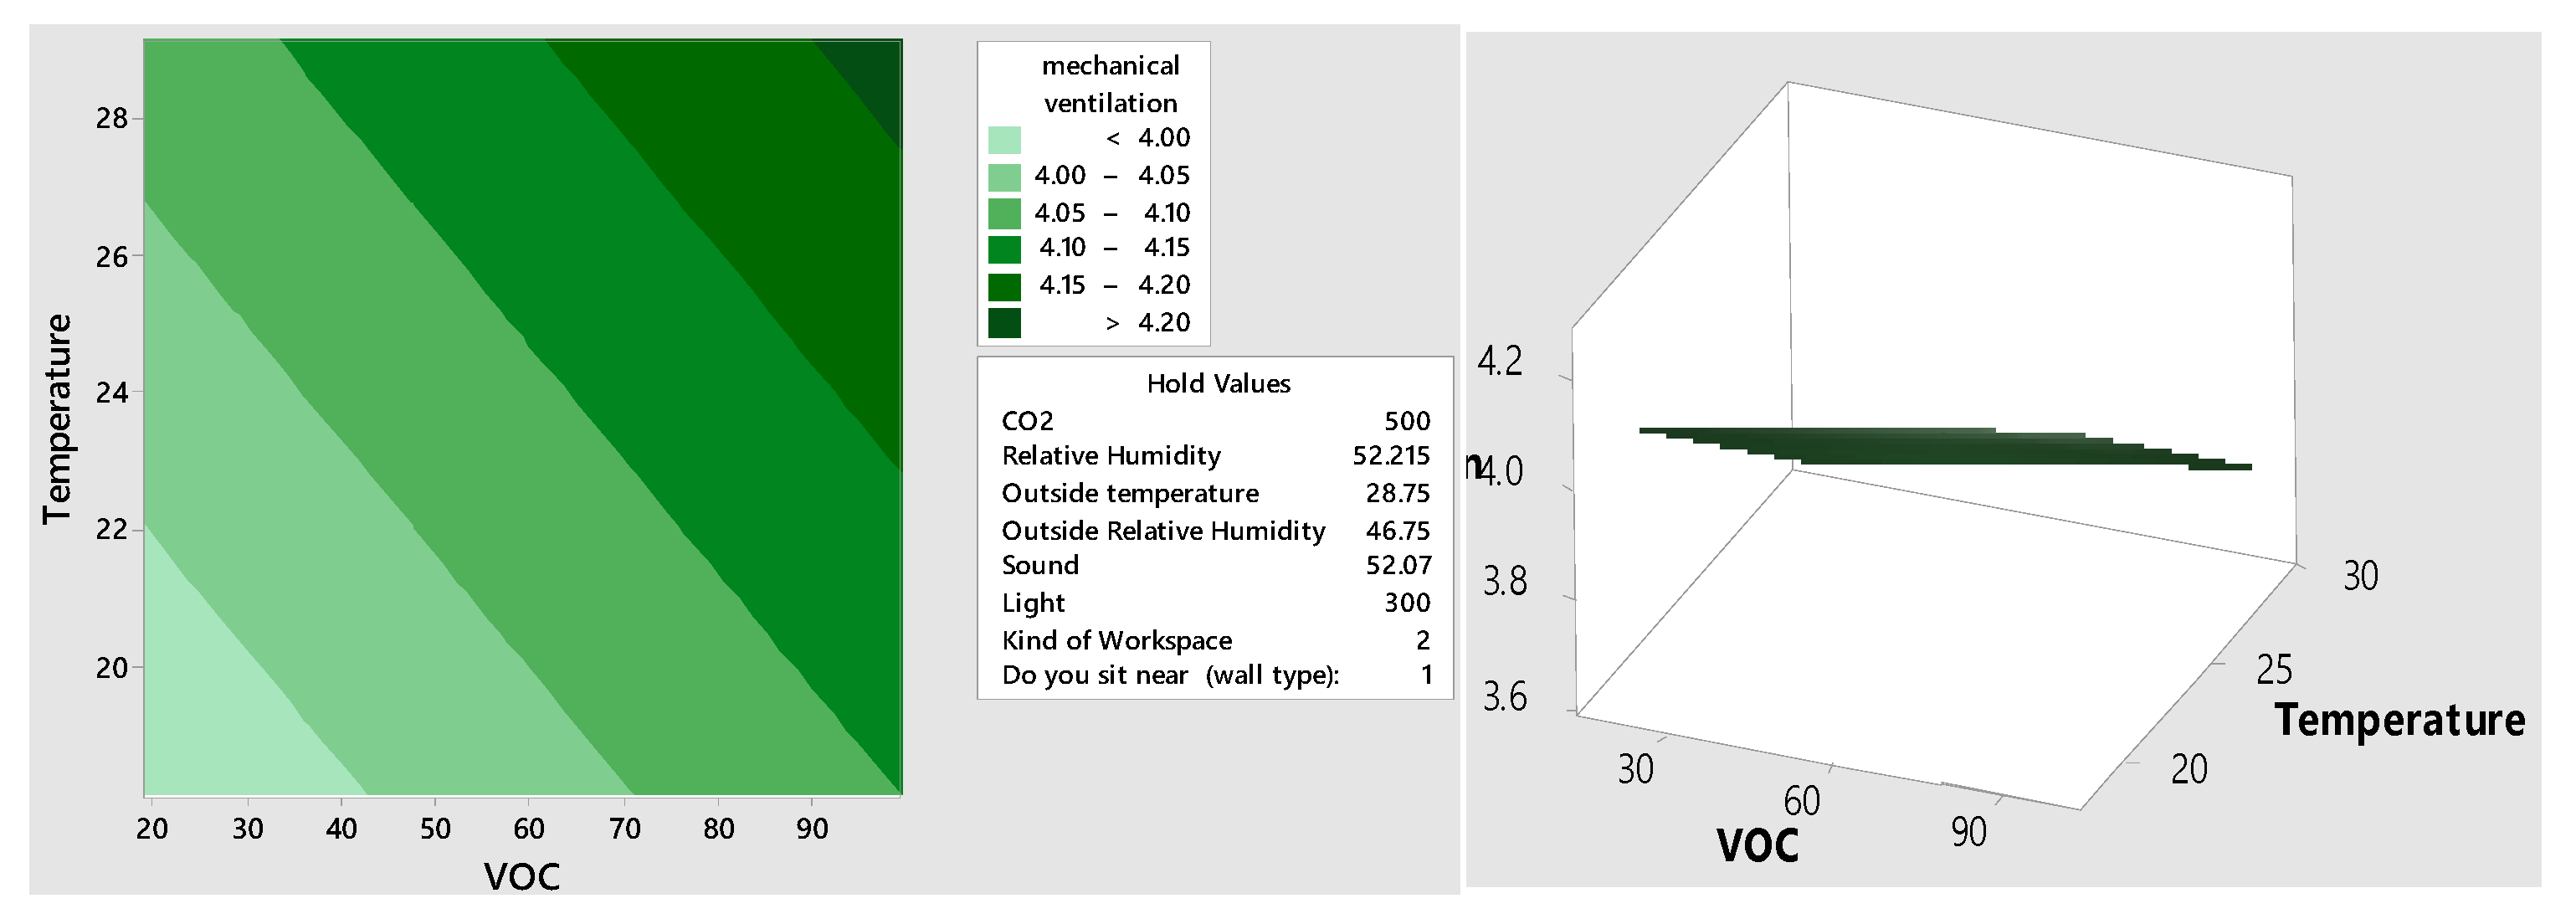
4.3.4. Relationship between VOC, Temperature and Indoor Air Comfort and Productivity

The plots shown in Figure 6 outline that VOC has a more substantial impact, and that higher VOC-free air leads to better indoor air comfort and productivity. They show that 70% of VOC-free air and above can positively affect occupant comfort and productivity. In this interaction, the temperature has a weak influence on occupant air comfort and productivity in comparison to VOC. However, a lower temperature is associated with lower air comfort and productivity.

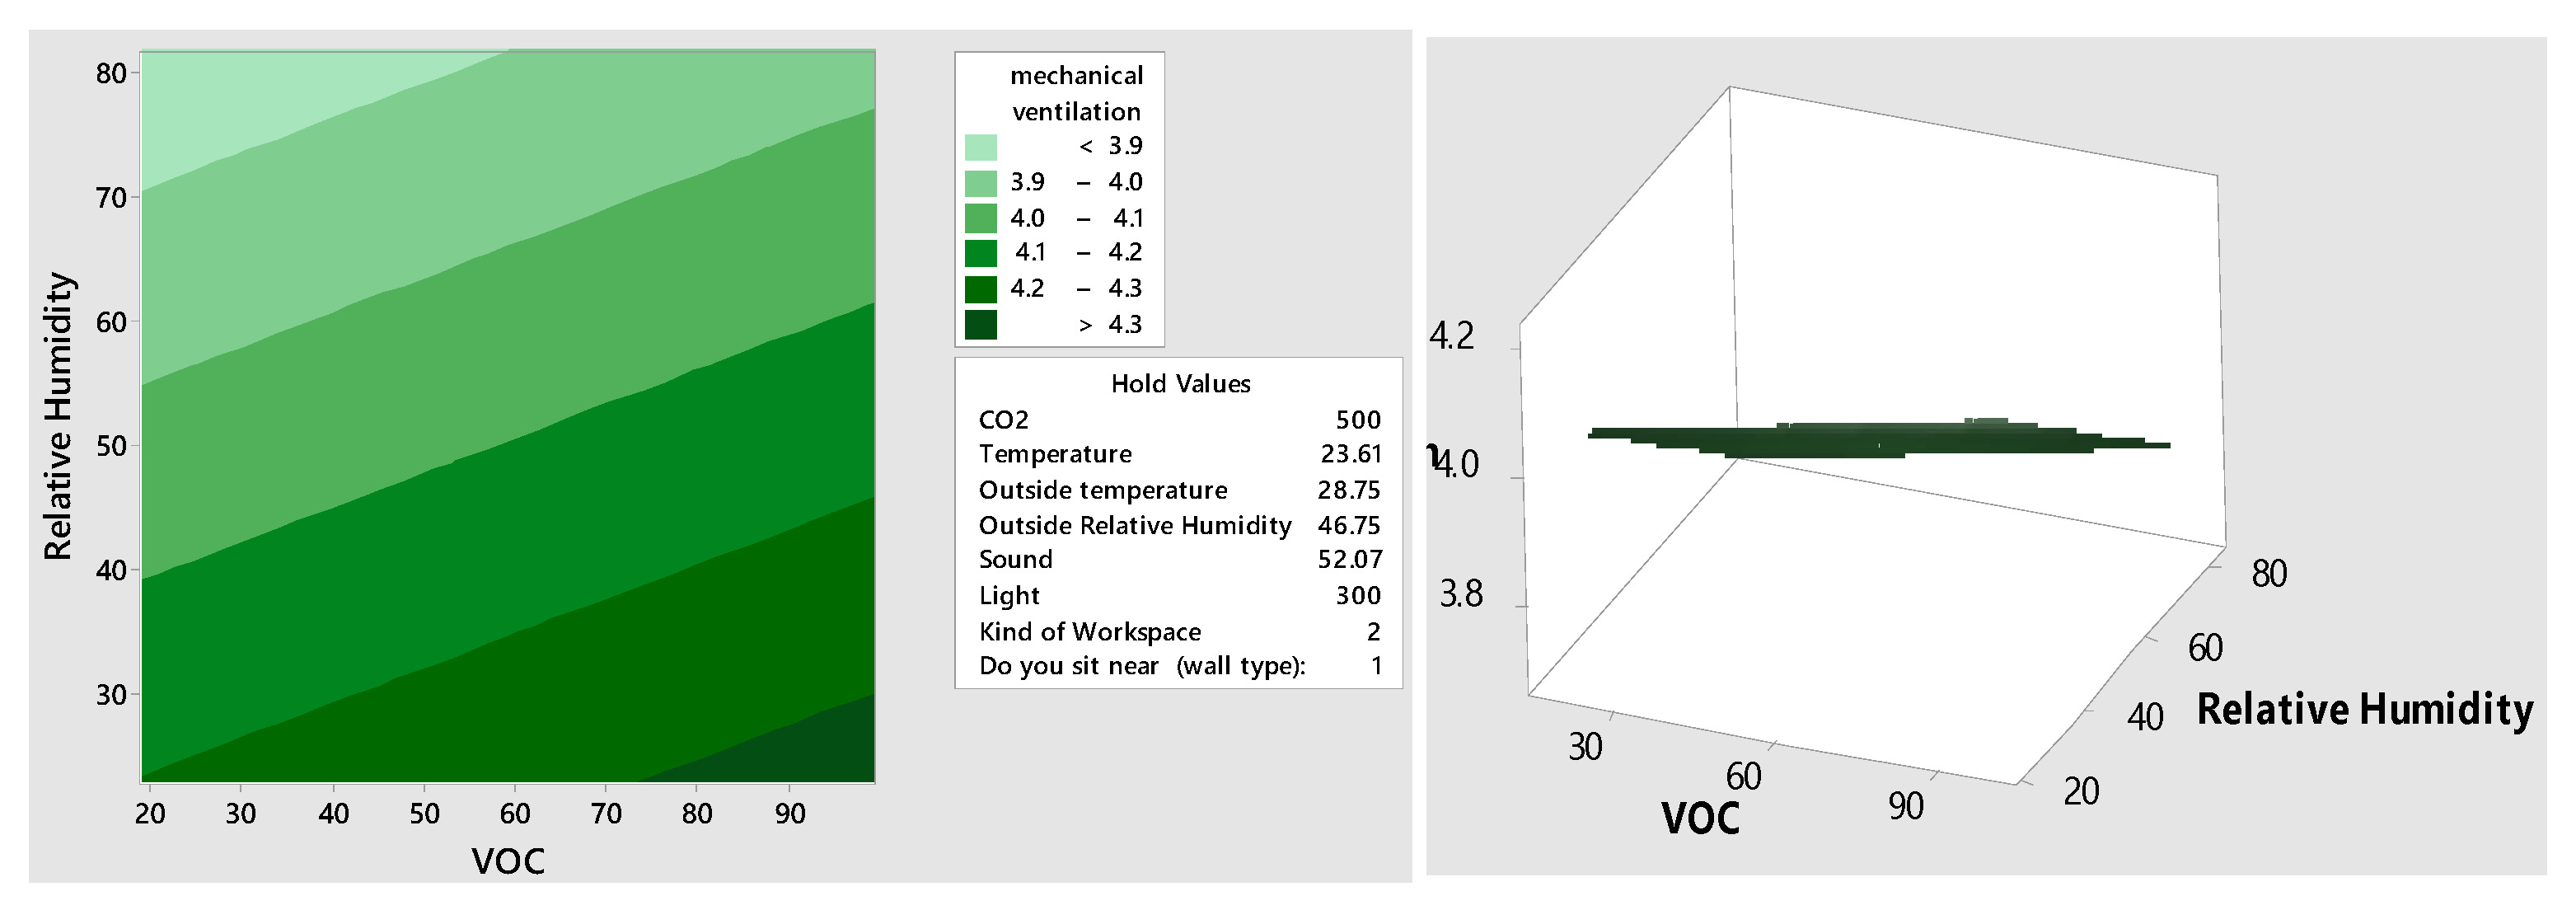
4.3.5. Relationship between VOC, Relative Humidity and Indoor Air Comfort and Productivity

The plots shown in Figure 7 present the interaction between relative humidity, VOC and indoor air comfort. These plots show that both VOC and relative humidity influence occupant indoor air comfort and productivity. Higher VOC-free air increases air comfort and productivity, and VOC open air above 70% has a positive impact. In comparison, higher humidity results in indoor air discomfort and productivity. Optimum relative humidity levels are noted to be below 60%. Interestingly, relative humidity has a more substantial influence than VOC in this interaction.

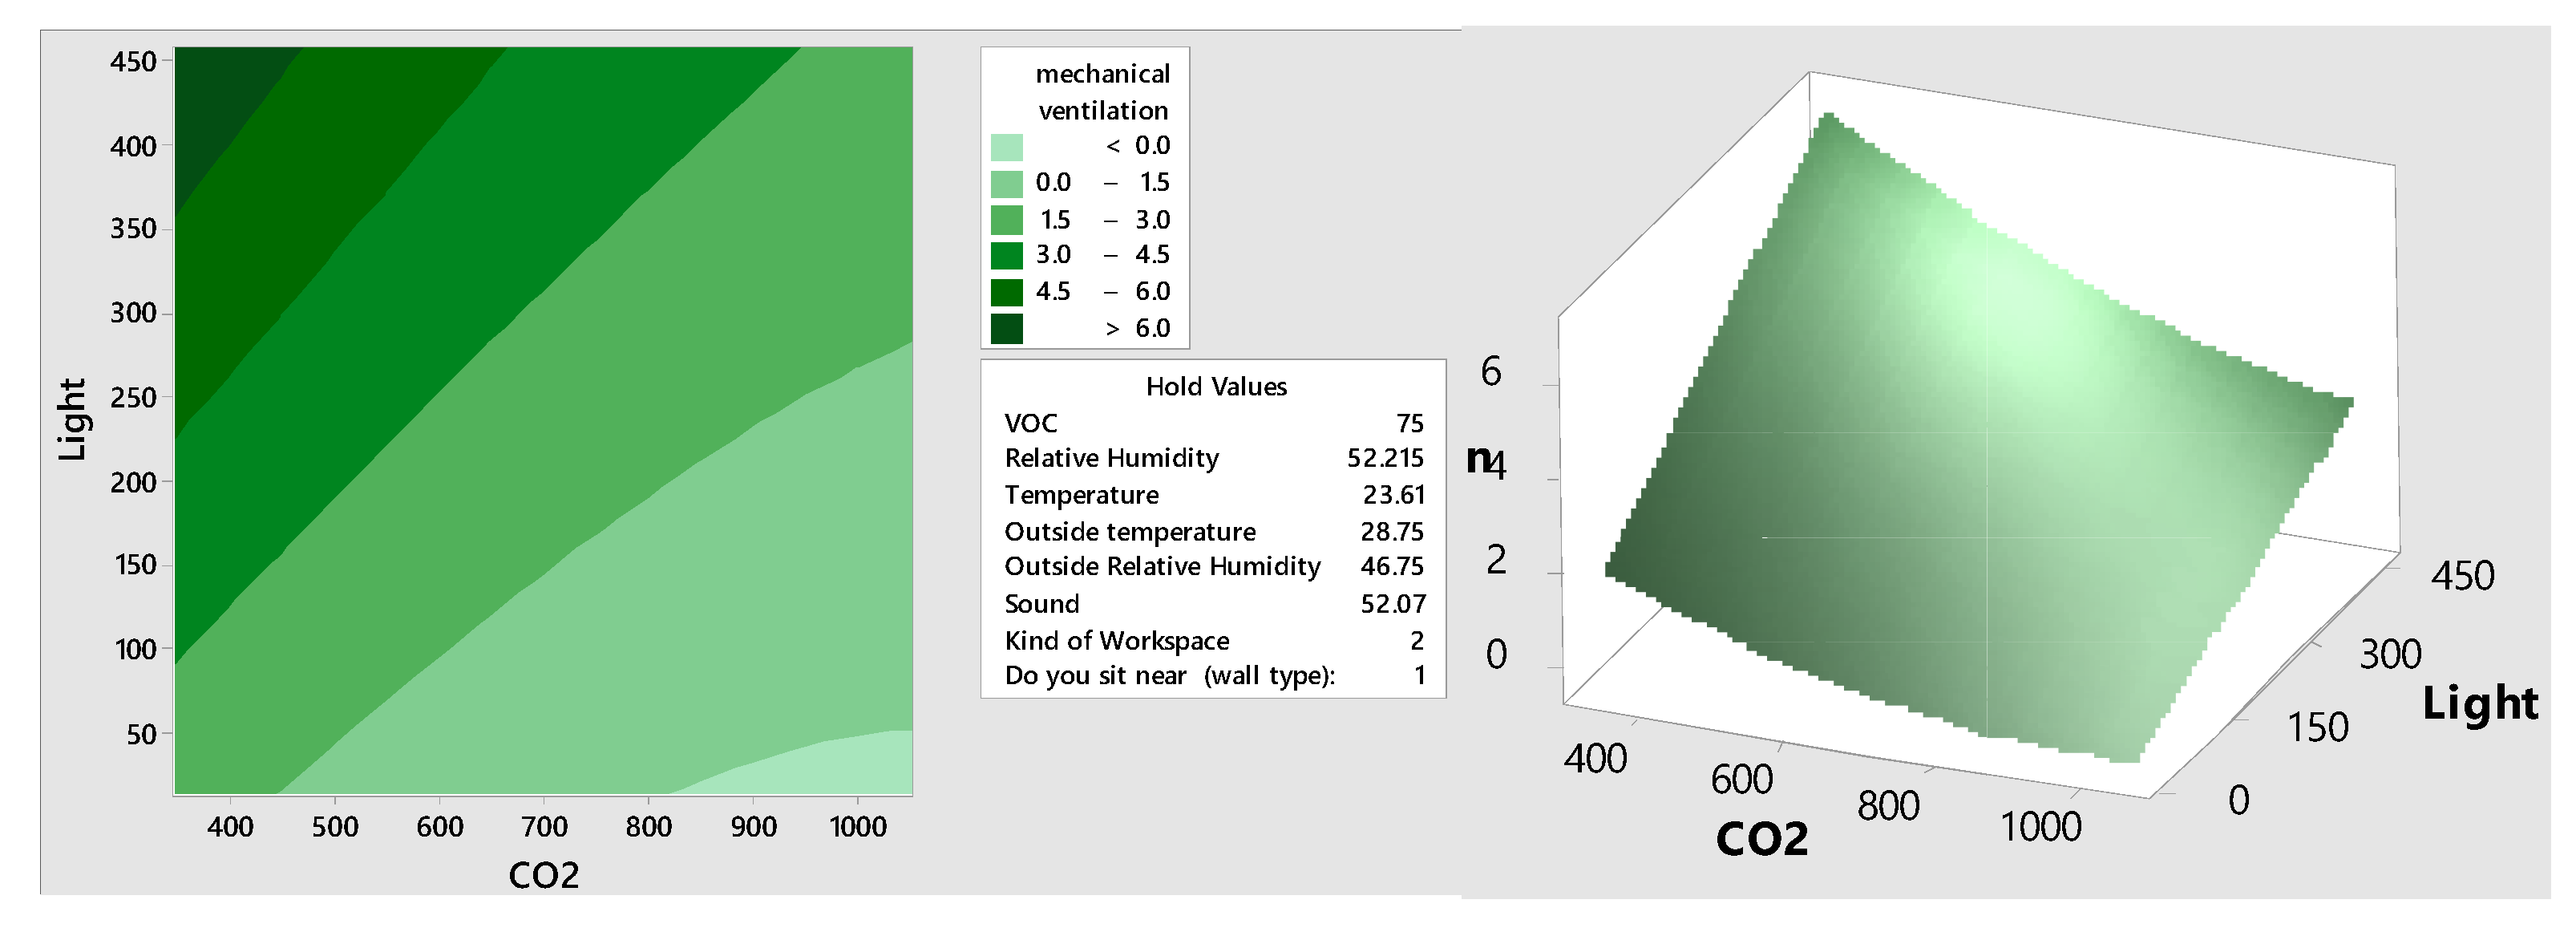
4.3.6. Relationship between Cardon Dioxide, Illumination and Indoor Air Comfort and Productivity

The plots shown in Figure 8 outline the interaction between illumination, carbon dioxide and indoor air comfort. They show that illumination levels and carbon dioxide affect indoor air comfort and productivity. Higher illumination levels result in higher comfort and productivity; the optimum lux level range is 250–450 lux. Higher carbon dioxide in the air results in lower productivity, and the optimum carbon dioxide level is achieved below 600 ppm.

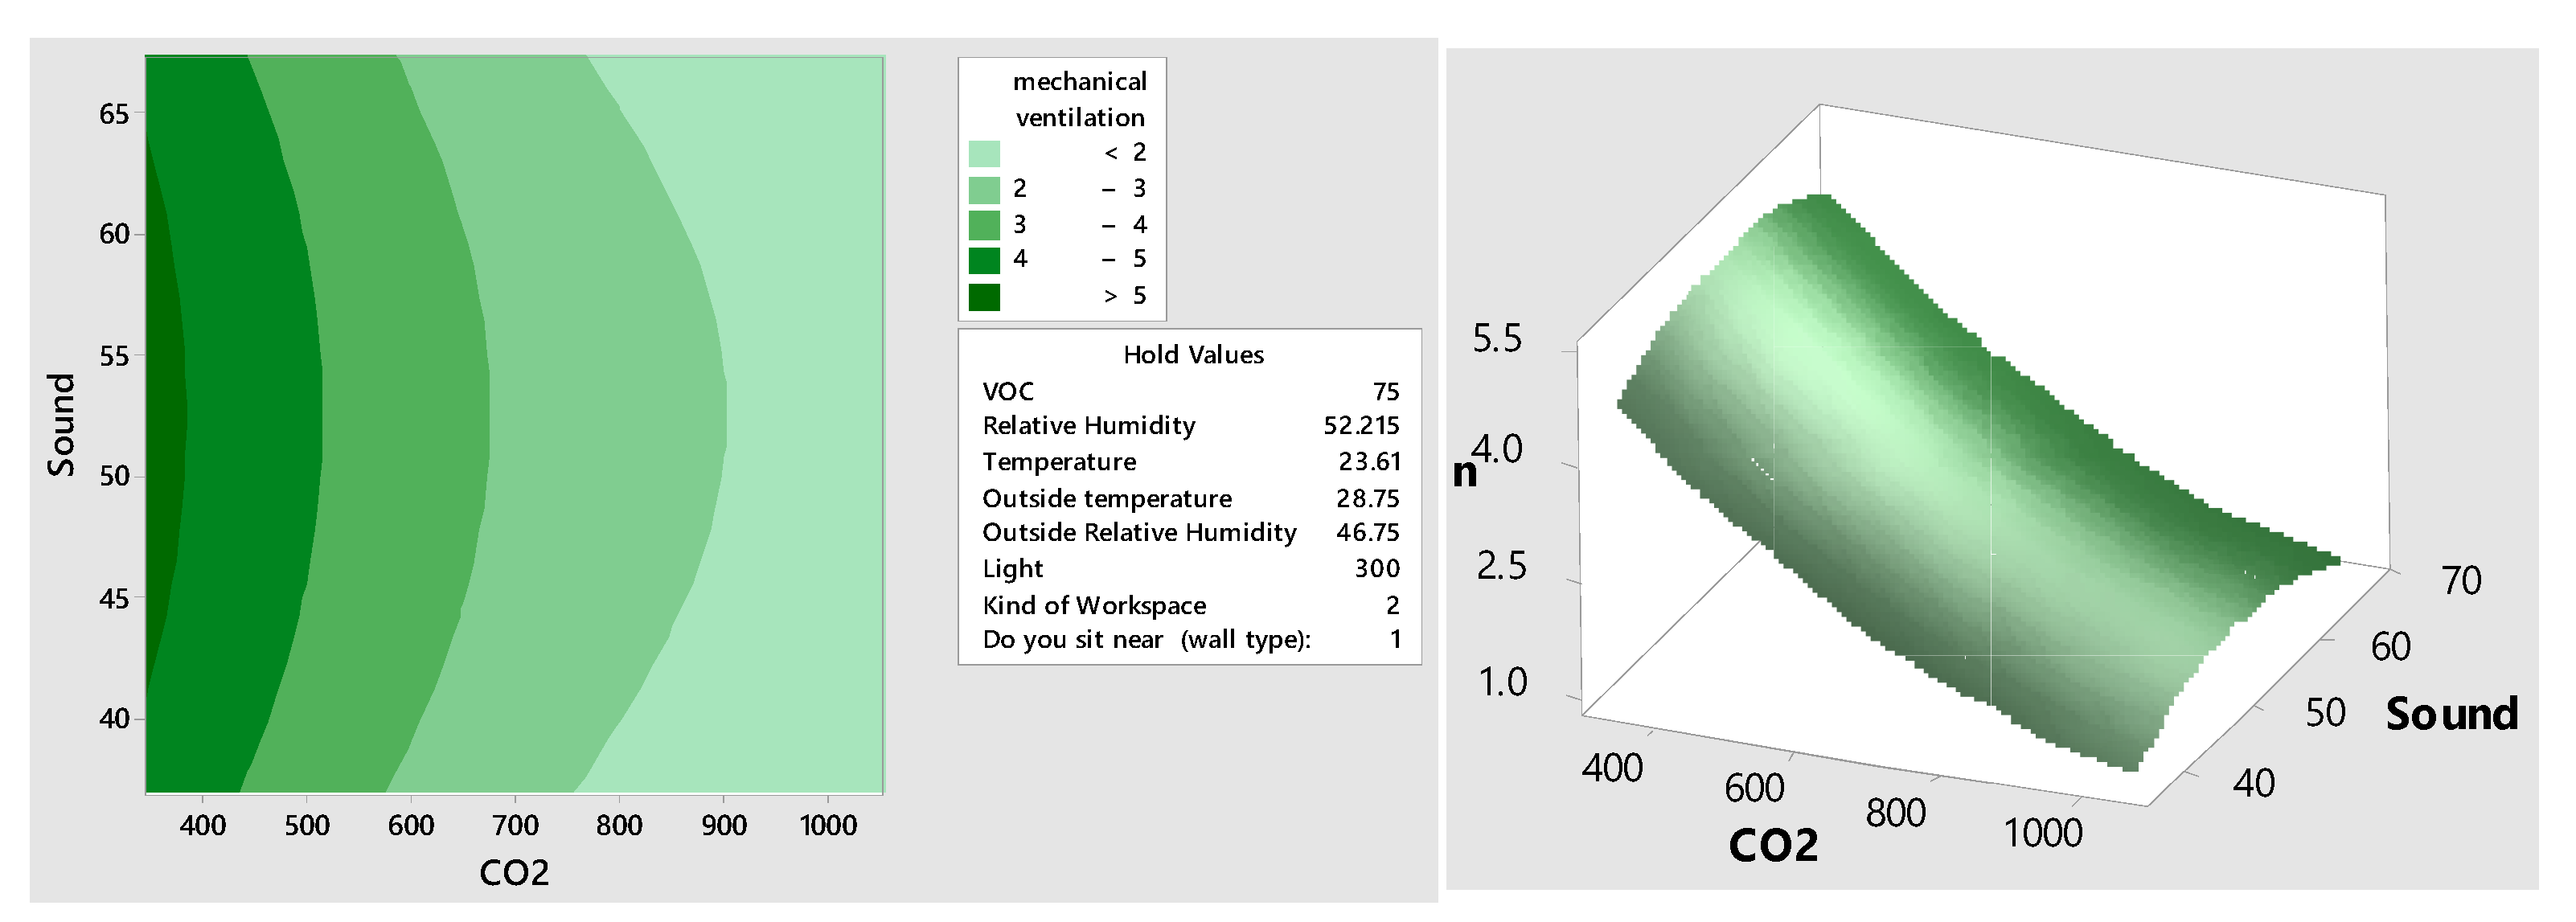
4.3.7. Relationship between Sound, Carbon Dioxide and Indoor Air Comfort and Productivity

The plots shown in Figure 9 present the interaction between sound, carbon dioxide, indoor air comfort, and productivity. In this interaction, the sound minimises indoor air comfort and productivity. Carbon dioxide significantly impacts indoor air comfort and productivity, and an optimum level of carbon dioxide is below 600 ppm.

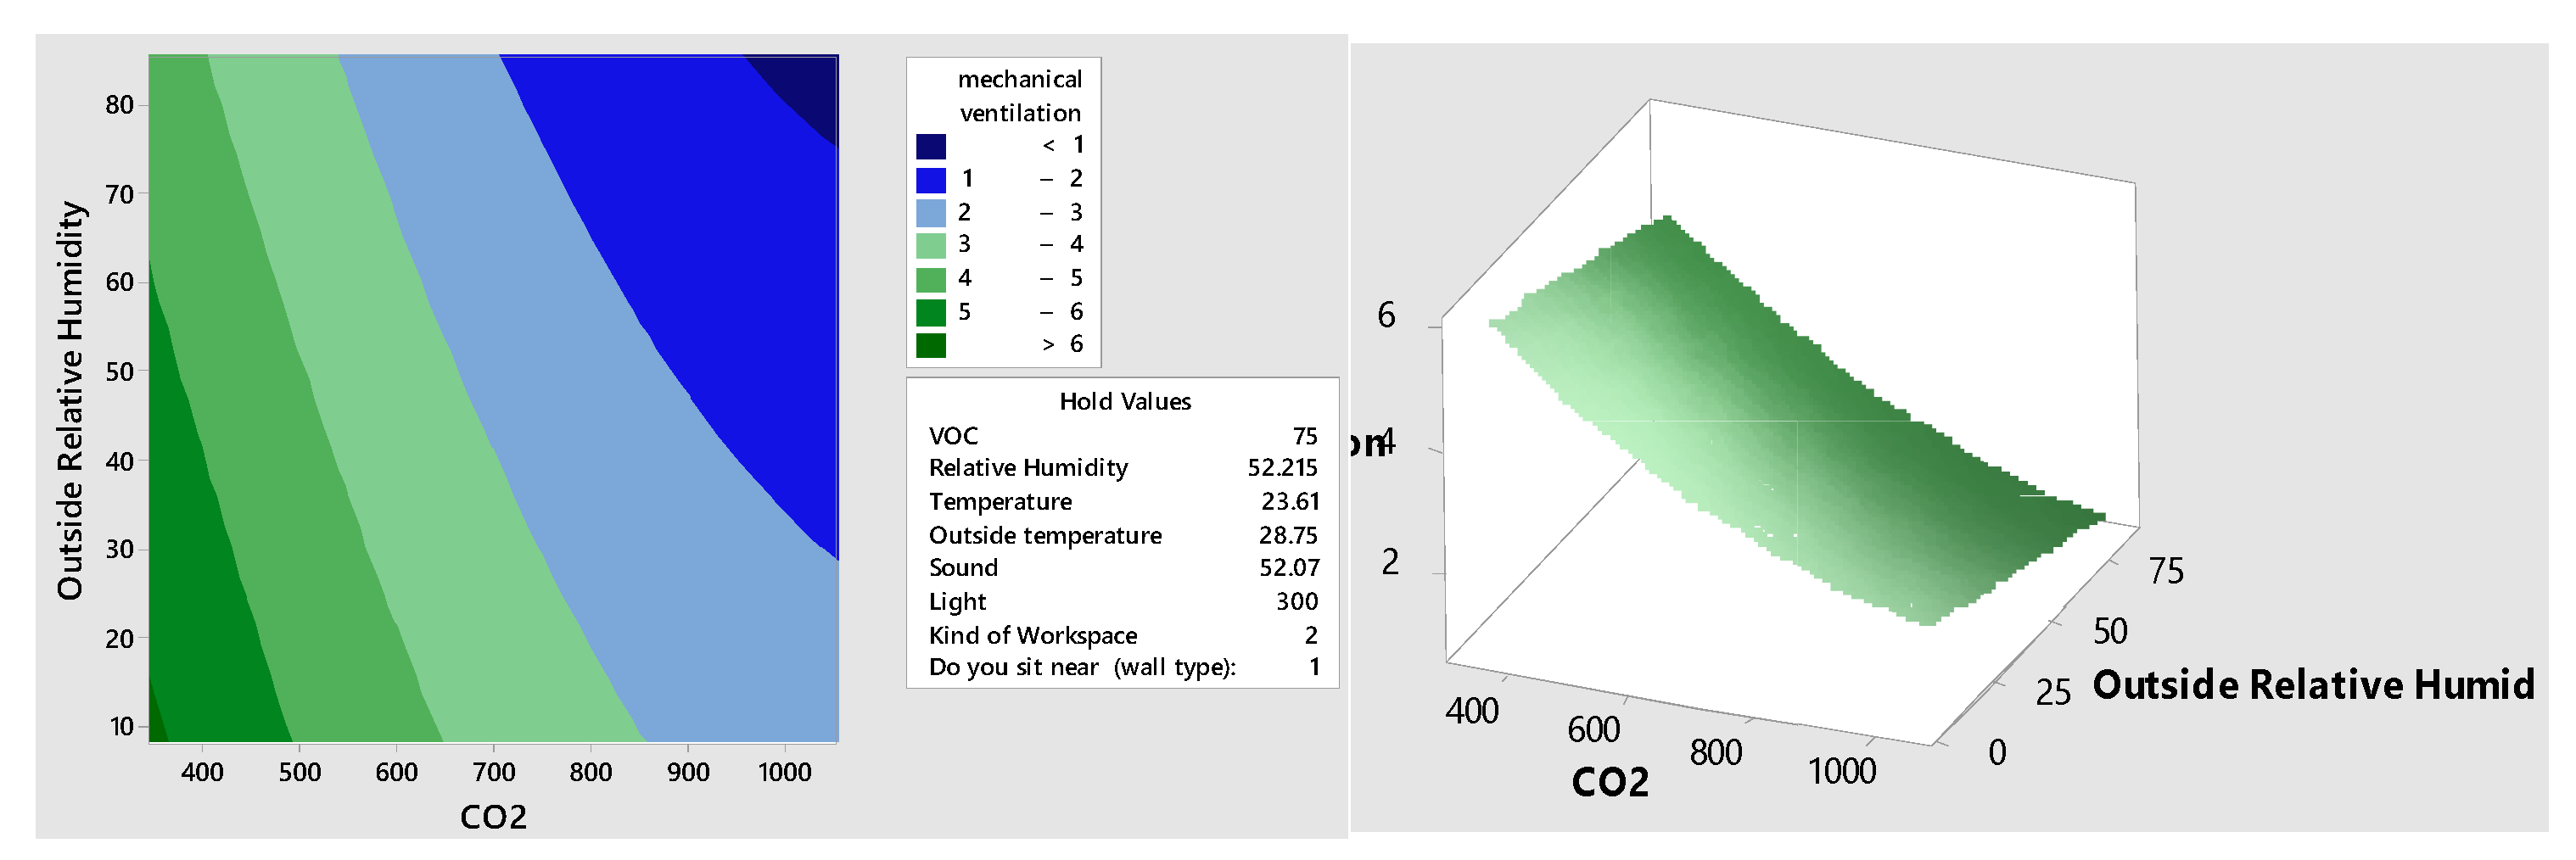
4.3.8. Relationship between Outside Relative Humidity, Carbon Dioxide and Indoor Air Comfort and Productivity

The plots shown in Figure 10 outline the influence of outside relative humidity and carbon dioxide on indoor air comfort. Outside relative humidity and carbon dioxide affect indoor air comfort and productivity, and increased levels of outside relative humidity negatively impact air comfort and productivity. Optimum levels of outside relative humidity are below 60%, and higher carbon dioxide levels lead to lower air comfort and productivity. The optimum carbon dioxide level is observed to be below 650 ppm.

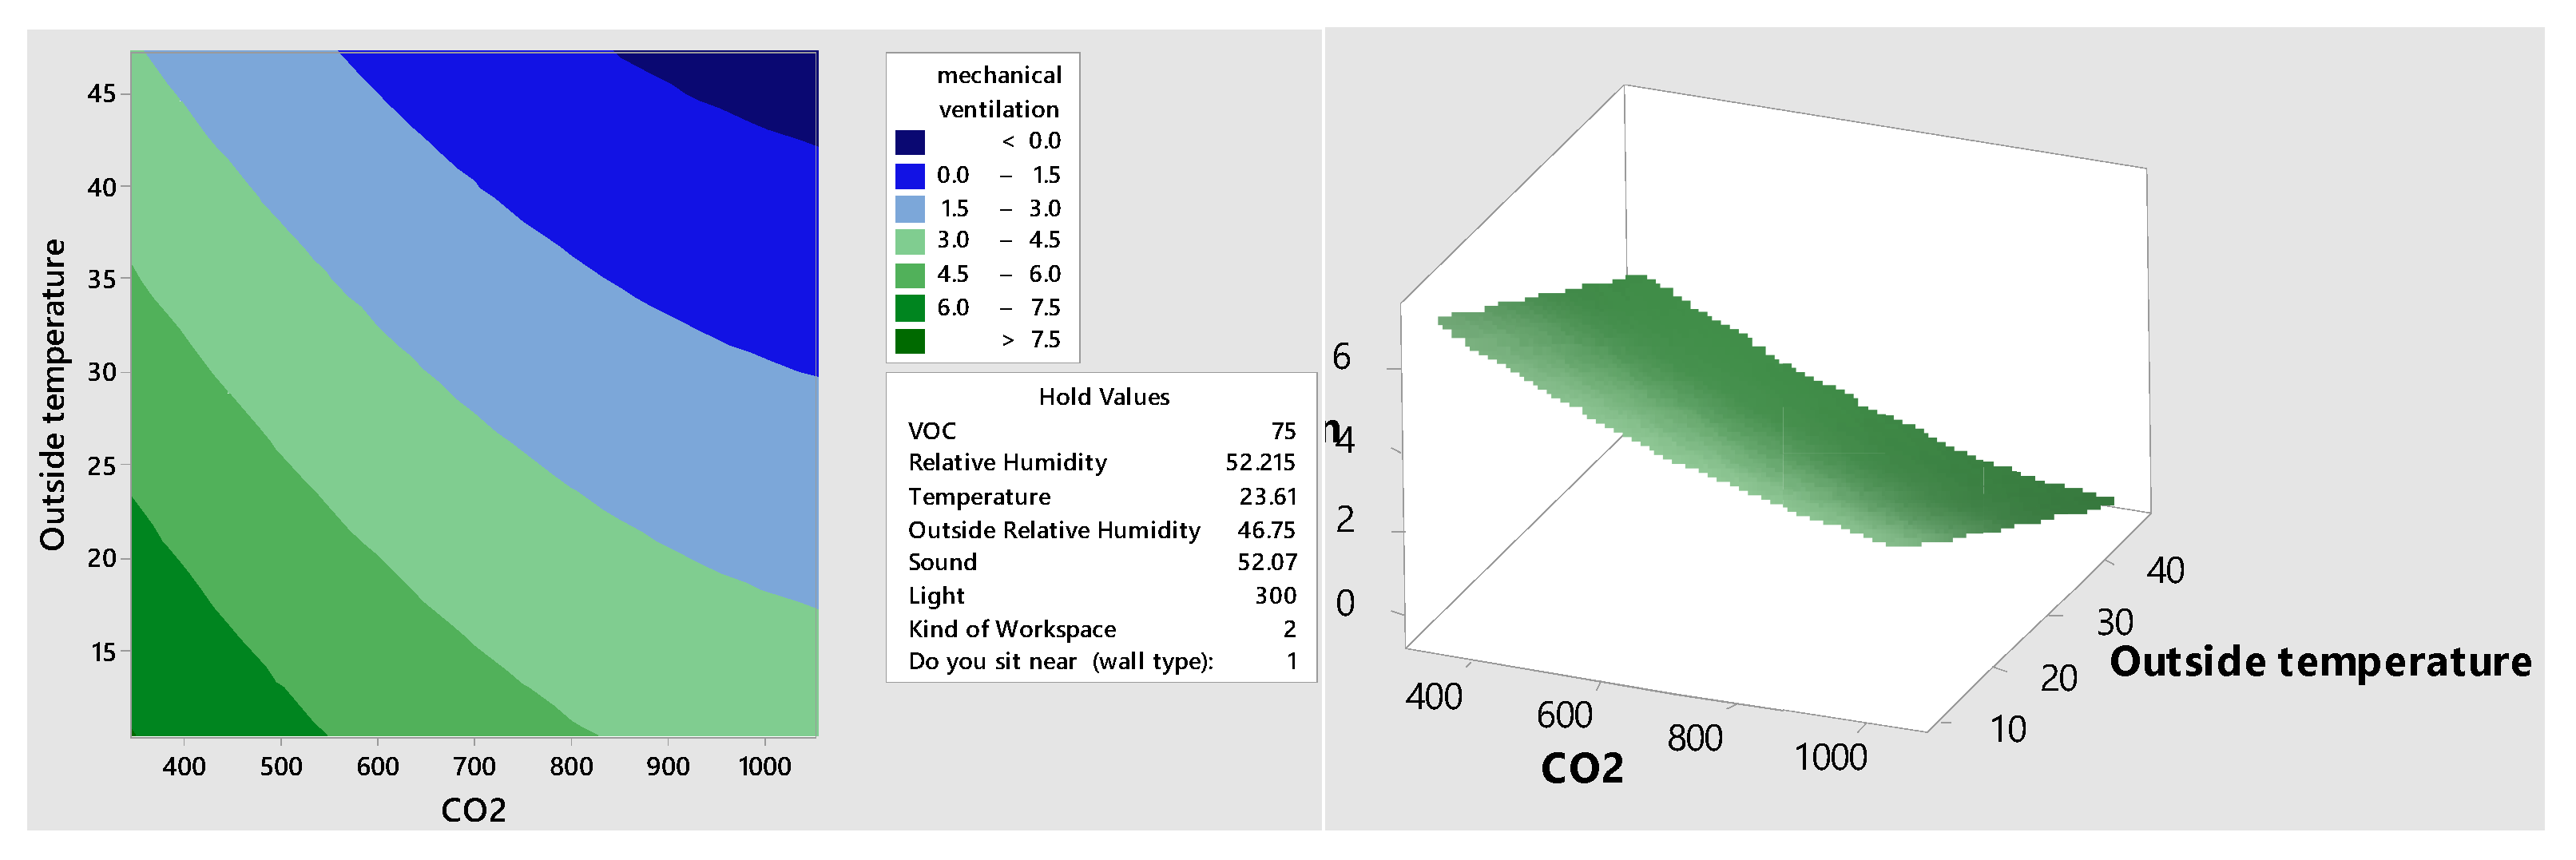
4.3.9. Relationship between Outside Temperature, Carbon Dioxide and Indoor Air Comfort and Productivity

The plots shown in Figure 11 present interactions between temperature, carbon dioxide, indoor air comfort and productivity. Outside temperature and carbon dioxide negatively correlate with indoor air comfort and productivity, and optimum carbon dioxide levels are below 800 ppm.

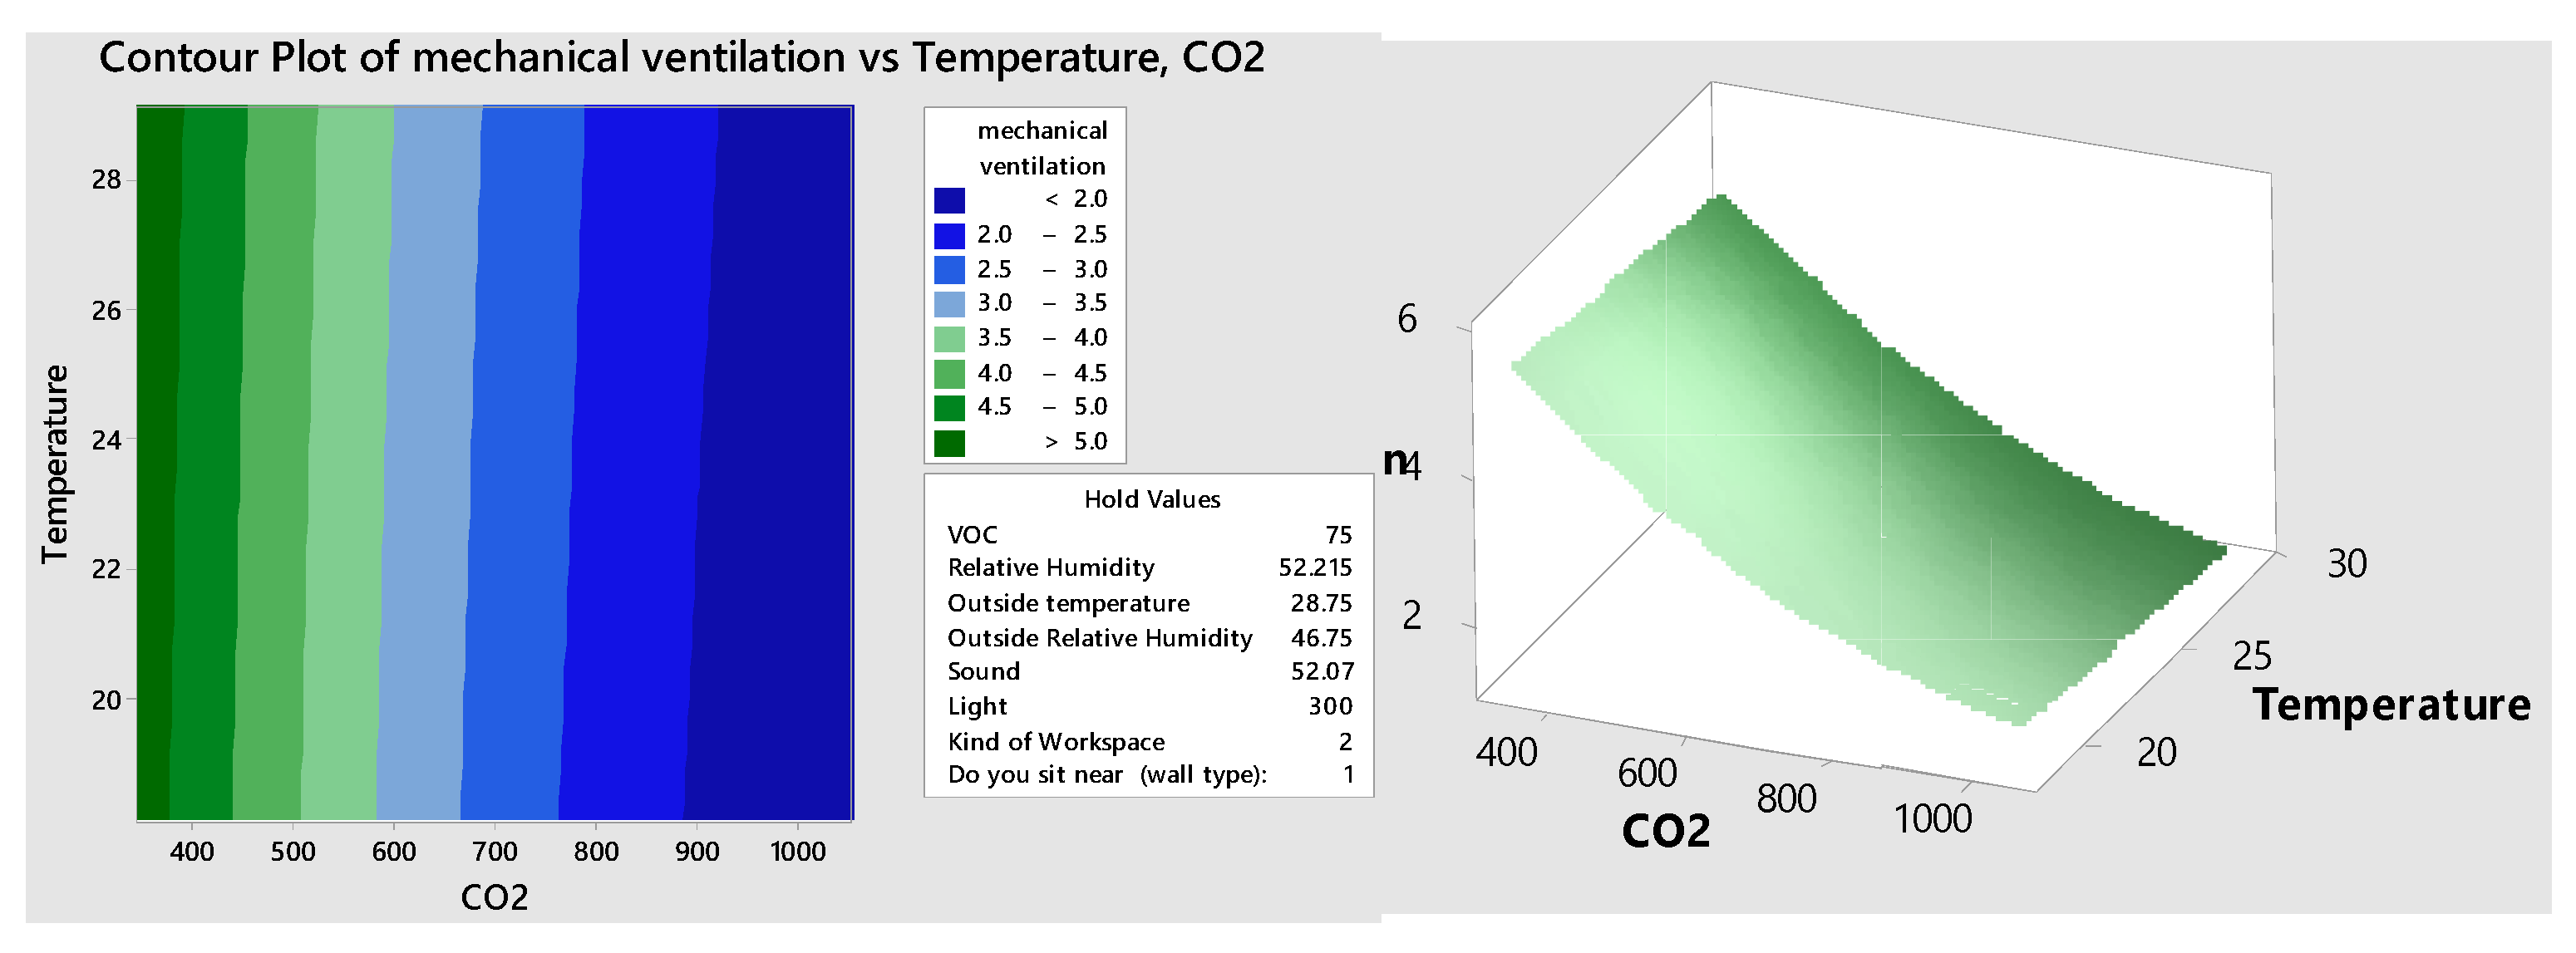
4.3.10. Relationship between Temperature, Carbon Dioxide on Indoor Air Comfort and Productivity

The plots shown in Figure 12 present the interaction between the temperature, carbon dioxide and indoor air comfort. Carbon dioxide significantly influences indoor air comfort, and optimum levels are observed up to 500 ppm. In this interaction, plots indicate that temperature does not significantly affect indoor air comfort and productivity.

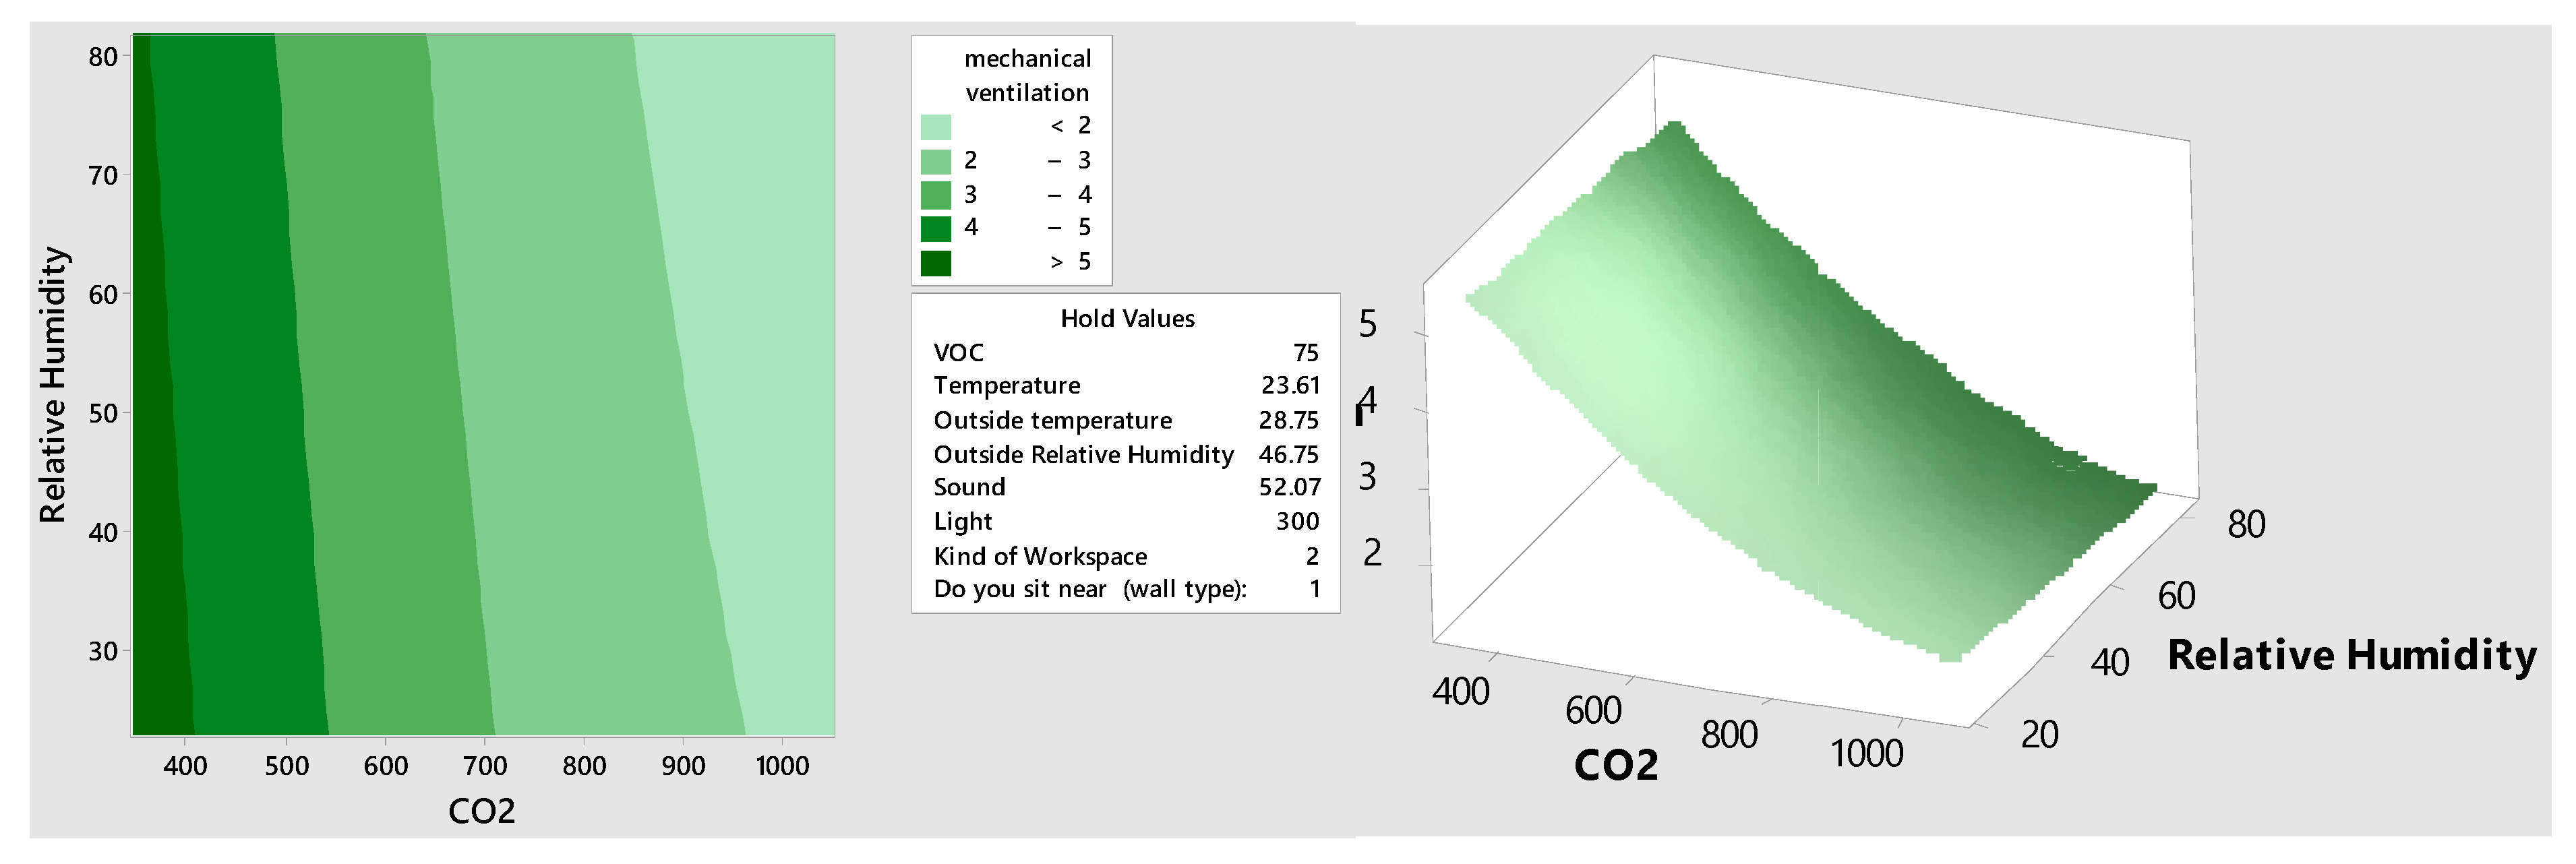
4.3.11. Relationship between Relative Humidity, Carbon Dioxide and Indoor Air Comfort and Productivity

The plots shown in Figure 13 outline the relationship between relative humidity, carbon dioxide, indoor air comfort and productivity. Carbon dioxide significantly impacts indoor air quality—and by extension, occupant comfort and productivity—and optimum levels are observed below 700 ppm. Between the relative humidity and carbon dioxide, relative humidity does not significantly affect indoor air comfort.

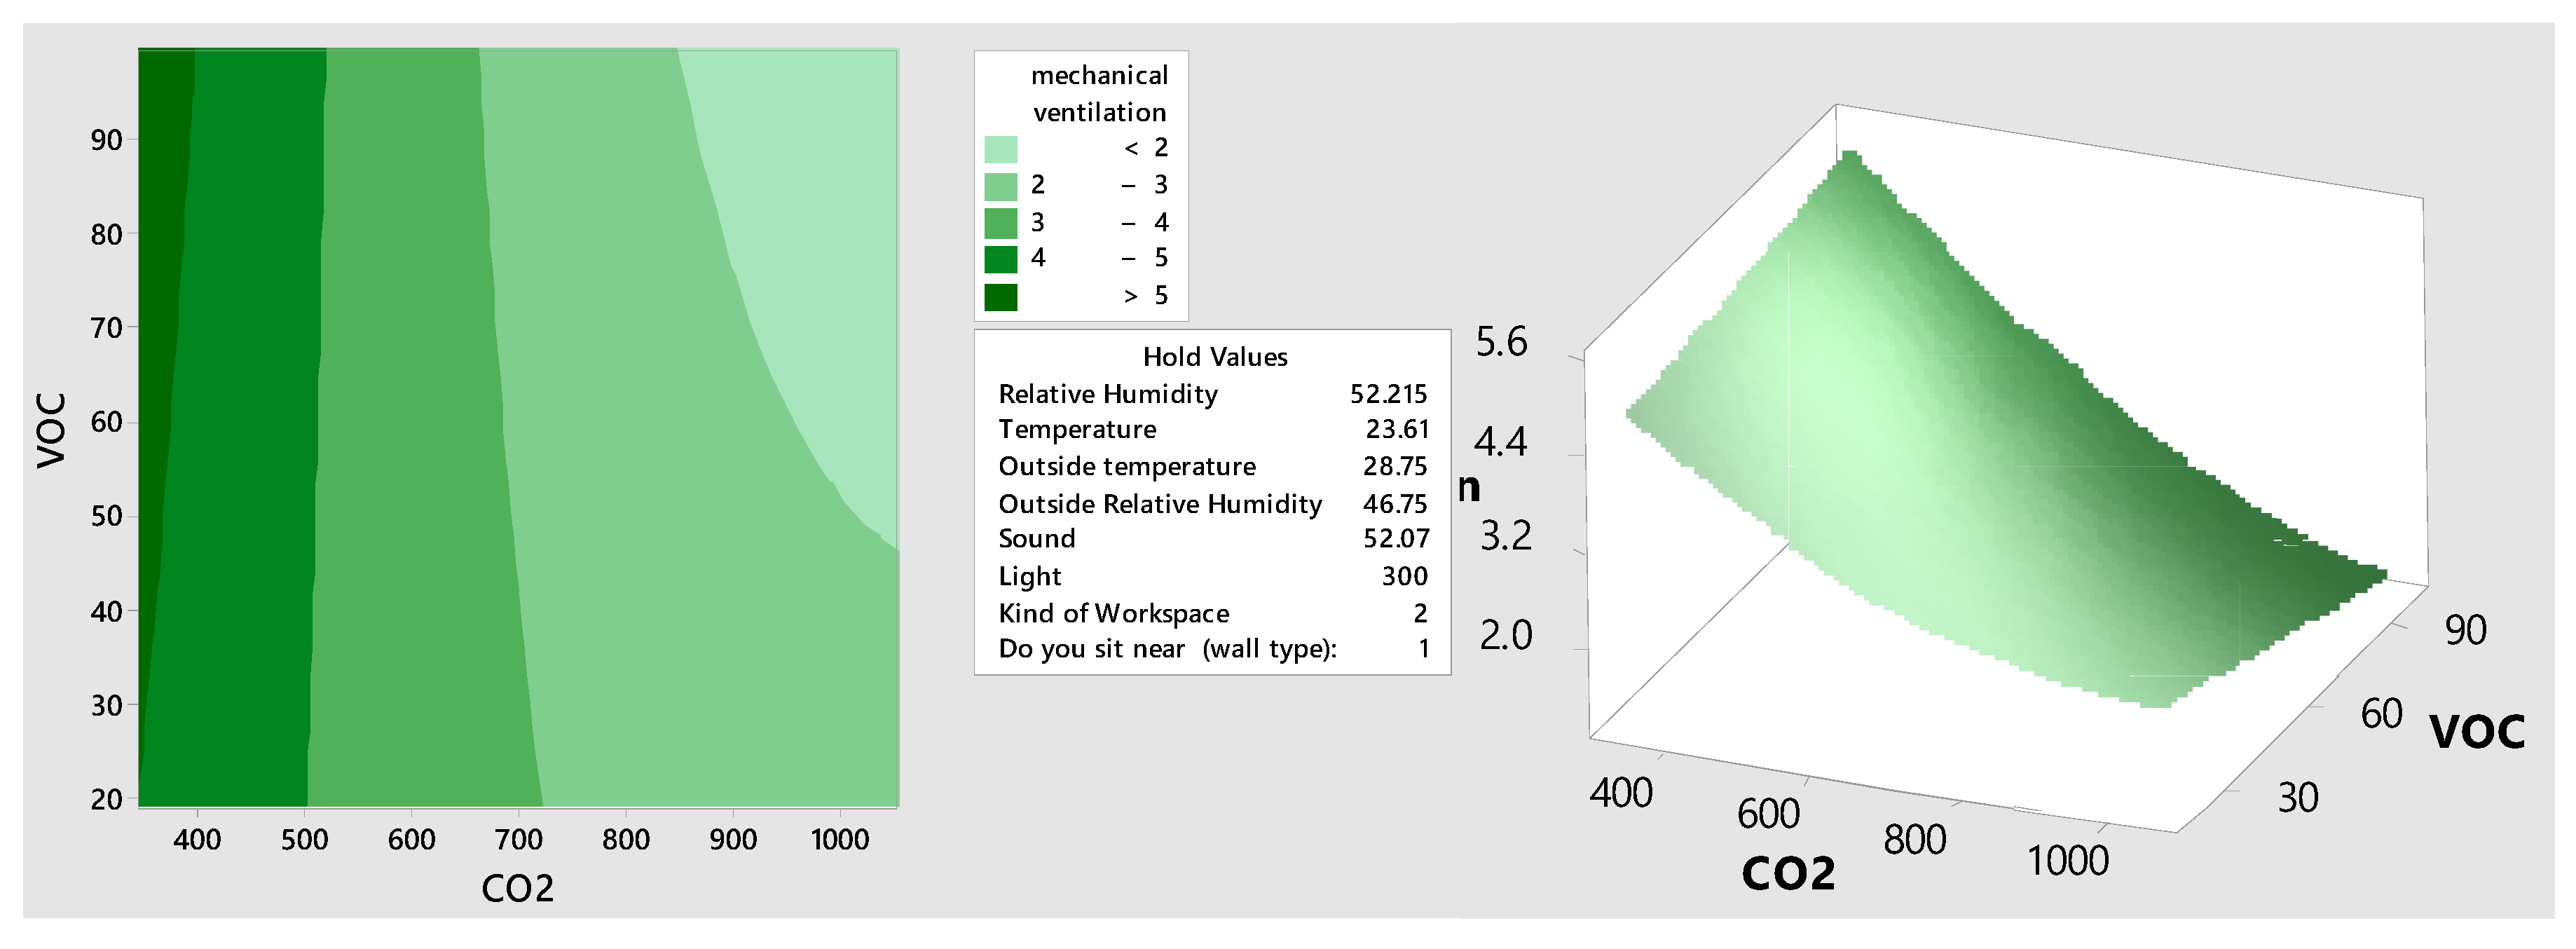
4.3.12. Effect of VOC and Carbon Dioxide on Indoor Air Comfort and Productivity

This relationship (shown in Figure 14) presents the interactions between VOC, carbon dioxide, indoor air comfort and productivity. Carbon dioxide significantly impacts indoor air quality compared to VOC. The optimum level of carbon dioxide is 500 ppm. Between VOC and carbon dioxide, VOC has a less significant effect on indoor air quality.

5. Discussion

This experiment aimed to identify the effect of various physical environment qualities on occupant air comfort and productivity. Response surface analysis produced unique interactions between independent and dependent variables. Twelve relationships were analysed to understand the effect of indoor environmental factors on occupant comfort and productivity, as shown in Table 5. Based on the critical relationships discussed above, six IEQ parameters were found to impact occupant air comfort and productivity substantially. The following section discusses the critical findings of the seven parameters and their roles in building design and operations.

5.1. Carbon Dioxide

Carbon dioxide has the greatest effect on the occupant’s air comfort and productivity. Amongst seven relationships, it showed a more substantial impact than any other indoor environmental quality parameters. The comfortable range presented in different relationships ranged up to 800 ppm. However, most of them indicated an optimum range of around 600 ppm. These levels are below the current suggested standards of keeping carbon dioxide levels below 1000 ppm [42]. Results indicate that those previously suggested levels do not cause any adverse effects on comfort. Nevertheless, they do not help in improving comfort and productivity.
The design implication of the carbon dioxide results means that design and operation professionals must incorporate their strategies. Design strategies include both passive and active methods. Passive design strategies improve natural airflow in a building by using the orientation, placement and sizes of the windows and openings; active design strategies include increasing the air change in the Heating, Ventilation and Air Conditioning system (HVAC).

5.2. Relative Humidity

Relative humidity ranks second in effect on occupant air comfort and productivity. It has less influence than carbon dioxide but more than Volatile Organic Compounds. Relative humidity results show that it should be less than 60%. This result aligns with the current recommendations [84,85]. Relative humidity can be maintained by managing the airflow of the indoor environment. In a mechanical ventilation system, this can be done by adjusting the air changes in the HVAC system. In a hybrid or natural ventilation system, relative humidity can be managed by managing the airflow using the orientation and sizes of the window and air inlets in the building.

5.3. Volatile Organic Compound

VOC stands third in effect on occupant air comfort and productivity. It has less influence than carbon dioxide and relative humidity but more than temperature. VOC presence in the air adversely affects occupant air comfort and productivity. Results indicate that 25% or more VOC in the air (by volume) harms occupant air comfort and productivity. VOC is majorly found in indoor environments with new furniture and paint [59,86]. To avoid indoor air pollution, design and construction professionals must ensure that paint and varnishes used on furniture and wall surfaces do not contribute to the VOC levels.

5.4. Outside Relative Humidity & Outside Temperature

Both outside relative humidity and temperature have an adverse effect on indoor air comfort and productivity. Our results reveal that when outside temperature is above 35 °C and outside relative humidity is below 60%, occupant air comfort and productivity is negatively impacted. The experiment was conducted in a hot and dry climate, and the weather during the day presented high temperatures with low humidity. The average temperature is 27 °C with a monthly temperature variation of 17.7 °C and a diurnal variation of 11°C. This has a negative influence on indoor air comfort and productivity. Though outdoor climate cannot be controlled at the city level, the microclimate around the site can be managed by using bodies of water and landscaping (low and high trees) in conjunction with the building’s orientation, opening and roof design.

5.5. Temperature

Results show that indoor temperature has an indirect influence on indoor air comfort. In relationship four, it showed a weak or indirect impact on air comfort against VOC and no significant impact against carbon dioxide. These findings partially sit with the literature suggesting a strong link between indoor temperature and indoor air comfort and productivity [11,87,88]. The impact of the temperature is compared against prime air quality parameters, thus results confirm that carbon dioxide and VOC significantly affect occupant air comfort and productivity [73,89]. The HVAC system can directly control the temperature in mechanically ventilated buildings. However, in mixed-mode or natural ventilation, passive design techniques such as orientation, the location of openings and bodies of water that manage airflow can help to manage the temperature of the building.

5.6. Illumination

Results also indicate that illumination has lower illumination levels that have a negative impact on indoor air comfort and productivity. The comfortable range presented in the result is between 250 and 450 lx. Sensor and appropriate light fixtures can manage both lux level and light temperature.
The seven indoor environmental quality parameters that influence occupant air comfort and productivity are seen above. The aforementioned discussion also provided potential design solutions to maintain their recommended levels.

6. Conclusions

This study investigated the influence of the indoor environment on occupant indoor air comfort and productivity. The study used response surface analysis to exhibit the relationship between indoor environmental factors and occupant air comfort and productivity. The analysis also produced twelve relationships that presented the interaction between the two indoor environmental parameters and their effect on occupant air comfort and productivity. The data collection and the analysis provided the quantitative basis to show the impact of IEQ factors on occupant air quality and productivity in office buildings. Our research shows that carbon dioxide has the maximum influence on occupant air comfort, with a recommended range of up to 600 ppm to achieve a positive influence on productivity. Other parameters with direct effect were relative humidity (up to 60%), VOC (up to 25%) and outside relative humidity and temperature; temperature and illumination have an indirect effect on air comfort. In addition, these relationships highlighted some new insights, e.g., the direct effect of the outside temperature and the indirect impact of light on occupant air comfort and productivity. The research findings would help industry design professionals design a better indoor environment for office occupants. Research literature has revealed that better indoor environmental quality in an office building positively impacts occupants’ psychological and physical health and thus reduces absenteeism and consequently increases productivity [90,91].
The research findings can be used to update the design guidelines and recommendations in respective design criteria for office buildings. Construction and asset management professionals can also benefit from this research. They can use these findings to ensure that office buildings’ as-built performance matches the study’s recommended range of indoor environmental parameters. Building Management Systems can be configured according to the study results, ensuring that recommended environmental levels are implemented. These aspects have assumed particular importance in the current climate due to COVID-19.
This research can provide insights for future areas of study. One area mentioned above determined the levels of IEQ parameters required to counter the COVID-19 virus circulation concerns [14,92]. Another area is to develop an Artificial Intelligence controlled building management system that would collect data on environmental parameters influencing occupant comfort and productivity and manage the environment according to the recommended range of these parameters. This research was conducted in a country with a hot and humid climate; therefore, the results can be easily applied to regions with similar climatic conditions. Based on this research, future studies can use new areas as prototypes to conduct similar research in different climate zones and building types, such as housing (single-family and multi-family), mixed-use, education, health care and retail. The authors envision that the work done in this research would help add substantial knowledge on the indoor environment and occupant air comfort and productivity.

Supplementary Materials

The following supporting information can be downloaded at: https://www.mdpi.com/article/10.3390/su142315719/s1.

Author Contributions

Conceptualization—A.K.K. and M.A.; Methodology—M.A. and M.M.G.S.; Software, A.K.K. and M.Q.R.; Literature—A.K.K. and A.A.S.; Result check—O.T.O. and A.S.A.; Data curation—A.K.K. and M.M.G.S.; writing—original draft preparation—A.K.K.; Writing—Review and Editing, A.K.K., M.A., M.M.G.S. and O.T.O.; Supervision, M.A., M.M.G.S.; Manuscript Administration—A.A.S. and A.S.A. All authors have read and agreed to the published version of the manuscript.

Funding

This research received no external funding.

Institutional Review Board Statement

The study was conducted in accordance with the Declaration of Helsinki, and approved by the Ethics Committee of University of Salford (2017).

Informed Consent Statement

Informed consent was obtained from all subjects involved in the study.

Data Availability Statement

Some or all data, models, or codes that support the findings of this study are available from the corresponding author upon reasonable request.

Conflicts of Interest

The authors declare no conflict of interest.

Appendix A

Figure A1. Office layout with sensor locations.
Sustainability 14 15719 g0a1

References

  1. Vernon, H.M.; Bedford, T. A Physiological Study of the Ventilation and Heating in Certain Factories. In Medical Research Council Industrial Fatigue Research Board Report; H.M.S.O.: London, UK, 1926. [Google Scholar]
  2. Vernon, H.M.; Bedford, T. A Study of Heating and Ventilation in Schools. In Medical Research Council Industrial Fatigue Research Board Report; H.M.S.O.: London, UK, 1930. [Google Scholar]
  3. World Green Building Council. Health, Wellbeing & Productivity in Offices; World Green Building Council: London, UK, 2014. [Google Scholar]
  4. Oseland, N. Environmental Factors Affecting Office Worker Performance: A Review of Evidence; CIBSE: London, UK, 1999; Volume TM24. [Google Scholar]
  5. Haynes, B.P. Office productivity: A theoretical framework. J. Corp. Real Estate 2007, 9, 97–110. [Google Scholar] [CrossRef]
  6. Feige, A.; Wallbaum, H.; Janser, M.; Windlinger, L. Impact of sustainable office buildings on occupant’s comfort and productivity. J. Corp. Real Estate 2013, 15, 7–34. [Google Scholar] [CrossRef]
  7. Fisk, W.J. Estimates of potential nationwide productivity and health benefits from better indoor environments: An update. Indoor Air Qual. Handb. 2000, 1–38. [Google Scholar]
  8. Kosonen, R.; Tan, F. The effect of perceived indoor air quality on productivity loss. Energy Build. 2004, 36, 981–986. [Google Scholar] [CrossRef]
  9. Singh, A.; Syal, M.; Korkmaz, S.; Grady, S. Costs and benefits of IEQ improvements in LEED office buildings. J. Infrastruct. Syst. 2011, 17, 86–94. [Google Scholar] [CrossRef]
  10. Wolkoff, P. Indoor air humidity, air quality, and health—An overview. Int. J. Hyg. Environ. Health 2018, 221, 376–390. [Google Scholar] [CrossRef]
  11. Seppänen, O.; Fisk, W.; Mendell, M. Association of ventilation rates and CO2 concentrations with health and other responses in commercial and institutional buildings. Indoor Air 1999, 9, 226–252. [Google Scholar] [CrossRef] [Green Version]
  12. Heinrich, J. Influence of indoor factors in dwellings on the development of childhood asthma. Int. J. Hyg. Environ. Health 2011, 214, 1–25. [Google Scholar] [CrossRef]
  13. Agarwal, Y.; Balaji, B.; Gupta, R.; Lyles, J.; Wei, M.; Weng, T. Occupancy-driven energy management for smart building automation. In Proceedings of the 2nd ACM Workshop on Embedded Sensing Systems for Energy-Efficiency in Building, Zurich, Switzerland, 2 November 2010; ACM: New York, NY, USA, 2010. [Google Scholar]
  14. Aviv, D.; Chen, K.W.; Teitelbaum, E.; Sheppard, D.; Pantelic, J.; Rysanek, A.; Meggers, F. A fresh (air) look at ventilation for COVID-19: Estimating the global energy savings potential of coupling natural ventilation with novel radiant cooling strategies. Appl. Energy 2021, 292, 116848. [Google Scholar] [CrossRef]
  15. Ravindra, K.; Singh, T.; Vardhan, S.; Shrivastava, A.; Singh, S.; Kumar, P.; Mor, S. COVID-19 pandemic: What can we learn for better air quality and human health? J. Infect. Public Health 2022, 15, 187–198. [Google Scholar] [CrossRef]
  16. Navaratnam, S.; Nguyen, K.; Selvaranjan, K.; Zhang, G.; Mendis, P.; Aye, L. Designing post COVID-19 buildings: Approaches for achieving healthy buildings. Buildings 2022, 12, 74. [Google Scholar] [CrossRef]
  17. Fanger, P. Indoor air quality in the 21st century: Search for excellence. Indoor Air 2000, 10, 68–73. [Google Scholar] [CrossRef] [PubMed]
  18. Langer, S.; Bekö, G. Indoor air quality in the Swedish housing stock and its dependence on building characteristics. Build. Environ. 2013, 69, 44–54. [Google Scholar] [CrossRef] [Green Version]
  19. Fernández-Agüera, J.; Domínguez-Amarillo, S.; Campano, M.Á.; Al-Khatri, H. Effects of covid-induced lockdown on inhabitants’ perception of indoor air quality in naturally ventilated homes. Air Qual. Atmos. Health 2022, 1–20. [Google Scholar] [CrossRef]
  20. Wu, J.; Weng, J.; Xia, B.; Zhao, Y.; Song, Q. The Synergistic Effect of PM2. 5 and CO2 Concentrations on Occupant Satisfaction and Work Productivity in a Meeting Room. Int. J. Environ. Res. Public Health 2021, 18, 4109. [Google Scholar] [CrossRef]
  21. Bluyssen, P.M.; Aries, M.; van Dommelen, P. Comfort of workers in office buildings: The European HOPE project. Build. Environ. 2011, 46, 280–288. [Google Scholar] [CrossRef]
  22. Bluyssen, P.M. Sensory evaluation of indoor air pollution sources. In Air Pollution; Springer: Berlin/Heidelberg, Germany, 2004; pp. 179–217. [Google Scholar]
  23. Mannan, M.; Al-Ghamdi, S.G. Investigating environmental life cycle impacts of active living wall for improved indoor air quality. Build. Environ. 2022, 208, 108595. [Google Scholar] [CrossRef]
  24. Collinge, W.; Landis, A.E.; Jones, A.K.; Schaefer, L.A.; Bilec, M.M. Indoor environmental quality in a dynamic life cycle assessment framework for whole buildings: Focus on human health chemical impacts. Build. Environ. 2013, 62, 182–190. [Google Scholar] [CrossRef]
  25. Jones, A.P. Indoor air quality and health. Atmos. Environ. 1999, 33, 4535–4564. [Google Scholar] [CrossRef]
  26. Silva, M.F.; Maas, S.; de Souza, H.A.; Gomes, A.P. Post-occupancy evaluation of residential buildings in Luxembourg with centralized and decentralized ventilation systems, focusing on indoor air quality (IAQ). Assessment by questionnaires and physical measurements. Energy Build. 2017, 148, 119–127. [Google Scholar] [CrossRef]
  27. Arikan, I.; Tekin, Ö.F.; Erbas, O. Relationship between sick buildıng syndrome and indoor air quality among hospital staff. La Med. Del Lav. 2018, 109, 435. [Google Scholar]
  28. Hodgson, M. Sick building syndrome. Occup. Med. 2000, 15, 571. [Google Scholar]
  29. Cheung, T.; Schiavon, S.; Graham, L.T.; Tham, K.W. Occupant satisfaction with the indoor environment in seven commercial buildings in Singapore. Build. Environ. 2021, 188, 107443. [Google Scholar] [CrossRef]
  30. Melikov, A.; Pitchurov, G.; Naydenov, K.; Langkilde, G. Field study on occupant comfort and the office thermal environment in rooms with displacement ventilation. Indoor Air 2005, 15, 205–214. [Google Scholar] [CrossRef] [PubMed]
  31. Szczurek, A.; Maciejewska, M.; Teuerle, M.; Wyłomańska, A. Method to characterize collective impact of factors on indoor air. Phys. A Stat. Mech. Its Appl. 2015, 420, 190–199. [Google Scholar] [CrossRef]
  32. Brager, G.; Baker, L. Occupant satisfaction in mixed-mode buildings. Build. Res. Inf. 2009, 37, 369–380. [Google Scholar] [CrossRef] [Green Version]
  33. Graham, L.T.; Parkinson, T.; Schiavon, S. Lessons learned from 20 years of CBE’s occupant surveys. Build. Cities 2021, 2, 166–184. [Google Scholar] [CrossRef]
  34. Bortolini, R.; Forcada, N. Association between building characteristics and indoor environmental quality through post-occupancy evaluation. Energies 2021, 14, 1659. [Google Scholar] [CrossRef]
  35. Lan, L.; Wargocki, P.; Lian, Z. Quantitative measurement of productivity loss due to thermal discomfort. Energy Build. 2011, 43, 1057–1062. [Google Scholar] [CrossRef]
  36. Zhao, Q.; Lian, Z.; Lai, D. Thermal comfort models and their developments: A review. Energy Built Environ. 2021, 2, 21–33. [Google Scholar] [CrossRef]
  37. Lestinen, S.; Kilpeläinen, S.; Kosonen, R.; Valkonen, M.; Jokisalo, J.; Pasanen, P. Effects of Night Ventilation on Indoor Air Quality in Educational Buildings—A Field Study. Appl. Sci. 2021, 11, 4056. [Google Scholar] [CrossRef]
  38. Wargocki, P. The ffects of outdoor air supply in an office on perceived air quality, sick building syndrome (SBS) symptoms and producivity. Indoor Air 2000, 10, 222–236. [Google Scholar] [CrossRef]
  39. Ezzeldin, S.; Rees, S.J. The potential for office buildings with mixed-mode ventilation and low energy cooling systems in arid climates. Energy Build. 2013, 65, 368–381. [Google Scholar] [CrossRef]
  40. Gupta, R.; Howard, A.; Zahiri, S. Investigating the relationship between indoor environment and workplace productivity in naturally and mechanically ventilated office environments. Build. Serv. Eng. Res. Technol. 2020, 41, 280–304. [Google Scholar] [CrossRef]
  41. Nurick, S.; Thatcher, A. The Relationship of Green Office Buildings to Occupant Productivity and Organizational Performance: A Literature Review. J. Real Estate Lit. 2021, 29, 18–42. [Google Scholar] [CrossRef]
  42. Satish, U.; Mendell, M.J.; Shekhar, K.; Hotchi, T.; Sullivan, D.; Streufert, S.; Fisk, W.J. Is CO2 an indoor pollutant? Direct effects of low-to-moderate CO2 concentrations on human decision-making performance. Environ. Health Perspect. 2012, 120, 1671. [Google Scholar] [CrossRef] [PubMed] [Green Version]
  43. Deng, Y.; Feng, Z.; Fang, J.; Cao, S.J. Impact of ventilation rates on indoor thermal comfort and energy efficiency of ground-source heat pump system. Sustain. Cities Soc. 2018, 37, 154–163. [Google Scholar] [CrossRef]
  44. Gou, Z.; Prasad, D.; Lau, S.S.Y. Impacts of green certifications, ventilation and office types on occupant satisfaction with indoor environmental quality. Archit. Sci. Rev. 2014, 57, 196–206. [Google Scholar] [CrossRef]
  45. Kim, J.; de Dear, R. Impact of different building ventilation modes on occupant expectations of the main IEQ factors. Build. Environ. 2012, 57, 184–193. [Google Scholar] [CrossRef] [Green Version]
  46. Chen, X.; Zhang, Q.; Zhai, Z.J.; Ma, X. Potential of ventilation systems with thermal energy storage using PCMs applied to air conditioned buildings. Renew. Energy 2019, 138, 39–53. [Google Scholar] [CrossRef]
  47. Lai, D.; Qi, Y.; Liu, J.; Dai, X.; Zhao, L.; Wei, S. Ventilation behavior in residential buildings with mechanical ventilation systems across different climate zones in China. Build. Environ. 2018, 143, 679–690. [Google Scholar] [CrossRef] [Green Version]
  48. Panagiotaras, D.; Nikolopoulos, D.; Koulougliotis, D.; Petraki, E.; Zisos, I.; Yiannopoulos, A.; Bakalis, A.; Zisos, A. Indoor Air Quality Assessment: Review on the Topic of VOCs; eRA—Proceedings: Athens, Greece, 2013. [Google Scholar]
  49. Wolkoff, P. Indoor air pollutants in office environments: Assessment of comfort, health, and performance. Int. J. Hyg. Environ. Health 2013, 216, 371–394. [Google Scholar] [CrossRef] [PubMed]
  50. Kotzias, D. Built environment and indoor air quality: The case of volatile organic compounds. AIMS Environ. Sci. 2021, 8, 135–147. [Google Scholar] [CrossRef]
  51. Burley, B.J. An Update on ANSI/ASHRAE Standard 62.1. ASHRAE J. 2022, 64, 28–30. [Google Scholar]
  52. ASHRAE. ASHRAE 62.1-2022. In Ventilation and Acceptable Indoor Air Quality; ASHRAE: Peachtree Corners, GA, USA, 2022; p. 86. [Google Scholar]
  53. WHO. Air Quality Guidelines: Global Update 2005: Particulate Matter, Ozone, Nitrogen Dioxide, and Sulfur Dioxide; World Health Organization: Geneva, Switzerland, 2006.
  54. Teichman, K.Y.; Persily, A.K.; Emmerich, S.J. Indoor air quality in high-performing building case studies: Got data? Sci. Technol. Built Environ. 2015, 21, 91–98. [Google Scholar] [CrossRef]
  55. Holøs, S.B.; Yang, A.; Lind, M.; Thunshelle, K.; Schild, P.; Mysen, M. VOC emission rates in newly built and renovated buildings, and the influence of ventilation—A review and meta-analysis. Int. J. Vent. 2019, 18, 153–166. [Google Scholar] [CrossRef]
  56. Fanger, P.O. Introduction of the olf and the decipol units to quantify air pollution perceived by humans indoors and outdoors. Energy Build. 1988, 12, 1–6. [Google Scholar] [CrossRef]
  57. Roelofsen, P. A new methodology for the evaluation of the perceived air quality depending on the air pollution, caused by human bioeffluents, the temperature, the humidity as well as the air velocity. Intell. Build. Int. 2018, 10, 154–161. [Google Scholar] [CrossRef] [Green Version]
  58. Bacaloni, A.; Insogna, S.; Zoccolillo, L. Indoor Air Quality. Volatile Organic Compounds: Sources, Sampling and Analysis. In Chemistry, Emission Control, Radioactive Pollution and Indoor Air Quality; IntechOpen: London, UK, 2011. [Google Scholar]
  59. Zhang, R.; Tan, Y.; Wang, Y.; Wang, H.; Zhang, M.; Liu, J.; Xiong, J. Predicting the concentrations of VOCs in a controlled chamber and an occupied classroom via a deep learning approach. Build. Environ. 2022, 207, 108525. [Google Scholar] [CrossRef]
  60. Saengphet, T.; Yimprayoon, C. A Comparative Study of TVOC and HCHO Emissions From Various Multilayer Built-in Furniture Components Based on ISO 16000-9:2006 Emission Test Chamber Methods. Nakhara J. Environ. Des. Plan. 2022, 21, 205. [Google Scholar] [CrossRef]
  61. Bluyssen, P.M. The need for understanding the indoor environmental factors and its effects on occupants through an integrated analysis. In IOP Conference Series: Materials Science and Engineering; IOP Publishing: Bristol, UK, 2019. [Google Scholar]
  62. Cheung, P.K.; Jim, C.Y. Indoor air quality in substandard housing in Hong Kong. Sustain. Cities Soc. 2019, 48, 101583. [Google Scholar] [CrossRef]
  63. Du, B.; Tandoc, M.C.; Mack, M.L.; Siegel, J.A. Indoor CO2 concentrations and cognitive function: A critical review. Indoor Air 2020, 30, 1067–1082. [Google Scholar] [CrossRef] [PubMed]
  64. Frontczak, M.; Schiavon, S.; Goins, J.; Arens, E.; Zhang, H.; Wargocki, P. Quantitative relationships between occupant satisfaction and satisfaction aspects of indoor environmental quality and building design. Indoor Air 2012, 22, 119–131. [Google Scholar] [CrossRef] [PubMed] [Green Version]
  65. Melikov, A.K.; Dzhartov, V. Advanced air distribution for minimizing airborne cross-infection in aircraft cabins. Hvac&R Res. 2013, 19, 926–933. [Google Scholar]
  66. Emmerich, S.J.; Persily, A.K. Literature review on CO2-based demand-controlled ventilation. Trans. Am. Soc. Heat. Refrig. Air Cond. Eng. 1997, 103, 229–243. [Google Scholar]
  67. Hirning, M.B.; Isoardi, G.L.; Coyne, S.; Hansen, V.G.; Cowling, I. Post occupancy evaluations relating to discomfort glare: A study of green buildings in Brisbane. Build. Environ. 2013, 59, 349–357. [Google Scholar] [CrossRef]
  68. Lolli, F.; Marinello, S.; Coruzzolo, A.M.; Butturi, M.A. Post-Occupancy Evaluation’s (POE) Applications for Improving Indoor Environment Quality (IEQ). Toxics 2022, 10, 626. [Google Scholar] [CrossRef] [PubMed]
  69. Göçer, Ö.; Hua, Y.; Göçer, K. Completing the missing link in building design process: Enhancing post-occupancy evaluation method for effective feedback for building performance. Build. Environ. 2015, 89, 14–27. [Google Scholar] [CrossRef]
  70. Ryan, B.F.; Joiner, B.L.; Cryer, J.D. MINITAB Handbook: Update for Release; Cengage Learning: Boston, MA, USA, 2012. [Google Scholar]
  71. Allen, I.E.; Seaman, C.A. Likert scales and data analyses. Qual. Prog. 2007, 40, 64. [Google Scholar]
  72. Dorgan, C.B.; Dorgan, C.E.; Kanarek, M.S.; Willman, A.J. Health and productivity benefits of improved indoor air quality. ASHRAE Trans. 1998, 104, 658. [Google Scholar]
  73. Chao, C.Y.; Chan, G.Y. Quantification of indoor VOCs in twenty mechanically ventilated buildings in Hong Kong. Atmos. Environ. 2001, 35, 5895–5913. [Google Scholar] [CrossRef]
  74. Humphreys, M.A.; Nicol, J.F. Outdoor temperature and indoor thermal comfort: Raising the precision of the relationship for the 1998 ASHRAE database of field studies/Discussion. Ashrae Trans. 2000, 106, 485. [Google Scholar]
  75. Humphreys, M.A. Quantifying occupant comfort: Are combined indices of the indoor environment practicable? Build. Res. Inf. 2005, 33, 317–325. [Google Scholar] [CrossRef]
  76. Myers, R.H.; Montgomery, D.C.; Anderson-Cook, C.M. Response Surface Methodology: Process and Product Optimization Using Designed Experiments; John Wiley & Sons: Hoboken, NJ, USA, 2016. [Google Scholar]
  77. Pike, D.J. Empirical Model-Building and Response Surfaces; Wiley Online Library: Hoboken, NJ, USA, 1988. [Google Scholar]
  78. Box, G.E.; Draper, N.R. Empirical Model-Building and Response Surfaces; Wiley: New York, NY, USA, 1987; Volume 424. [Google Scholar]
  79. Hill, W.J.; Hunter, W.G. A review of response surface methodology: A literature survey. Technometrics 1966, 8, 571–590. [Google Scholar] [CrossRef]
  80. Ximénez, M.C.; San Martín, R. Application of response surface methodology to the study of person-organization fit. Psicothema 2000, 12, 151–158. [Google Scholar]
  81. Arends, R.; Castle, S. Learning to Teach; McGraw-Hill: New York, NY, USA, 1991; Volume 2. [Google Scholar]
  82. Tabachnick, B.G.; Fidell, L.S. Experimental Designs Using ANOVA; Thomson/Brooks/Cole: Belmont, CA, USA, 2007. [Google Scholar]
  83. Zhong, G.-Y.; Yang, P.; Liu, Y.-W. Heat transfer and pressure drop correlations by means of response surface methodology. Int. J. Heat Mass Transf. 2018, 119, 312–332. [Google Scholar] [CrossRef]
  84. Wolkoff, P.; Kjærgaard, S.K. The dichotomy of relative humidity on indoor air quality. Environ. Int. 2007, 33, 850–857. [Google Scholar] [CrossRef]
  85. Ismail, A.R.; Rani, M.R.A.; Makhbul, Z.K.M.; Deros, B.M. Relationship of relative humidity to productivity at a Malaysian electronics industry. J. Mech. Eng. 2008, 5, 63–72. [Google Scholar]
  86. Shin, S.-H.; Jo, W.-K. Longitudinal variations in indoor VOC concentrations after moving into new apartments and indoor source characterization. Environ. Sci. Pollut. Res. 2013, 20, 3696–3707. [Google Scholar] [CrossRef]
  87. Mendell, M.J.; Eliseeva, E.A.; Davies, M.M.; Spears, M.; Lobscheid, A.; Fisk, W.J.; Apte, M.G. Association of classroom ventilation with reduced illness absence: A prospective study in C alifornia elementary schools. Indoor Air 2013, 23, 515–528. [Google Scholar] [CrossRef] [Green Version]
  88. Hou, J.; Sun, Y.; Dai, X.; Liu, J.; Shen, X.; Tan, H.; Yin, H.; Huang, K.; Gao, Y.; Lai, D.; et al. Associations of indoor carbon dioxide concentrations, air temperature, and humidity with perceived air quality and sick building syndrome symptoms in Chinese homes. Indoor Air 2021, 31, 1018–1028. [Google Scholar] [CrossRef] [PubMed]
  89. Seppänen, O.A.; Fisk, W. Some quantitative relations between indoor environmental quality and work performance or health. Hvac&R Res. 2006, 12, 957–973. [Google Scholar]
  90. Singh, A.; Syal, M.; Grady, S.C.; Korkmaz, S. Effects of Green Buildings on Employee Health and Productivity. Am. J. Public Health 2010, 100, 1665. [Google Scholar] [CrossRef] [PubMed]
  91. Al Horr, Y.; Arif, M.; Kaushik, A.; Mazroei, A.; Katafygiotou, M.; Elsarrag, E. Occupant productivity and office indoor environment quality: A review of the literature. Build. Environ. 2016, 105, 369–389. [Google Scholar] [CrossRef] [Green Version]
  92. Ching, J.; Kajino, M. Rethinking air quality and climate change after COVID-19. Int. J. Environ. Res. Public Health 2020, 17, 5167. [Google Scholar] [CrossRef]
Figure 1. Comfort and Productivity.
Sustainability 14 15719 g001
Figure 2. Research Design.
Sustainability 14 15719 g002
Figure 3. Relationship between illumination, outside temperature and indoor air comfort.
Sustainability 14 15719 g003
Figure 4. Relationship between sound, outside temperature and indoor air comfort.
Sustainability 14 15719 g004
Figure 5. Relationship between outside relative humidity, outside temperature and indoor air comfort.
Sustainability 14 15719 g005
Figure 6. Relationship between temperature, VOC and indoor air comfort.
Sustainability 14 15719 g006
Figure 7. Relationship between relative humidity, VOC and indoor air comfort.
Sustainability 14 15719 g007
Figure 8. Relationship between relative humidity and VOC on indoor air comfort.
Sustainability 14 15719 g008
Figure 9. Relationship between sound and carbon dioxide on indoor air comfort and productivity.
Sustainability 14 15719 g009
Figure 10. Relationship between outside relative humidity and carbon dioxide on indoor air comfort.
Sustainability 14 15719 g010
Figure 11. Relationship between outside temperature and carbon dioxide on indoor air comfort.
Sustainability 14 15719 g011
Figure 12. Relationship between temperature and carbon dioxide on indoor air comfort.
Sustainability 14 15719 g012
Figure 13. Effect of relative humidity and carbon dioxide on indoor air comfort.
Sustainability 14 15719 g013
Figure 14. Effect of VOC and carbon dioxide on indoor air comfort.
Sustainability 14 15719 g014
Table 1. Summary of studies examining three strands of Indoor Air Quality.
No ReferenceFocus Area within IAQFindings
1[58]Components of indoor air–VOC This research provided VOC measurement protocols and data to reduce exposure to pollutant sources.
2[22]Components of indoor air–VOC Predicting IAQ in office buildings is possible through laboratory emission testing of products.
3[61]Impacts of IAQ on occupantsThe research focuses on preventing adverse effects of all IEQ on occupants, including an integrated analysis assessing IAQ.
4[21]Impacts of IAQ on occupants A study on the comfort of workers in office buildings showed that perceived comfort, including indoor air quality factors, is a phenomenon that deserves more research.
5[34]Components of indoor air This study emphasizes the importance of designing adaptable spaces as it reveals the association between building characteristics and IEQ, including IAQ.
6[32]Ventilation systemsThis paper revealed occupants’ preference for some hybrid ventilation systems over others, specifically those systems that allowed high degrees of direct user control.
7 [46]Ventilation systems This study examines the potential application of ventilation systems with thermal energy storage, revealing how this system saves electrical energy by 16.9–50.8%.
8[62]Impacts of IAQ on occupantsThis study reveals the adverse impacts of subdivided housing units on IAQ through increasing levels of CO2 and VOCs, which threatens the health of occupants, especially young children.
9[29]Impacts of IAQ on occupantsThe focus of this research was to better understand the impact of several IEQ factors (odours, air movement, available space, etc.) that are not substantial to the overall workspace contentment on their own, but their effects become significant when these factors are merged into broader environmental parameters (i.e., Perceived Air Quality, Acoustics, Layout and Thermal).
10[43]Ventilation systemsThis research focuses on the Ventilation rate aspect of the ground source heat pump system from the perspective of energy saving and indoor thermal comfort combined. It constructed different settings that considered various ventilation techniques and different cooling capacities.
11[63]Components of indoor air–CO2 levels A literature review that summarises results from 37 studies linking high levels of indoor CO2 with impaired cognitive function.
12[39]Ventilation systemsThis study uncovers how the application of hybrid or mixed-mode ventilation systems in harsh, dry climates has the potential to provide suitable indoor environments through highly effective office building design.
13[56]Components of indoor airA critical paper that introduced the Olf and the decipol, the units that provide a rational basis for calculating ventilation requirements and for predicting and measuring air quality indoors and outdoors.
14[64]Impacts of IAQ on occupantsThis study examined indoor environmental parameters, including IAQ and building features that primarily affect occupants’ satisfaction in US office buildings. Satisfaction with the amount of space was ranked the most important for workspace satisfaction.
15[44]Ventilation systemsThis study focused on the effects of green certifications, ventilation types and office types on occupant satisfaction, revealing that hybrid ventilation systems achieve high environmental satisfaction.
16[33]Impacts of IAQ on occupantsThis study presents a post-occupancy evaluation of office spaces over twenty years, revealing that levels of satisfaction were mainly related to spaces of interaction, followed by the amount of light and cleanliness; dissatisfaction was related to sound privacy, followed by temperature and noise level.
17 [40]Impacts of IAQ on occupantsThis case study compared the effects of naturally ventilated (NV) office environments to mechanically ventilated (MV) offices and revealed that occupants in NV buildings adapted to a vast range of environmental conditions. In contrast, those in MV offices were less tolerant of small changes in their environmental conditions.
18[28]Impacts of IAQ on occupantsA significant study summarises human symptoms and discomfort in the built environment, formulating the Sick Building Syndrome.
19[55]Ventilation systemsThis study reveals that although ventilation rates are a significant aspect of controlling airborne concentrations, it does not visibly influence levels of total volatile organic compounds (TVOC).
20[25]Impacts of IAQ on occupantsA significant study that delved into understanding the relationship between indoor air pollution and health in the late 1990s, which also considered the Sick Building Syndrome (SBS).
21[45]Ventilation systemsThis study investigated the relationship between different ventilation systems and occupants’ satisfaction in an office environment. It revealed that in Naturally Ventilated (NV) buildings, good thermal conditions were associated with increased overall satisfaction, but there was little noticeable unfavourable impact when thermal performance was poor. In air-conditioned buildings, thermal conditions were linked with negative evaluations of the workspace. Finally, thermal conditions in hybrid ventilated buildings showed positive and negative impacts of similar amounts on overall satisfaction.
22[8]Impacts of IAQ on occupantsThis paper’s focus was the impact of indoor air quality on productivity loss in air-conditioned office buildings.
23[50]Components of indoor air—VOCThe focus of this research is to provide a summary of indoor/outdoor air levels of VOCs in buildings. It discusses the methods and techniques that have been applied so far to assess VOCs indoors and outdoors.
24[47]Ventilation systemsThis study examined the use of natural and mechanical ventilation in 46 apartments. Occupants prioritised their thermal comfort needs over healthy indoor air quality (IAQ).
25[35]Impacts of IAQ on occupantsThis study investigated the effects of thermal discomfort in a workspace on perceived air quality, revealing that when occupants felt warm, they tended to assess the air quality as worse, hence their task performance decreased.
26[18]Components of indoor air–VOCThis study investigated the IAQ in Swedish housing stock, disclosing that even though ventilation appeared to be a source of NO2, increased ventilation rate seemed to reduce the indoor intensities of formaldehyde and total volatile organic compounds.
27[37]Ventilation systemsThis study tested the effects of night ventilation on indoor air quality, showing that the night ventilation strategy had insignificant effects on microbial concentrations. At the same time, the VOC levels reached a minimum level after 2 h of ventilation.
28[65]Impacts of IAQ on occupantsThis study focused on the impact of air movement on perceived air quality and Sick Building syndrome, demonstrating that the energy-saving strategy of enhancing occupant comfort by moving room air at a high velocity and maintaining a high room temperature at a decreased supply of outdoor air or by a reduction of indoor air enthalpy must be vigilantly employed in buildings as the pollution level can still cause adverse health effects.
29[41]Impacts of IAQ on occupantsThe objective of this paper was to identify and critically evaluate research that links indoor environmental quality and individual productivity to develop a theoretical model that links green building features and initiatives in office buildings to individual productivity and organizational performance.
30[17]Impacts of IAQ on occupantsThis study suggested five revolutionary principles for a philosophy of excellence for the 21st century: (1) improved indoor air quality enhances productivity and reduces SBS symptoms; (2) redundant indoor pollution causes should be evaded; (3) the air should be cool and dry for occupants; (4) a slight volume of clean air should be served close to the breathing zone of each occupant; (5) occupants should be given control of the indoor thermal environment.
31[48]Components of indoor air–VOCThe focus of this paper was to report on the most common procedures used in determining VOC levels.
32[66]Components of indoor air—CO2 levelsThis paper describes the use of Carbon Dioxide in evaluating building IAQ and Ventilation in addition to factors that must be considered, such as ventilation system configuration and occupancy patterns.
33[57]Components of indoor airThis study employed a methodology for evaluating perceived air quality depending on air temperature, air humidity and air pollution caused by humans alongside an added extra parameter: air velocity.
34[42]Components of indoor air—CO2 levelsThis research studied the relations of higher indoor carbon dioxide levels with impaired work performance, concluding that there are direct adverse effects of CO2 on human performance that could reduce energy-saving declines in outdoor air ventilation per person in buildings.
35[11,15]Components of indoor air—CO2 levelsThese papers reviewed the relationship between ventilation rates and CO2 concentrations in office buildings with occupant health and risk of Sick Building Syndrome.
36[26]Ventilation systemsThis study conducted a post-occupancy evaluation of residential buildings with two types of ventilation systems, centralized and decentralized; malfunctions were detected in some of the mechanical ventilation systems in the study.
37[31]Components of indoor airThis paper discusses factors influencing IAQ, retarding, stabilizing and promoting and presents how those factors influence the temperature, relative humidity and CO2 concentration.
38[54]Components of indoor airThis study focuses on what indoor air quality information should be gathered through the early stages of buildings to determine their indoor air quality performance.
39[38]Components of indoor airThis research investigated the perceived air quality, Sick Building Syndrome (SBS) symptoms and productivity in office buildings and demonstrated that ventilation rates should be above the minimum levels prescribed in standards and guidelines in the early 2000s.
40[10,49]Components of indoor air—VOCBased on an analysis of indoor air pollutants in office environments, it is recommended in this study to measure selected compounds for odour and sensory irritation to assess indoor air quality and minimize irritation symptoms, deteriorated performance and cardiovascular and pulmonary effects.
41[37]Components of indoor airThis study analysed the human response to the indoor climate with two individually controlled convective and radiant cooling systems, emphasizing the need for personalized control to ensure that all occupants are content with indoor conditions.
Table 2. Indoor Air Quality—Independent variables (parameters) and Instrument.
Indoor Air Quality
Measurable ParametersInstrumentOccupant Survey
Indoor pollutant level (Volatile Organic Compound)SensorOccupants’ response to the indoor air quality
Carbon DioxideSensor
Table 3. Survey Questions. Question: How have these factors affected your productivity?
Indoor Environment FactorVery NegativelyNegativelyNeutralPositivelyVery Positively
AThermal comfort
BMechanical ventilation
DIllumination levels
EDaylight
FGlare control
GViews
HAcoustic quality
KOffice Layout
LCloseness to nature
Table 4. IEQ Parameters Measurement.
IEQ FactorParameterMeasured byInput
Variable
Response/Performance Variable
Thermal ComfortTemperature (°C)Zigbee T-3524C x 1 y
(Calculated from the survey responses)
Relative humidity (%) x 2
Outside temperature (°C)Vantage Pro x 3
Outside RH (%) x 4
Indoor Air QualityCarbon Dioxide (P.P.M.)Zigbee T-3571 x 5
Volatile Organic Compound (V.O.C. free air %) Zigbee T-3576 x 6
IlluminationLux level (lx) x 7
NoiseSound level (dB)Zigbee T-3551 x 8
Office LayoutSeating arrangement (room layout and access to window)Researcher
(Office plan)
x 9
Table 5. Interdependencies of Independent Variables.
S. No.Independent Variable 1Effect & RangeIndependent Variable 2Effect & RangeInference
1Illumination250–450 luxOutside TemperatureHigher temperature leads to a negative impact
Range: Below 35 °C
Both illumination and outside temperature influence indoor air comfort
2SoundMinimum or no effectOutside TemperatureHigher temperature leads to a negative impact
Range: Below 35 °C
Outside temperature influences indoor air comfort and productivity
3Outside Relative HumidityHigher outside humidity has a negative impact on indoor air comfort and productivityOutside TemperatureHigher temperature leads to a negative impact
Range: Below 35 °C
Both outside temperature and relative humidity have a negative effect
4TemperatureA weak or indirect effectVolatile Organic CompoundHigher VOC-free air results in better indoor air comfort and productivity
Range: 70% & above
VOC presence reduces indoor air quality and productivity
5Relative HumidityRelative humidity has a higher impact than VOC Higher levels of relative humidity contribute to indoor air discomfort and are detrimental to productivity
Range: up to 55 dB
Volatile Organic CompoundWeak impact—Lower VOC has a positive effect on indoor air quality.VOC has less influence compared to relative humidity; however, it affects the impact of relative humidity on indoor air quality
6Illumination250–450 luxCarbon Dioxide600 ppm or belowBoth illumination and carbon dioxide affect indoor air quality
7SoundNo significant impactCarbon Dioxide600 ppmCarbon Dioxide has a strong impact
8Outside Relative HumidityNo significant impactCarbon Dioxide650 ppm or belowCarbon Dioxide has a strong impact
9Outside TemperaturePositive impact up to 35°cCarbon Dioxide800 ppm or belowBoth outside temperature and carbon dioxide affect indoor air quality
10TemperatureNo significant impactCarbon Dioxide500 ppm or belowCarbon Dioxide has a strong impact
11Relative HumidityNo significant impactCarbon Dioxide700 ppm or belowCarbon Dioxide has a strong impact
12Volatile Organic CompoundNo significant impactCarbon Dioxide500 ppm or belowCarbon Dioxide has a strong impact
Publisher’s Note: MDPI stays neutral with regard to jurisdictional claims in published maps and institutional affiliations.

